Article

Multispectral Imaging Combined with Tree-Based Ensemble Classifiers for Non-Destructive Varietal Purity Assessment of KDML-105 Rice Seed


by
Khunnithi Doungpueng
1,
Jirasin Prueksawan
2,
Lalita Panduangnat
2,
Prasit Somjinda
3 and
Jetsada Posom
2,*
1
Department of Mechanical Technical Education, Faculty of Technical Education, Rajamangala University of Technology Isan Khon Kaen Campus, Khon Kaen 40000, Thailand
2
Department of Agricultural Engineering, Faculty of Engineering, Khon Kaen University, Khon Kaen 40000, Thailand
3
Khon Kaen Rice Research Center, Division of Rice Research and Development, Rice Department, Khon Kaen 40000, Thailand
*
Author to whom correspondence should be addressed.
AgriEngineering 2026, 8(8), 348; https://doi.org/10.3390/agriengineering8080348
Submission received: 11 June 2026 / Revised: 14 August 2026 / Accepted: 18 August 2026 / Published: 20 August 2026
(This article belongs to the Section Pre and Post-Harvest Engineering in Agriculture)

Abstract

Certified seed purity is a prerequisite for sustaining the agronomic performance and commercial value of Khao Dawk Mali 105 (KDML-105), Thailand’s premium aromatic rice; however, conventional inspection methods are destructive, labour-intensive, and poorly suited to high-throughput operations. This study developed a non-destructive purity inspection system integrating five-band MSI acquired using a MicaSense RedEdge-MX sensor with three machine learning classifiers: Extra Trees (ET), Random Forest (RF), and Support Vector Machine (SVM). The system was evaluated systematically across four illumination levels (360.90–13,188.46 lx) to discriminate KDML-105 from three morphologically similar contaminating varieties: Chainat-1, RD-6, and RD-15. Two-way ANOVA confirmed that classifier type was the dominant performance determinant (η2 = 0.847). Under optimal illumination (L4, 13,188.46 lx), ET achieved the highest accuracy (88.8%), recall (86.6%), and F1-score (88.4%) with a training time of 0.098 s. External validation confirmed model generalisability: KDML-105 seeds were identified with 90.6% accuracy and 95.6% recall, while Chainat-1 and RD-6 yielded accuracies of 85.1% and 90.6%, respectively; RD-15 remained challenging (62.9%; 67.4%) owing to spectral proximity to KDML-105. These findings establish MSI combined with ET classification as a viable, cost-effective approach for automated seed purity screening in certified rice production.

1. Introduction

Rice (Oryza sativa L.) is one of the most important staple crops worldwide, serving as the primary source of carbohydrates for more than half of the global population [1,2]. Thailand is among the world’s leading rice exporters, with a total export volume of approximately 9.95 million tons in 2024, valued at around 225.7 billion baht (≈6.69 billion USD) [3]. The Khao Dawk Mali 105 (KDML-105) variety is recognized globally as a premium-quality aromatic rice, distinguished by its soft texture, delicate flavor, and characteristic pandan-like aroma [4,5]. Owing to its exceptional cooking quality and unique sensory properties, KDML-105 commands a high market value and plays a critical role in maintaining Thailand’s global reputation as a top rice exporter [3,6].
At the farm level, rice admixture can occur when a different rice variety was grown in the previous crop season and some grains had fallen to the ground. Beyond export implications, varietal contamination also threatens domestic food security, as KDML-105 production underpins smallholder livelihoods and constitutes a principal source of stable rice supply across Thailand’s northeastern region. When the next crop is planted, these leftover grains germinate alongside the Khao Dawk Mali 105 rice field. If such mixed grains are subsequently used as planting seed, the degree of varietal contamination escalates progressively across successive cropping seasons [6,7,8,9,10]. Sorting or identifying pure rice varieties becomes very difficult, particularly when the contaminating varieties have physical characteristics similar to KDML-105. This contamination challenge is inherent to Thailand’s smallholder rice farming system, in which sequential mono-cropping of multiple varieties on the same plots across consecutive seasons creates conditions for progressive inter-varietal admixture that compounds across growing cycles. In particular, the Chainat-1 is hard to distinguish and requires chemical analysis and expert examination to verify [11,12,13,14,15,16]. At present, purity verification of KDML-105 largely relies on expert visual inspection, which is time-consuming, labor-intensive, and prone to human error especially since certain rice varieties exhibit very similar morphological features that make manual differentiation difficult [17,18].
Existing approaches to rice varietal authentication span a broad methodological spectrum, from physical morphometry and aroma profiling to chemical composition analysis and molecular techniques such as DNA barcoding [19,20,21]. While these methods generally achieve high discriminative accuracy, most involve destructive sample preparation, bench-scale instrumentation, or domain-specific chemometric expertise that collectively constrain their scalability for routine, high-throughput purity screening [21,22]. Among non-destructive alternatives, optical and spectroscopic platforms have gained increasing traction for seed and grain inspection; among these, multispectral imaging (MSI) occupies a particularly productive intersection between imaging and spectroscopy, capturing spatially resolved reflectance data across discrete wavelength bands simultaneously [17,23,24,25]. MSI data have been successfully applied to the classification of genetically modified seeds, tomato variety identification, detection of meat adulteration, and contaminant analysis in infant milk powder [26,27,28]. When coupled with classical machine learning—including Partial Least Squares (PLS), Least Squares Support Vector Machine (LS-SVM), and Backpropagation Neural Network (BPNN)—MSI-derived spectral features have demonstrated enhanced accuracy and robustness across a range of non-destructive quality evaluation tasks [29,30]. Beyond classical machine learning, end-to-end deep learning approaches have increasingly demonstrated competitive performance in seed and grain classification tasks. Convolutional neural networks (CNNs) applied directly to hyperspectral image cubes have been shown to extract hierarchical spatial–spectral representations that surpass hand-crafted feature approaches in discrimination tasks involving visually similar varieties [31,32]. More recently, single-stage object detection architectures from the YOLO family have been adapted for dense seed-grid classification, enabling simultaneous seed localisation and variety identification within a single inference pass [11]. Despite their strong performance, however, these approaches entail substantially higher computational requirements, larger annotated training datasets, and reduced model interpretability relative to classical ensemble methods—considerations that carry direct practical relevance in resource-constrained deployment environments such as community seed centers.
Notwithstanding these collective advances, the existing literature reveals several substantive limitations that the present study seeks to address. The predominant body of work on spectral-based rice variety discrimination has relied on hyperspectral imaging systems, which, although capable of capturing continuous spectral profiles across hundreds of narrow bands, impose considerable practical constraints: acquisition hardware typically costs USD 30,000–80,000, the resulting data volumes demand computationally intensive preprocessing pipelines, and the physical bulk of most systems renders them unsuitable for deployment in field conditions or rural seed centers [31,33]. Multispectral imaging occupies an intermediate position in this cost–capability continuum: the MicaSense RedEdge-MX platform employed in the present study carries an indicative list price of approximately USD 5500–11,100 and requires radiometric calibration expertise, constituting a meaningful capital investment relative to conventional visual grading but substantially below the acquisition threshold of full hyperspectral systems. The cost advantage of MSI over hyperspectral alternatives is therefore contextual rather than absolute; this work does not advance MSI as a universally low-cost solution, but rather evaluates it as a technically viable option for institutional seed centers requiring spectral discriminative capacity beyond the reach of standard RGB-based machine vision platforms. Notwithstanding this positioning, the application of MSI to seed purity inspection—particularly for Thai aromatic rice cultivars—has received comparatively little systematic investigation.
A second gap concerns the experimental design for classifier evaluation under controlled illumination conditions. While comparisons between tree-based ensemble classifiers and SVM have appeared in the seed and grain classification literature, no prior study has conducted a controlled, multi-level systematic evaluation of illumination intensity effects on MSI-based rice seed classification performance across multiple classifier types simultaneously—an analytical design that permits the disentanglement of classifier-type effects from illumination-induced variance, and that directly informs practical system deployment decisions. Given that lighting conditions are known to influence spectral signal quality, this represents a meaningful gap in the methodological literature. Perhaps most critically, no prior study appears to have evaluated the discriminability of Khao Dawk Mali 105 (KDML-105) from phenotypically and spectrally proximate Thai cultivars—Chainat-1, RD-6, and RD-15—using a multispectral imaging platform. This gap carries direct economic implications: varietal contamination of KDML-105 seed lots undermines both the quality assurance of certified seed distribution and Thailand’s position as a premium aromatic rice exporter in international markets.
Taken together, the foregoing gaps motivate the present study, whose contributions extend beyond the application of established methods to a new crop variety. Specifically, this work advances three distinct contributions to the field. First, it provides the first systematic characterisation of illumination intensity as an independent experimental variable in multispectral seed classification, demonstrating that spectral signal quality—and, by extension, model discrimination accuracy—is critically sensitive to incident lamp power within a controlled closed-chamber configuration. Second, it delivers a rigorous, condition-matched comparison between tree-based ensemble methods and a margin-based classifier, revealing consequential differences in precision–recall behaviour that carry direct practical implications for false-negative minimisation in certified seed purity inspection. Third, it constitutes the first documented evaluation of five-band multispectral imaging for discriminating KDML-105 from three spectrally and morphologically proximate Thai cultivars—Chainat-1, RD-6, and RD-15—whose economic significance to Thailand’s premium aromatic rice export sector provides a compelling and practically grounded applied context.
In pursuit of these contributions, the present study adopts three explicit objectives: (i) to develop and evaluate a non-destructive seed purity inspection system for KDML-105 rice by integrating five-band multispectral imaging with three machine learning classifiers—Random Forest (RF), Extra Trees (ET), and Support Vector Machine (SVM); (ii) to systematically assess the effect of illumination intensity on spectral feature quality and classification performance across four discrete illumination levels within a controlled imaging environment; and (iii) to evaluate the discriminability of KDML-105 from three morphologically similar contaminating cultivars—Chainat-1, RD-6, and RD-15—using an independent external validation dataset, thereby establishing practical performance benchmarks pertinent to community-level seed inspection deployment.

2. Materials and Methods

2.1. Data Acquisition

Four rice seed varieties were selected as experimental materials: Khao Dawk Mali 105 (KDML-105), RD-6, RD-15, and Chainat-1. A total of 1000 paddy seeds per variety were randomly collected from the Khon Kaen Rice Research Center, Khon Kaen Province, Thailand. Each variety was separately packed and labelled with a unique identification code prior to imaging preparation, in order to maintain traceability of seed position throughout the subsequent image acquisition, segmentation, and feature extraction stages.
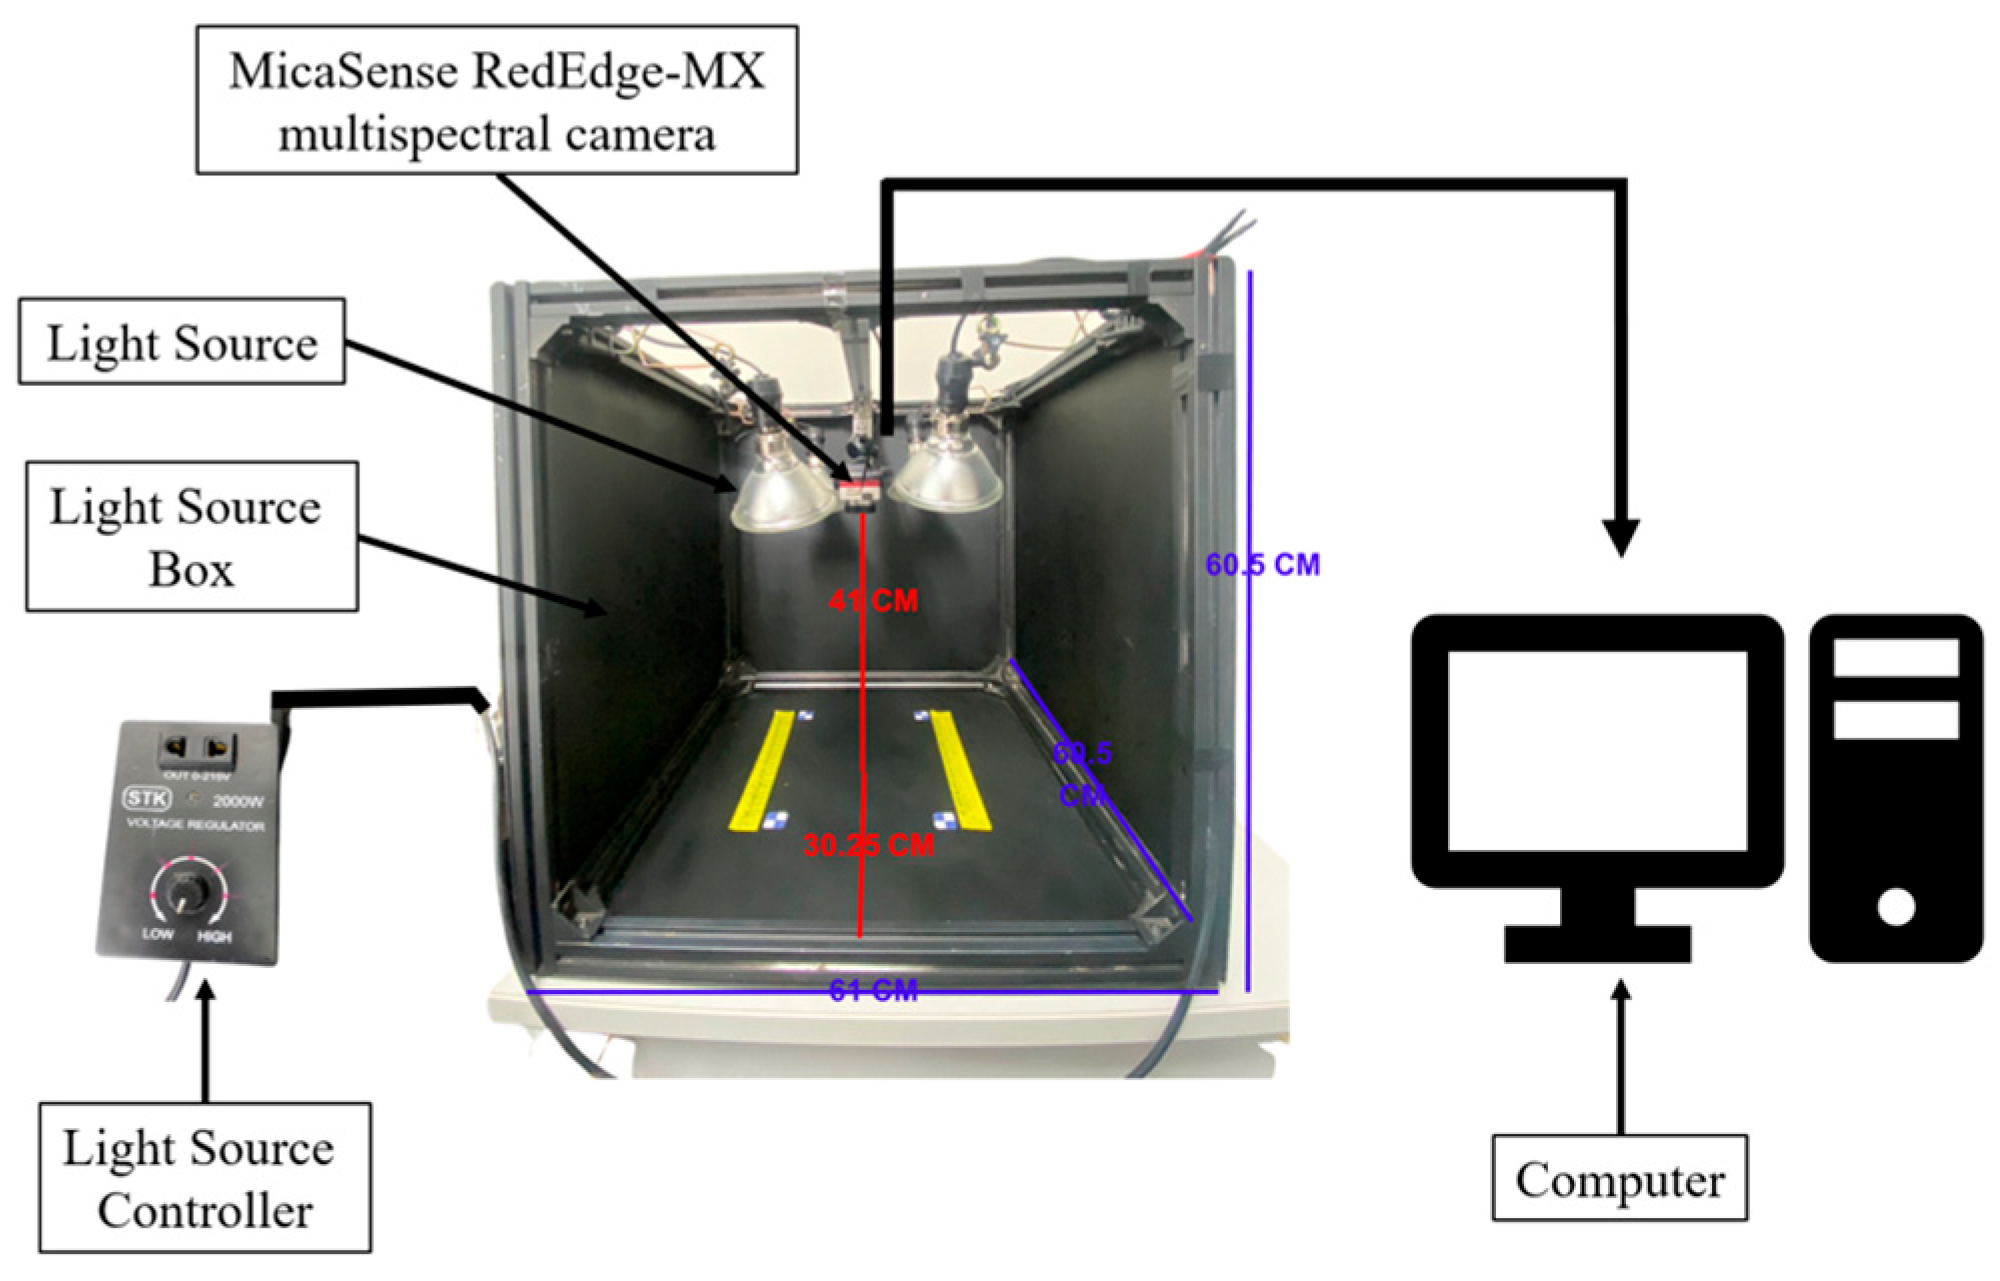
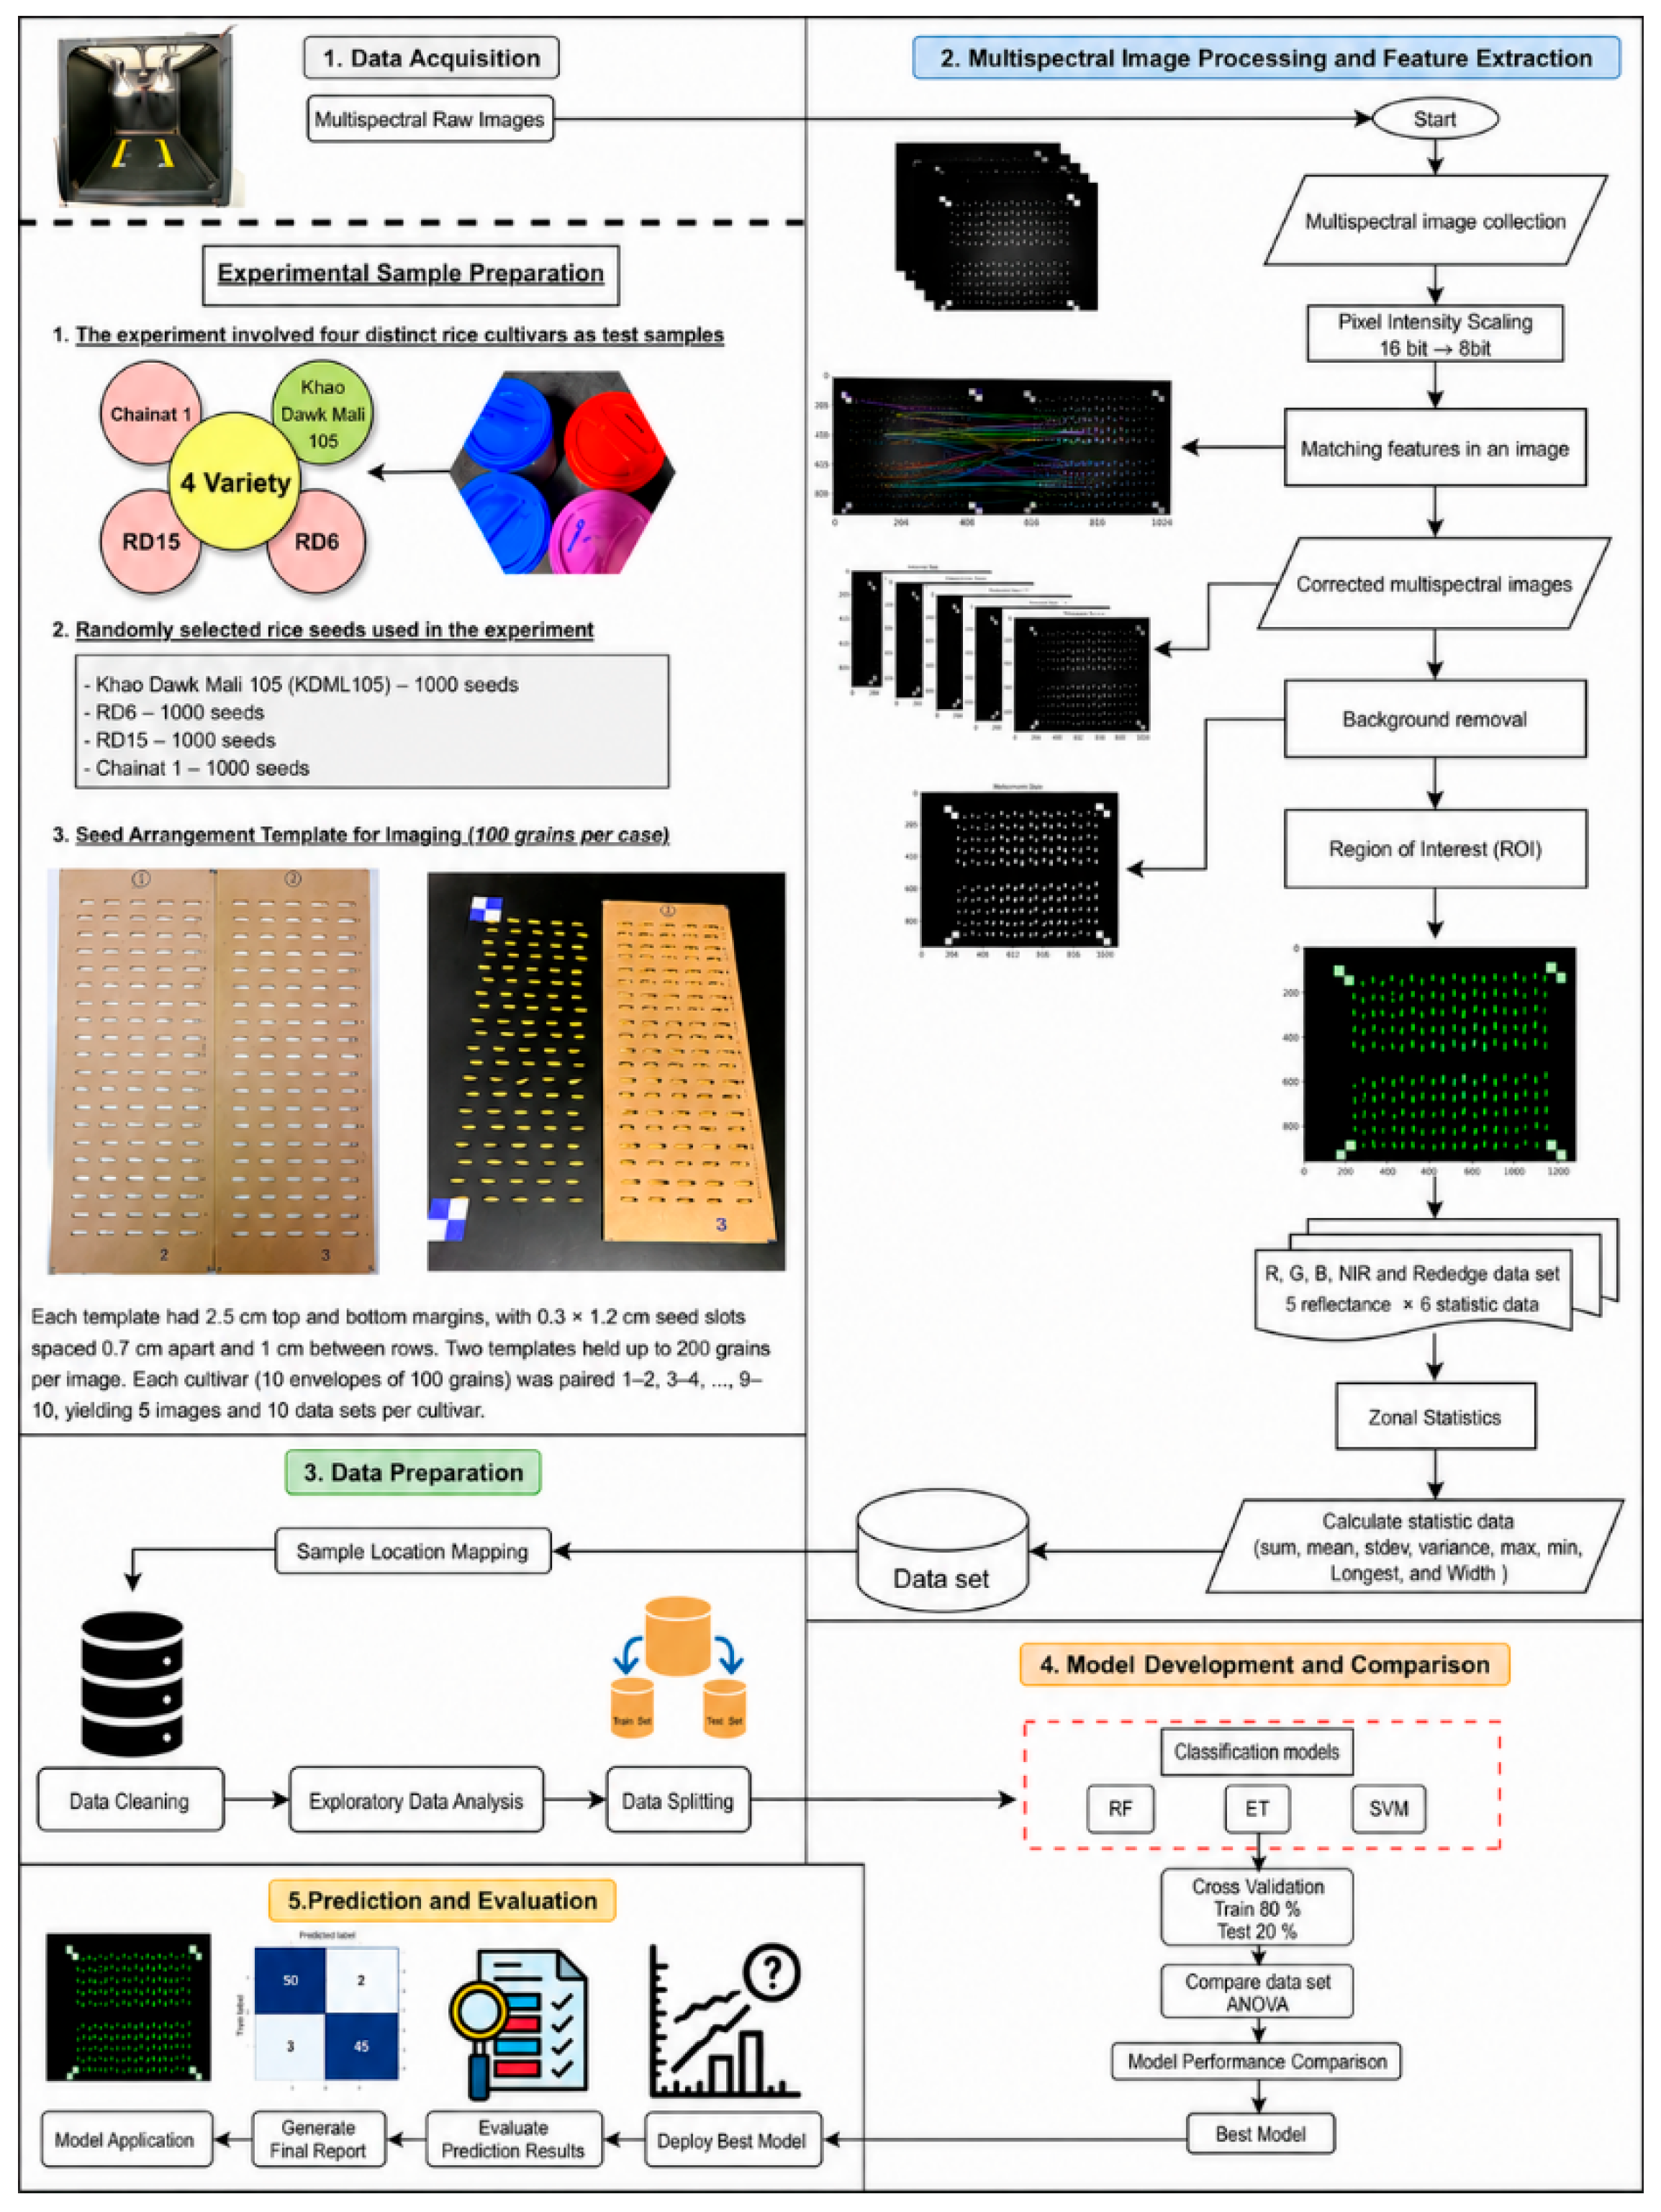
A custom-designed seed arrangement template was employed to organize the seeds for image acquisition. The template consisted of individual seed slots measuring 0.3 × 1.2 cm, with an inter-slot spacing of 0.7 cm and an inter-row spacing of 1.0 cm, along with top and bottom margins of 2.5 cm to facilitate image alignment. Each template could accommodate 100 seeds, and two templates were placed side-by-side during image capture, enabling the acquisition of up to 200 seeds per image. For systematic traceability, each seed variety was divided into 10 subsets, each containing 100 seeds, forming a total of 10 image datasets per variety. The paired templates were arranged in sequential combinations (1–2, 3–4, …, 9–10) to maintain the positional reference of each seed throughout the subsequent image processing and feature extraction procedures. Image acquisition was conducted using a MicaSense RedEdge-MX multispectral camera(MicaSense, Inc., Seattle, WA, USA), which supports five discrete spectral bands: Red (668 nm), Green (560 nm), Blue (475 nm), Near-Infrared (840 nm), and Red-edge (717 nm). Raw 16-bit imagery was captured under a controlled illumination environment inside a closed imaging chamber to minimise ambient light interference and suppress extraneous spectral noise (Figure 1). Illumination was provided by four 120 W GataPAR-38 halogen lamps (Teera-Mongkol Industry Public Company Limited (TMI), Samut Sakhon, Thailand) mounted at the frame corners and positioned approximately 40 cm above the base. Four discrete illumination levels were configured by adjusting lamp power output: L1, L2, L3, and L4 producing measured irradiance values at the sample surface of 360.90, 2408.71, 6760.82 and 13,188.46 lx, respectively, as recorded by a calibrated irradiance meter (TR-74Ui, T&D Corporation, Matsumoto, Nagano, Japan). Spatial uniformity of illumination across the imaging area was verified prior to data collection by positioning the irradiance meter at five measurement points within the sample plane—one at the geometric centre and one at each corner of the template boundary. The coefficient of variation (CV) of irradiance across these five points did not exceed 5% at any illumination level, confirming acceptable spatial homogeneity. Temporal stability was assessed by acquiring repeated irradiance measurements at 2 min intervals over a 10 min warm-up period; steady-state illumination was reached within 7 min for all lamp settings, and all image acquisition sessions commenced only after this stabilisation criterion had been satisfied. Camera exposure parameters were held constant across all illumination levels—shutter speed: 2 ms—to isolate the effect of illumination intensity on spectral feature quality and to ensure cross-level comparability of extracted reflectance values. The imaging setup was standardised with respect to camera-to-sample distance (40 cm), lens aperture, and white balance settings across all acquisition sessions, thereby ensuring the reproducibility of spectral measurements and the validity of cross-level performance comparisons (Figure 2, Step 1).

2.2. Multispectral Image Processing and Feature Extraction

Prior to any feature extraction, radiometric calibration was performed at each illumination level using the MicaSense Calibrated Reflectance Panel (CRP; MicaSense, Inc., Seattle, WA, USA) supplied with the RedEdge-MX sensor (MicaSense, Inc., Seattle, WA, USA). Immediately before each imaging session, the CRP was positioned at the sample plane and imaged under the prevailing illumination conditions. Per-band reflectance values were then computed for each seed ROI according to the standard MicaSense calibration formula: Reflectance(band i) = Raw_DN(seed, band i) ÷ Raw_DN(CRP, band i) × Known_reflectance(CRP, band i). This conversion was implemented in Python following the MicaSense imageutils protocol, yielding reflectance values in the range [0, 1] per band. Because calibration was applied independently at each illumination level (L1–L4), the resulting reflectance data are normalised relative to the prevailing illumination conditions, mitigating illumination-induced confounding of spectral features. The multispectral images acquired from the data collection stage were processed sequentially to extract reliable features suitable for subsequent classification analysis. The calibrated reflectance images were subsequently scaled from 16-bit to 8-bit representation to standardise pixel intensity ranges for downstream processing. Subsequently, geometric misalignment among spectral bands was corrected using feature point matching and geometric transformation to achieve accurate pixel-level registration across all spectral channels. After registration, background removal was performed to isolate individual rice seeds from the substrate and suppress spectrally irrelevant signal contributions. This was accomplished through a two-stage segmentation procedure. In the first stage, Otsu’s adaptive thresholding algorithm was applied to the NIR band image—selected for its characteristically high contrast between seed tissue and background surface—to generate an initial binary mask delineating seed regions. In instances where spatial illumination gradients produced spectral variation that compromised the integrity of threshold-based separation, a secondary HSV colour-space segmentation was applied to the RGB composite image to refine mask boundaries in affected regions. The final binary mask for each image was derived by combining both outputs through a logical OR operation, followed by morphological closing with a 5 × 5 pixel structuring element to fill internal voids and consolidate seed contours.
The resulting binary masks were used to define Regions of Interest (ROIs) corresponding to individual rice seeds. Each ROI was identified using a connected component labelling algorithm, enabling independent analysis of each seed sample. For every identified ROI, spectral features were extracted from the five spectral bands (Red, Green, Blue, Near-Infrared, and Red-edge) using first-order zonal statistics, including mean, standard deviation, variance, maximum, minimum and sum values per band, yielding 30 spectral features per seed. These parameters quantitatively represented the spectral reflectance characteristics of individual seeds at the ROI level and were selected on the basis of their computational efficiency, low-dimensional representational capacity, and demonstrated utility in seed-level spectral classification tasks employing multispectral imaging systems [24,26]. The two image-derived geometric descriptors (Longest and Width) were included as auxiliary descriptors to support seed detection and quality screening; they are not intended as primary discriminative variables, and their relative contribution to classification is evaluated empirically through feature importance analysis in Section 3.2.4. Additionally, three morphological dimensions (seed length, seed width, and seed thickness) were measured directly using a digital vernier calliper (resolution: 0.01 mm) on a randomly selected subsample of 200 seeds per variety prior to image acquisition. Seed length was defined as the maximum dimension along the longitudinal axis of the seed; seed width as the maximum transverse dimension perpendicular to the length; and seed thickness as the maximum cross-sectional dimension perpendicular to both the length and width axes. The measured values are reported in Table 1. Individual thickness measurements were recorded as the maximum cross-sectional dimension perpendicular to the seed’s major axis and were subsequently matched to their corresponding ROI records via the positional indexing system described in Section 2.1. The 30 spectral features, two image-derived geometric descriptors, and one calliper-measured thickness value collectively yielded a 32-dimensional feature vector per seed. The authors acknowledge that higher-order texture descriptors, such as Grey-Level Co-occurrence Matrix (GLCM) features and band-ratio spectral indices represent natural extensions of the current feature set that may improve discriminative capacity, particularly for spectrally proximate varieties such as RD-15; the systematic evaluation of such representations is identified as a priority for future investigation. All extracted features were stored as a single feature vector per seed, forming a structured dataset for subsequent data preparation and model development (Figure 2, Step 2).

2.3. Data Preparation

The extracted feature data obtained from the image processing stage were carefully prepared prior to model development. The process began with sample location mapping, which involved verifying the positional correspondence and consistency between each seed sample and its respective variety code. This step ensured accurate sample referencing and eliminated potential index mismatches between image-based and metadata records. Subsequently, data cleaning was performed to remove incomplete or unreliable records, such as seeds with imperfect segmentation or abnormal feature values (outliers) caused by image noise, reflections, or misaligned seed positioning during acquisition. The cleaning procedure improved the reliability and uniformity of the dataset by minimizing artifacts that could distort the classification model’s performance. Afterward, an exploratory data analysis (EDA) was conducted to evaluate the distribution of spectral and morphological variables across seed varieties. This included assessing the trends, inter-variable correlations, and preliminary differences among rice seed classes. The insights gained from EDA provided an understanding of the underlying feature space structure, which supported the selection of relevant features and appropriate classification algorithms for subsequent modeling. Once the dataset was refined, it was partitioned into two subsets: a training set (80%) and a test set (20%). The split was performed using stratified sampling, maintaining proportional representation of each rice variety to prevent model bias and ensure balanced learning. The resulting dataset served as the foundation for the training and evaluation of machine learning models in the subsequent stage (Figure 2, Step 3).

2.4. Model Development and Evaluation

The classification models were developed using three machine learning algorithms: Random Forest (RF), Extra Trees (ET), and Support Vector Machine (SVM) to identify and classify rice seed varieties based on the extracted spectral and morphological features. The selection of these algorithms was guided by three interrelated considerations. First, RF and ET are tree-based ensemble methods that share a common architectural foundation but differ substantively in their feature randomisation strategy: whereas RF selects the optimal split from a random subset of features at each node, ET randomises both feature selection and split thresholds, a distinction with direct relevance to high-dimensional spectral feature spaces where inter-feature correlation is prevalent. Comparing these two architecturally related but behaviourally distinct algorithms permits the isolation of the effect of split randomisation on classification performance—an analysis that would not be possible if only one ensemble method were included. Second, SVM represents a well-characterised margin-based classifier whose linear decision boundary and sensitivity to class overlap differ fundamentally from ensemble voting mechanisms, thereby providing a theoretically informative contrast—particularly regarding the capacity of a linear separator, relative to non-linear tree-based partitioning, to resolve spectrally overlapping varieties. Third, all three algorithms are computationally tractable on standard central processing unit (CPU) hardware without requiring graphics processing unit (GPU) acceleration, a practical prerequisite for deployment in resource-constrained institutional seed inspection environments. The authors acknowledge that gradient-boosted methods—including XGBoost and LightGBM—and lightweight convolutional neural network architectures represent competitive alternatives that were not evaluated in this study; their systematic comparison against the classifiers employed herein is identified as a defined priority for future research.
The present study deliberately adopts classical machine learning algorithms rather than end-to-end deep learning architectures, for three interrelated reasons. First, the 32-dimensional feature vector employed in this study is of a dimensionality well-suited to classical ensemble and kernel-based classifiers; deep learning architectures—particularly convolutional neural networks—typically require substantially higher-dimensional input representations and considerably larger annotated training corpora to realise their representational advantages over hand-crafted feature approaches. Second, the total training dataset of approximately 3200 seeds—comprising 80% of the 4000-seed corpus following stratified partitioning—falls below the sample sizes generally recommended for training convolutional networks from randomised weight initialisation without the application of transfer learning from pre-trained models. Third, tree-based ensemble classifiers afford native feature importance estimation through mean decrease in impurity, enabling the interpretable attribution of classification decisions to specific spectral bands and morphological descriptors—an analytical capability of direct scientific value in elucidating the spectral mechanisms underlying inter-variety discrimination. The comparative evaluation of gradient-boosted methods and deep learning architectures on expanded, multi-season datasets is identified as a primary direction for future research, as elaborated in Section 4.
Having established the rationale for algorithm selection, the following paragraphs describe the dataset partitioning, model fitting procedure, and model evaluation procedures applied uniformly across all three classifiers (summarised in Algorithm 1). The prepared dataset was divided into training (80%) and testing (20%) subsets, as described in Section 2.3. To ensure model robustness and prevent overfitting, five-fold stratified cross-validation (k = 5) was employed during the training process (see Supplementary Table S3 for the complete experiment setup configuration), wherein the training dataset was partitioned into five mutually exclusive, class-stratified subsets of approximately equal size; in each iteration, four subsets were used for model fitting and the remaining subset was retained for internal validation, allowing consistent and reliable model performance evaluation across different data partitions. All three classifiers were implemented using their default scikit-learn (version >1.4.0) configurations via the PyCaret (version 3.3.0) machine learning framework [34], without exhaustive hyperparameter search, in order to provide a consistent baseline comparison across classifier architectures. The Random Forest and Extra Trees models were instantiated as RandomForestClassifier and ExtraTreesClassifier, respectively, retaining default settings (100 estimators, unconstrained maximum depth, Gini impurity criterion). The SVM model corresponds to PyCaret’s linear-kernel implementation (SGDClassifier with hinge loss, approximating a linear support vector classifier), retaining default regularisation settings (α = 0.0001). A fixed random seed (session_id = 3934) was used for all classifiers to ensure reproducibility. Complete parameter configurations for all three classifiers are provided in Supplementary Table S4. After model training, the optimal models were evaluated on the independent test dataset using accuracy, sensitivity (recall), precision, F1-score, and the confusion matrix. A two-way ANOVA was conducted to evaluate the main effects of classifier type, illumination level, and their interaction on each performance metric, treating each of the five cross-validation folds as an independent replicate (n = 5 per model–level cell). Bonferroni-corrected pairwise comparisons of estimated marginal means were used as the primary inferential test for statistically significant differences at α = 0.05 (Table 3), while Tukey’s HSD homogeneous subset test, computed from the same error term, was additionally applied to group classifiers exhibiting statistically indistinguishable performance, supporting the descriptive interpretation reported in Section 3.2.1. Full ANOVA and post hoc statistics for all four metrics are provided in Supplementary Tables S1 and S2. The model yielding the highest and most stable performance across all evaluation metrics was selected as the primary classification model for subsequent external validation (Figure 2, Step 4).
Algorithm 1: MSI-Based Rice Seed Purity Classification Pipeline
Input:  Raw 16-bit multispectral images (5 bands),
        CRP reference images,
        Seed arrangement templates
Output: Variety classification labels per seed ROI

Stage 1—Image Acquisition
  For each illumination level L ∈ {L1, L2, L3, L4}:
    Capture CRP image under illumination L
    Capture seed arrangement images under illumination L

Stage 2—Radiometric Calibration and Feature Extraction
  For each band b ∈ {Blue, Green, Red, Red-edge, NIR}:
    Compute: Reflectance(seed, b) =
      Raw_DN(seed, b) ÷ Raw_DN(CRP, b) × Known_reflectance(CRP, b)
    Scale calibrated reflectance image from 16-bit to 8-bit
    Apply feature alignment across bands (feature point matching)
    Remove background; identify ROIs via connected component labelling
    Extract 6 zonal statistics per band
      (mean, SD, variance, maximum, minimum, sum) → 30 spectral features
    Extract 2 geometric features (Longest, Width) → 32 features total per seed

Stage 3—Data Preparation
  Verify sample location mapping
  Remove outliers and incomplete ROIs
  Apply stratified 80/20 train–test split

Stage 4—Model Development and Selection
  For each classifier M ∈ {ET, RF, SVM}:
    Fit M using default scikit-learn configuration via PyCaret
    create_model() (random_state = 3934, fixed across all classifiers)
    Evaluate via 5-fold stratified cross-validation
    Train M on training set; evaluate on held-out test set
    Record: accuracy, recall, precision, F1, AUC, Kappa, MCC, training time
  Apply two-way ANOVA; Bonferroni post hoc correction (primary p-values) and
  Tukey’s HSD (homogeneous subset grouping)
  Select optimal M and illumination level L combination

Stage 5—External Validation
  Apply selected model to 5 independent external subsets per variety
    (n = 200 seeds per subset)
  Report: coverage, accuracy, rejection rate, and recall per variety
All image processing and feature extraction procedures were implemented in Python (version 3.10; Python Software Foundation, Wilmington, DE, USA) using the OpenCV (version 4.8.0) and scikit-image (version 0.21.0) libraries. Machine learning model development and statistical analyses were performed using the PyCaret library (version 3.3.0) [34], built on scikit-learn (version compatible with PyCaret 3.3.0, >1.4.0). Classification models were trained using default scikit-learn estimator configurations for each classifier, as detailed above and in Supplementary Table S4. Statistical analyses described above were implemented via the SciPy library (version 1.11.0).

2.5. Prediction and Evaluation

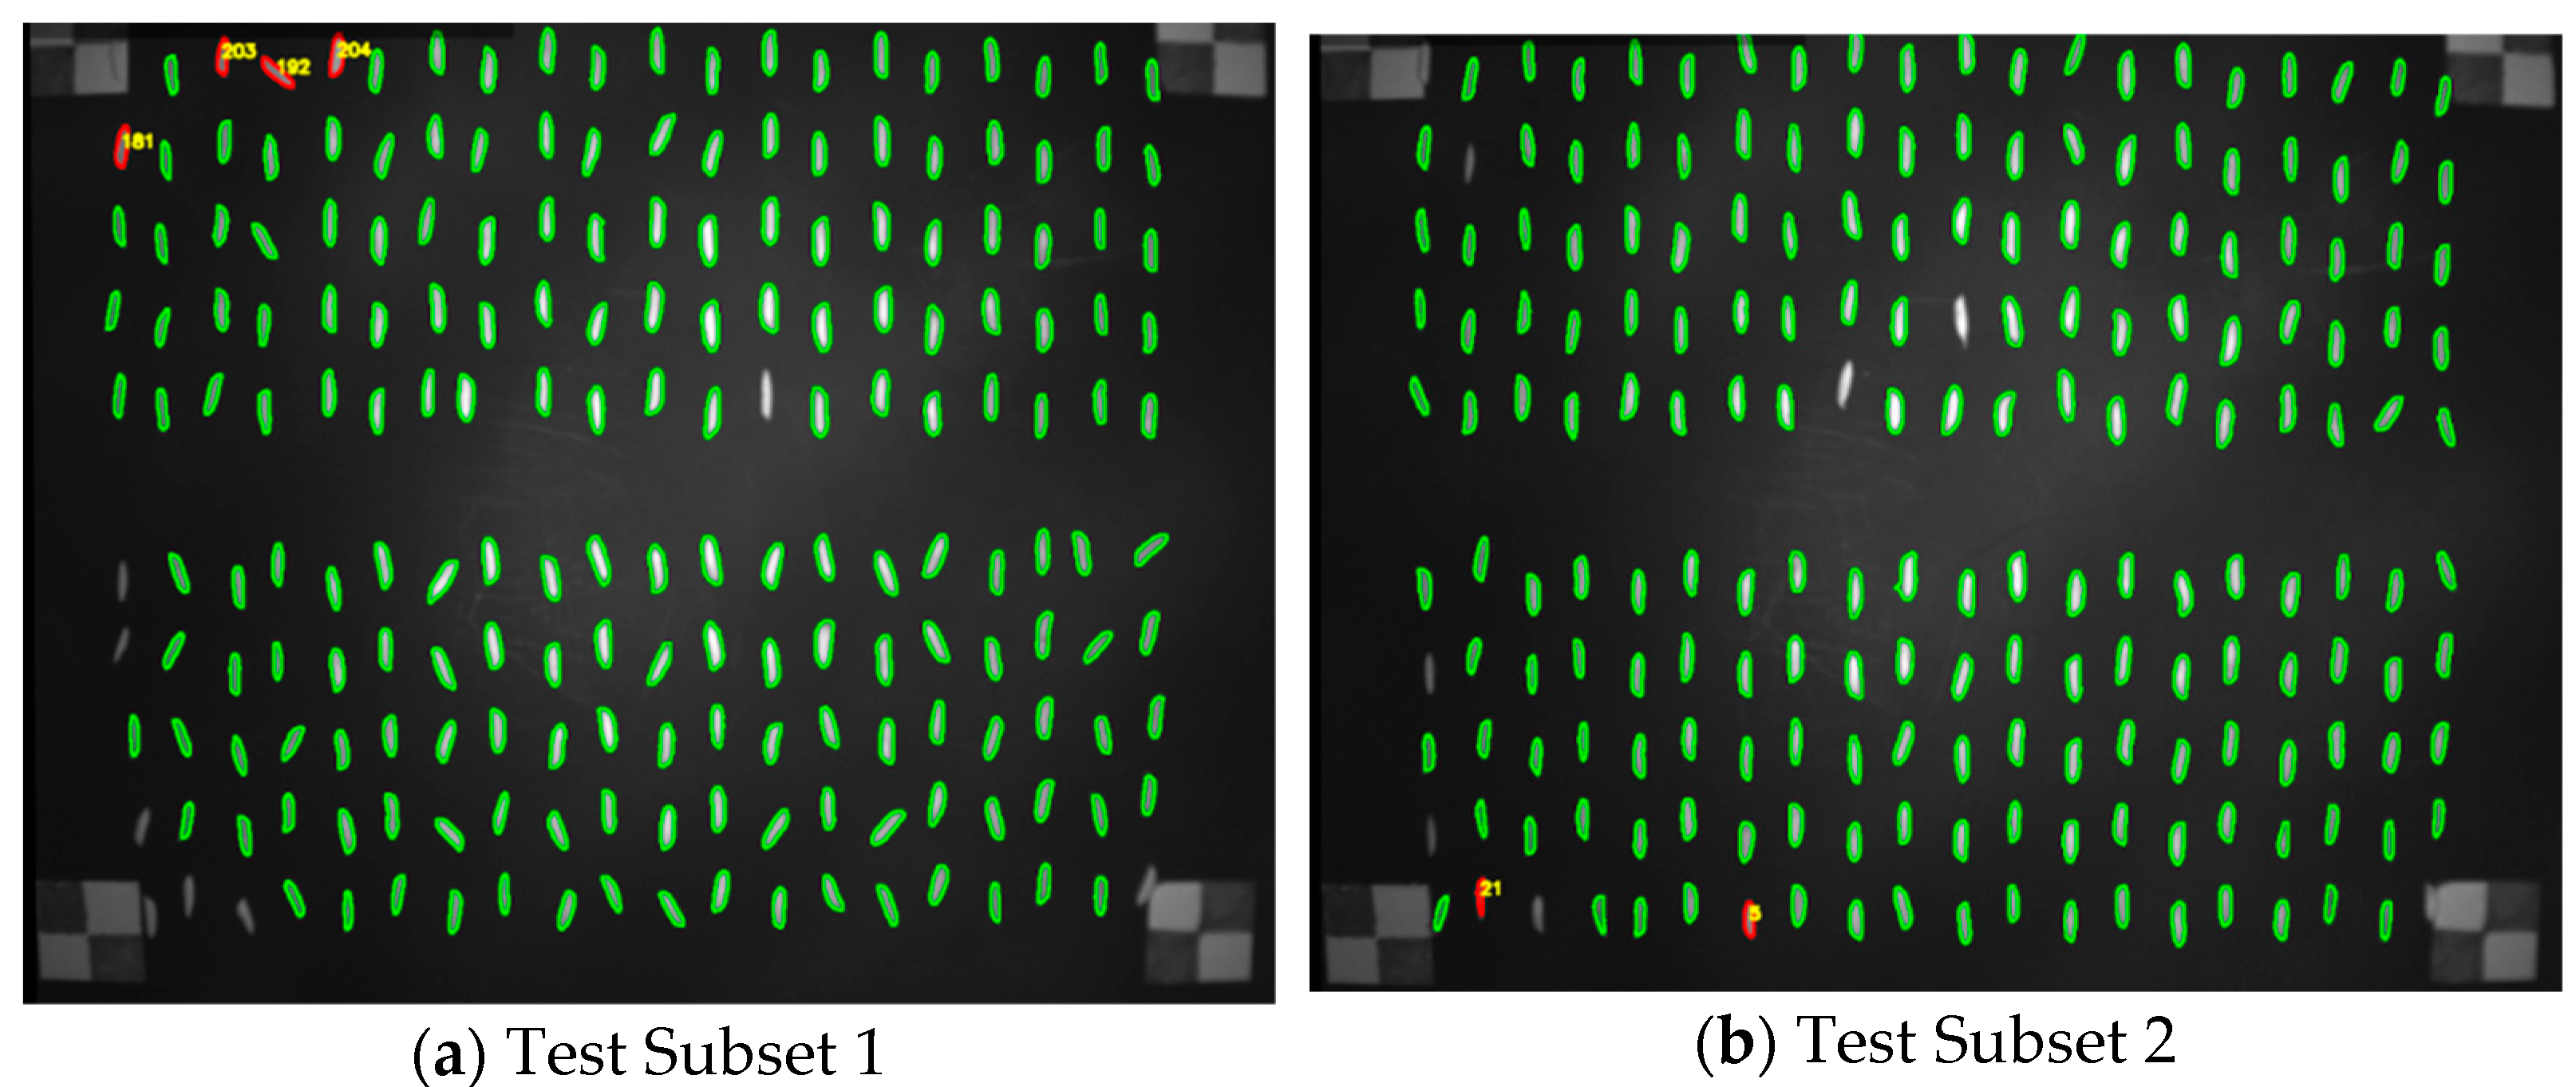
The Extra Trees classifier, identified as the optimal model based on cross-validation performance at illumination level L4 (13,188.46 lx), was further evaluated using an independent test dataset comprising 1000 seeds per variety (200 seeds per subset × 5 subsets) that had not been used during training, in order to assess its classification capability under conditions closely resembling real-world application scenarios. The classification performance was evaluated using six statistical metrics: accuracy, recall (sensitivity), precision, F1-score, area under the ROC curve (AUC), and Cohen’s kappa coefficient. The accuracy metric was first computed to quantify the proportion of correctly classified seeds in the test dataset. Although the original sampling design collected 1000 seeds per variety—yielding a nominally balanced four-class dataset prior to preprocessing—the data cleaning procedure described in Section 2.3 removed seeds with imperfect segmentation or outlier feature values at differing rates across varieties, introducing minor but non-negligible class-size disparities in the finalised dataset. To ensure that aggregate performance metrics were not biased toward classes with larger post-cleaning sample counts, macro-averaged accuracy was adopted as the primary evaluation criterion, computing the unweighted mean of per-class accuracy values and thereby according equal weight to each variety irrespective of its final sample size. Additionally, a confusion matrix was generated to illustrate the distribution of classification errors among rice varieties (KDML-105, Chainat-1, RD-6, and RD-15; 200 seeds per subset per variety), enabling the identification of specific classes that were most frequently misclassified. This visualisation provided insight into the degree of spectral and morphological overlap within the feature space, which may affect the classifier’s discriminative performance. Furthermore, the sensitivity (recall) and specificity were calculated to evaluate the model’s ability to correctly identify target classes and distinguish them from non-target classes. All evaluation results were summarised and presented through numerical and visual reports, providing a transparent interpretation of model performance. In addition, predicted classification outputs were visually overlaid on the original multispectral seed images to confirm the accuracy of seed-level positional classification.
Operationally, unclassified seeds represent instances in which prediction confidence was insufficient to support a reliable class assignment; such seeds are withheld from the classification output and flagged for manual re-examination rather than being committed to a potentially erroneous class label. This conservative classification strategy reflects the asymmetric cost structure inherent to seed purity inspection: the consequence of a false negative—an adulterated seed incorrectly passed as KDML-105 and subsequently distributed through certified channels—is substantially more detrimental than the operational cost of withholding an ambiguous seed for confirmatory analysis. The proportion of seeds meeting this withholding criterion is reported as the Rejection Rate in Tables 3–6 and constitutes a complementary indicator of model confidence alongside accuracy and recall.
The model achieving the highest overall performance across accuracy, sensitivity, specificity, and visual validation criteria was designated as the final classification model for operational implementation (Figure 2, Step 5).

3. Results and Discussion

3.1. Morphological Characteristics Analysis

As summarised in Table 1, morphological analysis of the four rice seed varieties (KDML-105, RD-15, Chainat-1, and RD-6) revealed measurable but substantially overlapping dimensional characteristics across all three measured parameters—seed width, length, and thickness (Table 1). The average seed width ranged narrowly between 2.27 and 2.40 mm, with RD-6 exhibiting the greatest value and RD-15 the smallest; given the associated standard deviations of 0.16–0.23 mm, the resulting confidence intervals overlap extensively across all four varieties. Seed length exhibited greater inter-variety variation: RD-15 recorded the highest mean length (10.46 ± 0.46 mm) among the four varieties examined, a finding that likely reflects the particular grain elongation characteristics of this cultivar, followed by Chainat-1 (10.41 ± 0.55 mm), KDML-105 (10.06 ± 0.48 mm), and RD-6 (9.56 ± 0.42 mm). Seed thickness values were considerably smaller in magnitude, ranging from 1.58 ± 0.23 mm (KDML-105) to 2.01 ± 0.14 mm (RD-15), and likewise exhibited confidence interval overlap across all varieties. Collectively, these dimensional measurements confirm that while inter-variety differences in seed geometry are statistically detectable, their practical utility for visual discrimination is severely constrained by the degree of intra- and inter-variety overlap—particularly in width and thickness—across the four cultivars examined.
Beyond dimensional characteristics, the four varieties exhibited discernible differences in surface coloration under visible-spectrum illumination. KDML-105 seeds displayed a translucent ivory appearance with a characteristic elongated profile, a visual quality attributable to their low amylose content and fine endosperm structure [4]. Chainat-1 seeds presented a slightly more opaque, cream-coloured surface consistent with a higher amylose fraction. RD-6 seeds were visually distinguishable by their comparatively shorter and broader morphology accompanied by a pale yellow surface tinge, while RD-15 seeds—as a glutinous variety—exhibited a chalky, opaque white endosperm under visible light, reflecting their waxy starch composition [5]. With respect to seed mass, mean single-seed weights were 22 ± 4 mg, 27 ± 2 mg, 25 ± 1 mg and 24 ± 2 mg for KDML-105, Chainat-1, RD-6, and RD-15, respectively, determined gravimetrically using an analytical balance (resolution: 0.001 mg) on a subsample of 200 seeds per variety. Notwithstanding these observable differences, colour and mass characteristics are susceptible to confounding by intra-variety variation, post-harvest moisture content, and illumination-dependent perceptual bias—limitations that collectively motivate the adoption of quantitative multispectral imaging as a more reliable and reproducible discriminative framework.
These morphological, chromatic, and gravimetric observations collectively confirm that unaided sensory evaluation is insufficient for reliable inter-variety discrimination at the throughput and consistency required by certified seed inspection operations. Human visual assessment is known to be susceptible to systematic observer bias and high inter-evaluator variability when applied to morphologically similar seed lots, as the perceptual integration of multidimensional physical features—length, width, thickness, and surface colour—cannot be achieved with the precision and reproducibility of statistical or machine learning classifiers [17,18,35]. A combination of multispectral imaging and multivariate ensemble classification is therefore essential to achieve the accuracy, repeatability, and operational robustness required for practical deployment in real-world seed purity inspection systems.

3.2. Model Performance, Computational Efficiency, and Spectral Feature Importance Under Varying Illumination Conditions

3.2.1. Two-Way ANOVA Results and Classifier Performance Comparison

A two-way analysis of variance (ANOVA) was conducted to evaluate the main effects of classifier type (Extra Trees [ET], Random Forest [RF], and Support Vector Machine [SVM]), illumination level (L1–L4), and their interaction (Model × Level) on four performance metrics: accuracy, recall, precision, and F1-score. Each experimental cell comprised 60 observations. These metrics are internationally recognised as standard criteria for evaluating machine learning classification systems [36]. Summary ANOVA results are presented in Table 2, and mean performance values disaggregated by classifier and illumination level are provided in Table 3.
The ANOVA results (Table 2) revealed that classifier type exerted a statistically significant main effect on accuracy (F(2, 48) = 133.09, p < 0.001, η2 = 0.847), precision (F(2, 48) = 15.82, p < 0.001, η2 = 0.397), and F1-score (F(2, 48) = 33.22, p < 0.001, η2 = 0.581). The effect on recall did not reach statistical significance (F(2, 48) = 2.693, p = 0.078, η2 = 0.101). The exceptionally large effect size for accuracy (η2 = 0.847) indicates that algorithm selection is the dominant determinant of classification system performance.
Bonferroni-corrected pairwise comparisons confirmed that both ET, which employs fully randomised feature selection and split-threshold determination [37], and RF, which aggregates multiple decision trees trained on bootstrapped subsamples [38], achieved significantly higher performance than SVM [39] across all metrics attaining significance (p < 0.001 in all cases; Table 3). ET and RF did not differ significantly from one another (p > 0.05). Consistent with this result, Tukey’s HSD homogeneous subset analysis—computed from the same error term as the Bonferroni comparisons (Supplementary Tables S1 and S2)—grouped ET and RF into a common performance subset and SVM into a distinctly separate subset across all metrics except recall, consistent with prior evidence that ensemble learning methods outperform SVM in complex classification tasks [40].

3.2.2. Effect of Illumination Level and Model–Level Interaction

Illumination level exerted a statistically significant main effect exclusively on accuracy (F(3, 48) = 4.073, p = 0.012, η2 = 0.203), as shown in Table 2. Post hoc pairwise comparisons identified a significant difference between L3 and L1 (p = 0.013), while all other illumination-level pairs did not differ significantly. No significant illumination effects were observed for recall, precision, or F1-score (p > 0.05 in all cases), indicating that variation in lamp power within the range studied exerts limited influence on overall system performance beyond its effect on classification accuracy.
The Model × Level interaction term reached statistical significance for both accuracy (F(6, 48) = 3.594, p = 0.005, η2 = 0.310) and F1-score (F(6, 48) = 3.130, p = 0.011, η2 = 0.281), as reported in Table 2. Simple effects analysis revealed that this interaction was driven predominantly by the unstable behaviour of SVM across illumination conditions: SVM attained its highest recall at L3 (M = 0.903) but declined sharply at L4 (M = 0.479), with markedly elevated standard deviations across multiple conditions (SD = 0.314–0.386; Table 3).
This pattern reflects fundamental limitations in the generalisability and stability of the linear-kernel SVM (implemented via stochastic gradient descent) under increasing task complexity, consistent with the reduced capacity of a linear decision boundary to resolve non-linearly separable spectral distributions among varieties of high morphological similarity; the absence of feature normalisation in the present pipeline may further have amplified this instability, given the known sensitivity of gradient-based linear classifiers to unscaled input features. By contrast, ET and RF demonstrated consistently progressive performance improvements across all illumination levels, attributable to the variance-reducing mechanisms inherent in bootstrap aggregating and stochastic feature selection [37,38].

3.2.3. Computational Efficiency and Model Selection

Beyond predictive accuracy, computational efficiency is a critical criterion for classifier selection in real-time agricultural inspection applications. As summarised in Table 4, ET achieved a training time of 0.098 s—approximately 35% shorter than RF (0.150 s)—while maintaining superior performance across all evaluation metrics. This computational advantage is a direct consequence of ET’s algorithmic design: by eliminating the exhaustive search for optimal split points and substituting fully randomised threshold selection, the algorithm substantially reduces the computational burden incurred during ensemble construction [37]. Although SVM recorded the shortest training time among the classifiers evaluated (0.028 s), its substantially inferior predictive performance—reflected in an AUC of 0.000 and an F1-score of 0.460—renders it unsuitable for operational deployment regardless of its computational speed.
Integrating the statistical, performance, stability, and computational evidence, the ET classifier at illumination level L4 (13,188.46 lx) demonstrated the strongest and most consistent overall performance across all evaluated criteria; this finding is elaborated as a formal recommendation in the Conclusions section. This configuration achieved the highest simultaneous performance across all metrics: accuracy = 0.868, recall = 0.829, precision = 0.899, and F1-score = 0.863 (Table 3), accompanied by low standard deviations (SD = 0.009–0.024), indicating high reproducibility across repeated evaluations. Beyond accuracy, the ET model at L4 achieved an AUC of 0.945—indicating near-excellent multi-class discriminative ability—and a Kappa coefficient of 0.736, reflecting substantial agreement above chance classification [41]. These metrics, reported in full in Table 4 alongside MCC (0.738), collectively confirm that the ET model’s superiority is not an artefact of class imbalance or distributional confounding. Although ET and RF did not differ significantly at the aggregate level (p > 0.05), ET consistently yielded higher mean performance on every metric, making it the preferable choice from an applied engineering perspective. SVM is not recommended for operational use, given its significantly inferior performance and high variability across all tested conditions (Table 2 and Table 3).
Table 3. Estimated marginal means and standard deviations of classification performance metrics disaggregated by classifier type and illumination level (Mean ± SD).
ModelLevelIllumination (lx)AccuracyRecallPrecisionF1-Score
ETL1360.900.788 ± 0.0250.708 ± 0.0330.844 ± 0.0400.770 ± 0.028
L22408.710.832 ± 0.0230.750 ± 0.0420.897 ± 0.0210.817 ± 0.029
L36760.820.820 ± 0.0140.735 ± 0.0440.888 ± 0.0250.803 ± 0.020
L413,188.460.868 ± 0.0140.829 ± 0.0240.899 ± 0.0090.863 ± 0.016
RFL1360.900.768 ± 0.0200.700 ± 0.0510.811 ± 0.0210.750 ± 0.028
L22408.710.817 ± 0.0290.744 ± 0.0520.871 ± 0.0200.802 ± 0.037
L36760.820.816 ± 0.0160.737 ± 0.0530.876 ± 0.0180.799 ± 0.025
L413,188.460.849 ± 0.0200.817 ± 0.0320.874 ± 0.0160.844 ± 0.022
SVML1360.900.606 ± 0.0510.564 ± 0.3140.708 ± 0.1670.550 ± 0.167
L22408.710.631 ± 0.1010.607 ± 0.3420.759 ± 0.2020.579 ± 0.215
L36760.820.683 ± 0.0750.903 ± 0.1010.645 ± 0.0940.743 ± 0.027
L413,188.460.572 ± 0.0390.479 ± 0.3860.746 ± 0.2070.460 ± 0.200
Note: ET = Extra Trees [37]; RF = Random Forest [38]; SVM = Support Vector Machine [39].
Table 4. Summary of overall classification performance and model training time evaluated via cross-validation and independent test set assessment.
ModelAccuracyAUCRecallPrec.F1KappaMCCTT (s)
ET0.8680.9450.8290.8990.8630.7360.7380.098
RF0.8490.9320.8170.8740.8440.6990.70.15
SVM0.5720.0000.4790.7450.460.1440.2210.028
Note: TT = Training Time (seconds). AUC = 0.000 indicates classifier degeneration of the SVM model under the experimental conditions of this study.

3.2.4. Feature Importance Analysis

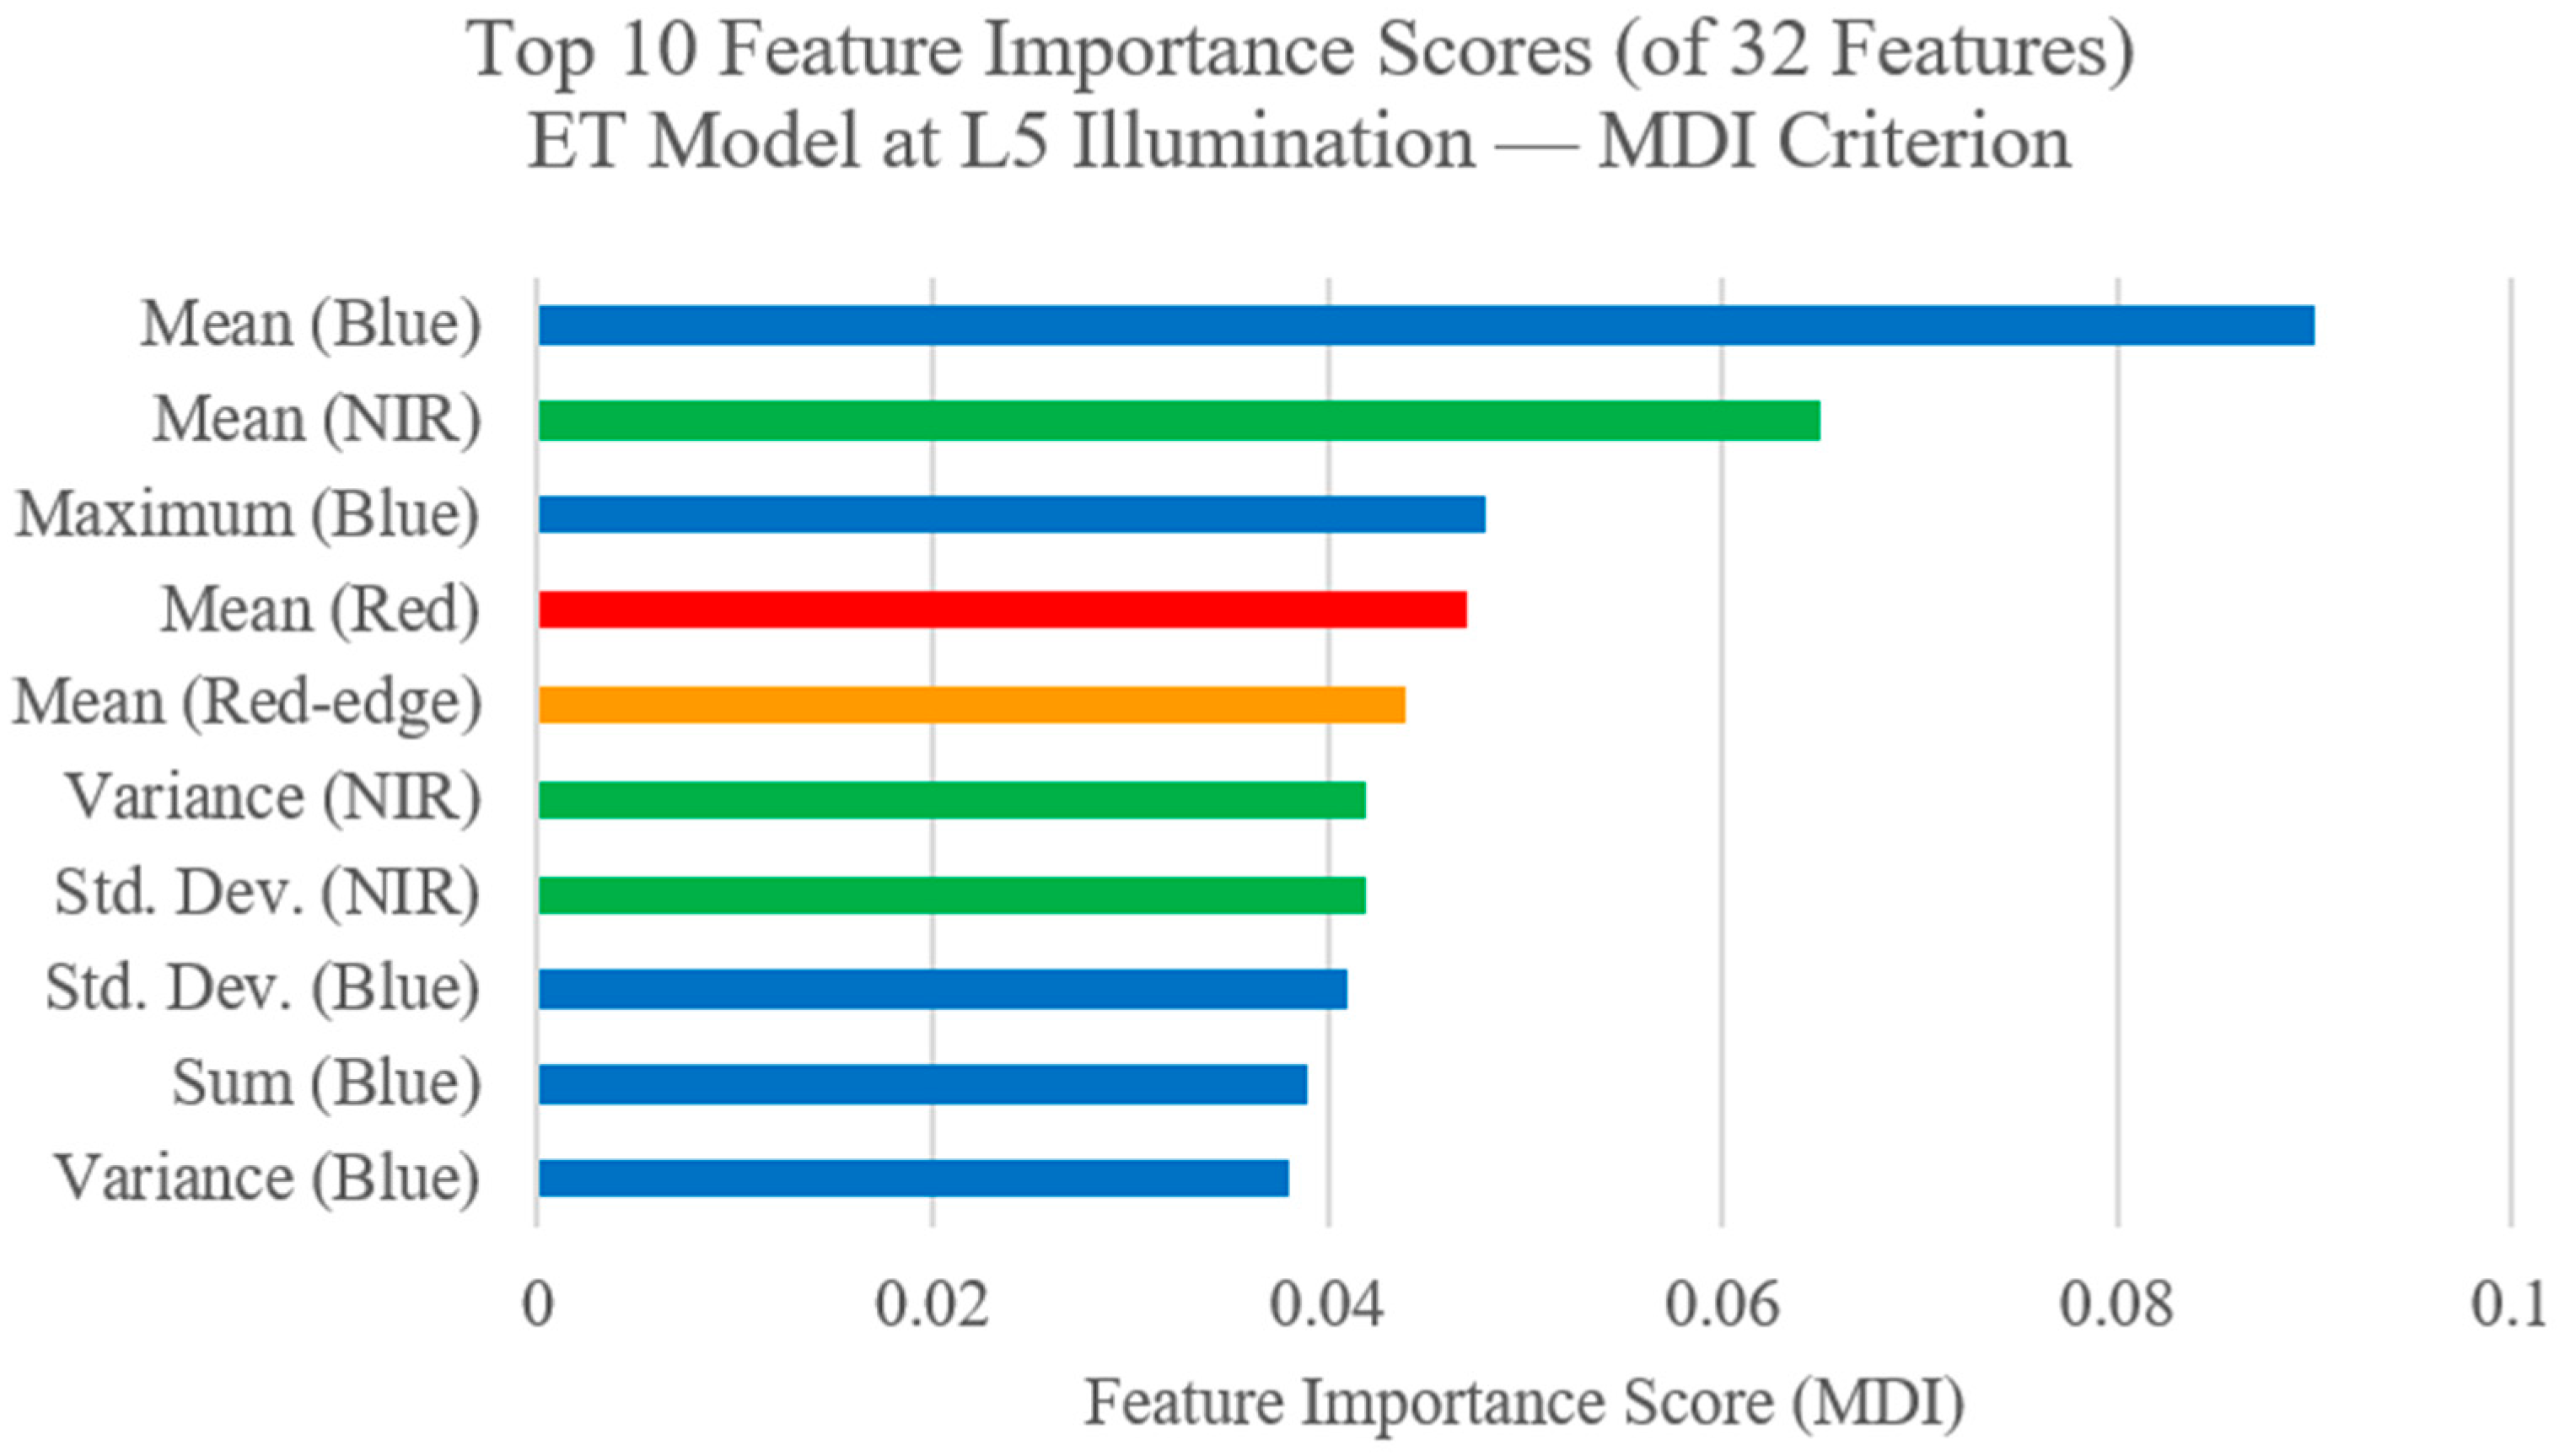
To elucidate the spectral mechanisms underlying the superior performance of ET at illumination level L4, a feature importance analysis was conducted on the Extra Trees (ET) classifier using the mean decrease in impurity (MDI) criterion—an ensemble-specific measure that quantifies the cumulative reduction in node impurity attributed to each feature across all decision trees within the ET ensemble [37]. Results are presented in Figure 3.
The analysis identified Mean (Blue) as the most influential predictor (≈0.090), with an importance score approximately 38% higher than the second-ranked feature, Mean (NIR) (≈0.065). This finding indicates that mean reflectance in the Blue band is the most discriminative spectral variable under L4 illumination conditions. From a physical standpoint, elevated irradiance enhances differential absorption and reflection of blue-wavelength light across seed surface types exhibiting distinct optical properties, producing spectral contrast sufficiently pronounced for reliable classification [42]. Within the NIR band, Mean (NIR), Std. Dev. (NIR), and Variance (NIR) ranked second, sixth, and seventh, respectively, confirming that NIR spectral features provide an important complementary discriminative contribution—a finding consistent with Chu et al. [35], who reported that NIR features, in conjunction with visible-band information, significantly enhance classification accuracy in multispectral imaging systems.
The presence of spatial statistical descriptors—Standard Deviation and Variance—for both the Blue and NIR bands among the top ten features (ranks 6–10) further indicates that intra-seed spatial variability in spectral reflectance contributes meaningfully to inter-variety discrimination, in accordance with findings from multispectral imaging studies applied to plant and seed classification tasks [43,44]. Collectively, the ten highest-ranked features were dominated by Blue and NIR band spectral characteristics. These results carry direct engineering implications for system design: in the development of feature-reduced classification pipelines aimed at improving computational efficiency, Blue and NIR band features should be prioritised for retention, as they account for the greatest share of the model’s discriminative capacity.

3.3. Model Application

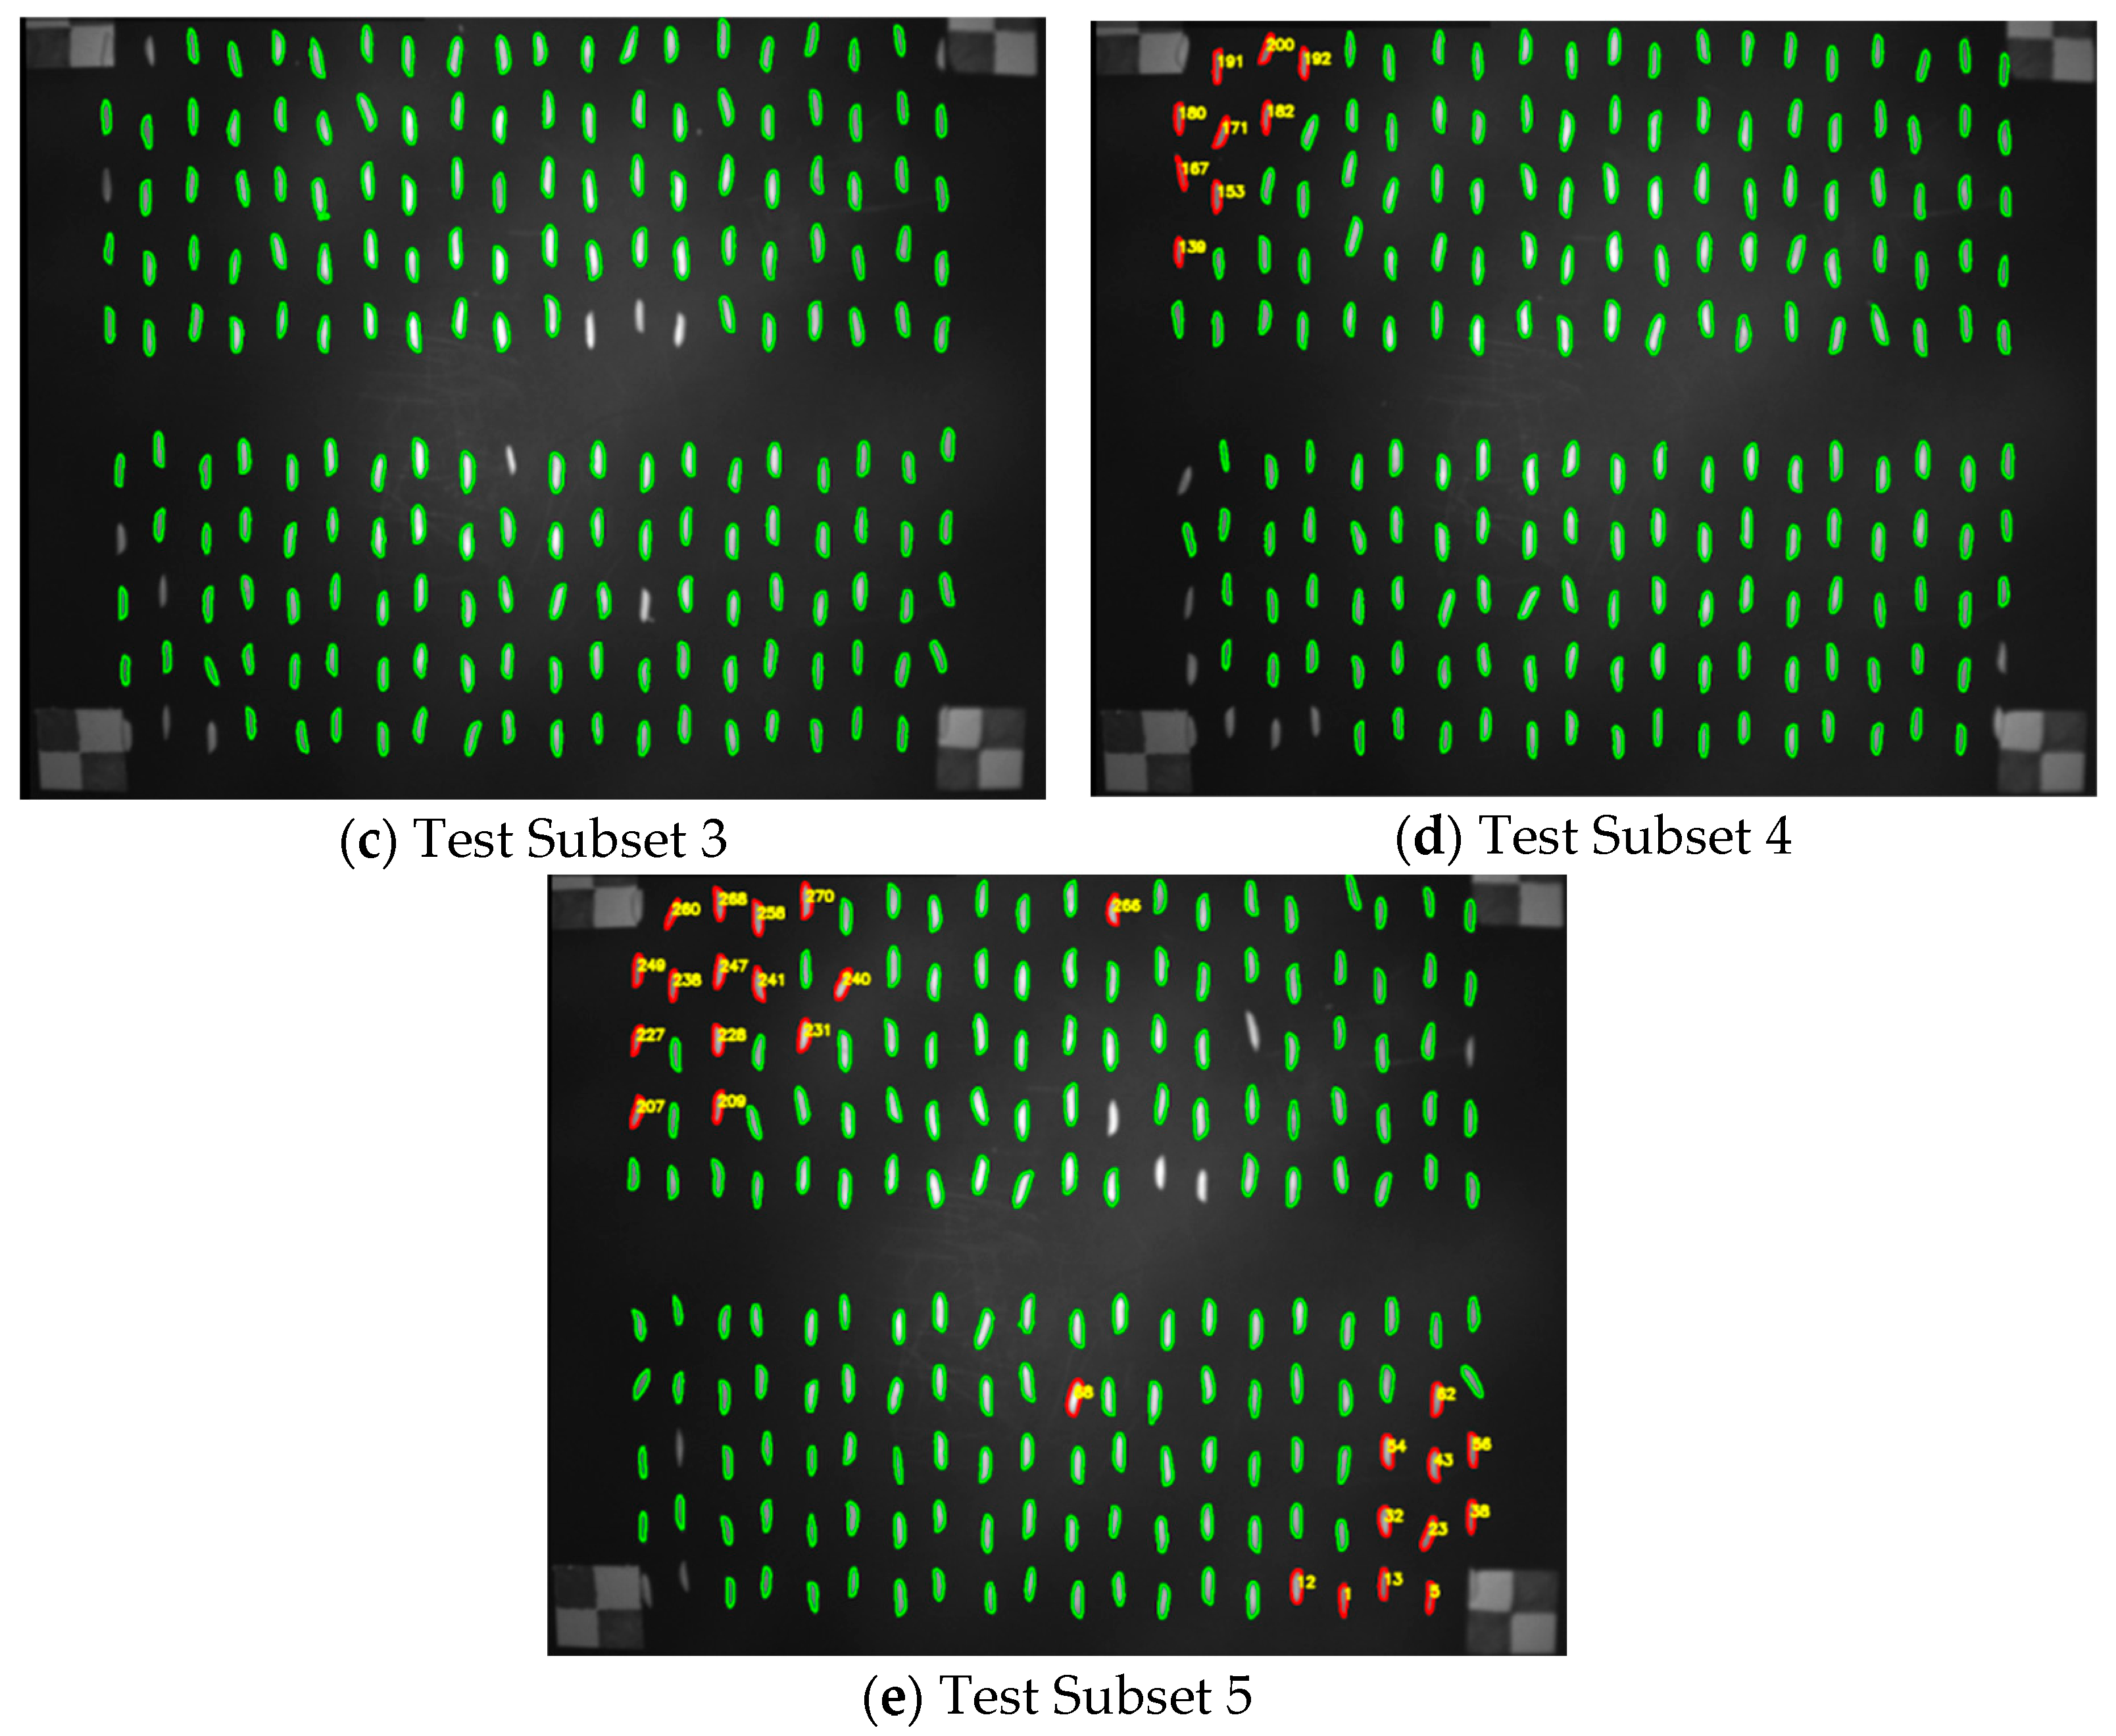
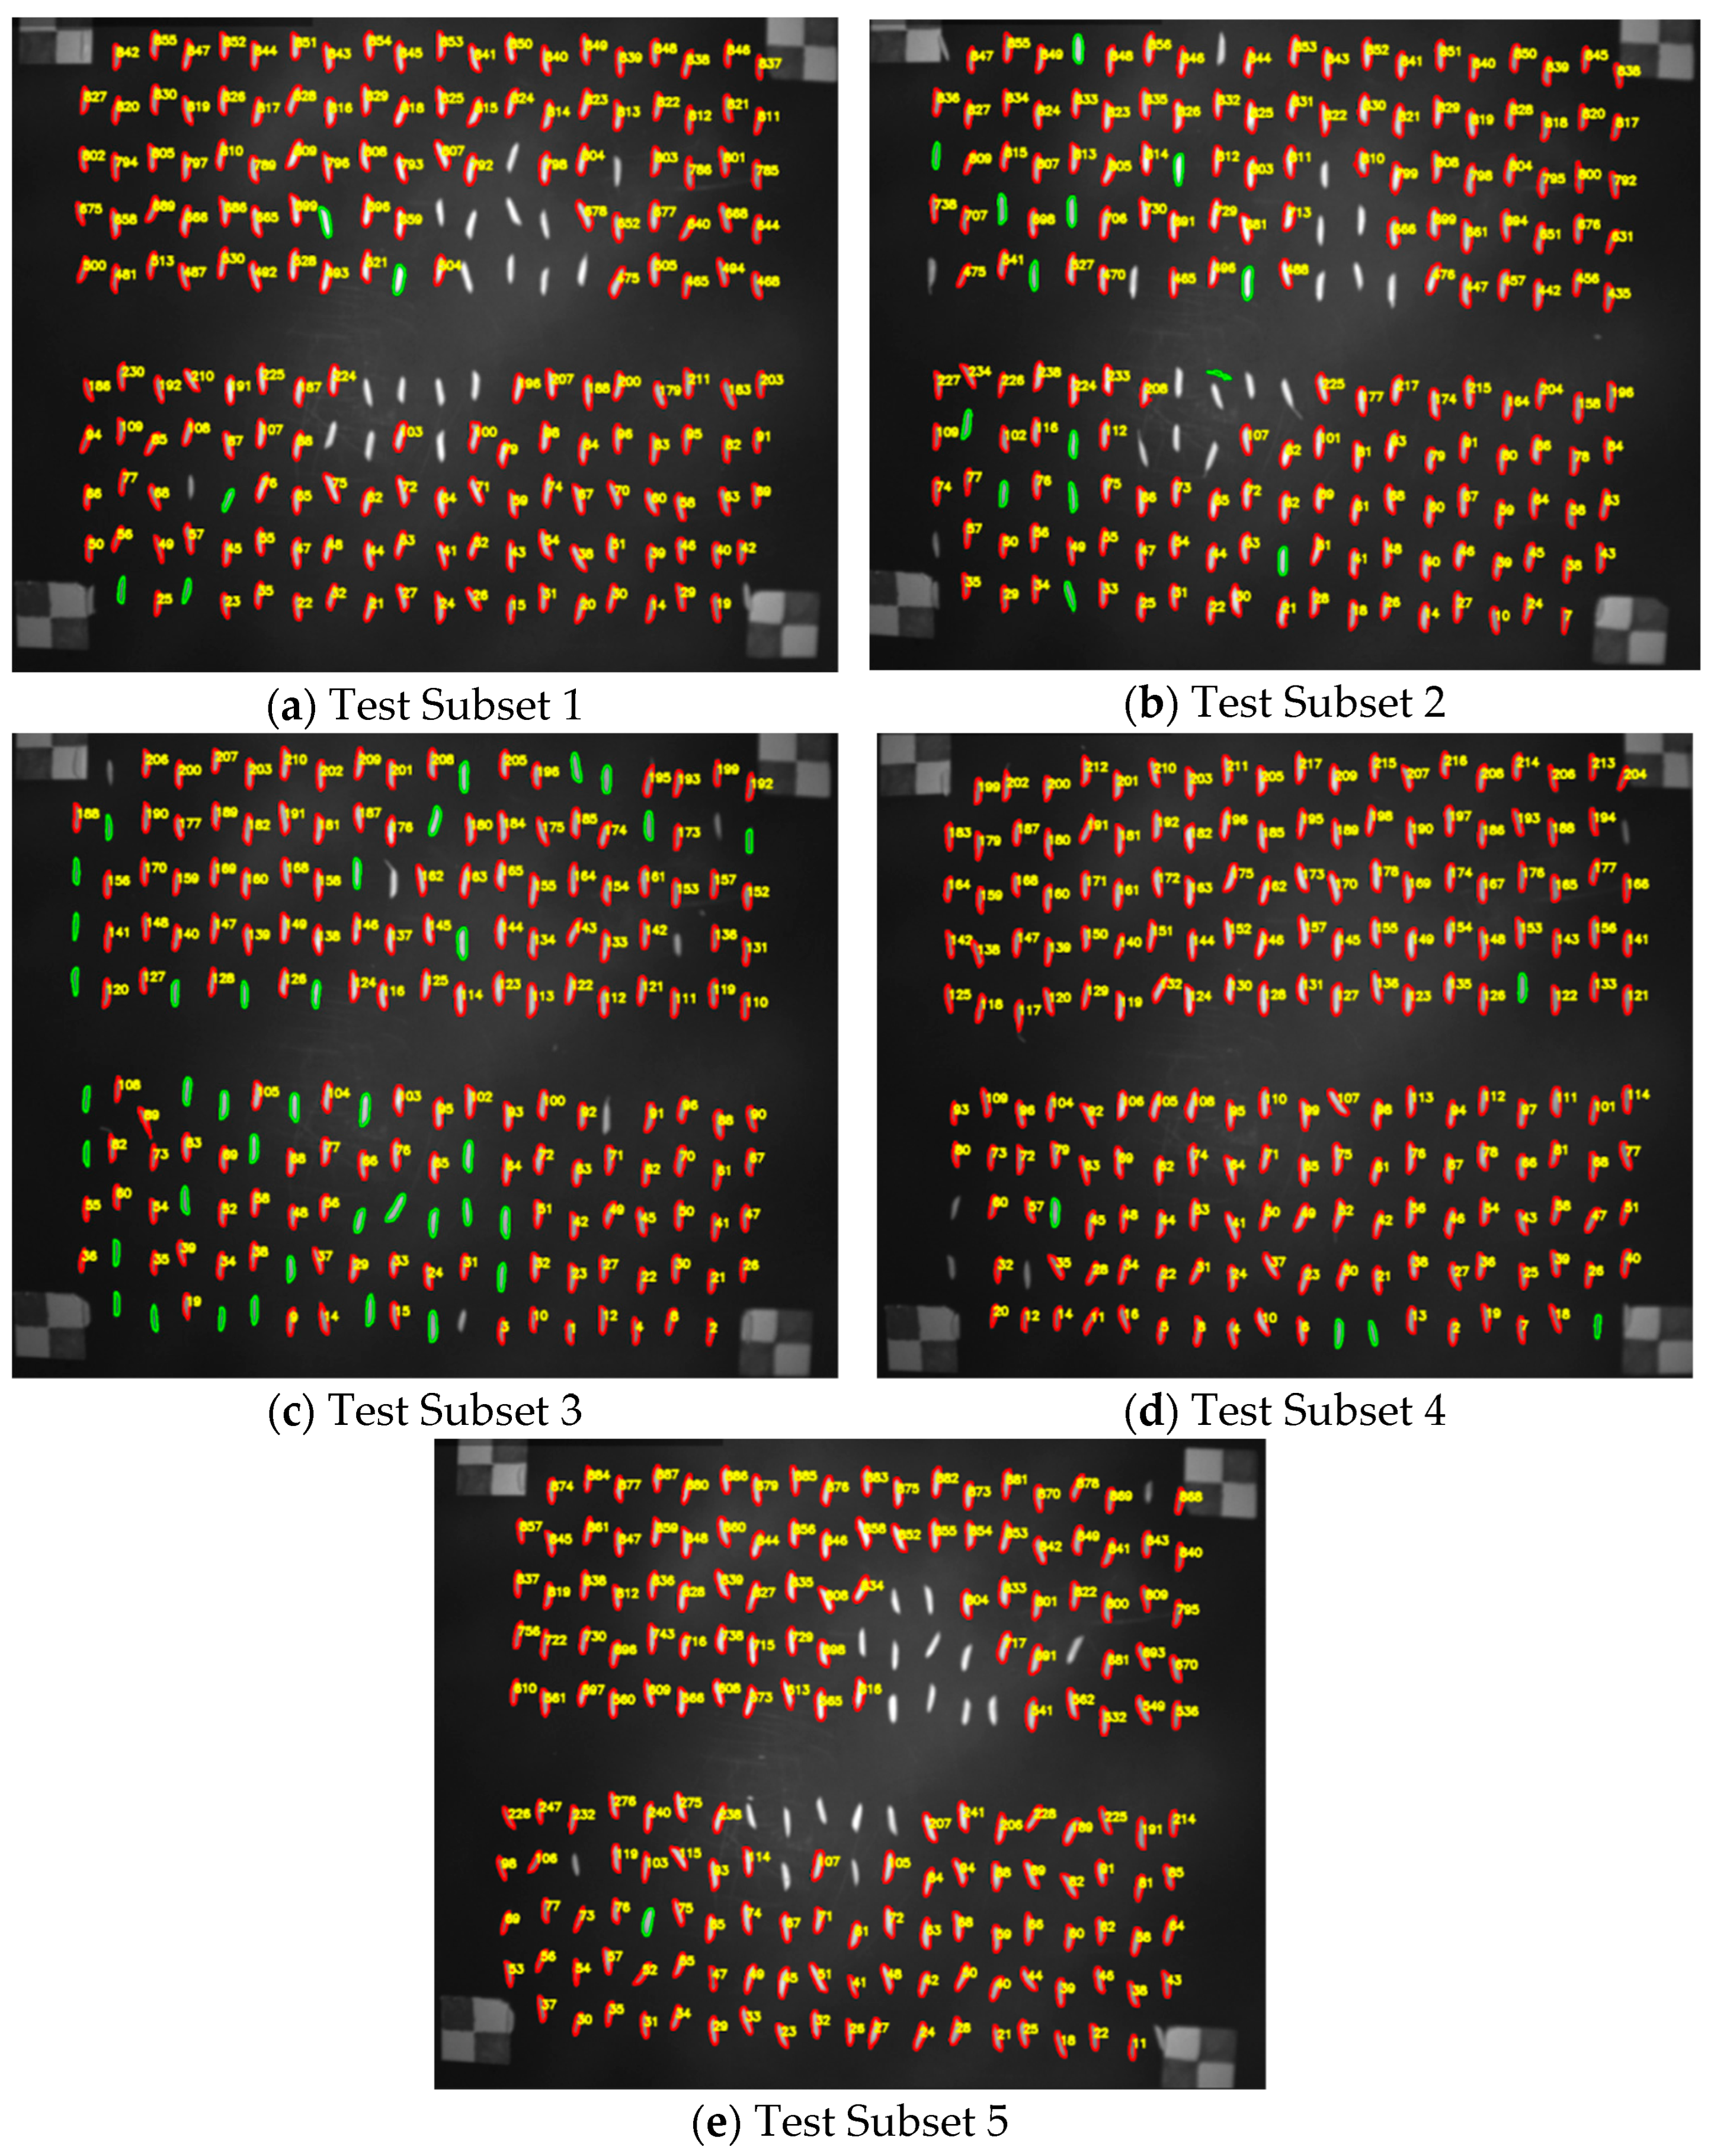
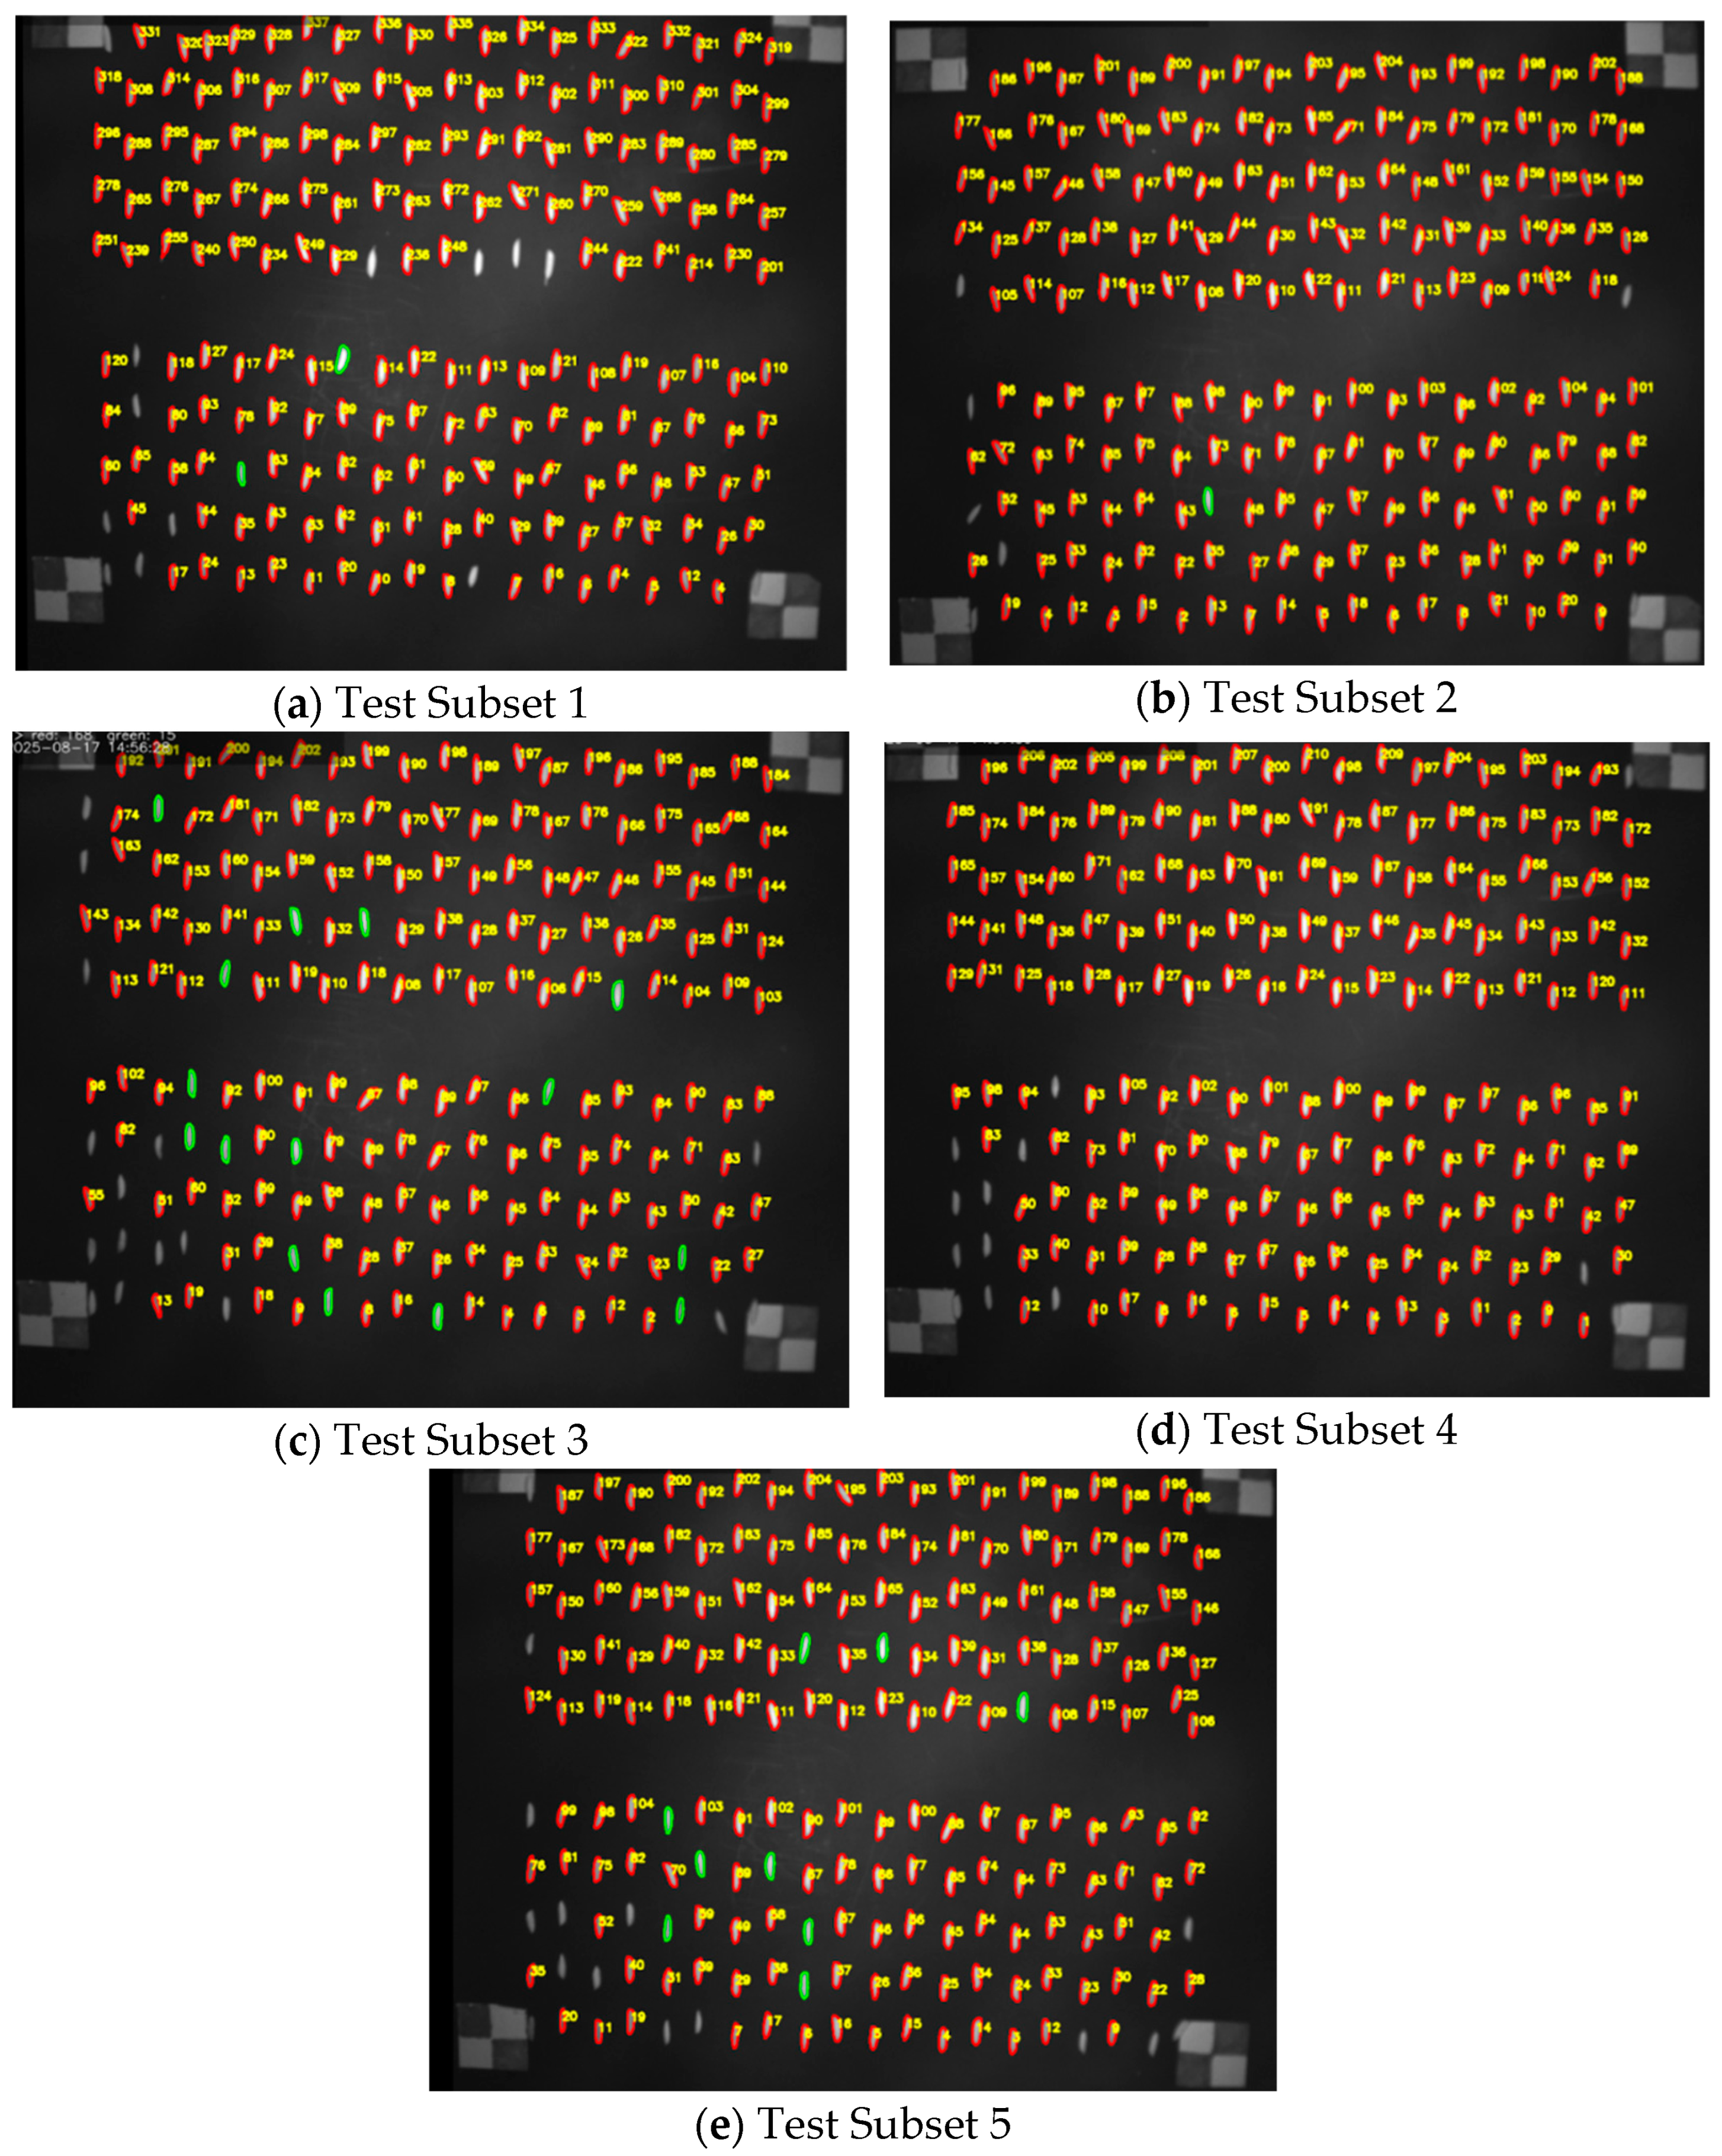
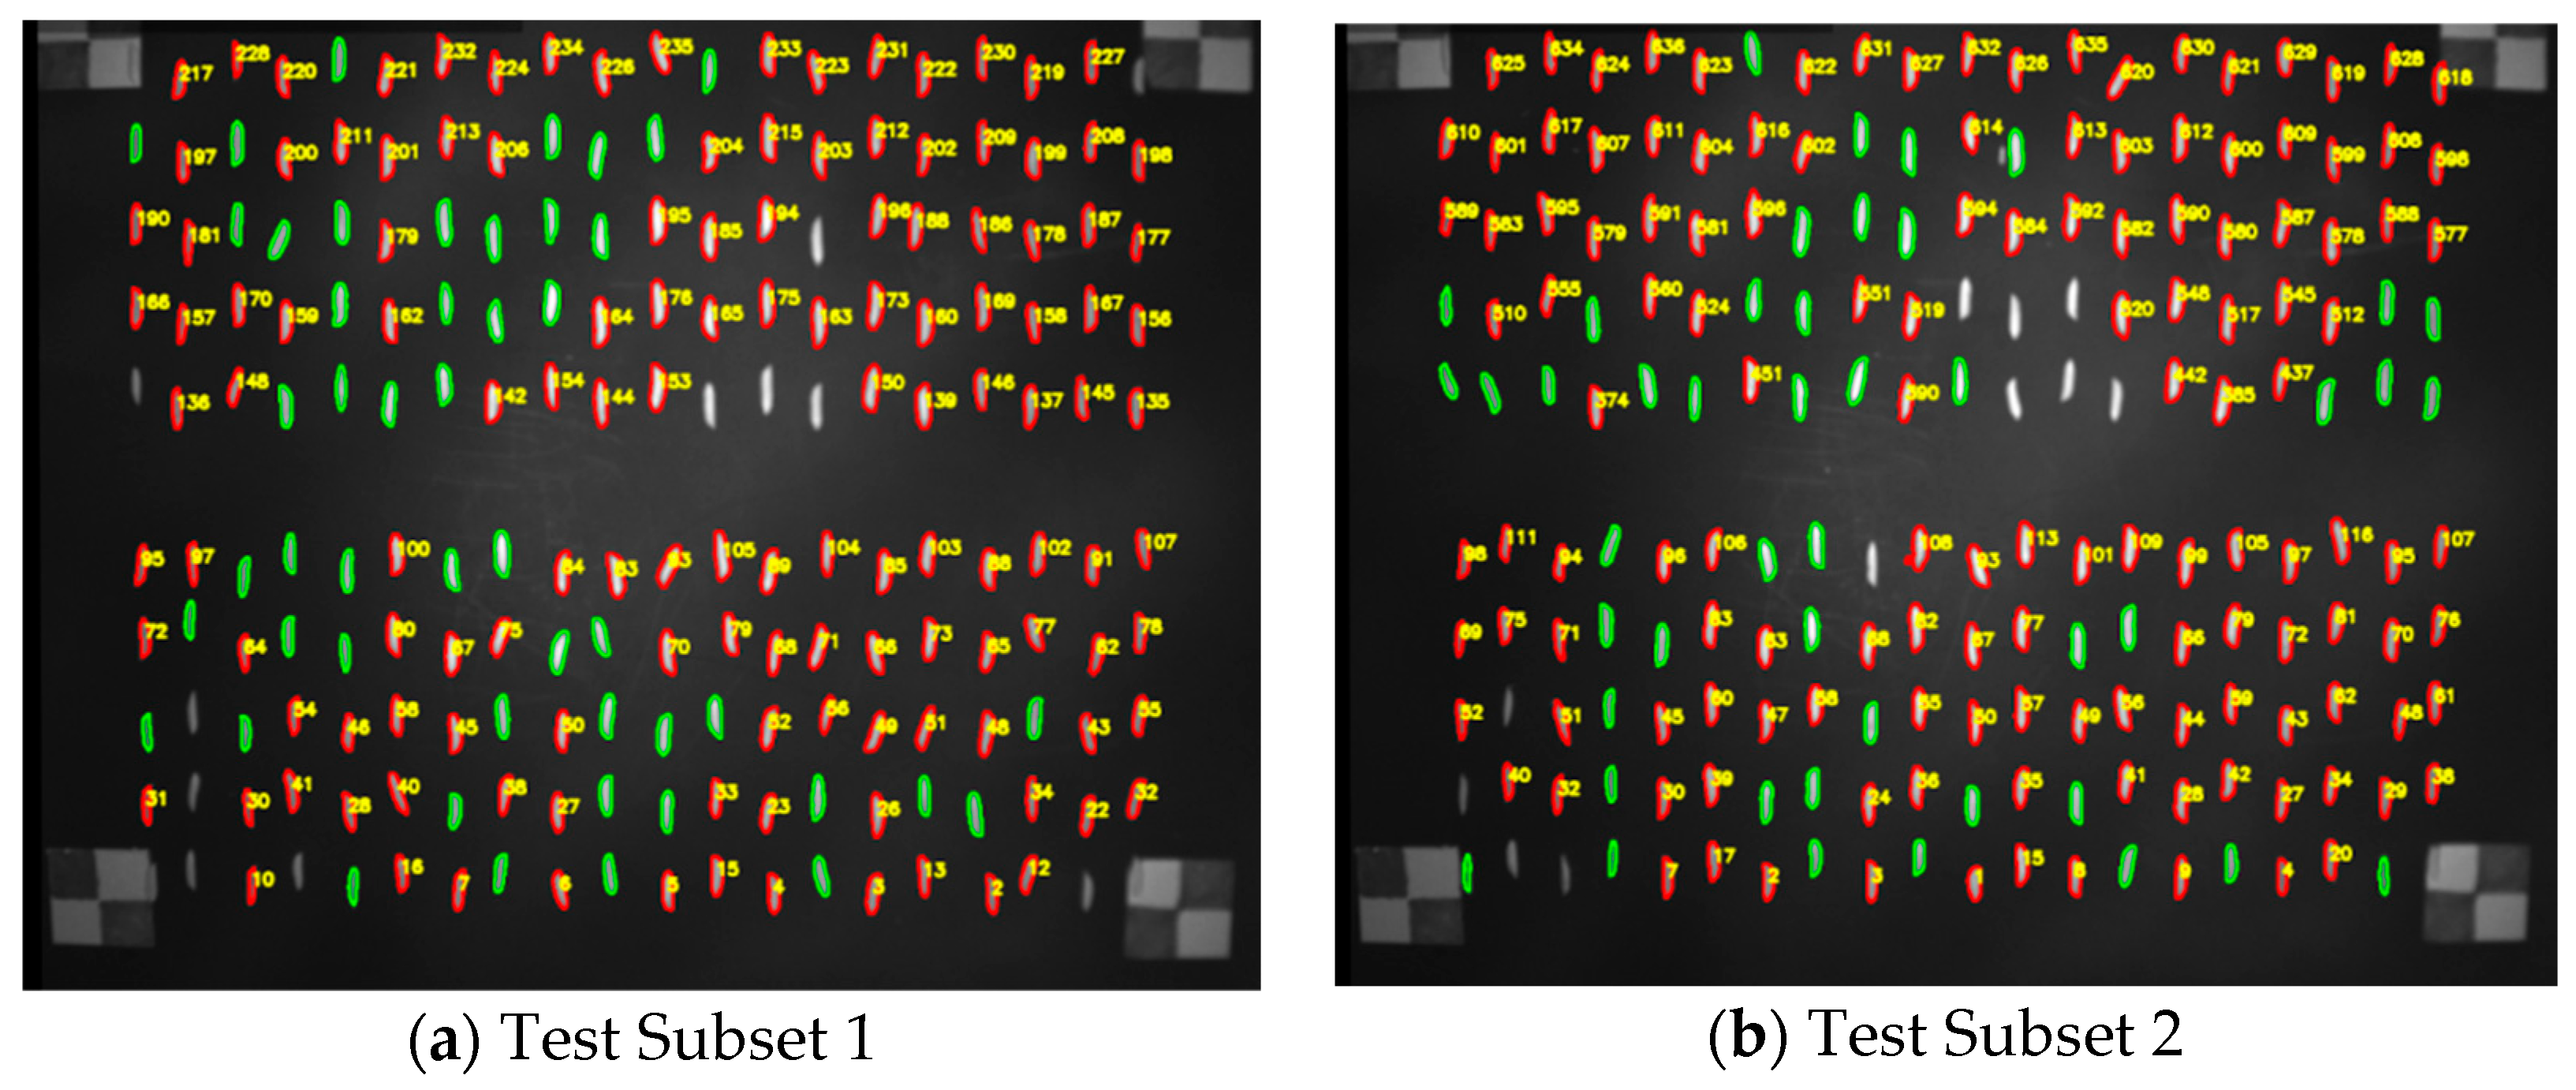
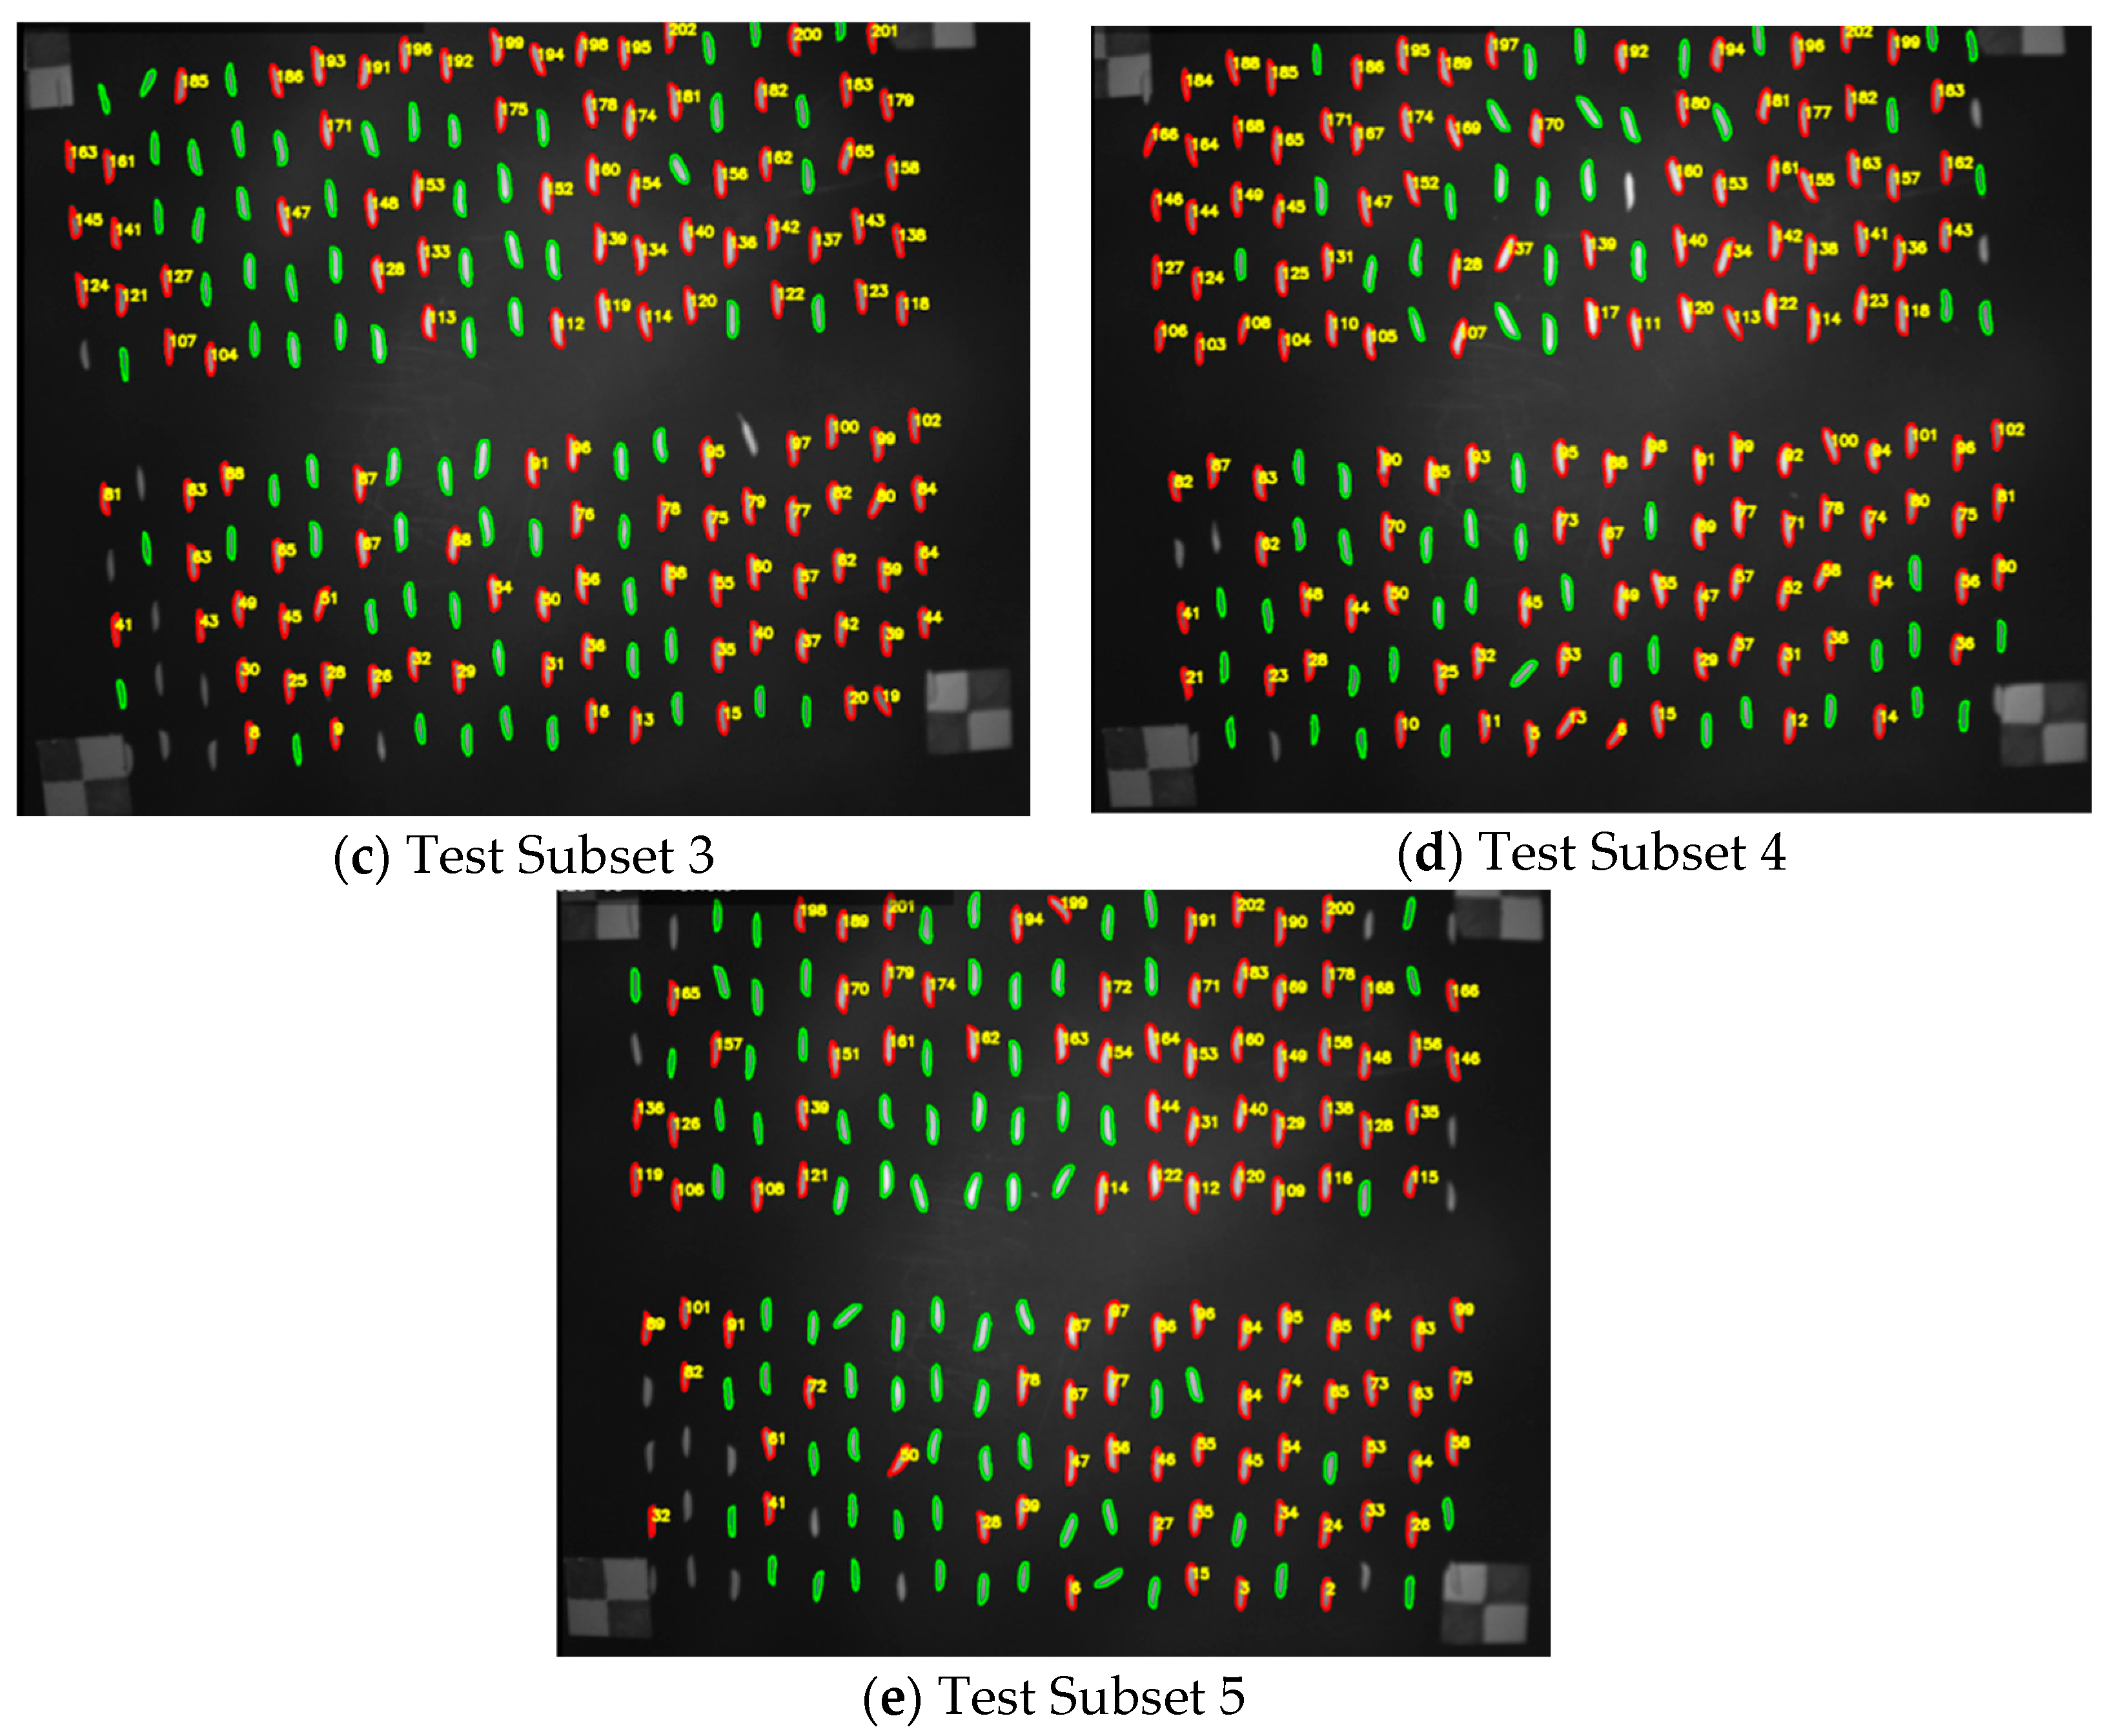
To evaluate the finalised Extra Trees classification model under operationally realistic conditions, four independent external validation sets were prepared—one per variety—each comprising 1000 seeds collected, imaged, and processed in a dedicated session conducted after model selection was completed. These validation samples were entirely distinct from the 4000-seed corpus used for model training and internal evaluation in Section 2.4 and Section 3.2, ensuring complete independence between development and assessment phases. For each variety, the 1000-seed set was partitioned into five sequential subsets of 200 seeds each; every subset was independently processed through the complete imaging and classification pipeline using the finalised model. For the KDML-105 validation set, the experiment assessed the model’s sensitivity—its capacity to correctly identify seeds of the target variety. For the non-target variety sets (Chainat-1, RD-6, and RD-15), the experiment assessed the model’s specificity—its capacity to correctly reject seeds that do not belong to the target class. Results for each variety are summarised in Table 5, Table 6, Table 7 and Table 8 and illustrated in Figure 4, Figure 5, Figure 6 and Figure 7, respectively. As summarized in Table 5, the model demonstrated excellent performance in classifying KDML-105 seeds, achieving coverage values between 92.50% and 96.00% (average 94.80%), accuracy ranging from 81.50% to 95.00% (average 90.60%), rejection rates between 4.00% and 7.50% (average 5.20%), and recall values ranging from 85.79% to 100.00% (average 95.58%). These results indicate that the model can accurately identify the target variety with a high level of sensitivity, as reflected by recall values exceeding 95% in nearly all test subsets. This demonstrates the model’s strong capability in minimizing false-negative errors, which is crucial in preventing undetected contamination in purity inspection systems. However, since the test dataset contained only a single rice variety, direct evaluation of false-positive classification errors was not possible. In addition, while both accuracy and coverage achieved relatively high averages, they did not reach their theoretical maximum. This may be attributed to variations in image quality among subsets, such as surface reflection artifacts or inconsistent seed alignment, which could have influenced spectral uniformity and feature extraction precision. In summary, the developed Extra Trees model exhibited high accuracy and robustness in classifying KDML-105 seeds, confirming its practical potential for real-world application in seed purity inspection. Nevertheless, further improvement in image acquisition consistency and feature extraction processes is recommended to enhance the system’s overall precision and reduce the rate of unclassified or misclassified samples in future implementations.
As presented in Table 6 and illustrated in Figure 5, the model demonstrated satisfactory performance in distinguishing Chainat-1 seeds from the target variety (KDML-105). The coverage ranged from 86.00% to 96.50% (average 91.40%), the accuracy ranged from 76.50% to 94.00% (average 85.10%), the rejection rate varied between 3.50% and 11.50% (average 7.60%), and the recall ranged from 80.10% to 99.44% (average 92.19%). These results indicate that the model was generally capable of differentiating Chainat-1 seeds from KDML-105 with high confidence, though some inconsistencies were observed across test subsets. Specifically, subsets 1 and 2 yielded accuracy values of approximately 83.50%, which were below 90%, suggesting that the model still faced challenges when classifying seeds with morphological and spectral characteristics closely resembling KDML-105. In contrast, subset 4 exhibited high coverage (95.50%) but a lower recall (80.10%), reflecting performance instability across testing iterations. Such variability may be attributed to differences in image quality, lighting uniformity, or incomplete feature extraction of the spectral–morphological variations within Chainat-1 seeds. To further enhance the model’s performance and generalization, it is recommended to expand the training dataset, particularly by including a more diverse set of Chainat-1 seed samples that capture natural variability in shape, color, and surface texture. In addition, refining the feature extraction process and exploring deep learning–based approaches may improve the model’s ability to discriminate between visually and spectrally similar seed varieties with higher precision and robustness.
As summarized in Table 7 and illustrated in Figure 6, the model exhibited strong performance in identifying RD-6 seeds as “non-KDML-105” samples. The coverage ranged between 91.50% and 96.00% (average 93.30%), accuracy between 84.00% and 95.50% (average 90.60%), rejection rate between 4.00% and 8.50% (average 6.70%), and recall between 91.80% and 100.00% (average 97.07%). These results confirm that the model effectively detected RD-6 seeds with high precision and consistency under typical testing conditions. However, fluctuations in accuracy and coverage were observed across subsets particularly in subsets 3 and 5, where accuracy was relatively lower compared to other groups. This variation may be attributed to differences in certain morphological or spectral traits among RD-6 seed samples, such as shape irregularities, surface curvature, or illumination inconsistency during imaging. These factors could influence spectral reflectance and lead to reduced uniformity in classification outcomes. Furthermore, the average rejection rate of 6.70% suggests that the model still encountered difficulty handling seeds exhibiting strong similarity to KDML-105 within the boundary of the decision space. Such cases reflect the model’s inherent uncertainty when dealing with borderline or overlapping spectral features. In summary, the developed model demonstrated satisfactory performance in classifying RD-6 seeds, confirming its capability to generalize beyond the target variety.
To further evaluate the robustness of the developed model, 1000 RD-15 rice seeds were tested and divided into five subsets of 200 seeds each (Figure 7). As summarized in Table 8, the analysis results revealed that the model correctly identified 104–141 non-KDML-105 seeds per subset, with coverage values ranging from 90.50% to 95.50% (average 93.20%), accuracy between 52.00% and 70.50% (average 62.90%), and recall values ranging from 57.46% to 75.40% (average 67.43%). These results indicate that the model achieved moderate to good performance in detecting adulterated (non-KDML-105) seeds within the RD-15 samples. However, the lowest recall value of 57.46%, observed in subset 5, suggests that the model had difficulty distinguishing seeds with morphological and spectral characteristics closely resembling KDML-105. The rejection rate ranged between 4.50% and 9.50% (average 6.80%), reflecting the system’s tendency to withhold classification decisions when prediction confidence was low, thereby minimizing unnecessary misclassifications. Overall, the results confirm that the developed model performs reasonably well in classifying RD-15 seeds, yet limitations remain in discriminating varieties with highly overlapping spectral and morphological signatures. To enhance future performance, it is recommended to increase the diversity of the training dataset, particularly by including a broader range of KDML-105 samples exhibiting natural variations in seed surface reflectance and texture. Moreover, incorporating Deep Learning or Feature Fusion techniques could further improve the model’s discriminative power, reduce prediction variability, and strengthen its capability for reliable real-world implementation in seed purity inspection.
The experimental results obtained from the development and evaluation of the multispectral imaging–based seed inspection model demonstrated that tree-based ensemble models, particularly the Extra Trees (ET) classifier, achieved the highest performance. Under the optimal illumination level (L4, 13,188.46 lx), the model reached an accuracy of 88.80% and a recall of 86.60%, outperforming the other algorithms. These findings align with previous studies on non-destructive seed classification, which reported that multispectral or hyperspectral imaging combined with machine learning can significantly enhance seed quality discrimination accuracy [35,45]. Similarly, Jin et al. [31] found that NIR–HSI integrated with deep learning effectively classified rice varieties with high precision.
The strong performance of the Extra Trees model under optimal illumination emphasizes the crucial role of image quality (illumination stability and signal-to-noise ratio) in capturing meaningful spectral and morphological information. This observation is consistent with Qi et al. [32] who applied NIR–HSI with transfer learning to analyze seed variety differences under varying environmental conditions and reported that spectral consistency directly affects classification accuracy.
When the best-performing model configuration (Extra Trees classifier at illumination level L4) was applied to real rice seed datasets comprising four varieties—KDML-105, Chainat-1, RD-6, and RD-15, the classification performance remained consistent across varieties [33,46]. For the target variety KDML-105, the model achieved an average accuracy of 90.60% and a recall of 95.58%, indicating a high capability to correctly identify target seeds while effectively minimizing false-negative errors. For the non-target varieties Chainat-1 and RD-6, the model maintained satisfactory results with average accuracies of 85.10% and 90.60%, respectively, despite their spectral and morphological similarity to KDML-105 [4,5,46]. This suggests that multispectral imaging effectively captures subtle variations in seed surface reflectance and internal structural characteristics [26,47,48].
However, the evaluation of RD-15—the cultivar exhibiting the greatest spectral proximity to KDML-105 among those examined—revealed substantially lower classification performance, with average accuracy and recall of 62.90% and 67.43%, respectively. The feature importance analysis presented in Figure 3 provides quantitative mechanistic grounding for this outcome. Although Mean (Blue) emerged as the single most discriminative predictor overall (importance score ≈ 0.090), the NIR band contributed substantially to the ranking structure, with Mean (NIR) positioned second (≈0.065) and multiple NIR-derived statistics—Standard Deviation (NIR) and Variance (NIR)—appearing in ranks six and seven, respectively. The discriminative limitations observed for RD-15 are particularly attributable to the NIR and Red-edge spectral regions, in which the reflectance profiles of KDML-105 and RD-15 converge most closely—a degree of spectral overlap that renders the ensemble decision boundary inherently ambiguous for these two classes and causes prediction confidence for RD-15 seeds to systematically approach the unclassified threshold defined in Section 2.5. This pattern is consistent with the elevated rejection rates observed across all five external validation subsets in Table 8 [33,46]. The underlying cause of this spectral convergence is genetic: RD-15 was derived from KDML-105 through gamma-ray mutation breeding and consequently retains a substantial proportion of the parent cultivar’s endosperm optical properties [5]—an inherited characteristic that the present five-band multispectral configuration cannot fully resolve at the level required for reliable inter-variety discrimination.
Two contributory factors further compound this spectral overlap challenge. First, the training corpus for RD-15—though nominally comprising 800 samples following 80/20 stratified partitioning—may be insufficient to populate the model’s decision space densely enough to resolve the narrow spectral margin separating these two cultivars, a limitation that expanded and phenotypically diverse training datasets could partially address [12,49]. Second, the reliance on first-order zonal statistics precludes the encoding of spatial texture and inter-band relational information that may carry additional discriminative signal in this spectrally challenging pair; the integration of Grey-Level Co-occurrence Matrix features and band-ratio spectral indices represents a tractable extension of the current pipeline that warrants systematic evaluation [47,50]. This observation is consistent with Yang et al. [51], who demonstrated that feature fusion strategies integrating spectral reflectance with higher-order image-based descriptors yield significant accuracy gains in hyperspectral seed discrimination tasks—a finding that directly motivates the feature engineering extensions identified above.
Several inherent limitations of the MSI approach warrant explicit acknowledgement. First, the MicaSense RedEdge-MX operates across five discrete broad spectral bands (475, 560, 668, 717, and 840 nm), which precludes the capture of subtle, continuous spectral signatures detectable by hyperspectral systems; inter-variety differences that manifest as fine-grained absorption features within these bands may therefore be partially or fully unresolved. Second, MSI captures surface reflectance properties exclusively and is unable to evaluate internal seed defects, concealed fungal infections, or subsurface biochemical composition—limitations that motivate future integration with complementary non-destructive modalities such as X-ray imaging or short-wave infrared (SWIR) spectroscopy. Third, the 32-feature space employed in this study is subject to inter-feature correlation, particularly among reflectance statistics within spectrally adjacent bands; future implementations should incorporate systematic feature selection or dimensionality reduction prior to model training to mitigate redundancy and improve model parsimony.
Contextualised against the broader literature on spectral-based grain and seed classification, the classification performance achieved in the present study is competitive. Kiratiratanapruk et al. [17] reported 89.3% accuracy for paddy rice seed classification using machine learning with colour-based features—a result comparable to the ET model’s cross-validation accuracy of 88.8% reported herein, while the present system additionally characterises the effect of illumination level on performance stability. Jin et al. [30] achieved 95.6% accuracy for rice seed variety identification using near-infrared hyperspectral imaging combined with deep learning—a higher-accuracy outcome enabled by substantially greater spectral resolution and a more computationally intensive architecture. Lapcharoensuk and Moul [46] reported 94.2% accuracy using FT-NIR spectroscopy with SVM for KDML-105 geographical origin classification, though that task addresses origin discrimination rather than inter-variety purity assessment and relies on a bench-top spectrometer rather than an imaging platform. Taken together, these comparisons indicate that the proposed MSI-based system achieves accuracy within the competitive range of established spectral methods while offering practical advantages in throughput, imaging-based spatial output, and cost-effectiveness relative to hyperspectral or bench-top spectroscopic alternatives.
It is acknowledged that convolutional neural networks and pre-trained deep learning architectures have demonstrated superior classification accuracy in comparable grain imaging tasks [18,30]; however, the present study was designed to establish a rigorous, illumination-optimised classical machine learning baseline—grounded in interpretable handcrafted spectral features—against which future deep learning approaches applied to the same MSI dataset can be systematically benchmarked. This comparison is the subject of a planned follow-up investigation.
It should be noted that the classification performance reported herein reflects inter-variety differences in surface spectral reflectance characteristics—attributable to variation in seed coat pigmentation, surface texture, and optical properties—rather than direct differentiation of underlying genetic or molecular composition. MSI-based classification therefore operates as a rapid optical screening tool, complementary to—rather than a substitute for—molecular authentication methods in contexts requiring genotypic verification.

4. Conclusions

This study demonstrated the feasibility of integrating five-band multispectral imaging with tree-based ensemble learning for non-destructive purity inspection of Thai aromatic rice seed, with particular focus on Khao Dawk Mali 105 (KDML-105) and three morphologically similar contaminating varieties—Chainat-1, RD-6, and RD-15. Among the three classification algorithms evaluated, the Extra Trees (ET) model consistently outperformed Random Forest (RF) and Support Vector Machine (SVM) across all tested illumination conditions, achieving peak accuracy and recall of 88.8% and 86.6%, respectively, under the optimal illumination level of 13,188.46 lx (L4). These results confirm that illumination intensity is a primary determinant of spectral feature quality and, by extension, classification reliability in multispectral seed inspection systems.
External validation further substantiated the model’s practical utility: KDML-105 seeds were correctly identified with an average accuracy of 90.6% and recall of 95.6%, while Chainat-1 and RD-6 yielded average accuracies of 85.1% and 90.6%, respectively. Classification of RD-15, however, remained limited—with an average accuracy of 62.9% and recall of 67.4%—owing to its pronounced spectral and morphological proximity to KDML-105 across the NIR and Red-edge bands. Although this performance level precludes standalone deployment in certified seed inspection workflows, the system retains practical value as a pre-screening tool capable of flagging suspect seed batches for targeted laboratory confirmation, thereby reducing the overall burden on time-intensive methods such as DNA marker analysis.
Future research should focus on three principal directions: (i) expanding and diversifying the training dataset to improve inter-variety decision boundaries, particularly for spectrally similar cultivars; (ii) integrating short-wave infrared (SWIR) bands, which carry sensitivity to internal seed composition and endosperm starch structure relevant to KDML-105/RD-15 discrimination; and (iii) exploring end-to-end deep learning architectures—notably convolutional neural networks operating directly on raw multispectral image cubes and YOLO-family detection models adapted for high-throughput seed grid processing—to extract higher-order spatial–spectral representations that transcend the capacity of hand-crafted zonal statistics and to enable simultaneous seed localisation and variety classification within a single inference pass. Advances along these directions would substantially strengthen the robustness and commercial readiness of automated multispectral seed inspection systems for the broader agricultural sector.
On the basis of the integrated statistical, performance, stability, and computational evidence presented in this study, the Extra Trees (ET) classifier at illumination level L4 (13,188.46 lx) is formally recommended as the optimal configuration for practical implementation of MSI-based rice seed purity inspection.

Supplementary Materials

The following supporting information can be downloaded at: https://www.mdpi.com/article/10.3390/agriengineering8080348/s1, Table S1: Two-Way Analysis of Variance (ANOVA) Summary for Classification Performance Metrics; Table S2: Post Hoc Pairwise Comparisons of Classifier (Model) Performance; Table S3: Experiment Setup Configuration (PyCaret setup()); Table S4: Classifier Hyperparameter Configuration.

Author Contributions

Conceptualization, K.D. and J.P. (Jetsada Posom); methodology, K.D.; software, K.D.; formal analysis, K.D. and L.P.; investigation, J.P. (Jirasin Prueksawan) and L.P.; resources, P.S.; data curation, J.P. (Jirasin Prueksawan) and L.P.; writing—original draft preparation, K.D.; writing—review and editing, J.P. (Jetsada Posom); supervision, J.P. (Jetsada Posom); project administration, K.D. and J.P. (Jetsada Posom); funding acquisition, K.D. All authors have read and agreed to the published version of the manuscript.

Funding

This research was funded by the National Research Council of Thailand (NRCT), contract number N42A670923.

Institutional Review Board Statement

Not applicable.

Informed Consent Statement

Not applicable.

Data Availability Statement

The multispectral image datasets analysed in this study include seed material provided by the Khon Kaen Rice Research Center (Rice Department, Thailand) and are subject to institutional data-sharing restrictions; access may be granted upon request to the corresponding author, subject to approval from the Rice Department. The statistical analyses and classifier configuration details supporting the findings of this study are provided in the Supplementary Materials (Tables S1–S4).

Acknowledgments

The authors gratefully acknowledge the Khon Kaen Rice Research Center for providing the rice seed material used in this study, and the Department of Agricultural Engineering, Faculty of Engineering, Khon Kaen University, for providing laboratory facilities and technical support. During the preparation of this manuscript, the author(s) used Claude Sonnet 4.6 (Anthropic) for the purposes of language translation and improvement of English grammar. The authors have reviewed and edited the output and take full responsibility for the content of this publication.

Conflicts of Interest

The authors declare no conflicts of interest.

Abbreviations

The following abbreviations are used in this manuscript:
MSIMultispectral imaging
KDML-105Khao Dawk Mali 105
RD-15 Kor Khor 15
RD-6Kor Khor 6
ETExtra Trees
RFRandom Forest
SVMSupport Vector Machine
MLMachine learning
NIRNear-infrared
ROIRegion of interest
MDIMean decrease in impurity
AUCArea under the receiver operating characteristic curve
MCCMatthews correlation coefficient
ANOVAAnalysis of variance
CVCross-validation
NRCTNational Research Council of Thailand
SDStandard deviation
TTTraining time
SWIRShort-wave infrared
DNADeoxyribonucleic acid

References

  1. Mohidem, N.A.; Hashim, N.; Shamsudin, R.; Che Man, H. Rice for food security: Revisiting its production, diversity, rice milling process and nutrient content. Agriculture 2022, 12, 741. [Google Scholar] [CrossRef] [Scilit]
  2. Zafar, S.; Xu, J. Recent advances to enhance nutritional quality of rice. Rice Sci. 2023, 30, 523–536. [Google Scholar] [CrossRef] [Scilit]
  3. Government Public Relations Department (Thailand). Thai Rice Exports Hit 6-Year High in 2024 Worth USD 6.69 Billion. Available online: https://thailand.prd.go.th/en/content/category/detail/id/2078/iid/360215 (accessed on 30 January 2025).
  4. Thiranusornkij, L.; Thamnarathip, P.; Chandrachai, A.; Kuakpetoon, D.; Adisakwattana, S. Physicochemical properties of Hom Nil (Oryza sativa) rice flour as gluten free ingredient in bread (with Hom Mali 105 as reference). Foods 2018, 7, 159. [Google Scholar] [CrossRef] [Scilit] [PubMed]
  5. Vanavichit, A. Thai Hom Mali Rice: Origin and breeding for subsistence and export. Rice J. 2018, 11, 20. [Google Scholar] [CrossRef] [Scilit] [PubMed]
  6. Doungpueng, K.; Charee, S.; Oupathum, C.; Premprayoon, K.; Pachanawan, A. Optimizing shearing characteristics of sugarcane leaves for efficient biomass utilization and machinery design in the sugar industry. Eng. J. 2024, 28, 1–11. [Google Scholar] [CrossRef] [Scilit]
  7. Wedger, M.J.; Roma-Burgos, N.; Olsen, K.M. Genomic revolution of US weedy rice in response to 21st century agricultural technologies. Commun. Biol. 2022, 5, 885. [Google Scholar] [CrossRef] [Scilit] [PubMed]
  8. Sedah, P.; Djedatin, L.G.; Loko, L.Y.E.; Ewedje, E.-E.B.K.; Orobiyi, A.; Gbemavo, C.D.S.J.; Toffa, J.; Tchakpa, C.; Cubry, P.; Sabot, F. Impact of seed origin and genetic drift of improved rice variety IR841 in Benin. Rice 2023, 16, 48. [Google Scholar] [CrossRef] [Scilit] [PubMed]
  9. Tian, Y.-G.; Pang, L.-H.; Jiang, X.-Q.; Lu, B.-R. Impact of soil burial depths on survival of weedy rice seeds: Implications for weed management. Agronomy 2024, 14, 1281. [Google Scholar] [CrossRef] [Scilit]
  10. Ojdowska, P.; Oleksiak, T.; Studnicki, M.; Iwańska, M. Certified seed use enhances yield stability in cereal production under temperate climate conditions. Agronomy 2025, 15, 1886. [Google Scholar] [CrossRef] [Scilit]
  11. Abbas, K.; Hakim, A.; Nadeem, N.; Altaf, A.; Iqbal, H. Identification of rice purity level from mixed rice varieties using deep learning. J. Agric. Res. 2022, 60, 4. [Google Scholar] [CrossRef] [Scilit]
  12. Chen, M.; Song, J.; He, H.; Yu, Y.; Wang, R.; Huang, Y.; Li, Z. Quantitative analysis of high-price rice adulteration based on near-infrared spectroscopy combined with chemometrics. Foods 2024, 13, 3241. [Google Scholar] [CrossRef] [Scilit] [PubMed]
  13. Sharabiani, V.R.; Khorramifar, A.; Karami, H.; Lozano, J.; Tabor, S.; Darvishi, Y.; Gancarz, M. Non-destructive test to detect adulteration of rice using gas sensors coupled with chemometrics methods. Int. Agrophys. 2023, 37, 235–244. [Google Scholar] [CrossRef] [Scilit] [PubMed]
  14. Pachanawan, A.; Doungpueng, K.; Muenkaew, P.; Rayanasuk, K.; Srila, M. Design and performance evaluation of a propeller-based peanut sheller: Efficiency and economic feasibility analysis. Eng. J. 2025, 29, 15–23. [Google Scholar]
  15. Owolabi, I.O.; Arowora, K.A.; Onukwugha, E. Incidence of fraud and adulterations in ASEAN food/feed exports: A 20-year analysis of RASFF’s notifications. PLoS ONE 2021, 16, e0259298. [Google Scholar] [CrossRef] [Scilit] [PubMed]
  16. Segal, R.; Minh, L.N. Unfair Harvest: The State of Rice in Asia; Oxfam International: Oxford, UK, 2019; Available online: https://www.oxfam.org/en/research/unfair-harvest-state-rice-asia (accessed on 13 August 2026).
  17. Liu, W.; Zeng, S.; Wu, G.; Li, H.; Chen, F. Rice seed purity identification technology using hyperspectral image with LASSO logistic regression model. Sensors 2021, 21, 4384. [Google Scholar] [CrossRef] [Scilit] [PubMed]
  18. Kiratiratanapruk, K.; Temniranrat, P.; Sinthupinyo, W.; Prempree, P.; Chaitavon, K.; Porntheeraphat, S.; Prasertsak, A. Development of paddy rice seed classification process using machine learning techniques for automatic grading machine. J. Sens. 2020, 2020, 7041310. [Google Scholar] [CrossRef] [Scilit]
  19. Chen, Y.; Zhang, H.; Li, W. Deep feature extraction and classification of hyperspectral images based on convolutional neural networks with small sample sizes. Remote Sens. 2021, 13, 891. [Google Scholar] [CrossRef] [Scilit]
  20. Harisha, R. SSR and morphological traits based fingerprints and DNA-barcoding of rice varieties. Bulg. J. Agric. Sci. 2021, 27, 1052–1058. [Google Scholar] [CrossRef] [Scilit]
  21. Vieira, M.B.; Ferreira, M.M.; Oliveira, M.M.; Morais, S. DNA-based tools to certify authenticity of rice varieties—An overview. Foods 2022, 11, 258. [Google Scholar] [CrossRef] [Scilit] [PubMed]
  22. Le Nguyen Doan, D.; Nguyen, Q.C.; Marini, F.; Biancolillo, A. Authentication of rice (Oryza sativa L.) using near-infrared spectroscopy combined with different chemometric classification strategies. Appl. Sci. 2021, 11, 362. [Google Scholar] [CrossRef] [Scilit]
  23. Mihailova, A.; Liebisch, B.; Islam, M.D.; Carstensen, J.M.; Cannavan, A.; Kelly, S.D. The use of multispectral imaging for the discrimination of Arabica and Robusta coffee beans. Food Chem. X 2022, 14, 100325. [Google Scholar] [CrossRef] [Scilit] [PubMed]
  24. Mortensen, A.K.; Gislum, R.; Jørgensen, J.R.; Boelt, B. The use of multispectral imaging and single seed and bulk near-infrared spectroscopy to characterize seed covering structures: Methods and applications in seed testing and research. Agriculture 2021, 11, 301. [Google Scholar] [CrossRef] [Scilit]
  25. Silva, A.S.; Cicero, S.M.; Silva, F.F.; Gomes-Junior, F.G. Radiographic and spectral images of rice seeds and the photosynthetic efficiency of seedlings. Sci. Agric. 2024, 81, e20220029. [Google Scholar] [CrossRef] [Scilit]
  26. ElMasry, G.; Mandour, N.; Al-Rejaie, S.; Belin, E.; Rousseau, D. Recent applications of multispectral imaging in seed phenotyping and quality monitoring—An overview. Sensors 2019, 19, 1090. [Google Scholar] [CrossRef] [Scilit] [PubMed]
  27. Fengou, L.-C.; Lianou, A.; Tsakanikas, P.; Mohareb, F.; Nychas, G.-J.E. Detection of meat adulteration using spectroscopy-based sensors. Foods 2021, 10, 861. [Google Scholar] [CrossRef] [Scilit] [PubMed]
  28. Ropodi, A.; Panagou, E.; Nychas, G.-J. Multispectral imaging (MSI): A promising method for the detection of minced beef adulteration with horsemeat. Food Control 2016, 73, 57–63. [Google Scholar] [CrossRef] [Scilit]
  29. Aline, U.; Bhattacharya, T.; Faqeerzada, M.A.; Kim, M.S.; Baek, I.; Cho, B.-K. Advancement of non-destructive spectral measurements for the quality of major tropical fruits and vegetables: A review. Front. Plant Sci. 2023, 14, 1240361. [Google Scholar] [CrossRef] [Scilit] [PubMed]
  30. Zhang, W.; Kasun, L.C.; Wang, Q.J.; Zheng, Y.; Lin, Z. A review of machine learning for near-infrared spectroscopy. Sensors 2022, 22, 9764. [Google Scholar] [CrossRef] [Scilit] [PubMed]
  31. Jin, B.; Zhang, C.; Jia, L.; Tang, Q.; Gao, L.; Zhao, G.; Qi, H. Identification of rice seed varieties based on near-infrared hyperspectral imaging technology combined with deep learning. ACS Omega 2022, 7, 4735–4749. [Google Scholar] [CrossRef] [Scilit] [PubMed]
  32. Qi, H.; Huang, Z.; Sun, Z.; Tang, Q.; Zhao, G.; Zhu, X.; Zhang, C. Rice seed vigor detection based on near-infrared hyperspectral imaging and deep transfer learning. Front. Plant Sci. 2023, 14, 1283921. [Google Scholar] [CrossRef] [Scilit] [PubMed]
  33. Kang, Z.; Fan, R.; Zhan, C.; Wu, Y.; Lin, Y.; Li, K.; Qing, R.; Xu, L. The rapid non-destructive differentiation of different varieties of rice by fluorescence hyperspectral technology combined with machine learning. Molecules 2024, 29, 682. [Google Scholar] [CrossRef] [Scilit] [PubMed]
  34. Pedregosa, F.; Varoquaux, G.; Gramfort, A.; Michel, V.; Thirion, B.; Grisel, O.; Blondel, M.; Prettenhofer, P.; Weiss, R.; Dubourg, V.; et al. Scikit-learn: Machine learning in Python. J. Mach. Learn. Res. 2011, 12, 2825–2830. [Google Scholar]
  35. Chu, Y.R.; Jo, M.S.; Kim, G.E.; Park, C.H.; Lee, D.J.; Che, S.H.; Na, C.S. Non-destructive seed viability assessment via multispectral imaging and stacking ensemble learning. Agriculture 2024, 14, 1679. [Google Scholar] [CrossRef] [Scilit]
  36. Rácz, A.; Bajusz, D.; Héberger, K. Multi-level comparison of machine learning classifiers and their performance metrics. Molecules 2019, 24, 2811. [Google Scholar] [CrossRef] [Scilit] [PubMed]
  37. Geurts, P.; Ernst, D.; Wehenkel, L. Extremely randomized trees. Mach. Learn. 2006, 63, 3–42. [Google Scholar] [CrossRef] [Scilit]
  38. Breiman, L. Random forests. Mach. Learn. 2001, 45, 5–32. [Google Scholar] [CrossRef] [Scilit]
  39. Cortes, C.; Vapnik, V. Support-vector networks. Mach. Learn. 1995, 20, 273–297. [Google Scholar] [CrossRef] [Scilit]
  40. Sekeroglu, B.; Ever, Y.K.; Dimililer, K.; Al-Turjman, F. Comparative evaluation and comprehensive analysis of machine learning models for regression problems. Data Intell. 2022, 4, 620–652. [Google Scholar] [CrossRef] [Scilit]
  41. Landis, J.R.; Koch, G.G. The Measurement of Observer Agreement for Categorical Data. Biometrics 1977, 33, 159–174. [Google Scholar] [CrossRef] [Scilit]
  42. Amziane, A.; Losson, O.; Mathon, B.; Dumenil, A.; Macaire, L. Reflectance estimation from multispectral linescan acquisitions under varying illumination—Application to outdoor weed identification. Sensors 2021, 21, 3601. [Google Scholar] [CrossRef] [Scilit] [PubMed]
  43. Reddy, P.; Panozzo, J.; Guthridge, K.M.; Spangenberg, G.C.; Rochfort, S.J. Single seed near-infrared hyperspectral imaging for classification of perennial ryegrass seed. Sensors 2023, 23, 1820. [Google Scholar] [CrossRef] [Scilit] [PubMed]
  44. Ekramirad, N.; Doyle, L.; Loeb, J.; Santra, D.; Adedeji, A.A. Hyperspectral imaging and machine learning as a nondestructive method for proso millet seed detection and classification. Foods 2024, 13, 1330. [Google Scholar] [CrossRef] [Scilit] [PubMed]
  45. Michelon, T.B.; Serra Negra Vieira, E.; Panobianco, M. Spectral imaging and chemometrics applied at phenotyping in seed science studies: A systematic review. Seed Sci. Res. 2023, 33, 9–22. [Google Scholar] [CrossRef] [Scilit]
  46. Lapcharoensuk, R.; Moul, C. Geographical origin identification of Khao Dawk Mali 105 rice using combination of FT-NIR spectroscopy and machine learning algorithms. Spectrochim. Acta A Mol. Biomol. Spectrosc. 2024, 318, 124480. [Google Scholar] [CrossRef] [Scilit] [PubMed]
  47. Bianchini, V.J.M.; Deleu, L.; Barrios, A.M.; de Almeida, W.B. Multispectral and X-ray images for characterization of seed quality: Combining surface and internal tissue information. Plant Methods 2021, 17, 74. [Google Scholar] [CrossRef] [Scilit] [PubMed]
  48. García-Vera, Y.E.; Polochè-Arango, A.; Mendivelso-Fajardo, C.A.; Gutiérrez-Bernal, F.J. Hyperspectral image analysis and machine learning techniques for crop disease detection and identification: A review. Sustainability 2024, 16, 6064. [Google Scholar] [CrossRef] [Scilit]
  49. Zhang, C.; Zhao, G.; Tang, Q.; Zhu, X. Improving small-sample hyperspectral classification using hybrid CNN–Transformer architectures. ISPRS J. Photogramm. Remote Sens. 2023, 199, 166–179. [Google Scholar] [CrossRef] [Scilit]
  50. Sun, H.; Zhang, F.; Yan, H.; He, Y. Detection of rice seed varieties using visible–near-infrared hyperspectral imaging and texture fusion. Infrared Phys. Technol. 2020, 105, 103208. [Google Scholar] [CrossRef] [Scilit]
  51. Yang, Y.; Chen, J.; He, Y.; Liu, F.; Feng, X.; Zhang, J. Assessment of the vigor of rice seeds by near-infrared hyperspectral imaging combined with transfer learning. RSC Adv. 2020, 10, 44149–44160. [Google Scholar] [CrossRef] [Scilit] [PubMed]
Figure 1. Image acquisition system comprising a MicaSense RedEdge-MX multispectral camera mounted above a closed imaging chamber equipped with four 120 W GataPAR-38 halogen lamps positioned at the frame corners, 40 cm above the sample plane. The system captures imagery across five discrete spectral bands (Red, Green, Blue, Near-Infrared, and Red-edge) under four discrete illumination levels (L1–L4: 360.90, 2408.71, 6760.82, and 13,188.46 lx).
Agriengineering 08 00348 g001
Figure 2. Schematic workflow of the multispectral imaging-based rice seed purity classification system, encompassing five sequential stages: Step 1—image acquisition under controlled illumination; Step 2—image processing and feature extraction; Step 3—data preparation and stratified partitioning; Step 4—model development, default-configuration model fitting, and classifier selection; Step 5—external validation and classification output.
Agriengineering 08 00348 g002
Figure 3. Top 10 feature importance scores (of 32 total) derived from the Extra Trees model under L4 illumination (13,188.46 lx), quantified by the Mean Decrease in Impurity (MDI) criterion. Bar colours indicate spectral band origin: blue = Blue (475 nm), green = NIR (840 nm), red = Red (668 nm), orange = Red-edge (717 nm).
Agriengineering 08 00348 g003
Figure 4. Classification results of KDML-105 rice seeds (n = 200 per subset) across five independent test subsets, evaluated using the finalised Extra Trees model. Since all seeds in this evaluation set belong exclusively to the KDML-105 variety, a model with perfect sensitivity would produce exclusively green markers throughout. Green markers indicate seeds correctly classified as KDML-105 (true positives); red markers denote seeds erroneously classified as a non-target variety (false negatives), representing critical misclassification errors in a purity inspection context; white markers represent seeds for which prediction confidence fell below the classification threshold and were therefore withheld from the classification output (unclassified). (a) Test Subset 1; (b) Test Subset 2; (c) Test Subset 3; (d) Test Subset 4; (e) Test Subset 5.
Agriengineering 08 00348 g004aAgriengineering 08 00348 g004b
Figure 5. Classification results of Chainat-1 rice seeds (n = 200 per subset) across five independent test subsets, evaluated using the finalised Extra Trees model. Since all seeds in this evaluation set belong exclusively to the Chainat-1 variety, a model with perfect specificity would produce exclusively red markers throughout. Red markers indicate seeds correctly rejected as non-KDML-105 (true negatives); green markers denote seeds erroneously classified as KDML-105 (false positives), representing critical misclassification errors in a purity inspection context; white markers represent seeds for which prediction confidence fell below the classification threshold and were therefore withheld from the classification output (unclassified). (a) Test Subset 1; (b) Test Subset 2; (c) Test Subset 3; (d) Test Subset 4; (e) Test Subset 5.
Agriengineering 08 00348 g005
Figure 6. Classification results of RD-6 rice seeds (n = 200 per subset) across five independent test subsets, evaluated using the finalised Extra Trees model. Since all seeds in this evaluation set belong exclusively to the RD-6 variety, a model with perfect specificity would produce exclusively red markers throughout. Red markers indicate seeds correctly rejected as non-KDML-105 (true negatives); green markers denote seeds erroneously classified as KDML-105 (false positives), representing critical misclassification errors in a purity inspection context; white markers represent seeds for which prediction confidence fell below the classification threshold and were therefore withheld from the classification output (unclassified). (a) Test Subset 1; (b) Test Subset 2; (c) Test Subset 3; (d) Test Subset 4; (e) Test Subset 5.
Agriengineering 08 00348 g006
Figure 7. Classification results of RD-15 rice seeds (n = 200 per subset) across five independent test subsets, evaluated using the finalised Extra Trees model. Since all seeds in this evaluation set belong exclusively to the RD-15 variety, a model with perfect specificity would produce exclusively red markers throughout. Red markers indicate seeds correctly rejected as non-KDML-105 (true negatives); green markers denote seeds erroneously classified as KDML-105 (false positives), representing critical misclassification errors in a purity inspection context; white markers represent seeds for which prediction confidence fell below the classification threshold and were therefore withheld from the classification output (unclassified). (a) Test Subset 1; (b) Test Subset 2; (c) Test Subset 3; (d) Test Subset 4; (e) Test Subset 5.
Agriengineering 08 00348 g007aAgriengineering 08 00348 g007b
Table 1. Morphological characteristics (mean ± SD) of the four rice seed varieties measured on a subsample of 200 seeds per variety.
VarietyNWidth (mm)Length (mm)Thickness (mm)
KDML-1052002.36 ± 0.1910.06 ± 0.481.58 ± 0.23
RD-152002.27 ± 0.1810.46 ± 0.462.01 ± 0.14
Chainat-12002.37 ± 0.1610.41 ± 0.551.84 ± 0.16
RD-62002.40 ± 0.239.56 ± 0.421.60 ± 0.33
Table 2. Two-way ANOVA results for the main effects of classifier model and illumination level (IL), and their interaction, on four classification performance metrics.
SourceAccuracyRecallPrecisionF1-Score
Fη2Fη2Fη2Fη2
Model133.09 ***0.8472.6930.10115.82 ***0.39733.22 ***0.581
IL4.073 *0.2031.4550.0831.0560.0622.1630.119
Model × IL3.594 **0.312.2770.2220.4930.0583.130 *0.281
R20.862 0.328 0.44 0.656
Note. df = 2, 48 for Model; df = 3, 48 for IL; df = 6, 48 for Model × IL. Each cell comprises n = 60 observations (10 cross-validation folds × 3 classifiers × 4 illumination levels combined). * p < 0.05, ** p < 0.01, *** p < 0.001. η2 = partial eta squared.
Table 5. Evaluation results of the finalised Extra Trees classification model for detecting KDML-105 rice seeds across five independent test subsets (n = 200 per subset). Bold “Average” denotes the mean row.
SubsetKDML-105 Seeds Correctly Classified (True Positives)KDML-105 Seeds Misclassified as Non-Target
(False Negatives)
Unclassified SeedsCoverage
(%)
Accuracy (%)Rejection Rate
(%)
Recall
(%)
11874995.5093.504.5097.91
21902896.0095.004.0098.96
318501592.5092.507.50100.00
418191095.0090.505.0095.26
5163271095.0081.505.0085.79
Average94.8090.605.2095.58
Table 6. Evaluation results of the finalised Extra Trees classification model for detecting Chainat-1 rice seeds across five independent test subsets (n = 200 per subset). Bold “Average” denotes the mean row.
SubsetSeeds Misclassified as KDML-105 (False Positives)Seeds Correctly Identified as non-KDML-105
(True Negatives)
Unclassified SeedsCoverage
(%)
Accuracy (%)Rejection Rate
(%)
Recall
(%)
151671886.0083.509.0091.76
2141671990.5083.509.5092.27
338153995.5076.504.5080.10
45188796.5094.003.5097.41
511762388.5088.0011.5099.44
Average91.4085.107.6092.19
Table 7. Evaluation results of the finalised Extra Trees classification model for detecting RD-6 rice seeds across five independent test subsets (n = 200 per subset). Bold “Average” denotes the mean row.
SubsetSeeds Misclassified as KDML-105 (False Positives)Seeds Correctly Identified as Non-KDML-105
(True Negatives)
Unclassified SeedsCoverage
(%)
Accuracy (%)Rejection Rate
(%)
Recall
(%)
121851393.5092.506.5098.93
21191896.0095.504.0099.48
3151681791.5084.008.5091.80
401861493.0093.007.00100.00
591761592.5088.007.5095.14
Average93.3090.606.7097.07
Table 8. Evaluation results of the finalised Extra Trees classification model for detecting RD-15 rice seeds across five independent test subsets (n = 200 per subset). Bold “Average” denotes the mean row.
SubsetSeeds Misclassified as KDML-105 (False Positives)Seeds Correctly Identified as Non-KDML-105
(True Negatives)
Unclassified SeedsCoverage
(%)
Accuracy (%)Rejection Rate
(%)
Recall
(%)
1491371493.0068.507.0073.66
2461411393.5070.506.5075.40
3701171393.5058.506.5062.57
461130995.5065.004.5068.06
5771041990.5052.009.5057.46
Average93.2062.906.8067.43
Disclaimer/Publisher’s Note: The statements, opinions and data contained in all publications are solely those of the individual author(s) and contributor(s) and not of MDPI and/or the editor(s). MDPI and/or the editor(s) disclaim responsibility for any injury to people or property resulting from any ideas, methods, instructions or products referred to in the content.