1. Introduction
Oil palm is a major economic crop for Thailand, which ranks as the 3rd largest palm oil producer in the world [
1]. Palm oil is an important industrial raw material used for both human consumption, particularly household cooking oil, and industrial manufacturing applications. Oil palm cultivation is widely preferred by farmers in Thailand, particularly in the southern region, due to the high economic return compared with other agricultural activities. However, determining the optimal harvest time remains a major challenge for farmers. The quality and quantity of crude palm oil (CPO) extracted from fresh fruit bunches (FFB) depend strongly on harvest timing. Under-ripe bunches produce oil with high free fatty acid (FFA) content, while over-ripe bunches increase FFA formation during transport, which reduces extraction efficiency and market value [
2,
3]. Therefore, the accuracy of ripeness grading upon receipt is critical to the processing quality and profitability of the plantation. Conventionally, FFB ripeness grading is performed by trained inspectors who visually evaluate FFBs based on fruit color, surface texture, and loose fruitlet count. This manual process is inherently subjective, time-consuming, and variable between inspectors.
Therefore, automated machine vision systems have been proposed as efficient alternatives to manual FFB grading. Ref. [
4] reviewed non-destructive FFB ripeness classification methods, including spectroscopy, thermal imaging, LiDAR, and computer vision, and concluded that computer vision is the most practical approach due to its cost efficiency and compatibility with existing mill infrastructure. Recently, Convolutional neural networks (CNNs) have been demonstrated as computer vision-based approaches that achieve high performance in image classification. In modern agricultural applications, CNN-based approaches have been widely adopted for fruit ripeness classification, including banana ripeness classification [
5], tomato ripeness classification [
6], and general fruit ripeness assessment [
7]. In addition, the application of deep learning to oil palm FFB ripeness detection has been systematically reviewed by [
8]. They surveyed 51 studies covering 11 distinct approaches and concluded that computer vision combined with deep learning is the most feasible method for field deployment.
However, to deliver in the real-world ripeness grading system, it requires not only high accuracy but also efficient computation. Mill reception ramps, especially those operated by smallholder cooperatives, are often remote facilities with limited computational infrastructure and no reliable access to cloud services. The classification system must therefore operate on local edge-computing hardware, requiring limited memory, low computational cost, and short inference time to support near-real-time FFB ripeness grading under field conditions. A recent review of deep learning for fruit image analysis by [
9] similarly identified lightweight model design and limited labelled data as two major challenges for practical agricultural deployment.
Several prior works have explored lightweight CNN architecture to develop an automated grading system under constrained resources. MobileNet and EfficientNet-based models were evaluated in [
10]. MobileNetV3 was also demonstrated for a four-class FFB dataset and achieved 91.5% accuracy in [
11]. In addition, a compact custom CNN was presented in [
12] for FFB classification with an accuracy of 81.25%. These results show that lightweight CNN architectures can provide feasible performance for practical FFB grading systems. More recently, the You Only Look Once (YOLO) framework has been adapted to FFB classification tasks [
13]. Although YOLO variants were originally designed for object detection [
14], they can deliver competitive accuracy with low inference time on small devices. Therefore, YOLO-based approaches are potential models for real-time deployment in limited operating environments, including palm oil reception ramp stations [
15,
16,
17,
18].
Class imbalance is another critical challenge in real-world FFB classification. Under practical intake conditions, especially at the ramp reception, ripe and under-ripe bunches often occur more frequently than other classes because they are ready for oil production. As a result, field-collected FFB datasets are generally imbalanced. Nevertheless, rarely observed bunches, such as the over-ripe grade, are still important for quality control [
3,
19]. Low classification performance on minority ripeness classes may then decrease grading reliability and affect downstream processing quality.
Several techniques have been proposed to resolve imbalanced image datasets, including a classic augmentation with photometric and geometric transformations [
20], synthetic oversampling [
21], and generative augmentation [
22]. However, these existing methods may not always provide sufficient minority class diversity for field-based FFB images where ripeness related visual patterns are influenced by illumination variation, viewing angle, occlusion, background complexity and natural color differences. In addition, a recent survey of class imbalance methods in agricultural image datasets [
23] notes that data-level and algorithm-level approaches remain under-investigated in combination.
For this reason, this study aims to develop a lightweight FFB ripeness classification framework designed specifically for resource-limited palm ramp reception environments. The proposed system utilizes field-collected FFB images for training. A class-aware augmentation strategy is proposed to address class imbalance in real field-collected dataset. Based on the research problem described above, this study hypothesis that combining intra-class mixing with classic geometric transformation can improve minority-class recognition in imbalanced oil palm FFB ripeness classification while maintaining the computational efficiency required for lightweight model development under resource-constrained deployment conditions. The specific objectives are presented as follows:
To establish a four-class oil palm FFB dataset collected under unconstrained mill-ramp conditions, with natural illumination variation, multiple viewing angles, and ripeness labels validated by trained industry grading experts.
To propose and evaluate a class-aware intra-class half-mixing augmentation strategy combined with geometric transformation to improve minority-class recognition in imbalanced field-collected FFB data.
To evaluate and compare multiple lightweight deep learning architectures under different augmentation strategies, considering both classification performance and computational characteristics, in order to identify promising backbones for future deployment on resource-constrained edge platforms at mill reception stations.
2. Materials and Methods
2.1. Dataset
2.1.1. Data Collection and Production
A dataset of oil palm FFB images was assembled under varied field illumination conditions and bunch orientations representative of plantation harvest conditions. All images were captured at a fixed distance of 1–1.5 m using smartphone camera (iPhone 13 Pro) to simulate conditions representative of data acquisition by the mill reception ramp. We employed three collectors who captured the palm bunch images equally to reduce the bias of collecting images. Images were captured at the center of each palm bunch and only one main palm bunch per image. To incorporate variability in lighting conditions, images were collected at different times of day including morning at 10.00–12.00 and evening at 16.00–18.00 over one week. The dataset was collected from an oil palm ramp located in Khlong Thom District, Krabi Province, Thailand at the geographic coordinates of 7.892781° N, 99.115334° E.
After the data collection process, the annotation task was performed by three trained FFB grading experts who were workers from the palm ramp. Each image was reviewed by the three evaluators based on their practical grading experience. When disagreement occurred among the evaluators, the image was re-examined and discussed collectively, and the final ground-truth label was assigned through consensus discussion.
The original independent annotations from each grader were not retained after the consensus labeling process. Consequently, inter-rater agreement statistics, such as Cohen’s Kappa, could not be calculated retrospectively. Although the consensus labeling procedure was adopted to establish the final ground-truth labels, the absence of the original independent annotation records prevented quantitative validation of annotation reliability.
The dataset comprised 857 total images distributed across four ripeness classes including Over-ripe, Ripe, Under-ripe, and Unripe.
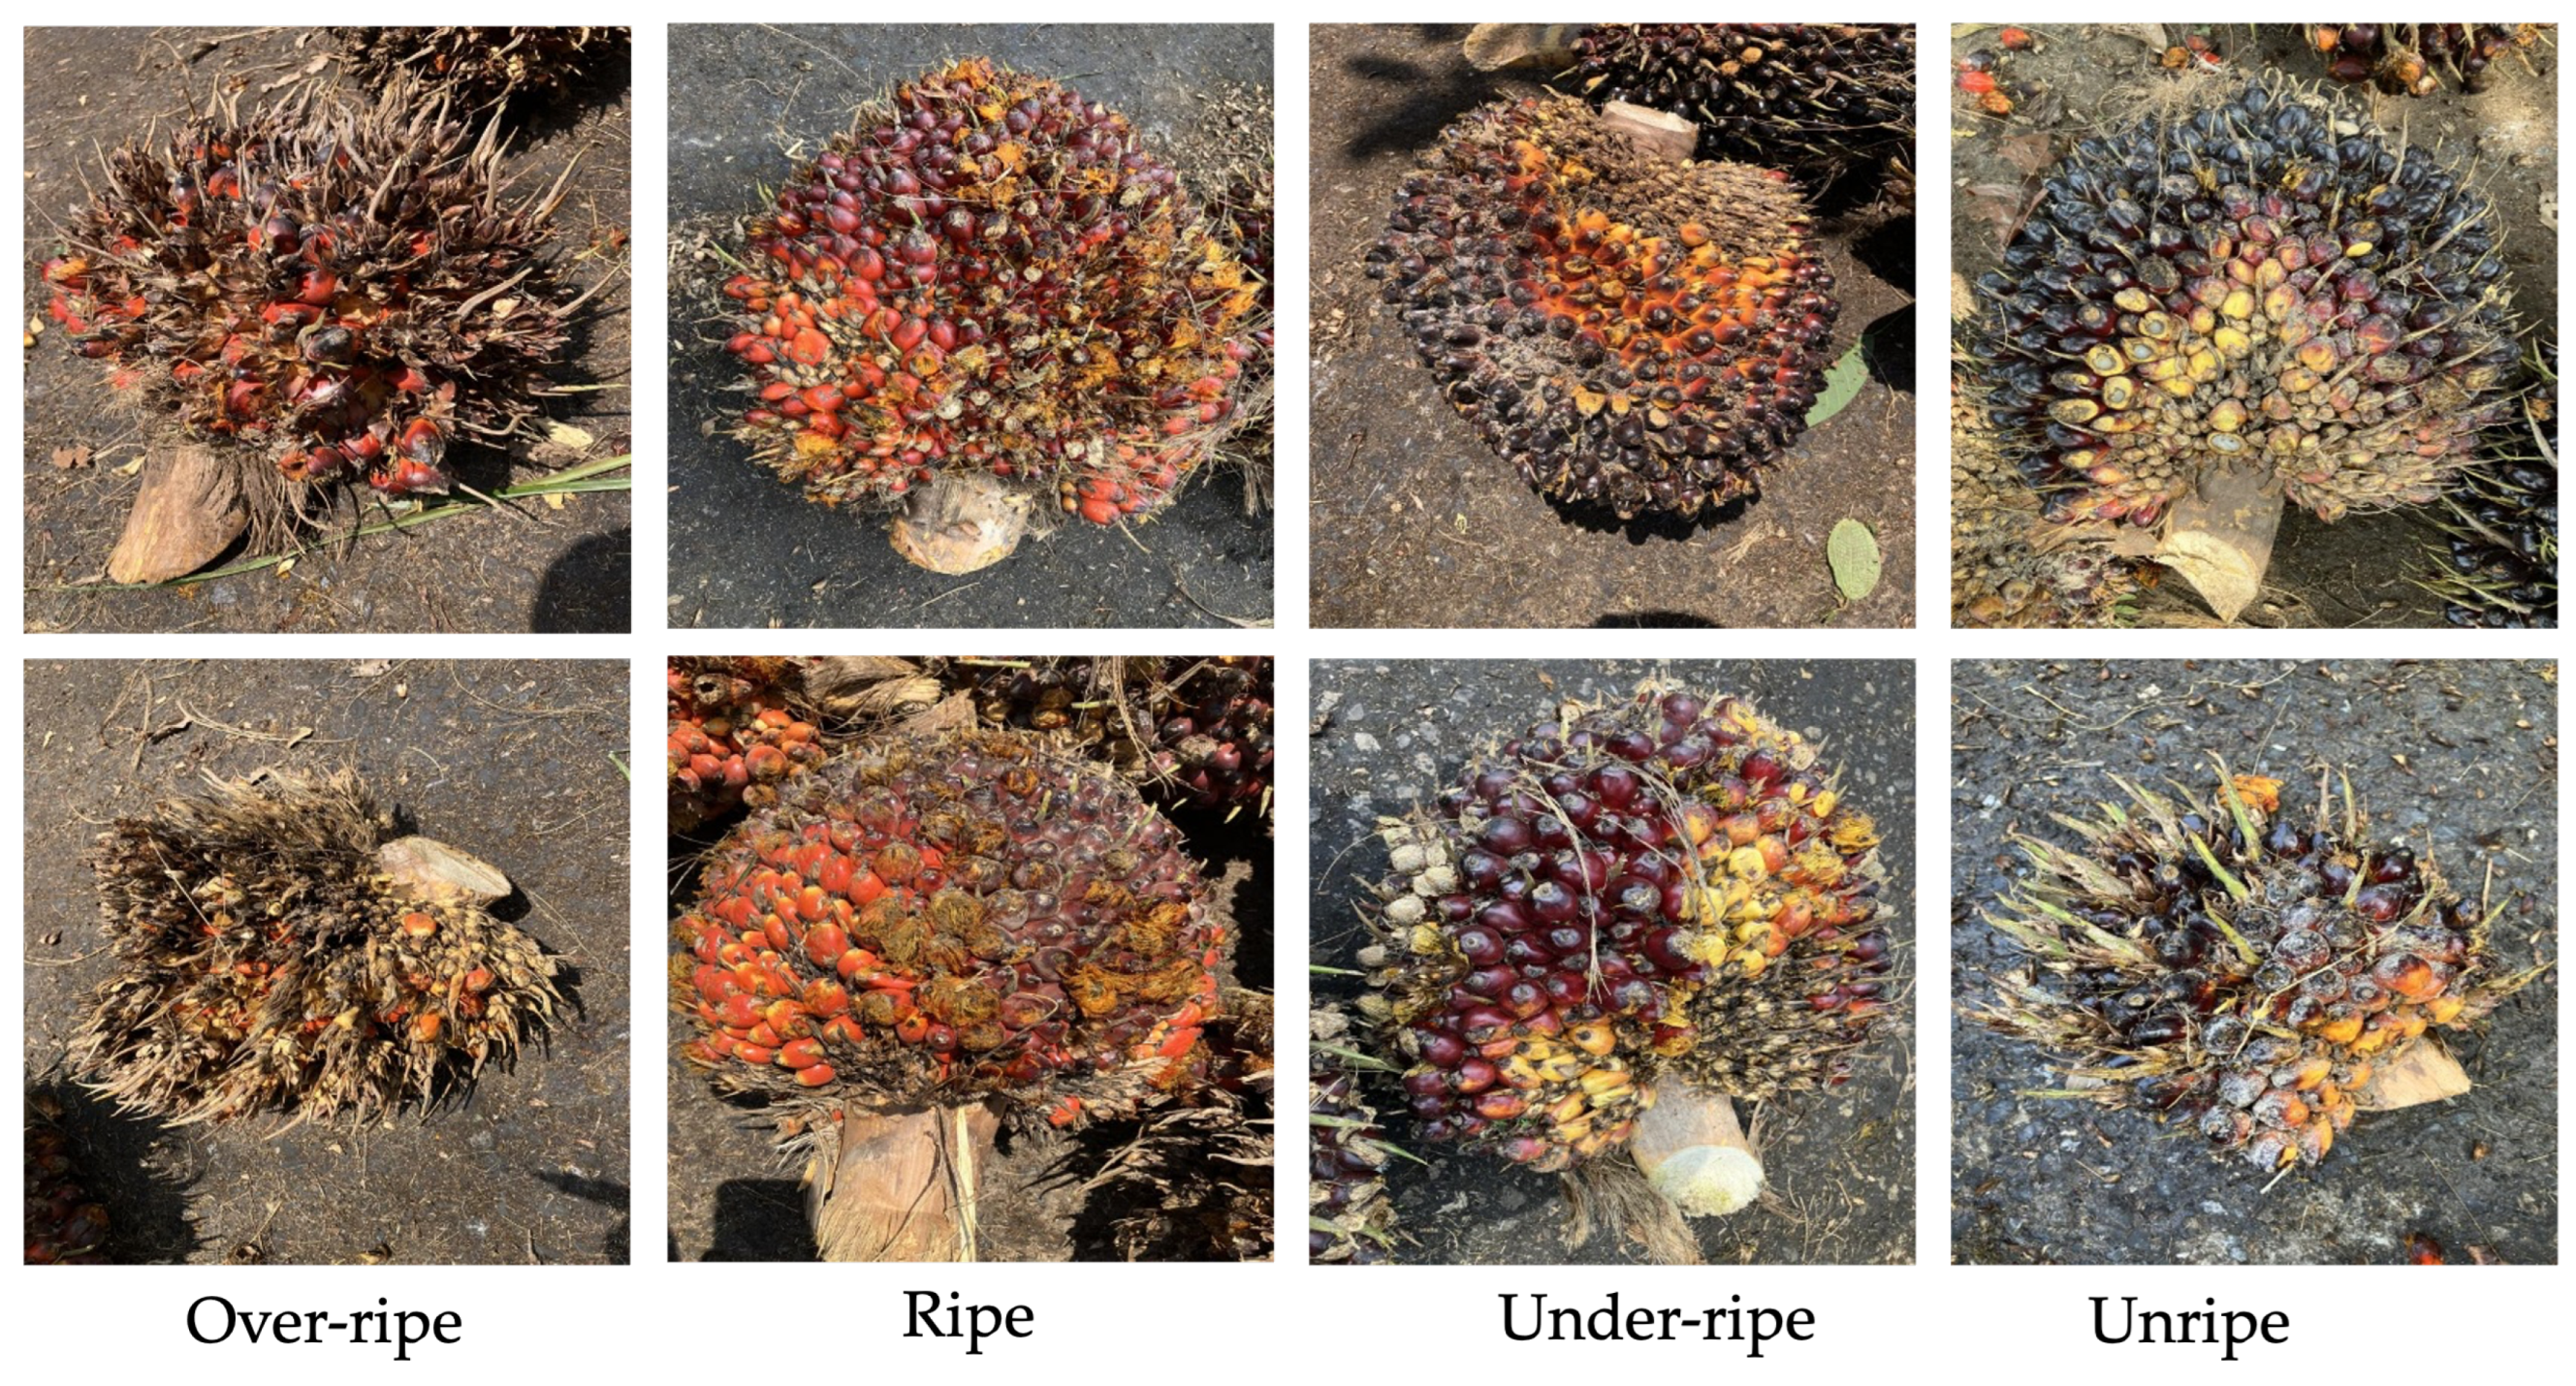
Figure 1 presents an example of palm bunch images of each ripeness class. The dataset was partitioned into training, validation, and test splits following a stratified 70/20/10 ratio.
Table 1 summarizes the class distribution.
In real-world environments, the number of images for each ripeness level is not equal. The data was collected from a palm ramp where most of the palm bunch are at the Ripe or Under-ripe stage. The farmers harvest the FFB when the ripeness levels are Ripe or Under-ripe only. Thus, the sample of Over-ripe and Unripe are rarely found in the palm ramp reception. In addition, most local farmers tend to collect the palm bunch in the under-ripe state to prevent the palm bunch from reaching the over-ripe stage due to long harvesting process and transport the bunches to the palm ramp. For this reason, our dataset exhibits a class imbalance which we will address in this proposed work.
2.1.2. Class Imbalance Characterization
To observe the class imbalance in our dataset, we adopt the imbalance ratio (IR), which computes the ratio of the number of minority class relative to the other classes.
Table 2 presents the imbalance ratio (IR) relative to the minority class (Over-ripe).
The results show that the imbalance ratio between the majority class (Under-ripe, ) and the minority class (Over-ripe, ) was 3:1. The IR value also reveals that the Over-ripe sample size is lower compared to Ripe and Unripe classes by factors of 2.1× and 1.6× respectively. In addition, we can observe that the sample counts of Ripe and Unripe classes are approximately 2× lower than the Under-ripe class.
2.2. Data Augmentation Techniques for Class Imbalance
2.2.1. Photometric and Geometric Transformations
Photometric and Geometric transformations (PG) have become standard data augmentation strategies to improve dataset generalization. The photometric augmentation applies color-space modifications to images such as brightness adjustment, contrast modification and color jittering [
24]. The geometric transformations are rotation, flipping, scaling, cropping and affine transformations [
25].
However, traditional PG has limitations when dealing with severely imbalanced datasets [
26]. The transformations are constrained by the manifold of the original data, which can result in a limited diversity of augmented samples [
27,
28]. For this reason, traditional augmentation paired with more sophisticated generative approaches is presented in this work.
2.2.2. Image Mixing-Based Methods
Several works have adopted cut-paste-based methods to generate training samples for models to learn smoother decision boundaries and improve generalization. CutMix [
29] replaces a rectangular region of a training image with the corresponding region from a second image and blends the labels proportionally to the area ratio. Using an enhanced CutMix approach, ref. [
30] achieved an average performance increase of 1.5% compared to alternative methods. Mixup [
31] method performs pixel-level linear interpolation between two samples with proportional label blending. In a similar approach, [
32] integrated a Mixup strategy with diffusion model-generated synthetic images, achieving a 7.9% performance improvement over existing methods.
In our domain, ripeness levels are classified by evaluating the global appearance of the FFB. However, a single FFB often consists of different levels of ripeness. For instance, an FFB may be globally classified as Ripe even though some parts of the bunch are still under-ripe. For this reason, in a fine-grained task such as ripeness grading where adjacent classes (e.g., Ripe and Over-ripe) share similar visual features, cross-class mixing can produce ambiguous composite images that harm inter-class boundary learning.
2.2.3. Boosting Augmentation with YOCO
The YOCO (You Only Cut Once) [
33] framework addresses the label-ambiguity issue of CutMix by implementing the augmentation on only one half of the image. YOCO addresses this issue by relocating transformations to the half-image level while maintaining strict adherence to label preservation. The YOCO augmentation technique is illustrated in Equation (
1).
where
,
denotes the YOCO output,
denotes an augmentation function, and
and
denote the left (or top) and right (or bottom) halves, respectively.
The algorithmic pipeline of the YOCO framework proceeds through the following sequential operations:
The halving step: Given an input image , YOCO selects a random split axis and then cut down the middle into two equal halves ( and ).
Independent augmentation: The exact same underlying augmentation function (e.g., color jitter, random erasing) is called independently on the two halves.
Concatenation: The halved samples are stitched back together using the concatenation operator (‖). Because the content originates entirely from the same parent image, the label of remains identical to that of , as YOCO is strictly label-preserving.
2.3. Proposed Method: Intra-Class Half-Mixing with Geometric Augmentation
Palm bunches exhibit varied color across their surface regions. Applying photometric augmentation alone does not capture the structural diversity of real palm bunches. YOCO augmentation produces samples that better reflect the natural surface variation of palm bunches. However, our dataset exhibits a high class imbalance that photometric-geometric augmentation or standard YOCO alone may not adequately address. For this reason, we propose an intra-class half-mixing strategy inspired by YOCO with geometric augmentation to generalize the dataset and address the class imbalance problem. The core novelty of this work is built upon two sequential components: intra-class YOCO mixing and additional geometric transformation.
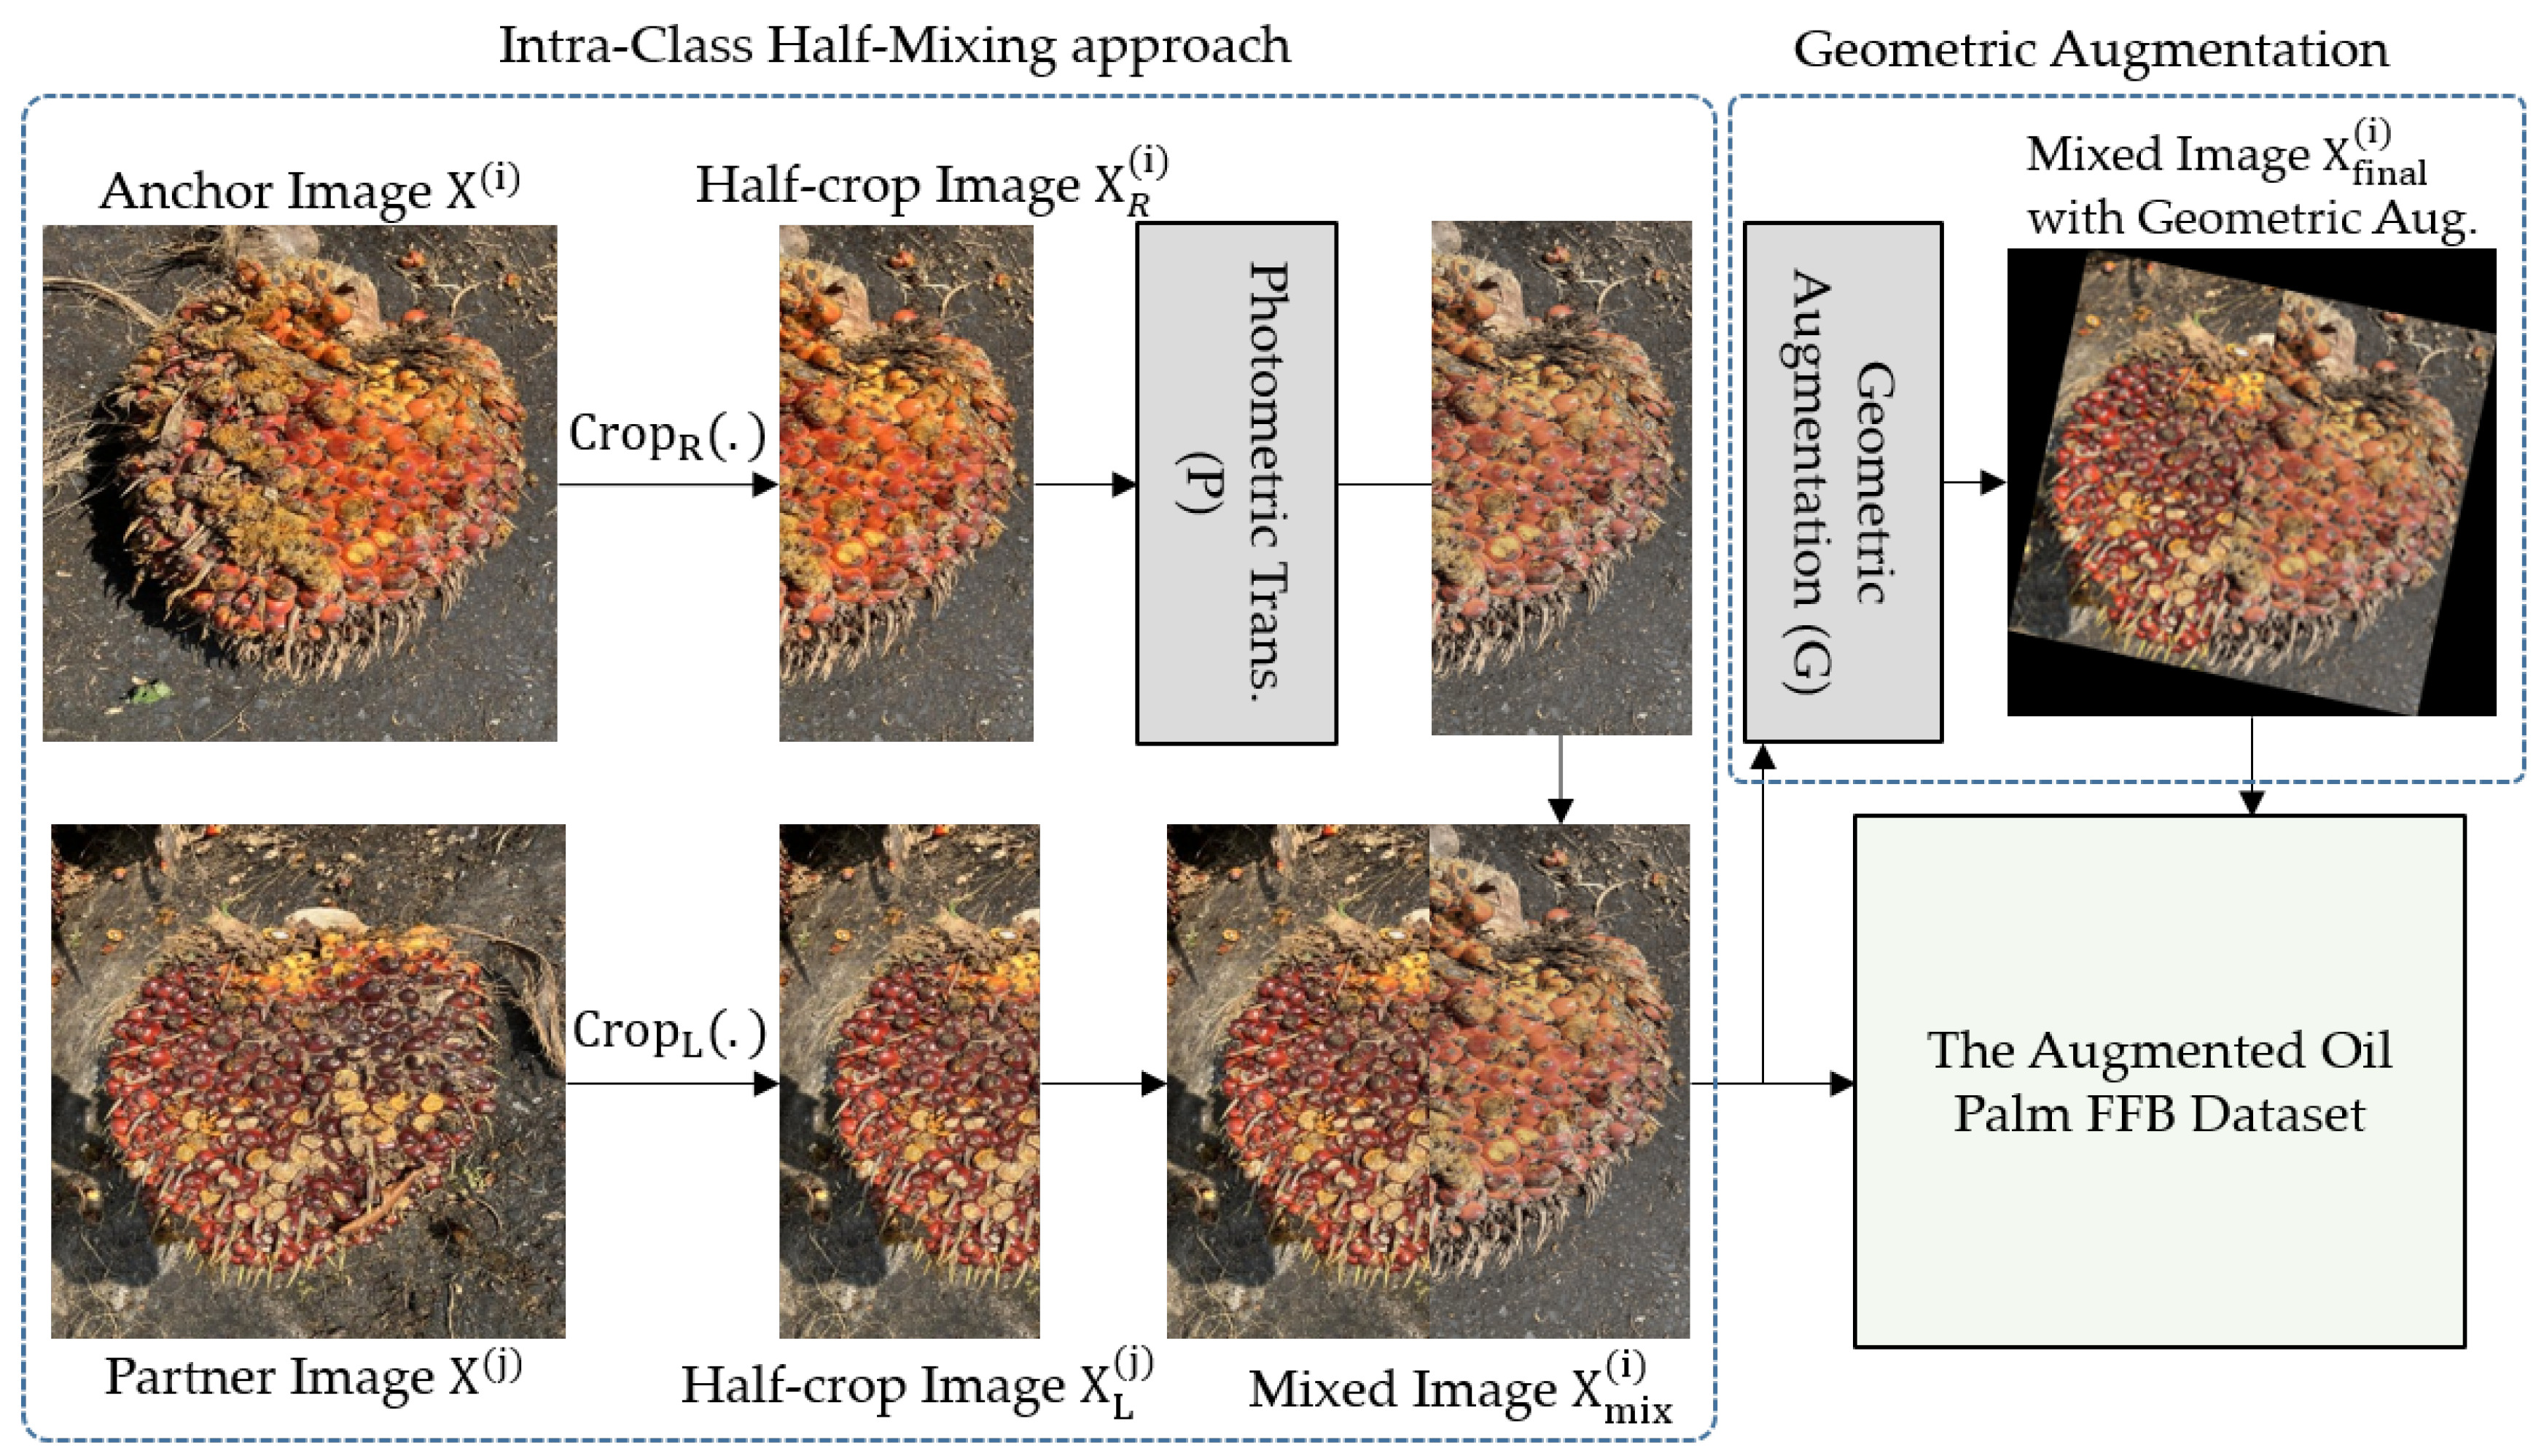
Figure 2 illustrates an overview of the proposed augmentation mechanism.
2.3.1. Component 1: Intra-Class Half-Mixing Strategy
Whereas standard YOCO applies an augmentation function
to one half of the same image (Equation (
1)), our proposed variant introduces an intra-class patch-swapping mechanism. Instead of transforming the pixels of the anchor image, this component replaces one half of the image with a random crop taken from a different image of the exact same category.
Formally, let
be the anchor training sample. A mixing partner
is then randomly selected from all other images belonging to the same class. This is defined as sampling uniformly from the subset
(All training images of the same class excluding the anchor). This proposed mechanism ensures label preservation without requiring mathematical label smoothing methods. The proposed mechanism when applying a vertical cut can be written as Equation (
2).
where
denotes the photometric augmentation function,
denotes the final augmented hybrid image tensor,
represents the current anchor training image,
is the intra-class mixing partner image,
is the left (or top) or right (or bottom) half-crop of the designated regions, and
q denotes the mixing probability hyperparameter where
.
For convenience of notation, the subscripts L and R explicitly denote the left and right halves of the image when a vertical split axis is used, but correspond symmetrically to the Top and Bottom halves, respectively, when a horizontal split axis is applied. The proposed framework evaluates a three-way probabilistic policy for each anchor image to balance structural context variation with localized feature transformations. The three possible outputs of the proposed work using vertical split axis are presented as follows:
Left-side patch swap case (): The left side of the anchor image is substituted with an intra-class crop , while a photometric transformation is applied to the remaining right bisection .
Right-side patch swap case (): This case applies photometric distortion to the left half while swapping the right half with .
Fallback case: This case serves as a baseline single-image policy. It defaults to , which applies the photometric function to only one half of the isolated anchor image.
By setting the mixing parameter to , the framework allocates a combined probability to intra-class patch-swapping operations ( for substituting the left region and for the right region). The remaining probability () acts as a fallback mechanism that defaults to standard single-image processing.
2.3.2. Component 2: Geometric Augmentation
The component 1 synthesizes variations to enhance the overall diversity of the training dataset. However, only photometric transformations are applied, which may not accurately depict real-world data that features a variety of viewing angles. In addition, the first step creates an artificial vertical or horizontal boundary line through the middle, and deep neural networks might accidentally learn that harsh line as a feature of the dataset.
For this reason, we adopt geometric augmentation in this stage to force the network to disregard the synthetic seam and focus entirely on the visual content of the two mixed halves. The mathematical formulation of this component is expressed in Equation (
3).
where
denotes the final transformed output image tensor,
represents the output tensor from the first component, and
denotes an affine transformation parameterized by a random rotation angle
and a spatial scaling factor
s.
Specifically, the intermediate tensor is subsequently passed through this geometric augmentation stage. The transformation parameters are stochastically sampled, where the rotation angle is drawn from a uniform distribution and the spatial scaling factor follows .
Functionally, this subsequent geometric warping serves two critical architectural purposes. It exposes the network to variations in object orientation and scale. In addition, this method effectively perturbs the rigid, artificial bisection boundaries introduced during the first component. By rotating and scaling the composite seam, this geometric regularization prevents the deep layers from optimizing for localized stitching artifacts, thus forcing the model to extract more generalized semantic representations. This two-stage design is motivated by the real-world data collection setting, where palm FFB images naturally show variation in color and texture among different bunch instances of the same ripeness stage, and in viewing angle and scale.
2.4. Data Augmentation Results
2.4.1. Augmentation Configuration Summary
To evaluate the efficacy of our proposed work, we conduct multiple experiments utilizing different augmentation techniques.
Table 3 provides the detailed specifications for each augmentation configurations evaluated in this work.
The baseline configuration (E0) applies no augmentation beyond mandatory spatial resizing to , serving as the reference point against which all subsequent configurations are measured.
E1 applies standard geometric and photometric transformations independently to each training image. Geometric operations include random horizontal and vertical flipping, rotation , and scaling . Photometric operations include color jittering (brightness and contrast ± 0.2, saturation ± 0.1, hue ± 0.05) and Gaussian blurring (, applied with probability ). All operations are applied to the full image without any region-based or cross-image mixing.
E2 applies CutMix through uniform sampling of image pairs. A rectangular patch of size , where , is cropped from a randomly selected image and pasted onto the anchor image. The resulting composite is assigned the label of the image occupying the larger pixel area. This allows training with a single hard label and standard cross-entropy loss.
E3 applies the baseline YOCO framework [
33] per image. The image is divided into two equal spatial halves along a randomly chosen axis, and independent photometric and geometric transformations are applied to one bisection half while the other is left unmodified. Because both halves originate from the same source image, the original label is preserved exactly.
E4 extends the half-splitting procedure of E3 by replacing the target bisection half with a half-crop from a randomly selected partner image belonging to the same ripeness class, following Equation (
2). As both halves of the resulting composite belong to the same class, the label is retained without any blending. E4 is therefore strictly label-preserving despite drawing visual content from two distinct images.
E5, the proposed method, applies a global geometric transformation after the E4 intra-class mixing step, as defined in Equation (
3). The composite image is randomly rotated by up to
and scaled. This additional stage reduces the visibility of the artificial stitching boundary introduced by half-image mixing. Consequently, it prevents the model from learning the stitching boundary as a spurious spatial feature while preserving label consistency.
2.4.2. Augmented FFB Ripeness Dataset
Table 4 reports the per-class sample counts in the training split for each configuration, the total number of training samples, and the maximum imbalance ratio (IR), which is calculated as the ratio of the largest to the smallest class count.
The results show that E1, E2, and E3 retain the original baseline imbalance (), as these configurations apply augmentation randomly across all classes with fixed multipliers of , , and , respectively. On the other hand, E4 and E5 generate synthetic images that are able to upsample minority classes by leveraging a class-aware augmentation strategy rather than a uniform multiplier.
For E1 and E3, two augmented copies are generated per original image and saved alongside the originals, resulting in a uniform
multiplier for every class. For E2, one mixed copy is generated per original image, producing a uniform
increase. For E4, the number of mixed copies per original image is determined class-specifically by Equation (
4).
where
is the baseline training count of class
c and
is the count of the majority class (Under-ripe,
).
The total number of samples for class
c after E4 augmentation is calculated as
. Applying Equation (
4) to the baseline class counts in
Table 1 yields
for Over-ripe, 1 for Ripe and Unripe, and 0 for Under-ripe. These values produce class-specific multipliers of
,
,
, and
for Over-ripe, Ripe, Under-ripe, and Unripe, respectively. For E5, the geometric augmentation stage copies every image already in the E4 dataset and generates one additional variant per image, exactly doubling the E4 sample count and yielding per-class multipliers of
,
,
, and
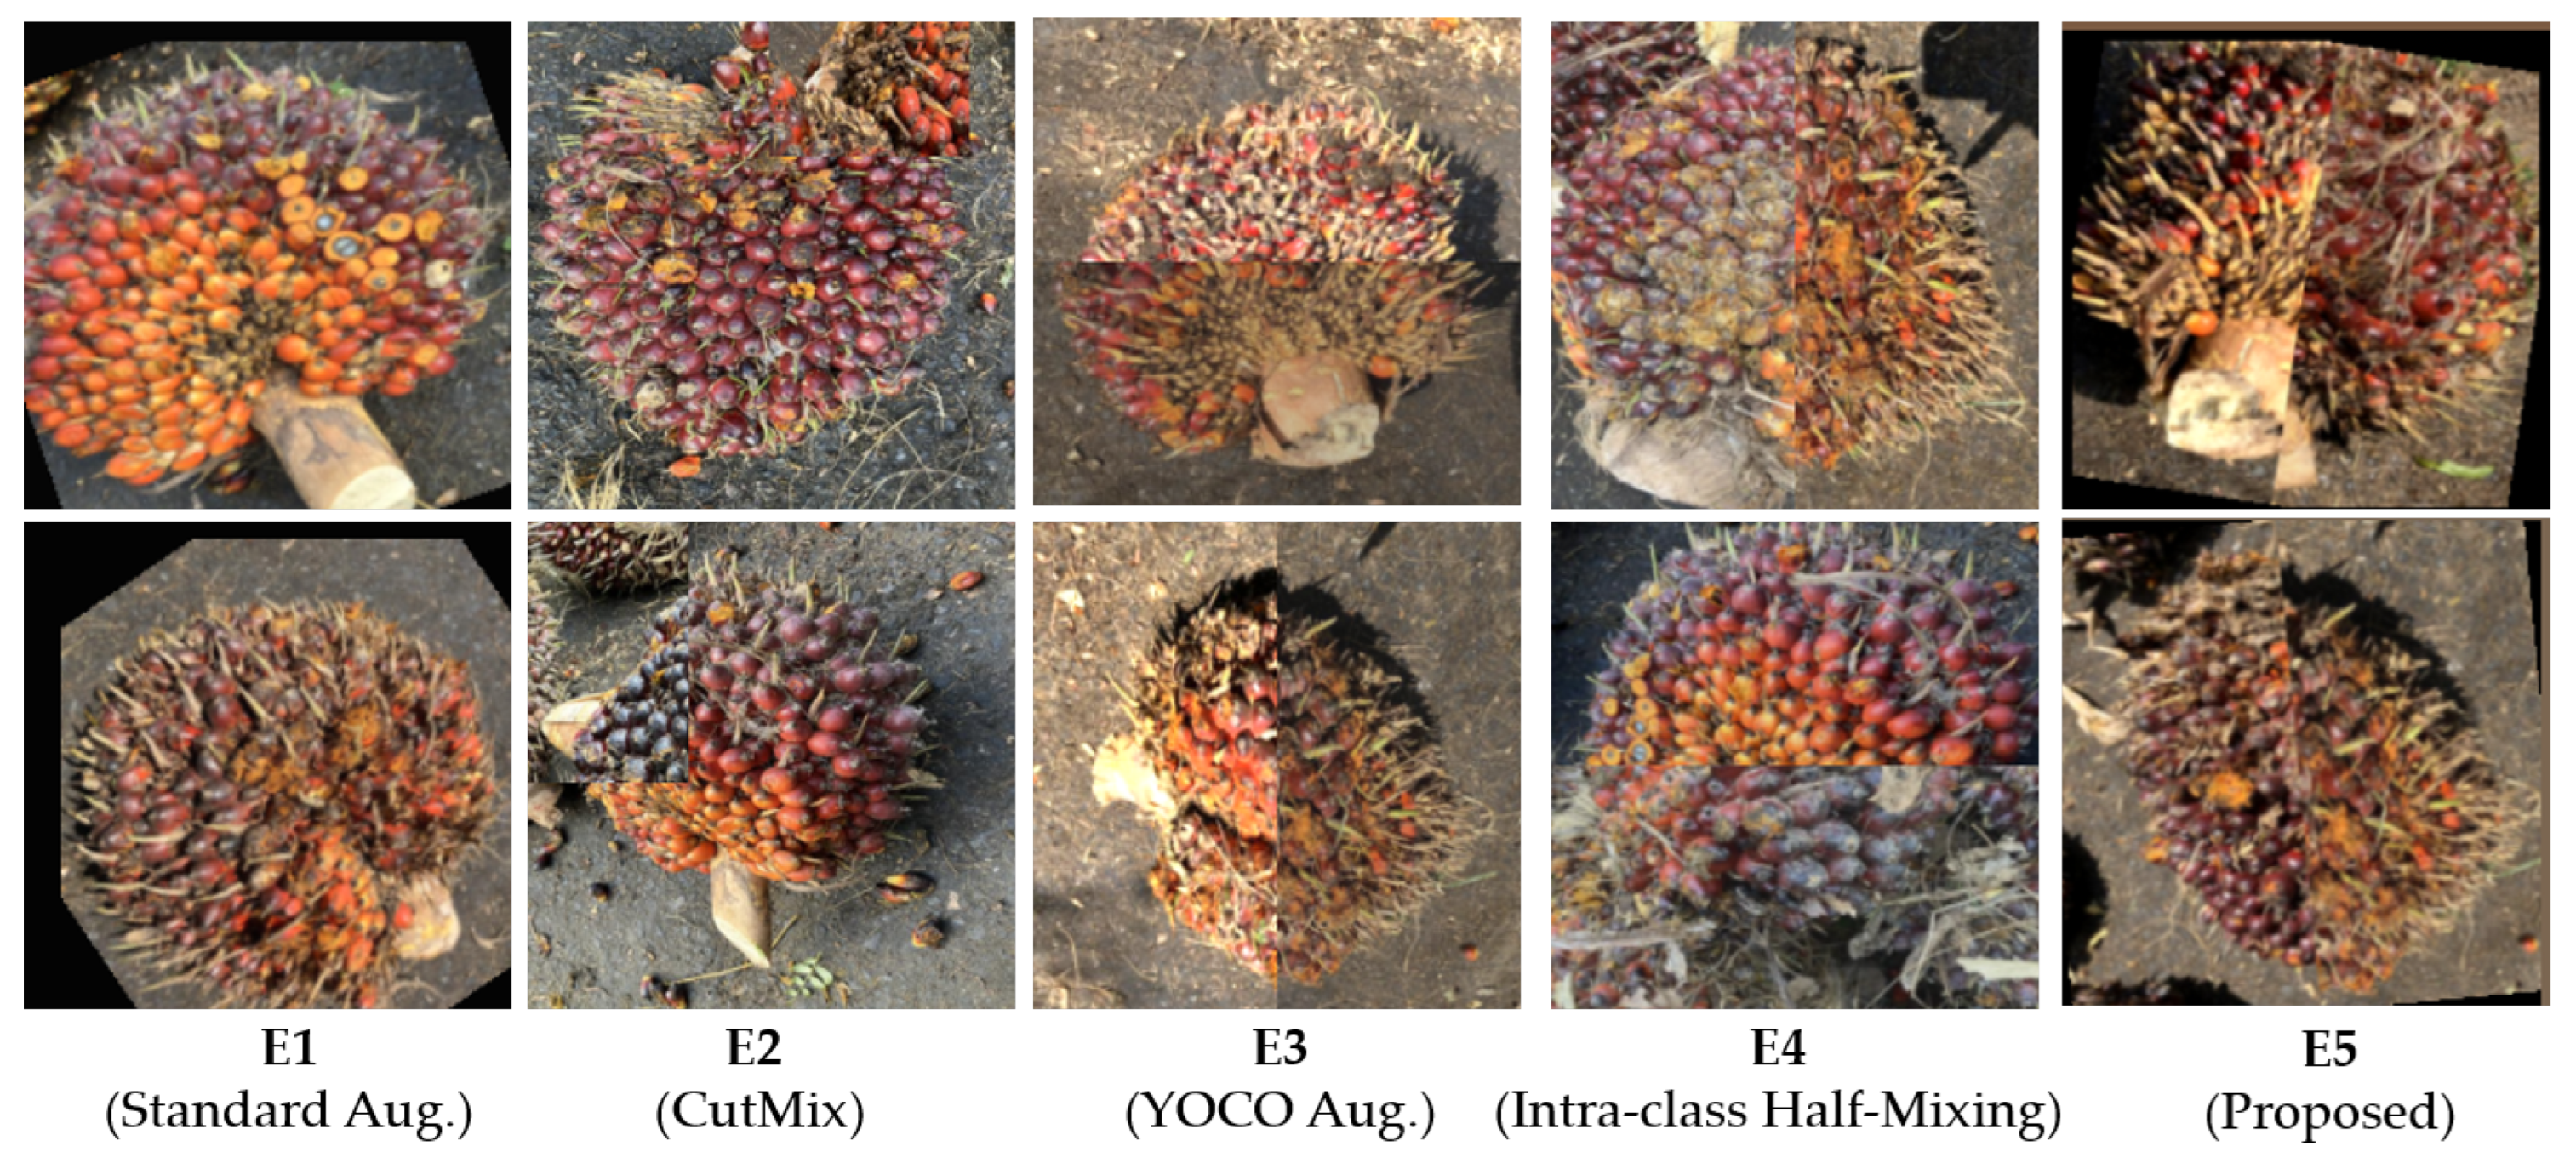
for Over-ripe, Ripe, Under-ripe, and Unripe respectively. An overview of the training samples produced by our augmentation strategies is illustrated in
Figure 3.
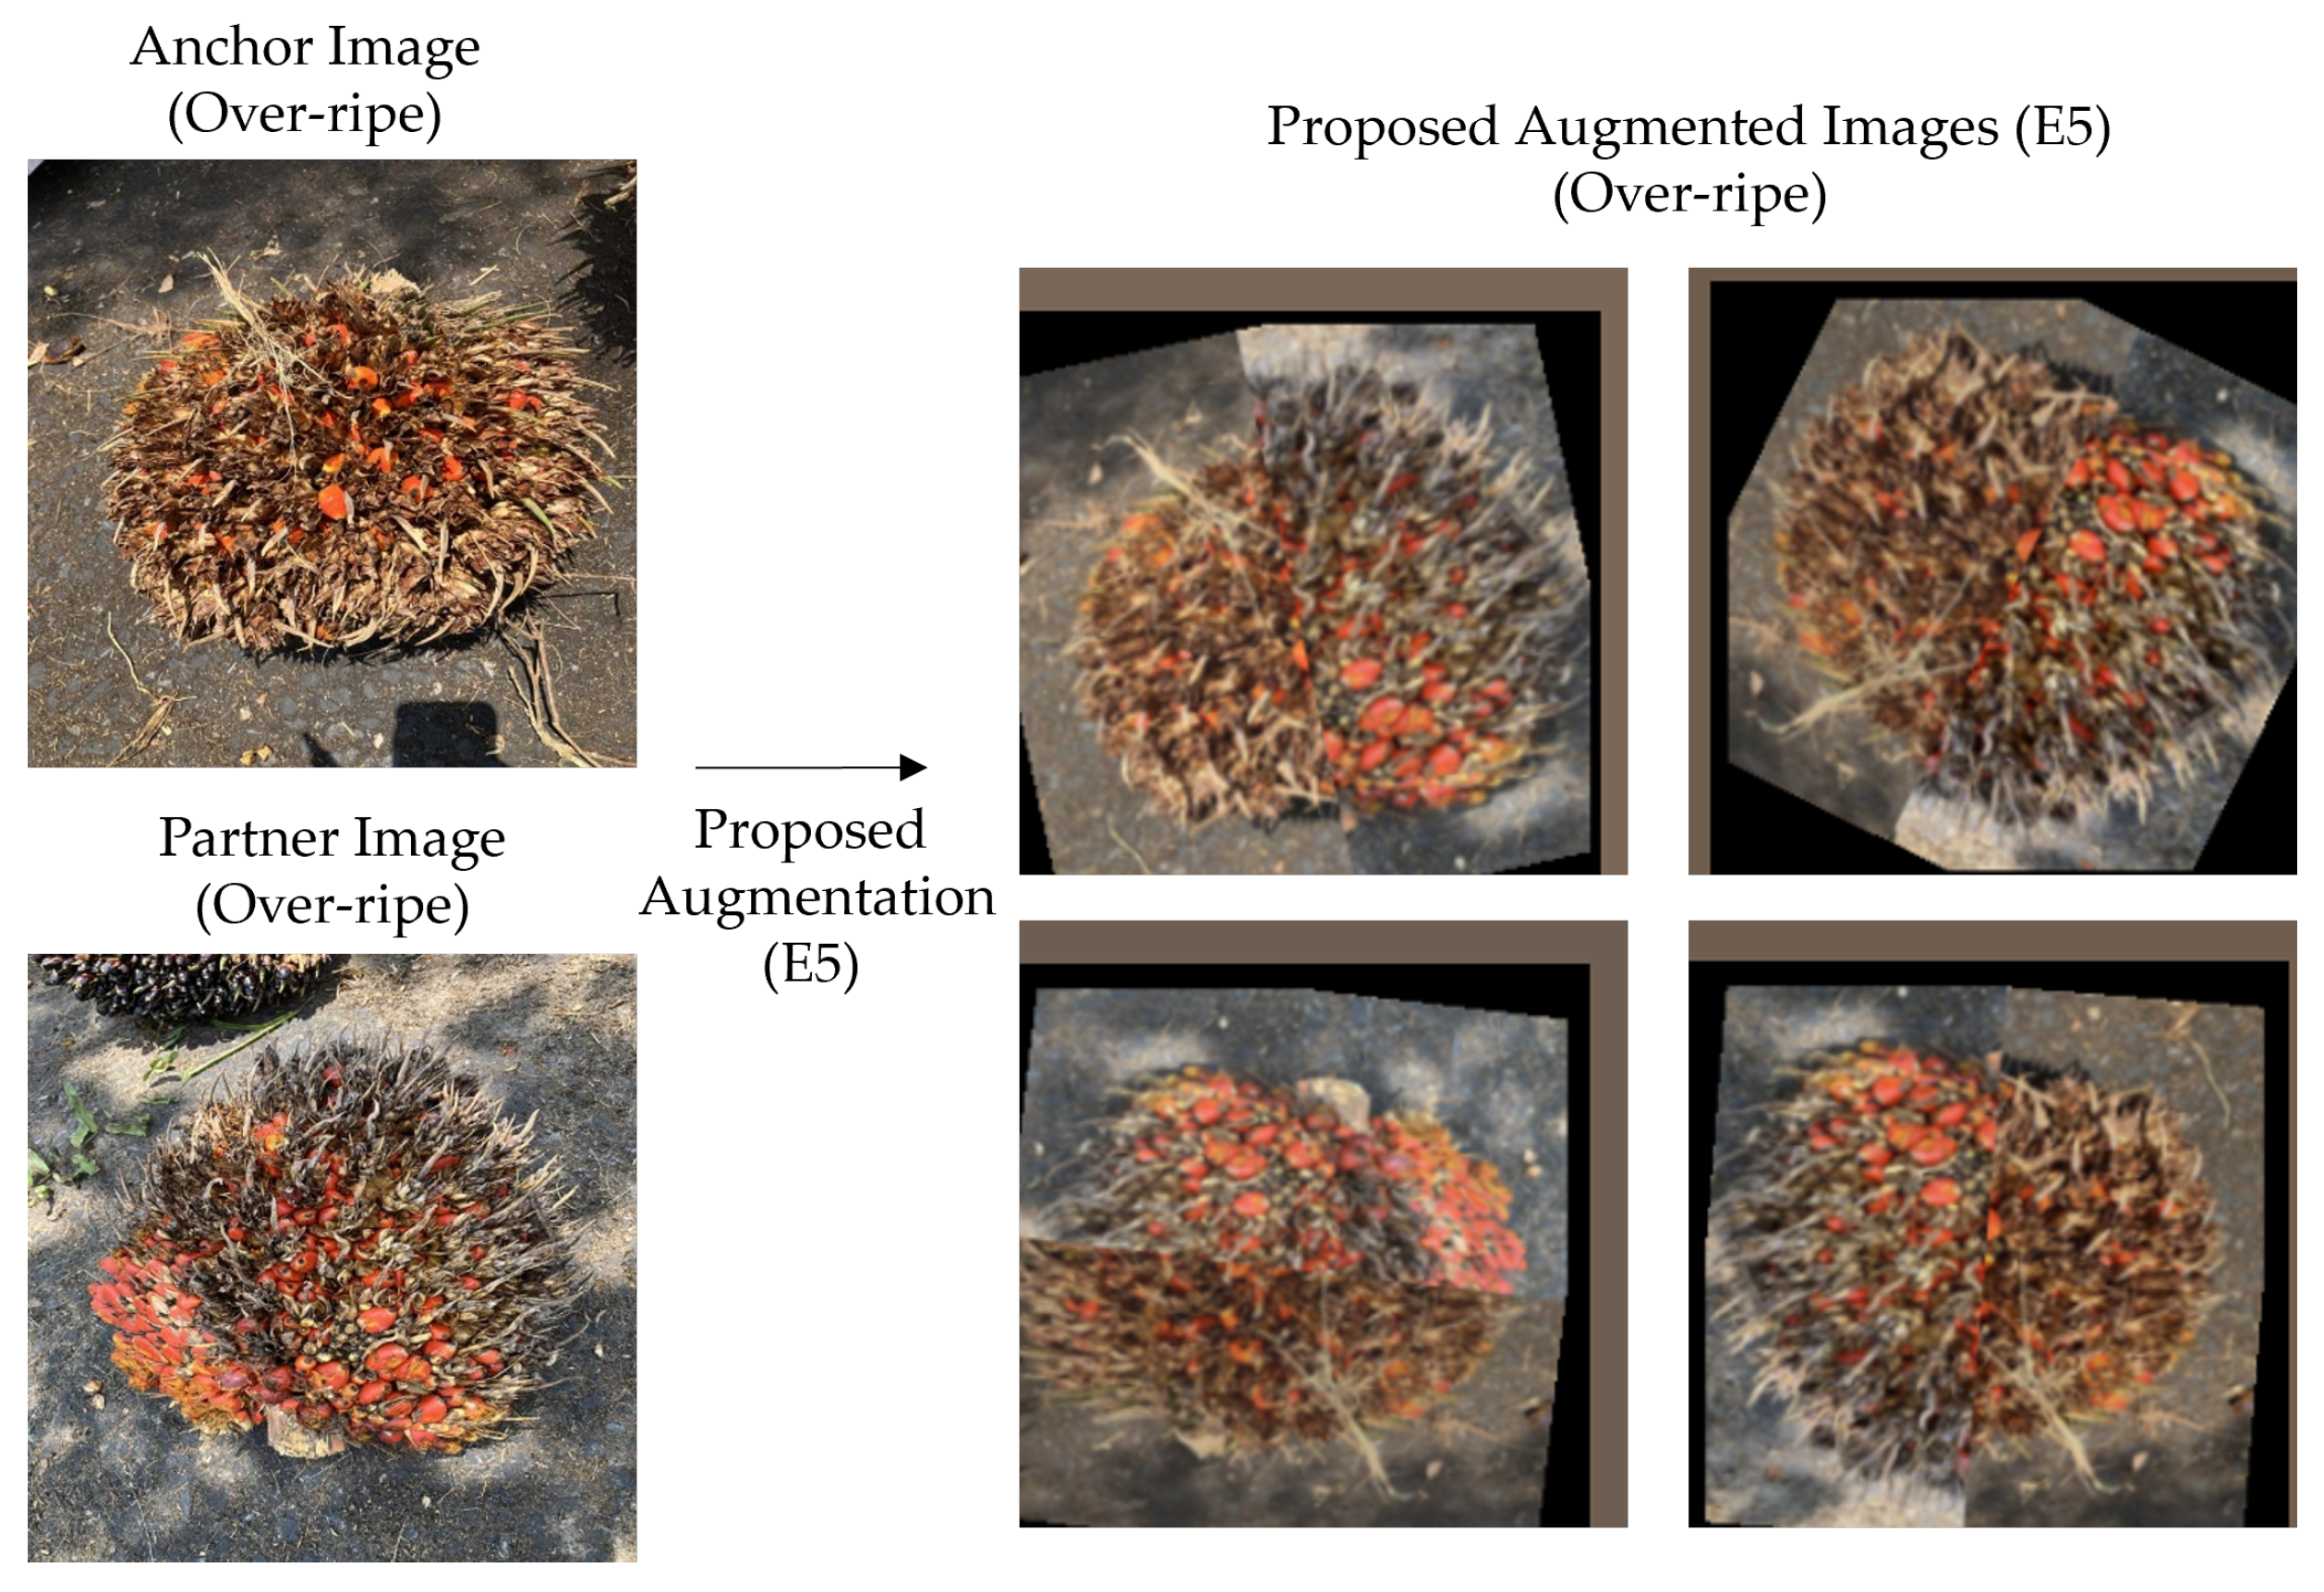
Figure 4 illustrates the proposed E5 augmentation applied to two actual Over-ripe (minority class) training images from the collected dataset. The anchor and partner images were captured under different illumination conditions and viewing angles, representing the natural visual variability present within the minority class.
The four generated composites demonstrate how E5 combines spatial regions from two distinct Over-ripe instances through intra-class half-mixing, then applies rotation and zoom-in to disrupt the stitching boundary. The dark corners in the augmented images are the affine padding introduced by the rotation stage, which prevents the model from anchoring its minority-class representation to a fixed spatial boundary. Because both source images belong to the same ripeness class, the Over-ripe label is preserved exactly in all four composites.
2.5. Lightweight Deep Learning-Based Palm Ripeness Classification
Our objective is to implement a palm ripeness classification framework capable of executing efficiently on computationally constrained edge devices. To achieve this, we focus on lightweight deep neural network architectures that provide a promising classification performance with optimal resource utilization efficiency. The lightweight deep learning approach can be categorized into two main types: conventional classification networks and object detection networks. In this study, we explore and evaluate several architectures to perform the ripeness classification task. The lightweight architectures included in our experiments consist of MobileNetV2, EfficientNet-based models, and YOLO-based models.
The six backbone architectures evaluated in this study were selected according to three criteria. First, each architecture must be classified as lightweight, with a parameter count suitable for deployment on resource-constrained edge hardware typical of mill reception stations (target: under 10 M parameters). Second, each selected architecture had previously been applied to fruit ripeness or FFB classification in the literature, providing an empirical basis for its expected baseline performance in this domain. Third, the selected models represent two architectural families including conventional CNN classifiers and detection-derived classification models. This allows the proposed augmentation strategy to be evaluated across different feature-extraction approaches rather than being tailored to a single model family.
2.5.1. MobileNetV2-Based Ripeness Classification
MobileNetV2 [
34] introduces inverted residual blocks with linear bottlenecks and depthwise separable convolutions, resulting in a compact parameter count and suitable for resource-constrained mobile and edge-device deployment. Several studies have shown the efficacy of this architecture on palm fruit ripeness datasets. For instance, prior work deployed MobileNet on smartphones for real-world, on-device palm fruit ripeness classification, achieving an accuracy of 85% [
35]. Similarly, an alternative study evaluated multiple MobileNet variants on a 6-class palm fresh fruit bunch (FFB) dataset and was able to achieve a peak classification accuracy of 81% [
10].
2.5.2. EfficientNetV2 Series
EfficientNetV2 [
36], developed through neural architecture search (NAS), systematically scales network depth, width, and resolution to maximize computational efficiency. In a previous work, an optimized EfficientNet variant was employed for FFB classification in [
37]. The proposed work achieved 97.16% accuracy on a 5-class FFB dataset. Furthermore, a related study [
38] deployed the EfficientDet-Lite CNN architecture (an extended version of EfficientNet for object detection tasks) for oil palm ripeness level classification and yielded an accuracy of 84.0%. Based on these foundations, we evaluate two EfficientNetV2-based architectures in this study:
EfficientNetV2-B0: This configuration represents the baseline variant (leveraging the standard default architecture) with a parameter count of ≈6 M.
EfficientNetV2-B1: This configuration represents an architecturally scaled variant (leveraging both wider and deeper layers) with a parameter count of ≈7 M.
2.5.3. YOLO-Based Classification
YOLO (You Only Look Once) [
14] architectures have become increasingly popular for palm fruit ripeness monitoring due to their real-time inference speed and ability to simultaneously detect and classify multiple objects in a single forward pass. For instance, a real-time grading system using a modified YOLOv4 backbone on smartphones [
15] and another YOLOv4-based system [
39] demonstrated the suitability of the model for on-device field deployment. Additionally, YOLOv8n-Segmentation model (the nano variant with segmentation capabilities) was previously employed for preprocessing in [
11], achieving 98.07% accuracy when combined with ShuffleNetV2 [
40].
In this work, we evaluate three nano-scale YOLO classification variants, which are characterized as follows:
YOLOv8n-cls [
41]: This model employs C2f (Cross Stage Partial with two convolutions) modules throughout its backbone and neck features, while maintaining a parameter count of ≈1.4 M.
YOLO11n-cls [
42]: This architecture introduces refined multi-stage feature extraction blocks and advanced attention mechanisms, utilizing a parameter count of ≈1.5 M.
YOLO26n-cls [
43]: This is the latest version among the YOLO variants. It implements a deeper feature aggregation neck and a dedicated classification head relative to YOLOv8n, totaling ≈1.5 M parameters.
2.5.4. Model Size and Inference Latency
To compare the computational characteristics of the evaluated lightweight architectures under a common hardware platform,
Table 5 reports the exact parameter count, model size, and single-image inference latency for all six evaluated architectures. Inference latency was measured as the mean and standard deviation over 200 single-image forward passes on an NVIDIA RTX 3080 GPU (12 GB VRAM). Disk size for CNN models reflects the full training checkpoint, including optimizer state. The FP32/FP16 columns report the theoretical weight-only footprint. The reported latency values are intended for relative comparison under identical hardware conditions and should not be interpreted as the expected inference latency on embedded deployment platforms.
The results show that the three YOLO-family models are substantially more compact than the CNN-based models across all metrics. YOLOv8n-cls, YOLO11n-cls, and YOLO26n-cls each occupy under 6 MB at FP32 precision and under 3 MB at FP16, with deployment-ready sizes of approximately 2.83–3.05 MB. Their single-image inference latency ranges from ms to ms on the evaluated hardware platform. The CNN-based models range from 10.02 MB (MobileNetV2, FP32) to 27.84 MB (EfficientNetV2B1, FP32), remaining well within the memory budget of many embedded inference platforms when quantized to FP16 (5.01–13.92 MB).
These results indicate that all six architectures have relatively small memory footprints and favorable computational characteristics. However, inference latency was measured only on a desktop-class NVIDIA RTX 3080 GPU and therefore does not directly represent the runtime performance that would be achieved on embedded devices with more limited computational resources. Consequently, the reported latency values should be interpreted as a reproducible benchmark for relative model comparison rather than as deployment performance.
2.6. Model Development and Training
The training of the classification models was performed on a desktop computer equipped with an NVIDIA RTX 3080 GPU (12 GB VRAM) using cuDNN version 12.4 and implemented in Python version 3.10.12. The hyperparameter configuration and optimization policies selected for training the classification models are described in
Table 6.
The hyperparameter configuration reported in
Table 6 was selected based on commonly used settings for transfer-learning-based image classification and preliminary validation experiments. A systematic hyperparameter search, such as grid search, random search, or Bayesian optimization, was not performed because the primary objective of this study was to compare augmentation strategies under a fixed and consistent training protocol rather than to optimize each model–augmentation combination individually.
For each architecture, the same training configuration was used across all six augmentation settings. Therefore, the within-model performance differences primarily reflect the effect of the augmentation strategy and the resulting training-data distribution. The CNN-based models were trained for 100 epochs using the AdamW optimizer [
44], an initial learning rate of 0.001, and a batch size of 16. The dropout rate and L2 regularization strength used in the classification head were selected from commonly adopted settings for small-to-medium transfer-learning datasets and were not tuned separately for individual models or augmentation configurations. For the YOLO-based classification models, training was conducted for 100 epochs with a batch size of 16 using AdamW optimizer as the CNN-based models. Thus, the optimizer-selection procedure remained consistent across the six augmentation configurations.
To further mitigate class imbalance, a normalized inverse-frequency class weighting scheme was applied during the training of the EfficientNet and MobileNet models across all six augmentation configurations. For each configuration, class weights were computed directly from its corresponding training set using Equation (
5). The denominator normalizes the raw inverse-frequency weights by their mean, so that the resulting weights average to 1.0 across classes.
where
N denotes the total training sample count for the given configuration,
C represents the number of classes, and
is the sample count of class
c within that configuration.
Table 7 reports the exact normalized weight values for every configuration, computed from the per-class training sample counts in
Table 4.
E0, E1, E2, and E3 produce identical normalized class weights despite differences in total sample counts. Specifically, E1 and E3 apply a uniform
increase to all classes, while E2 applies a uniform
increase. In contrast, E4 and E5 use class-aware augmentation to rebalance the dataset directly, reducing the maximum imbalance ratio from
to
, as shown in
Table 4. As a result, only a small residual correction is required with normalized class weights ranging from
to
, compared with
to
for E0–E3. These results indicate that the proposed augmentation strategy performs the majority of the imbalance correction at the data level, while class-weighted loss provides only a second correction across all configurations. Therefore, performance differences among these configurations mainly reflect the augmentation strategies and resulting training-set sizes rather than changes in loss weighting.
2.7. Evaluation Metrics
To assess the performance of the deep learning frameworks, we implement a combination of global and class-specific metrics. We adopt global accuracy to evaluate the overall multi-class classification performance across the entire dataset. To provide a more granular evaluation, we further employ metrics derived from the components of the multi-class confusion matrix. Specifically, for each distinct class , performance is quantitatively mapped using the per-class precision (), recall (), and their harmonic mean, denoted as the per-class -score ().
The precision metric (
) is used to measure the proportion of correctly predicted positive instances out of all predicted positives for class
c, formulated as Equation (
6).
In addition, the recall metric (
) evaluates the ability of the model to identify all actual positive instances within class
c, and is expressed as Equation (
7).
where
,
, and
denote the True Positives, False Positives, and False Negatives for a given class
c, respectively.
To evaluate model performance when the dataset has an uneven class distribution, we adopt the per-class
-score to provide a balanced metric that accounts for both false positives and false negatives simultaneously. The
-score metric is presented in Equation (
8).
Moreover, we used the macro-averaged
-score presented in Equation (
9) to evaluate model generalization on the imbalanced dataset:
where
C is the number of classes and
is the
-score of class
c.
3. Results
3.1. Overall Accuracy Results
Six augmentation configurations were evaluated under a fixed training protocol. These included the E0 baseline without augmentation, E1 with standard geometric and photometric transformations, E2 with CutMix, E3 with baseline YOCO, and E4 with intra-class half-mixing YOCO. The proposed E5 configuration combines intra-class YOCO mixing with geometric transformations to form a hybrid augmentation framework. Overall accuracy results are presented in
Table 8, while macro-averaged
-scores are reported in
Table 9. No formal statistical significance testing was conducted; therefore, the reported differences should be interpreted as observed empirical trends rather than statistically confirmed superiority among augmentation strategies.
The proposed E5 configuration achieved the highest observed accuracy for five of the six evaluated models. For the EfficientNet family, E5 increased accuracy relative to the non-augmented baseline by 4.0 percentage points (pp) for EfficientNetV2B0 (90.8% to 94.8%) and by 3.2 pp for EfficientNetV2B1 (91.6% to 94.8%). MobileNetV2 was the only exception, with its highest observed accuracy of 92.0% obtained under E2 (CutMix). Nevertheless, E5 still produced a 1.6 pp improvement over the MobileNetV2 baseline (88.0% to 89.6%).
For the YOLO-family architectures, all three models achieved their highest observed accuracy under the E5 configuration. YOLO11n-cls and YOLO26n-cls each improved by 3.6 pp relative to their respective baselines. The largest observed gain was obtained by YOLOv8n-cls, which improved by 12.4 pp from 83.2% to 95.6%. This was also the highest individual accuracy recorded in the present experiments.
The macro-
results reported in
Table 9 show a similar empirical trend to the overall accuracy results. The proposed E5 configuration achieved the highest observed macro-
score for five of the six evaluated models. Notably, YOLOv8n-cls reached a macro-
score of 0.955, representing the highest observed result across all tested models and configurations. For the EfficientNet family, E5 achieved the highest observed macro-
score for both models, reaching 0.946 for EfficientNetV2B0 and 0.948 for EfficientNetV2B1. These results correspond to numerical gains of 0.040 and 0.032 over their respective baselines. Conversely, MobileNetV2 again achieved its highest macro-
score under the E2 configuration (
), whereas E5 produced a macro-
score of 0.903. Across the YOLO-family variants, the proposed E5 framework produced the largest observed macro-
improvement over the baseline, particularly for YOLOv8n-cls, which increased from 0.847 to 0.955.
3.2. Per-Class Performance
To evaluate the effectiveness of the proposed framework in addressing class imbalance, we conduct an analysis of the per-class precision (P), recall (R), and -score for each model across all evaluated configurations.
3.2.1. MobileNetV2
Table 10 presents the per-class performance of MobileNetV2 across all evaluated configurations.
The MobileNetV2 results indicate that the proposed E5 configuration did not achieve the highest observed overall performance for this architecture. Instead, the E2 (CutMix) configuration achieved the highest observed performance, with perfect Over-ripe recall (, ), together with the highest Under-ripe -score (0.909) and Unripe -score (0.917). Despite these results, the proposed framework still delivered an improvement for the minority class compared to the baseline, where the Over-ripe -score increased from 0.894 (E0) to 0.939 (E5).
3.2.2. EfficientNetV2B0
Table 11 presents the per-class performance of EfficientNetV2B0 across all evaluated configurations. For the Over-ripe minority class, E5 achieved the highest observed precision (
) and
-score (
). While E3 (YOCO) achieved the highest observed recall (
) for this class, its precision was 0.857, resulting in an
-score of 0.923. In comparison, E5 obtained a recall of 0.958 and a higher precision of 0.920, resulting in the highest observed Over-ripe
-score for EfficientNetV2B0. Although E4 achieved an Over-ripe recall score of 0.958, its precision was 0.852 (
).
Across the four ripeness classes, E5 achieved -scores of 0.939, 0.950, 0.951, and 0.944 for Over-ripe, Ripe, Under-ripe, and Unripe, respectively. Under the fixed experimental protocol, E5 was the only configuration for EfficientNetV2B0 with observed -scores of at least 0.939 across all four classes.
3.2.3. EfficientNetV2B1
Table 12 outlines the per-class performance metrics for EfficientNetV2B1 across all evaluated augmentation configurations. For the EfficientNetV2B1 architecture, the E3 and E4 configurations obtained the highest observed Over-ripe
-score of 0.960 with perfect recall (
), while the proposed E5 framework achieved an Over-ripe
-score of 0.941.
The proposed E5 configuration obtained an Over-ripe recall of 1.000, an Under-ripe -score of 0.950, and an Unripe -score of 0.964. These scores represent the highest value achieved across all configurations and categories for this model. Under the evaluated experimental protocol, E5 was the only configuration that achieved an -score across all four classes.
3.2.4. YOLOv8n-cls
Table 13 presents the per-class classification results for YOLOv8n-cls under each evaluated configuration. The YOLOv8n-cls architecture under the proposed E5 configuration achieved the highest observed overall result of the present study, with perfect Over-ripe recall (
,
) and consistent per-class scores across all classes. This model delivered an
-score for the Ripe, Under-ripe, and Unripe classes of 0.971, 0.956, and 0.935, respectively.
On the other hand, E4 produced the lowest Unripe -score (0.808) among the evaluated configurations for this model. The proposed E5 framework showed a higher Unripe -score than E4, increasing from 0.808 to 0.935. In terms of -score performance, E5 showed numerical improvements of 0.043 in Over-ripe, 0.107 in Ripe, 0.144 in Under-ripe, and 0.138 in Unripe compared with the baseline setup (E0).
3.2.5. YOLO11n-cls
Table 14 details the per-class precision, recall, and
-scores for the YOLO11n-cls architecture across all six experimental configurations. For the YOLO11n-cls model, the E1, E4, and E5 configurations all obtained perfect Over-ripe recall (
) and the highest observed Over-ripe
-score (
).
The proposed E5 framework achieved perfect minority-class recall while obtaining the highest observed -scores for the remaining categories, yielding a Ripe -score of 0.940, an Under-ripe -score of 0.916, and an Unripe -score of 0.903. Under the evaluated experimental protocol, E5 was the only configuration that maintained an -score across all four classes.
3.2.6. YOLO26n-cls
Table 15 presents the class-specific performance breakdown for the deeper YOLO26n-cls model under each evaluated augmentation setup. The results show that the E3 configuration achieved the highest observed performance on the Ripe and Under-ripe classes, with
-scores of 0.935 and 0.925, respectively. In contrast, the E4 configuration showed lower
-scores across all classes compared with the best observed results for this model.
The proposed E5 configuration achieved perfect recall and the highest observed precision for the Over-ripe minority class, resulting in an -score of 0.960. E5 also produced the highest Unripe -score (0.926), and its Ripe -score (0.929) and Under-ripe -score (0.921) remained close to the E3 configuration.
3.3. Error Analysis
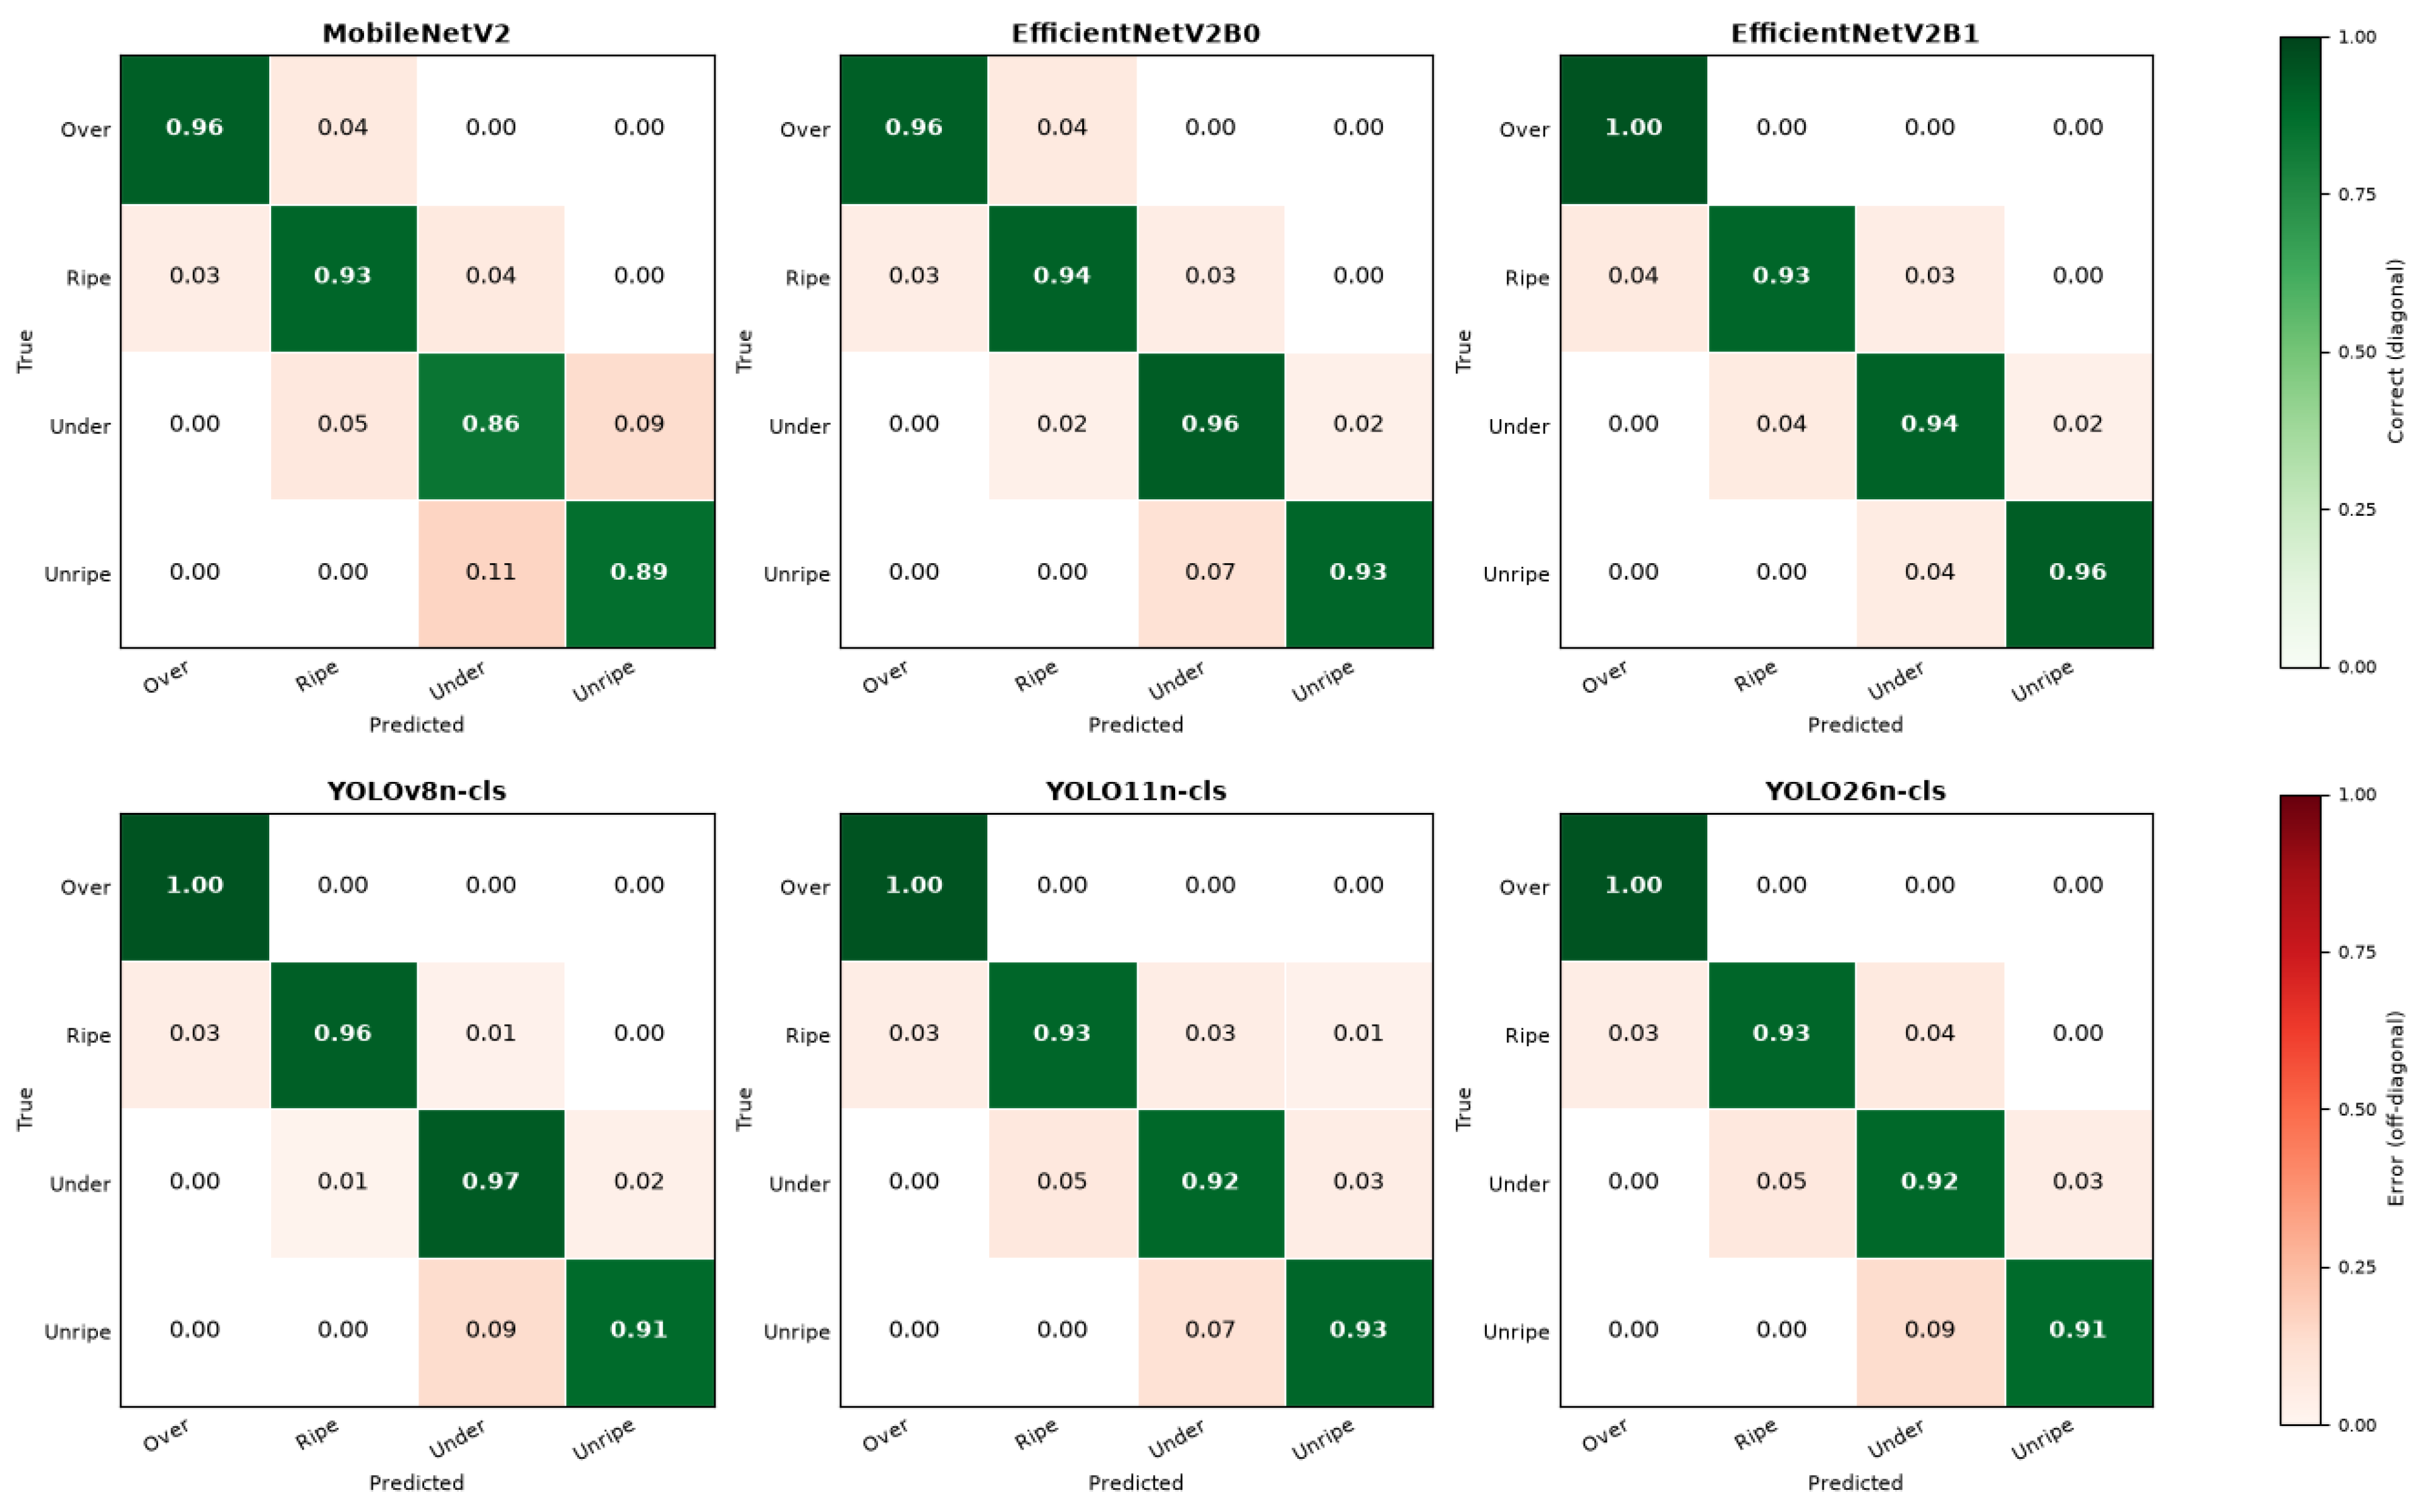
Figure 5 presents the row-normalized confusion matrices for all six models under E5. Each cell represents the proportion of samples from a true class assigned to each predicted class. Therefore, the diagonal values correspond to the per-class recall reported in
Table 10,
Table 11,
Table 12,
Table 13,
Table 14 and
Table 15.
Three consistent observations can be drawn from the six confusion matrices. First, all three YOLO-family models achieved perfect Over-ripe recall (, diagonal value 1.00), while MobileNetV2 and EfficientNetV2B0 reached (diagonal 0.96) and EfficientNetV2B1 achieved . Second, off-diagonal errors were most frequently observed between visually adjacent ripeness stages, particularly between Ripe and Over-ripe and between Under-ripe and Unripe. Third, MobileNetV2 exhibited the highest off-diagonal values overall, with an Under-ripe to Unripe error rate of 0.09 and an Unripe to Under-ripe error rate of 0.11, representing the largest inter-class confusion observed in this study. Among the YOLO-family models, YOLOv8n-cls exhibited the most balanced per-class recall, with values of 1.00 for Over-ripe, 0.96 for Ripe, 0.97 for Under-ripe, and 0.91 for Unripe. All off-diagonal error rates were 0.03 or lower. By comparison, YOLO11n-cls and YOLO26n-cls demonstrated similar recall patterns, with their primary off-diagonal errors occurring between Under-ripe and Ripe and between Unripe and Under-ripe.
4. Discussion
4.1. Effectiveness of the Proposed Hybrid Augmentation
The experimental results suggest that combining intra-class mixing with geometric augmentation, as implemented in configuration E5, is an effective strategy for addressing class imbalance in oil palm FFB ripeness classification. Five out of six models achieved their highest observed accuracy and macro--score under the proposed E5 configuration. Furthermore, the best single result, achieved by YOLOv8n-cls with an accuracy of 95.6% and a macro--score of 0.955, represents the highest observed performance across all models and configurations evaluated in this study. In addition, the proposed framework improved minority-class performance while maintaining competitive performance on the majority classes. Under the evaluated experimental protocol, it was the only configuration that consistently achieved an -score for all four ripeness classes across the YOLO-family models. These observations suggest that the proposed method improves minority-class performance without an evident precision–recall trade-off at the system level.
The intra-class YOCO mixing stage addresses class imbalance by synthesizing spatially diverse composites from different Over-ripe samples. This method increases the effective training diversity for the minority class without introducing cross-class label ambiguity. However, the experimental results indicate that intra-class mixing alone may be insufficient. In the YOLO26n-cls results, the Over-ripe -score decreased to 0.917. This observation suggests that the stitching boundary in E4 composites may act as a spurious spatial feature that the model partially relies on instead of learning genuine ripeness characteristics.
The geometric stage incorporated in E5 may help alleviate this issue by rotating and rescaling the composite, thereby reducing the likelihood that the model relies on a fixed stitching seam and encouraging greater reliance on morphological and color features. This interpretation is supported by the EfficientNetV2B0 results, where E5 improved Over-ripe precision from 0.857 (E3) to 0.920 while maintaining recall at 0.958. Similarly, for EfficientNetV2B1, E5 achieved perfect Over-ripe recall together with the highest observed majority-class -scores among the evaluated configurations.
4.2. Over-Ripe Minority Class: Precision–Recall Tradeoff
Across all YOLO-family models, configuration E5 achieved perfect Over-ripe recall () together with the highest observed Over-ripe precision (), resulting in an -score of 0.960 for all three architectures. This precision–recall combination is desirable for oil palm FFB ripeness classification because high recall reduces the likelihood of missing Over-ripe bunches, while high precision reduces the likelihood of incorrectly classifying acceptable bunches as Over-ripe. Prior configurations that achieved high recall (E3 and E4) did so with lower precision. Under the evaluated experimental protocol, E5 was the only configuration that achieved both perfect Over-ripe recall and the highest observed Over-ripe precision across all three YOLO architectures.
For the EfficientNet models, the proposed configuration (E5) achieved a different but complementary balance compared with the YOLO variants. It maintained perfect Over-ripe recall for EfficientNetV2B1 while substantially improving the majority-class -score (Unripe : 0.909 → 0.964 relative to configuration E3). For EfficientNetV2B0, E5 improved Over-ripe precision from 0.857 to 0.920 relative to E3 while maintaining a recall of 0.958. Consequently, the Over-ripe -score increased from 0.923 (E3) to 0.939 (E5). These observations suggest that incorporating the geometric augmentation stage contributes to improving minority-class precision while preserving high recall for the evaluated EfficientNet architectures.
4.3. Effect of Intra-Class Mixing and Spatial Transformations
Experiments E3, E4, and E5 provide insight into the individual contribution of each augmentation component. Configuration E3 (standard YOCO baseline) improved Over-ripe recall over the no-augmentation baseline for most models. These results suggest that half-image augmentation benefits minority-class detection. However, E3 achieved this at the cost of reduced Over-ripe precision in some models. For instance, YOLO26n-cls reduced the precision from 0.920 to 0.857. The results also show that E3 did not consistently improve majority-class performance. Configuration E4 (intra-class mixing alone) offered improved class-aware diversity but occasionally underperformed E3, especially for YOLO26n-cls where the Over-ripe -score decreased to 0.917. This observation suggests that the stitching boundary in E4 composites may introduce a spurious spatial cue that the model partially relies on instead of learning genuine ripeness characteristics.
In contrast, the proposed augmentation E5 consistently avoided this performance degradation across the evaluated models. A possible explanation is that applying geometric warping after the intra-class mixing process rotates and rescales the stitching seam, reducing the likelihood that the model relies on its fixed position. This encourages the model to place greater emphasis on morphological and color features associated with fruit ripeness. Consistent with this interpretation, E5 achieved higher minority-class performance than both E3 and E4 while maintaining competitive majority-class performance across the evaluated models.
4.4. Influence of Architectural Capacity on Augmentation Strategy
MobileNetV2 is the only model for which E2 (CutMix) achieved higher observed performance than the proposed E5 (92.0% vs. 89.6%, macro-
0.927 vs. 0.903). A possible explanation is that this behavior is related to the interaction between MobileNetV2’s inverted residual block structure and the spatial composites generated by the intra-class YOCO mixing stage. Within each inverted residual block, a depthwise convolution operates on each channel independently without cross-channel spatial interaction [
34]. Consequently, the network may be less effective at integrating information across the two spatial halves of a YOCO composite within a single convolutional operation. As a result, the stitching boundary may be represented as a channel-wise discontinuity rather than a coherent spatial feature.
Despite the higher overall accuracy achieved by CutMix, E5 still maintained competitive performance for the Over-ripe minority class. The results of MobileNetV2 show that the Over-ripe -score under E5 (0.939) differed from E2 (0.960) by only 0.021, whereas the majority-class gains under E2 were larger. These observations suggest that the relative performance of the augmentation strategies depends, at least in part, on the underlying network architecture, although further investigation is required to confirm the proposed explanation.
4.5. Error Analysis and Practical Implications
The confusion matrices in
Section 3.3 show similar error patterns across all six models. These observations suggest that the remaining misclassifications are primarily associated with visual ambiguity in the dataset rather than a particular network architecture. Most errors occur between Ripe and Over-ripe bunches, where lighting, shadows, and oblique viewing angles may obscure subtle ripeness cues. A second error pattern occurs between Unripe and Under-ripe bunches, which may be associated with small bunch size and dense fruitlet packing, reducing visible color differences at the
input resolution. Although the proposed augmentation substantially improved overall classification performance and minority-class recognition, these persistent confusions indicate that the current system is not free from classification errors under practical operating conditions. In particular, visually adjacent ripeness stages remain challenging to distinguish under natural field conditions. These results suggest that additional improvements in image acquisition and model design are still required for robust real-world deployment.
These observations have several practical implications for potential mill deployment. First, because all YOLO models under E5 correctly identified every Over-ripe sample and most remaining errors occurred near the Ripe class boundary, the system could potentially employ a lower decision threshold for the Over-ripe class. This would be expected to increase false positives slightly while further reducing the likelihood of missing Over-ripe bunches. Depending on operational requirements, such a trade-off may be acceptable because undetected Over-ripe bunches can reduce crude palm oil quality. Second, the sensitivity between the Ripe and Over-ripe classes to lighting conditions suggests that controlled lighting at the mill reception ramp may help reduce these errors without retraining the model. Third, confusion between Unripe and Under-ripe samples may also be reduced by increasing the input resolution, which could preserve finer color and texture details for distinguishing these visually similar classes.
4.6. Comparison with Related Works
A comparison of the proposed work with representative prior studies on oil palm FFB ripeness classification was conducted. All selected studies utilize deep learning methodologies and provide quantitative performance metrics. Because the compared studies differ in dataset source, image acquisition conditions, number of ripeness classes, and evaluation protocols, the comparison should be interpreted as an indirect cross-study comparison rather than a direct benchmark. Three primary evaluation criteria were analyzed: the number of ripeness classes (2–5), the dataset collection conditions (laboratory vs. field), and the reported performance metrics (accuracy, macro-, or mAP).
4.6.1. Comparison with CNN-Based Classification
Table 16 presents an indirect comparison between the proposed work and previous CNN-based methods for oil palm FFB ripeness classification.
The reported accuracies range from 81.0% to 98.3%, reflecting differences in model architecture, dataset source, image acquisition conditions, and the number of ripeness classes. The ANN-based method presented in [
46] achieved the highest reported accuracy (98.3%) among the studies included in the comparison. However, this method used handcrafted feature-based FFB inputs and was evaluated on a three-class dataset.
Overall, the proposed architectures achieved competitive accuracy compared with previous lightweight CNN-based approaches. The proposed MobileNetV2 achieved an accuracy of 89.6% on the four-class dataset, which is higher than the MobileNetV2 result reported in [
10]. The proposed MobileNetV2 model also achieved a higher reported accuracy than [
35]. However, this comparison should be interpreted with caution because the latter study was conducted on a six-class dataset. Furthermore, the proposed MobileNetV2 achieved an accuracy within 1 percentage point of the MobileNetV3-Small model reported in [
11].
The proposed EfficientNet-based models achieved an accuracy of 94.8%, compared with 89.0% reported for EfficientNetB0 in [
10], and were within 3.5 percentage points of the highest reported accuracy among the studies considered. Compared with the EfficientDet-based approach in [
38], the proposed EfficientNet models achieved a numerical improvement of 10.8 percentage points. The proposed EfficientNet models also achieved higher reported accuracy than the DenseNet-based approach presented in [
45]. Although these comparisons involve different datasets and experimental settings, they indicate that the proposed framework is competitive with existing lightweight CNN-based methods for oil palm FFB ripeness classification.
4.6.2. Comparison with YOLO-Based Methods
We compared our proposed YOLO-based framework with previous studies using YOLO variants for oil palm ripeness assessment, as summarized in
Table 17. The studies reviewed include both detection and classification tasks. Therefore, the reported results should be interpreted with caution, as detection-based metrics such as mAP and detection-level
evaluate both fruit bunch localization and ripeness classification, whereas the proposed YOLO-cls models evaluate only image-level ripeness classification.
The comparison shows that the legacy YOLOv4 model achieved high object detection performance, reporting an
-score of 0.99 and a mean Average Precision (mAP) of 99.98% across a six-class classification framework [
15]. Similarly, another YOLOv4-based implementation reported an
-score of 0.90 and an mAP of 99.17% for a three-class dataset [
39]. However, the YOLOv4-tiny variant exhibited lower performance, with an
-score of 0.53 and an mAP of 56.1% [
15]. These results suggest that reducing the model capacity may substantially affect performance when the network is required to perform both object localization and ripeness classification simultaneously.
YOLOv8-based models have also reported strong object detection performance. The YOLOv8m model achieved an
-score of 0.98 in [
11]. Moreover, YOLOv8n achieved an
-score of 0.86 on a four-class dataset [
47]. Within the studies considered, the lightweight YOLOv8 variants maintained competitive detection performance relative to the larger YOLO architectures. Meanwhile, the newer YOLO11 architecture reported an
-score of 0.73 [
13]. However, this comparison should be interpreted with caution because the YOLO11 model was evaluated on a more challenging five-class FFB dataset.
Within the classification-based paradigm, the proposed YOLO configurations achieved competitive performance compared with previous studies. The proposed YOLO11n-cls and YOLO26n-cls architectures achieved accuracies of 92.4% and 92.8%, respectively, with both obtaining an
-score of 0.93. The highest observed result in the present study was achieved by YOLOv8n-cls, reaching an accuracy of 95.6% and an
-score of 0.96. This accuracy is higher than the YOLOv3-tiny result reported in [
17], although the comparison is indirect because the studies were conducted under different experimental settings. Furthermore, the proposed YOLOv8n-cls achieved an accuracy comparable to that reported for the same backbone architecture in [
16]. However, the latter study evaluated its model on a six-class dataset, and therefore the comparison should be interpreted as indicative rather than a direct benchmark.
4.7. Limitations
Several limitations should be noted. First, the dataset contains only 857 images collected from a single oil palm reception ramp in Thailand. As a result, the validation and test sets include relatively few samples per class, especially for the minority Over-ripe class. Therefore, the performance reported for this class should be interpreted with appropriate caution. In addition, data collection was restricted to one geographic location over a one-week period. Since oil palm appearance may vary across plantation regions, cultivation practices, harvest seasons, cultivars, soil conditions, and local climates, models trained on this dataset may not generalize directly to other locations without additional local data or fine-tuning. Although the proposed augmentation substantially improves classification performance, the remaining confusion between adjacent ripeness stages indicates that additional improvements are still required before the system can be considered fully robust for practical mill deployment.
Second, annotation was performed by three trained grading experts from the collection site. Although their practical experience supported the labeling process, using only three annotators from one location may have introduced site-specific bias. Furthermore, inter-annotator agreement was not quantitatively evaluated using metrics such as Cohen’s Kappa because the original independent annotation records from each evaluator were not retained after the consensus labeling process. Consequently, annotation reliability could not be quantitatively validated, representing a limitation of the present study. Third, this study did not perform formal statistical significance testing to compare the evaluated augmentation strategies and model architectures. Therefore, although the proposed E5 configuration achieved the highest observed performance in most experiments, the reported differences should be interpreted as empirical observations under the evaluated experimental protocol rather than statistically confirmed evidence of superiority. Finally, although model size and inference latency were evaluated to characterize computational efficiency, latency was measured only on a desktop-class NVIDIA RTX 3080 GPU. Therefore, the reported inference times should be interpreted as relative comparisons under identical hardware conditions rather than as expected deployment latency on embedded edge devices. Experimental validation on representative embedded platforms remains necessary to assess real-time performance, memory usage, and energy consumption under practical mill conditions.
In conclusion, these limitations indicate that the reported findings should be interpreted as evidence of feasibility under the present dataset, annotation procedure, hardware platform, and experimental protocol, rather than as definitive evidence of statistical superiority, broad geographic generalizability, quantitatively validated annotation reliability, or embedded-device deployment performance.
4.8. Future Research Directions
Based on these findings and limitations, three main directions are identified for future research. First, the proposed augmentation strategy should be evaluated on larger datasets collected from multiple plantations, regions, and harvest seasons. Future studies should also include repeated experimental trials and statistical significance analysis to further validate the observed performance differences. A more diverse group of independent annotators should be involved, and the original annotation records should be preserved so that inter-annotator agreement metrics, such as Cohen’s Kappa, can be quantitatively reported prior to consensus labeling. Second, increasing the input resolution or using multi-angle images may help reduce confusion between Unripe and Under-ripe bunches. Finally, the proposed lightweight models should be implemented and benchmarked on representative embedded edge platforms to assess inference latency, memory usage, energy consumption, and real-time deployment viability under practical mill reception conditions.
5. Conclusions
This work presents an automated oil palm fresh fruit bunch (FFB) ripeness classification using lightweight deep learning models. We collected a four-class (Over-ripe, Ripe, Under-ripe, Unripe) oil palm FFB dataset directly at an operate mill reception ramp in south Thailand under unconstrained field conditions. An intra-class half-mixing augmentation framework combined with geometric transformation is proposed to resolve the class imbalance inherent in real-world FFB dataset. Six lightweight backbone architectures were implemented for FFB ripeness classification.
The experimental results show that YOLOv8n-cls achieved the highest observed overall accuracy of 95.6% with a macro- of 0.955, corresponding to a 12.4 percentage-point improvement over the no-augmentation baseline. In addition, other YOLO variants including YOLO11n-cls and YOLO26n-cls were conducted for the classification task and achieved accuracies of 92.4% and 92.8% respectively. CNN-based models, including EfficientNetV2B0, EfficientNetV2B1, and MobileNetV2, were implemented, obtaining accuracy scores of 94.8%, 94.8%, and 89.6%, respectively. These results indicate that lightweight architectures can achieve promising classification performance when combined with the proposed augmentation pipeline. The proposed method also produced an observed Over-ripe recall of 1.00 for all YOLO-family models and the highest observed -scores across the four ripeness classes. Overall, these results suggest that the proposed method may improve minority-class detection while maintaining competitive majority-class performance. However, further validation using larger multi-location datasets, repeated experiments, formal statistical significance testing, and representative embedded hardware is required before drawing broader conclusions regarding model superiority, generalizability, and practical deployment ability.