1. Introduction
Phytosanitary monitoring of cacao (
Theobroma cacao) cultivation has been a central focus of research due to its high scientific and productive relevance, given its direct impact on food security, rural economies, and the sustainability of agricultural systems in tropical regions [
1,
2]. Over the last decade, cocoa production and demand (measured through grinding) have shown uneven growth patterns. Demand has consistently outpaced production, generating recurrent deficits in the international market. According to the International Cocoa Organization, a global deficit of 478,000 metric tons was recorded in the 2023–2024 season [
3]. Among the various factors that affect the sustainability of cocoa cultivation, climate change plays a central role, as it has altered rainfall and temperature patterns, promoting the spread of pathogens and causing a decrease in crop yields [
4,
5,
6]. Likewise, among the phytopathologies that have the greatest negative impacts on production, the most notable are witches’ broom, caused by
Moniliophthora perniciosa; frosty pod rot, induced by
Moniliophthora roreri; and black pod, caused by
Phytophthora spp. These three diseases have been associated with yield losses of up to 80% when timely management and control measures are not implemented [
1,
7,
8]. Recent research indicated that the early identification of moniliasis and other cacao phytopathologies, through the use of automatic image analysis systems, contributes significantly to reducing economic losses and optimizing phytosanitary management strategies under field conditions [
9,
10,
11].
According to [
1], the incorporation of advanced computer vision techniques has emerged as an effective strategy for phytosanitary diagnosis, enabling the early identification of diseases even in initial stages where conventional visual detection is limited. In this context, these techniques not only improve the accuracy of agricultural monitoring but also offer analytical capabilities to assess the degree of ripeness of the cocoa pods. This aspect is particularly relevant, as it directly affects grain quality and contributes to the standardization of post-harvest processes, especially during fermentation, a critical stage for the development of the organoleptic attributes of cocoa [
12]. In this context, computer vision has become established as a key line of research for the automated analysis of crops, by providing robust tools for the acquisition, processing, and interpretation of visual information in agricultural environments. This discipline has enabled not only the identification and localization of fruits but also the precise characterization of phytopathologies through the analysis of digital images captured directly in the field, thereby supporting data-driven decision-making and improving the efficiency of agricultural monitoring systems [
13,
14,
15]. Within computer vision-based systems, image segmentation constitutes a critical stage, since it makes it possible to separate the object of interest from the background of the scene and, consequently, facilitates the extraction of relevant features for subsequent tasks such as classification, diagnosis, or monitoring of crop conditions [
16,
17].
Various studies have addressed the segmentation of agricultural images using classical approaches, such as global thresholding and unsupervised clustering algorithms. These methods have been widely used due to their low computational cost, their relative ease of implementation, and their usefulness as baselines in agricultural applications developed in controlled environments. However, these characteristics restrict their capacity for generalization and, consequently, their applicability under real field conditions [
1,
18,
19]. Nevertheless, the literature shows that clustering techniques such as K-means can outperform simple thresholding methods by incorporating chromatic information into the segmentation process. However, their performance largely depends on the appropriate selection of the number of clusters and the homogeneity of the visual environment, which may limit their robustness under uncontrolled conditions [
13,
17,
20].
Other studies agree that classical methods exhibit limited performance in uncontrolled agricultural environments. In particular, there is a noticeable lack of methodological approaches that explicitly address critical factors such as variations in lighting, the presence of complex backgrounds, and the color similarity between the fruit and the surrounding vegetation in cocoa crops, especially under real field conditions [
14,
21]. In the field of automated detection of phytopathologies, ref. [
22] pointed out that convolutional neural networks have become established as the predominant state-of-the-art approach due to their high accuracy. Nevertheless, significant challenges remain, associated with the limited interpretability of these models and their sensitivity to heterogeneous and uncontrolled conditions typical of real field environments. Along these lines, ref. [
23] emphasized that the generalization capability of deep learning-based models continues to be constrained by environmental variability, as well as by their strong dependence on large volumes of labeled data. Complementarily, there are studies that agree that segmentation is a critical stage within the processing pipeline, since errors introduced at this phase directly affect the quality of feature extraction and, consequently, the performance of classification models [
24,
25]. In the context of classical methods, it has been shown that traditional thresholding techniques, such as those proposed by Otsu and Kapur, when extended to multiclass configurations, often require the integration of metaheuristic optimization schemes, which significantly increases the computational complexity [
26,
27]. Likewise, recent studies have highlighted the importance of pixel-level segmentation for the quantitative estimation of disease severity, while underscoring the need to develop strategies that reduce reliance on manually annotated data in supervised schemes [
28]. In parallel, in precision agriculture, they have emphasized the relevance of designing approaches that optimize the balance between accuracy and computational efficiency, particularly under real operating conditions [
28]. Accordingly, in agricultural engineering, there is a for robust methodological solutions adapted to real-world scenarios, where physical and environmental conditions directly influence system performance.
Taken together, this evidence indicates that although deep learning architectures dominate quantitative performance, the systematic evaluation of classical approaches and the analysis of their behavior under uncontrolled agricultural conditions remain a scientifically relevant line of research. In particular, a gap is identified in the literature regarding the implementation and comparison of these methods in the analysis and detection of moniliasis in cocoa pods. This gap motivates the development of the present study, which systematically addresses this problem.
Therefore, this work presents a comparative evaluation of classical segmentation methods applied to images of cocoa pods acquired in uncontrolled agricultural environments. Specifically, three representative approaches are analyzed: global thresholding, K-means clustering, and segmentation based on iterative background–foreground modeling (GrabCut). As its main contribution, this work proposes a comprehensive evaluation framework that combines qualitative and quantitative analysis using unsupervised structural metrics—including the proportion of segmented area (AS), the largest connected component ratio (LCR), and the catastrophic failure rate (FC)—complemented by supervised validation on a manually annotated data subset, employing the Intersection over Union (IoU) overlap metric. Additionally, the study provides experimental evidence on the behavior and limitations of these methods under real field conditions, characterized by variability in lighting, complex backgrounds, and chromatic similarity between the fruit and the vegetation. In this context, it is shown that the robustness of the segmentation is a determining factor, as it directly affects the reliability of subsequent processes of classification and phytosanitary diagnosis of cocoa, particularly when these are applied under real field conditions.
2. Materials and Methods
This study was carried out using an experimental approach aimed at evaluating the performance of classical segmentation methods applied to images of cocoa pods acquired under real field conditions. The experimental design considered scenarios characterized by uncontrolled natural lighting, visually complex backgrounds, and limited chromatic separability between the object and its surroundings, with the purpose of prioritizing external validity and the representativeness of the real agricultural context. The images were captured using everyday mobile devices, which introduces variability in both resolution and the quality of the acquisition process. In particular, low-resolution images were incorporated, in line with the technological limitations characteristic of production systems in rural areas, where users do not always have access to mid- or high-range devices. This methodological decision made it possible to evaluate algorithmic performance under real operating conditions rather than in experimentally idealized contexts.
2.1. Image Set and Acquisition Protocol
The dataset consists of 343 images of cocoa pods, of which 250 correspond to healthy pods and 93 to pods affected by moniliasis disease. The images were acquired using mobile devices with integrated cameras, without artificial control of lighting conditions or the use of prepared experimental settings. Cacao plantations are geographically located in the State of Tabasco, Mexico, a humid-tropical climate region characterized by high cocoa production and intensive post-harvest activity focused on the production of chocolate and its derivatives.
Approximately 8.5% of the images exhibit a resolution of less than 1000 pixels, indicating substantial technological heterogeneity among the image acquisition devices employed. The analyzed images are characterized by the following characteristics:
- 1.
Heterogeneous resolutions, with widths ranging from 640 to 5152 pixels;
- 2.
Presence of both horizontal and vertical orientations;
- 3.
Non-uniform natural lighting, with shadowed areas and overexposed regions;
- 4.
Visually complex backgrounds composed of leaves, branches, trunks, and ground;
- 5.
High color variability in the fruit;
- 6.
Frequent continuity or physical connectivity between the cocoa pod and the stem.
Although the dataset showed an imbalanced distribution between healthy and diseased pods, this imbalance did not introduce training bias. The segmentation methods evaluated in this study do not learn class-dependent parameters from labeled data. Therefore, no oversampling or undersampling strategies were applied. The original distribution of the field-acquired images was preserved to reflect real acquisition conditions. In addition, the manually annotated subset used for Intersection over Union (IoU) evaluation maintained approximately the same proportion of healthy and diseased pods as the complete dataset. This proportional representation helped reduce the risk of bias in the quantitative evaluation.
2.2. Statistical Characterization of the Image Dataset
A preliminary statistical characterization of the image dataset was performed for descriptive and contextual purposes. Metrics associated with the intensity, luminance, and structural complexity of the images were computed and analyzed. In
Table 1, the grayscale histograms exhibit multimodal behavior [3.31 ± 2.34 peaks], negative kurtosis [−0.55 ± 0.70], and high luminance variability, as reflected by the coefficient of variation [
= 0.52 ± 0.14]. The mean image gradient magnitude [32.38 ± 10.82] further evidences the presence of highly textured backgrounds.
On the other hand, the quartiles allow us to characterize the distribution of the data. In the case of Width (in pixels), the value of the Quartile 1 indicates that 25% of the photographs have a value between 640 and 3000 pixels. The middle 50% of the data (between the first and second quartiles) falls within the range of 3000 to 3468 pixels. Finally, the top 25% of observations in the third quartile consist of photographs with widths ranging from 3468 to 5152 pixels. This statistical trend suggests that mobile phones whose cameras were used most frequently for taking photos predominantly have horizontal resolutions ranging from 3000 to 3468 pixels.
Taken together, these metrics indicate limited separability between foreground and background in uncontrolled, real-world imaging, making this a particularly challenging setting for classical segmentation methods.
2.3. Preprocessing of the Images
With the aim of minimizing geometric variability and enhancing algorithmic robustness, the following preprocessing pipeline was implemented.
2.3.1. Spatial Scale Normalization
The images were resized to a fixed width of 900 pixels, while preserving the original aspect ratio at all times. Consider an image with dimensions
. A reference width or resized width of
was defined, from which the corresponding scaling factor was estimated:
where
S is the scale factor,
W is the original width. The new height was determined as follows:
where
h and
denote the original and resized heights, respectively. This procedure makes it possible to homogenize the spatial scale without introducing distortions in the geometry of the system.
2.3.2. Local Contrast Enhancement Using (CLAHE) on the Luminance Channel
Local contrast enhancement was performed using Contrast Limited Adaptive Histogram Equalization (CLAHE) on the luminance channel. Each image was converted from RGB to CIELAB color space, and CLAHE was applied only to the L channel to improve local luminance contrast while preserving the chromatic information of the cocoa pods and surrounding background.
A conservative parameter configuration was adopted to reduce the risk of over-enhancing noise, shadows, specular highlights, or background texture. Specifically, clipLimit = 1.2 was used to constrain local contrast amplification, whereas tileGridSize = 8 × 8 allowed adaptive enhancement over local image regions. After contrast enhancement, a Gaussian filter with a 5 × 5 kernel was applied to attenuate small-scale intensity fluctuations before segmentation.
2.4. Classical Segmentation Methods Under Evaluation
This study evaluates the performance of three classical segmentation methods, which are described in detail below.
2.4.1. Global Thresholding Refined by Morphological Operations
A fixed global thresholding operation was applied to the grayscale image
using an intensity threshold of
. This value was kept constant for all images to provide a simple, reproducible, global intensity-based baseline. The binary mask
was defined as follows:
where
represents the intensity of the original pixel at position
, and
T corresponds to the fixed threshold value used in the implementation. Subsequently, morphological opening and closing operations were applied to suppress spurious regions and improve mask continuity. Specifically, a
elliptical structuring element was used, with one opening operation followed by two closing operations. Finally, connected components with an area smaller than 800 pixels were removed. This approach was included as a low-complexity global intensity-based baseline to evaluate its limitations under real field conditions, where variable illumination, complex backgrounds, and chromatic similarity between the cocoa pod and the surrounding environment hinder foreground–background separation using a single threshold.
2.4.2. K-Means for Image Segmentation in the CIELAB Color Space
Each pixel was mathematically encoded as a vector in a three-dimensional feature space defined as follows:
where
is the feature vector of the pixel
i,
represents luminance component, and
and
correspond to the green–red and blue–yellow chromatic components, respectively. The K-means clustering algorithm was employed by minimizing the within-cluster sum of squared Euclidean distances, with the objective function given by
where
is the centroid of cluster
, which is defined as
where
denotes the cardinality of the cluster (that is, the number of elements it contains),
indicates the sum over all points belonging to the cluster, and
corresponds to the centroid (mean) of the cluster. The group whose spatial centroid was closest to the geometric center was selected as the object of study. In this study, K = 3 was used to represent the main visual groups commonly observed in the images: cocoa pod regions, vegetation/background regions, and shadow or transition regions.
2.4.3. Classical GrabCut Algorithm with Automatic Rectangular Initialization
GrabCut is an energy-minimization-based segmentation algorithm that models foreground and background distributions using Gaussian Mixture Models (GMMs). The segmentation problem is formulated as the minimization of an energy function:
where
denotes the total energy,
is the data term associated with foreground/background membership likelihoods, and
is the smoothness term, which penalizes label discontinuities between neighboring pixels.
In this study, GrabCut was initialized using an automatic rectangular region rather than manually defined bounding boxes. Since cocoa pods were generally positioned near the center of the scene during image acquisition, the initialization rectangle was defined as the central 80% of each image, leaving a 10% margin from each border. For an image with width w and height h, the rectangle is specified as . This rule is applied uniformly to all images to reduce operator-dependent variability.
No fixed minimum distance was imposed between the bounding-box border and the cocoa pod contour. Similarly, no predefined maximum number of leaves, branches, stems, or other background elements was established within the initialization region. These elements were retained when present inside the rectangle, allowing the method to be evaluated under realistic field conditions characterized by vegetation overlap, shadows, and complex backgrounds. GrabCut was run for six iterations. The resulting binary mask was refined using a elliptical structuring element, with one opening operation and two closing operations. Finally, the largest connected component was retained as the segmented cocoa pod.
2.5. Evaluation Metrics
The evaluation is conducted out using two complementary approaches: a supervised evaluation and an unsupervised structural evaluation.
2.5.1. Supervised Evaluation (n = 50 Images)
A subset of 50 images has been selected for which manual reference (ground truth) segmentations have been generated. The performance of the method was evaluated using the Intersection over Union (IoU) metric, defined as the ratio between the area of the intersection and the area of the union of the automatically and manually segmented regions, expressed as follows:
where
P denotes the predicted mask and
G the reference (ground truth) mask, manually segmented.
2.5.2. Unsupervised Structural Assessment (n = 343 Images)
Structural metrics were analyzed on the complete dataset, including the segmented area ratio (AS), defined as follows:
where
S is the number of pixels in the area segmented as object, and
I is the total number of pixels in the image. Furthermore, the metric associated with the ratio of the largest connected component (LCR) is analyzed, which is used to quantify the structural coherence of the identified segment, as presented below:
where
is the connected component with the largest area,
represents the area of that component, and
S corresponds to the total segmented area. In addition, the catastrophic failure rate (FC) metric is used. This metric quantifies the proportion of images in which the segmentation method exhibits a severe failure, either by not detecting the cocoa pods or by predominantly segmenting irrelevant regions. The metric is defined as
where
is the number of images that exhibit a catastrophic failure, and
n is the total number of samples considered in the evaluation.
Catastrophic failure (FC) was defined as a binary indicator of severe segmentation failure. A mask was classified as FC = 1 when at least one of the following conditions was met: a segmented area ratio (AS) < 0.01, a segmented area ratio (AS) > 0.85, or a largest connected component ratio (LCR) < 0.30. These thresholds indicate almost complete loss of the target, excessive oversegmentation, or strong mask fragmentation, respectively. Otherwise, the mask was classified as FC = 0.
3. Results
This section presents the results obtained from the comparative application of classical image segmentation techniques—specifically, global thresholding, K-means clustering, and the GrabCut algorithm—on images of cocoa pods acquired under actual field conditions. Statistical analyses of the dataset, supervised evaluation based on the Intersection over Union (IoU) metric, and unsupervised structural metrics applied to the entire dataset are incorporated. The purpose is to evaluate the performance of the considered methods under real field conditions, through their average accuracy, structural stability, and operational robustness.
The experiments were carried out in a conventional computing environment without the use of hardware acceleration, since the main objective of the study lies in analyzing algorithmic behavior and evaluating methodological robustness, rather than in optimizing computational performance. The implementation was carried out in Python using the OpenCV library, employing standard functions for color space conversion, filtering, and the application of morphological operations. Likewise, these functions were used for the execution of the K-means and GrabCut algorithms, without introducing any modifications to the internal logic of these algorithms.
3.1. Characterization of the Image Dataset Following Preprocessing
In
Table 2, the statistical characterization of the image set after preprocessing is presented. To ensure spatial homogeneity in the evaluation process, the images were normalized to a fixed width of 900 pixels, while keeping the aspect ratio unchanged. This normalization reduced the geometric variability without modifying the fundamental statistical properties of the dataset.
Despite the applied spatial adjustment, the intensity distributions continue to exhibit multimodal behavior and lack a sharp separation between the classes corresponding to object and background. The average negative kurtosis [−0.67] is indicative of relatively platykurtic distributions, while the number of local maximum peaks in the histogram corroborates the existence of multiple dominant intensity regions. Likewise, the coefficient of variation for the luminance channel [ = 0.51] reveals a high degree of heterogeneity in the illumination, which is characteristic of uncontrolled agricultural scenarios.
Gradient-based indicators [Gradient average = 49.51] reveal an increase in structural complexity, associated both with the enhancement of the object’s edges and with the presence of textures in the background. Taken together, these results indicate that preprocessing succeeds in standardizing the spatial scale but does not eliminate the intrinsic statistical complexity of the real environment, which poses a challenge for segmentation methods based exclusively on intensity information.
3.2. Qualitative Segmentation Under Real Operating Conditions
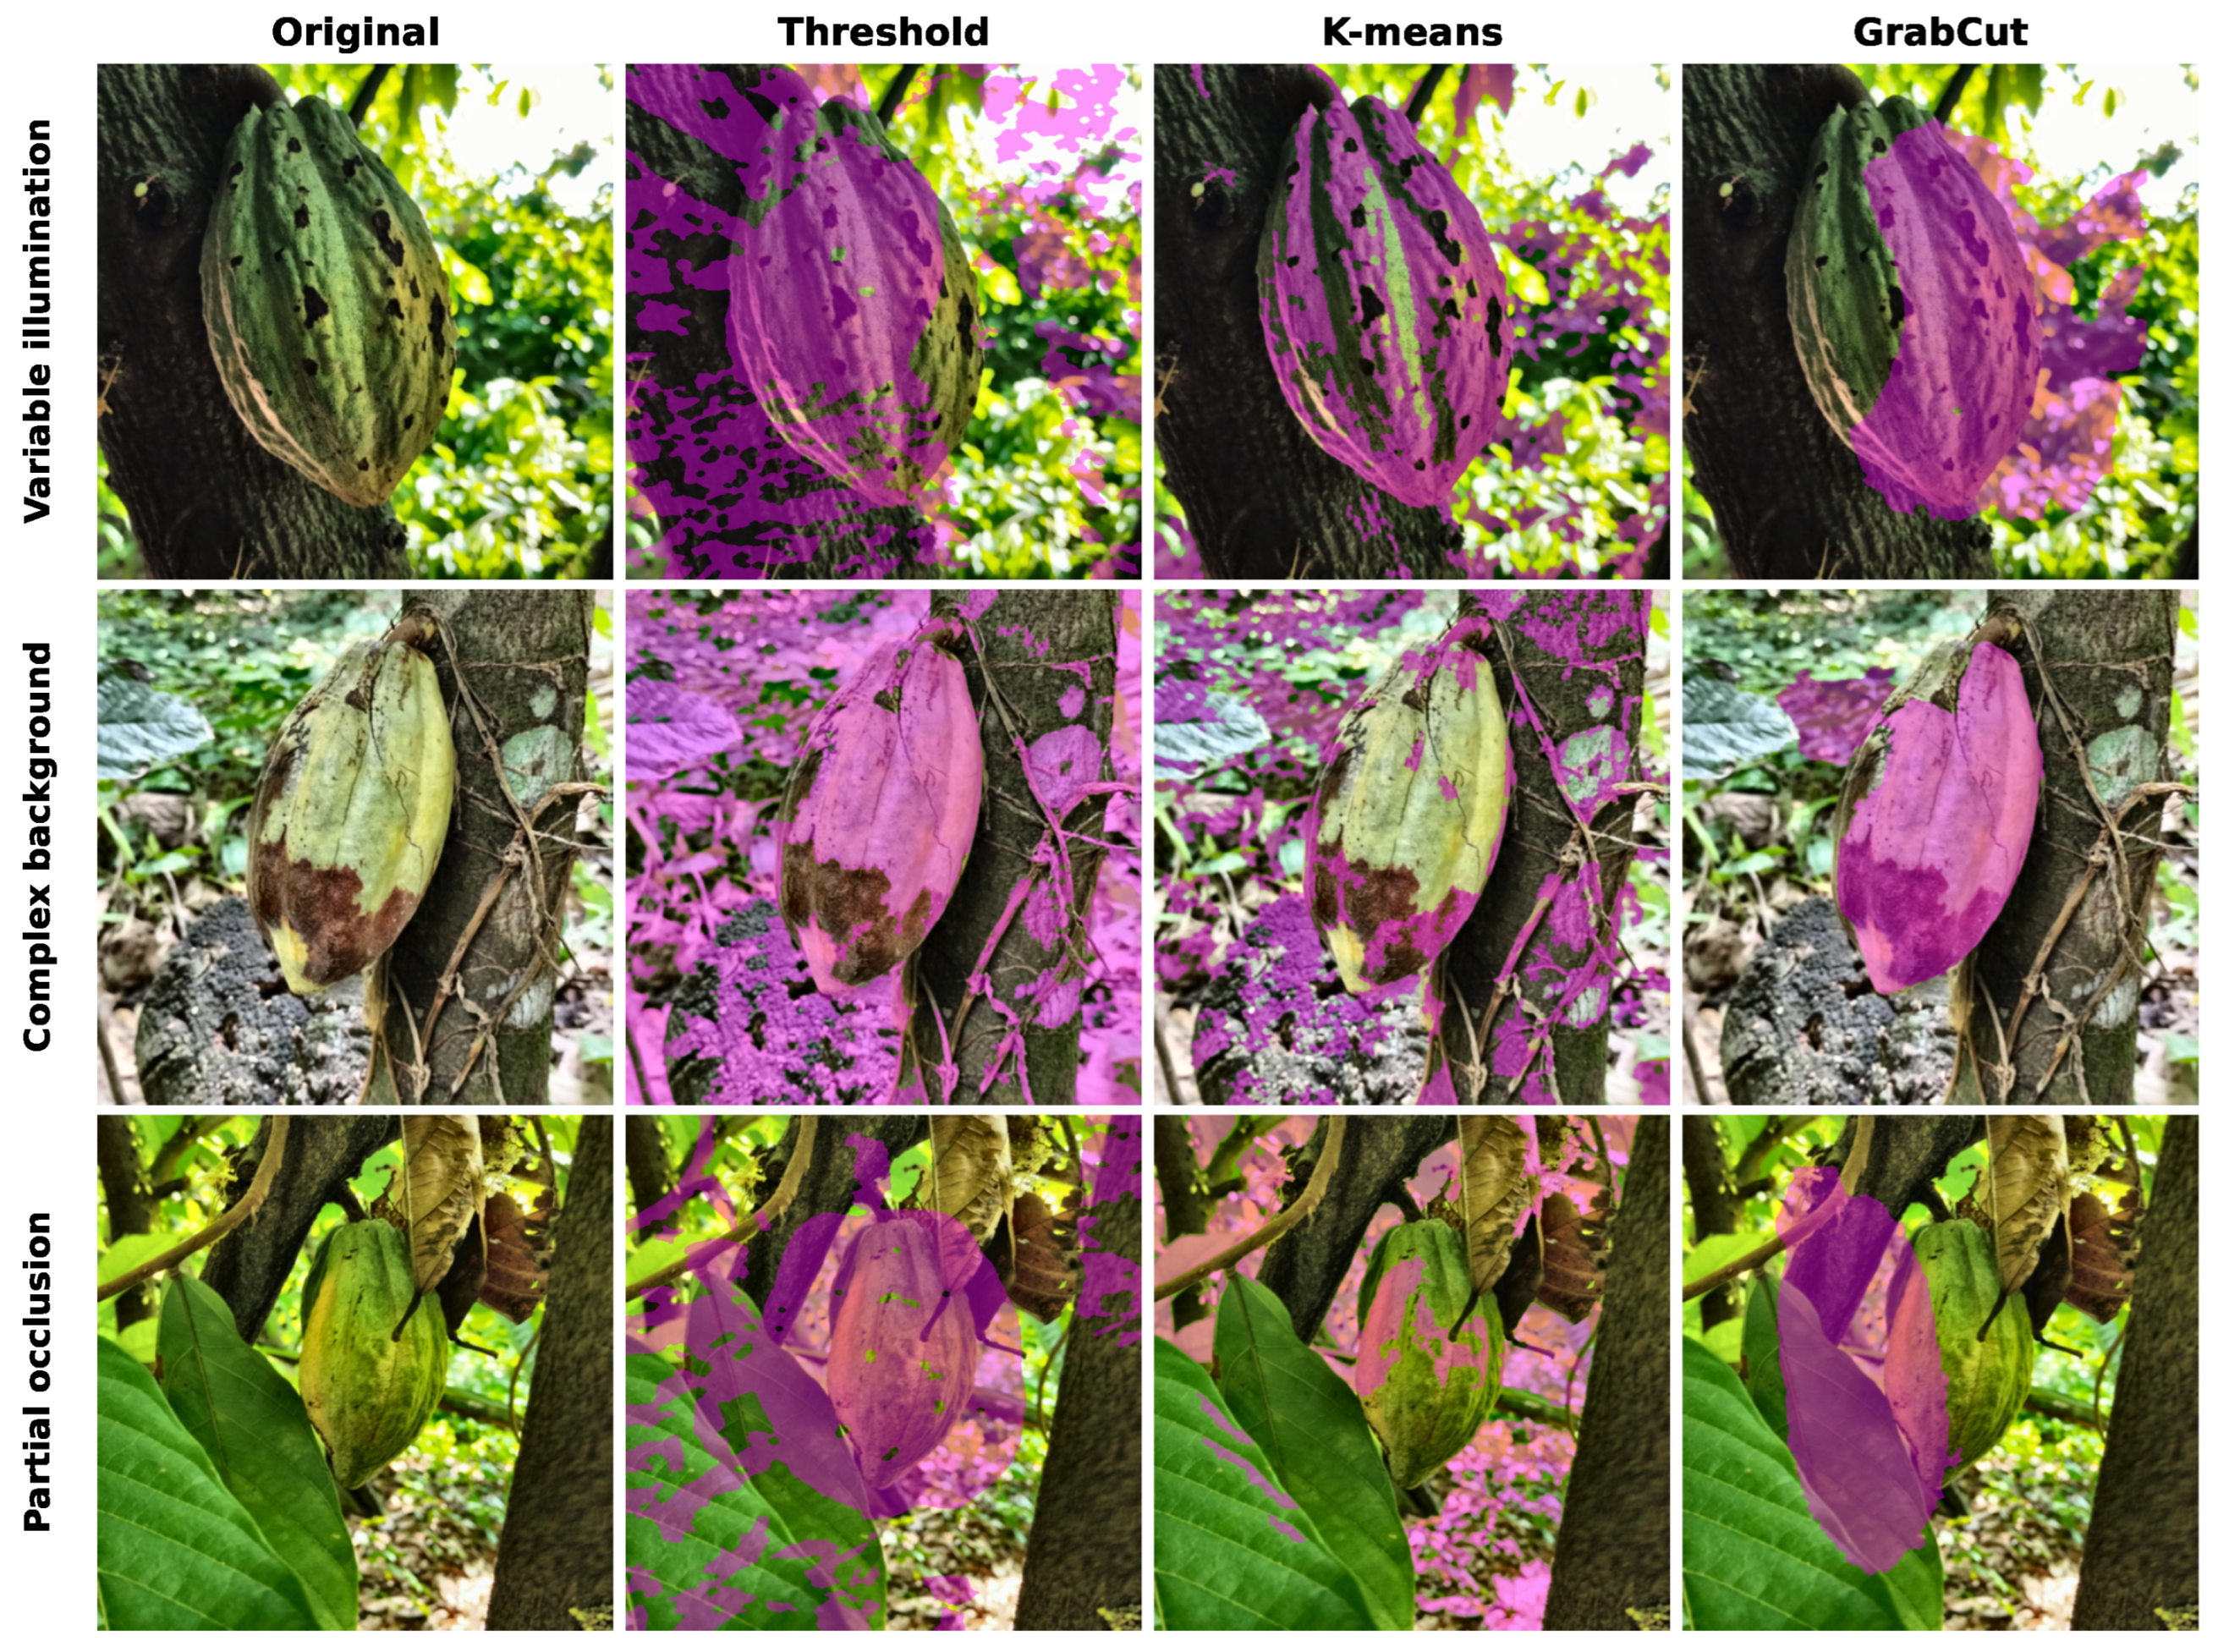
In
Figure 1 presents representative segmentation results for healthy and moniliasis-infected cocoa pods, comparing global thresholding, K-means clustering, and the GrabCut algorithm.
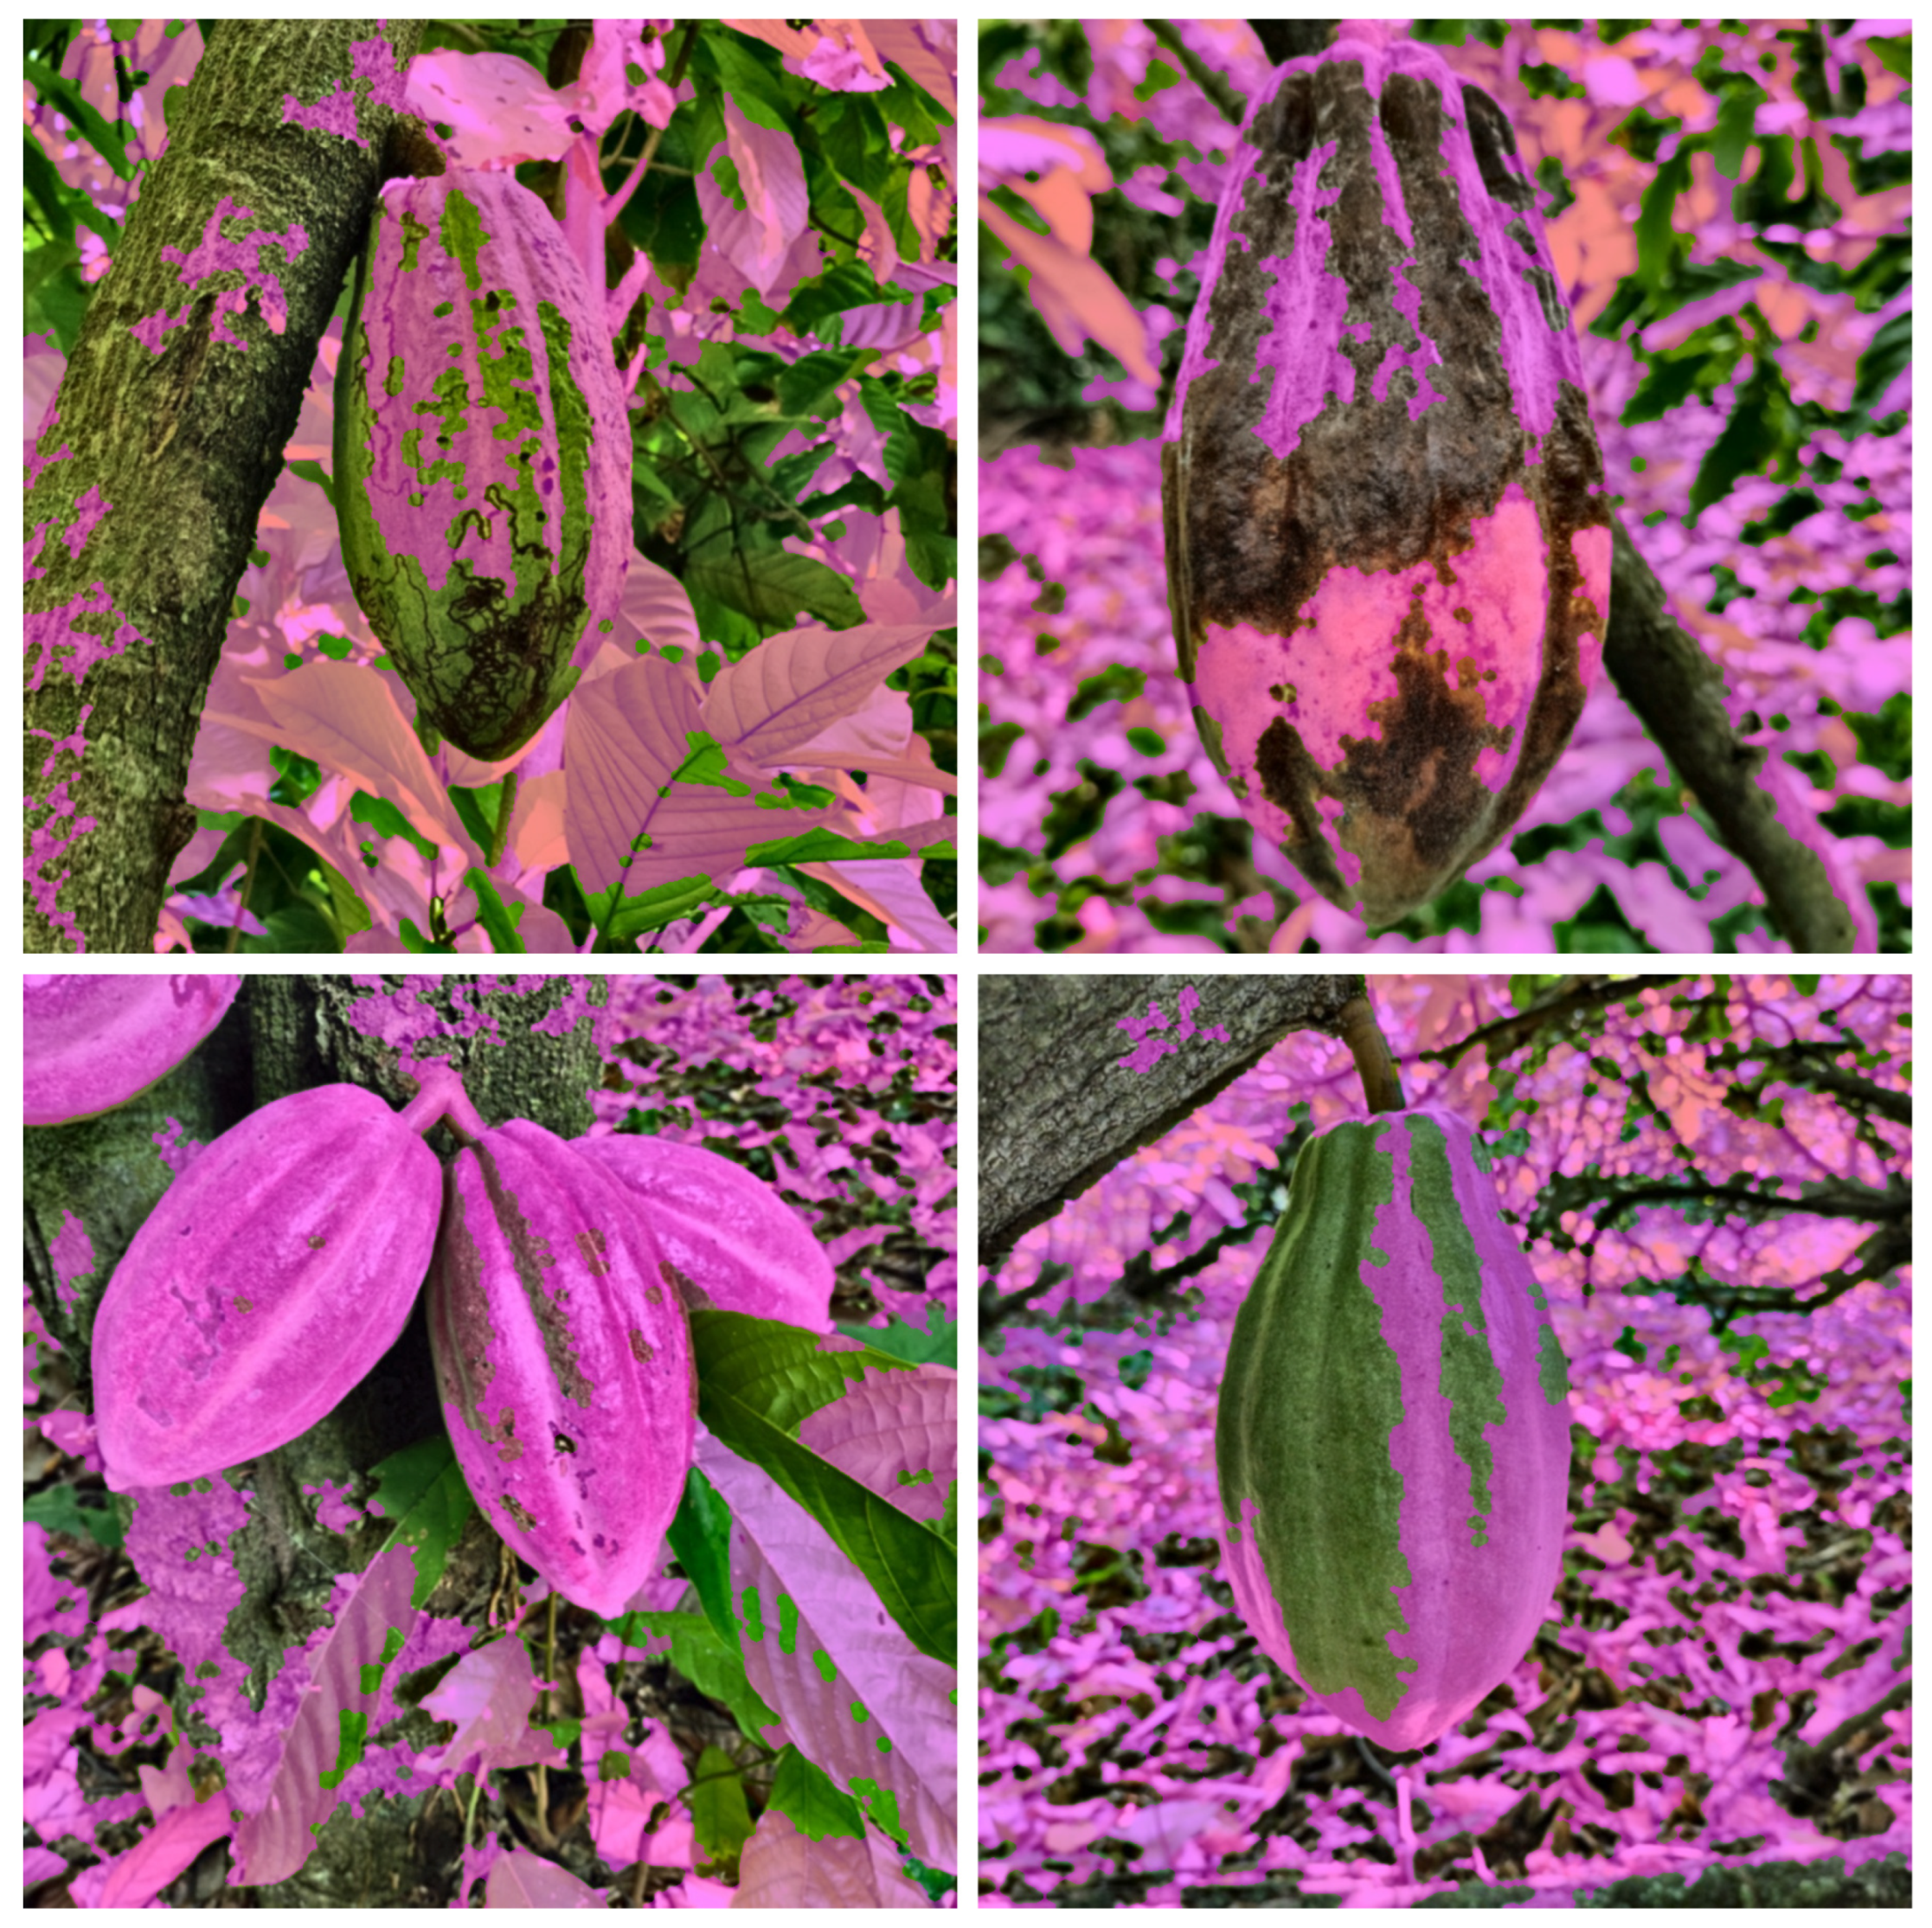
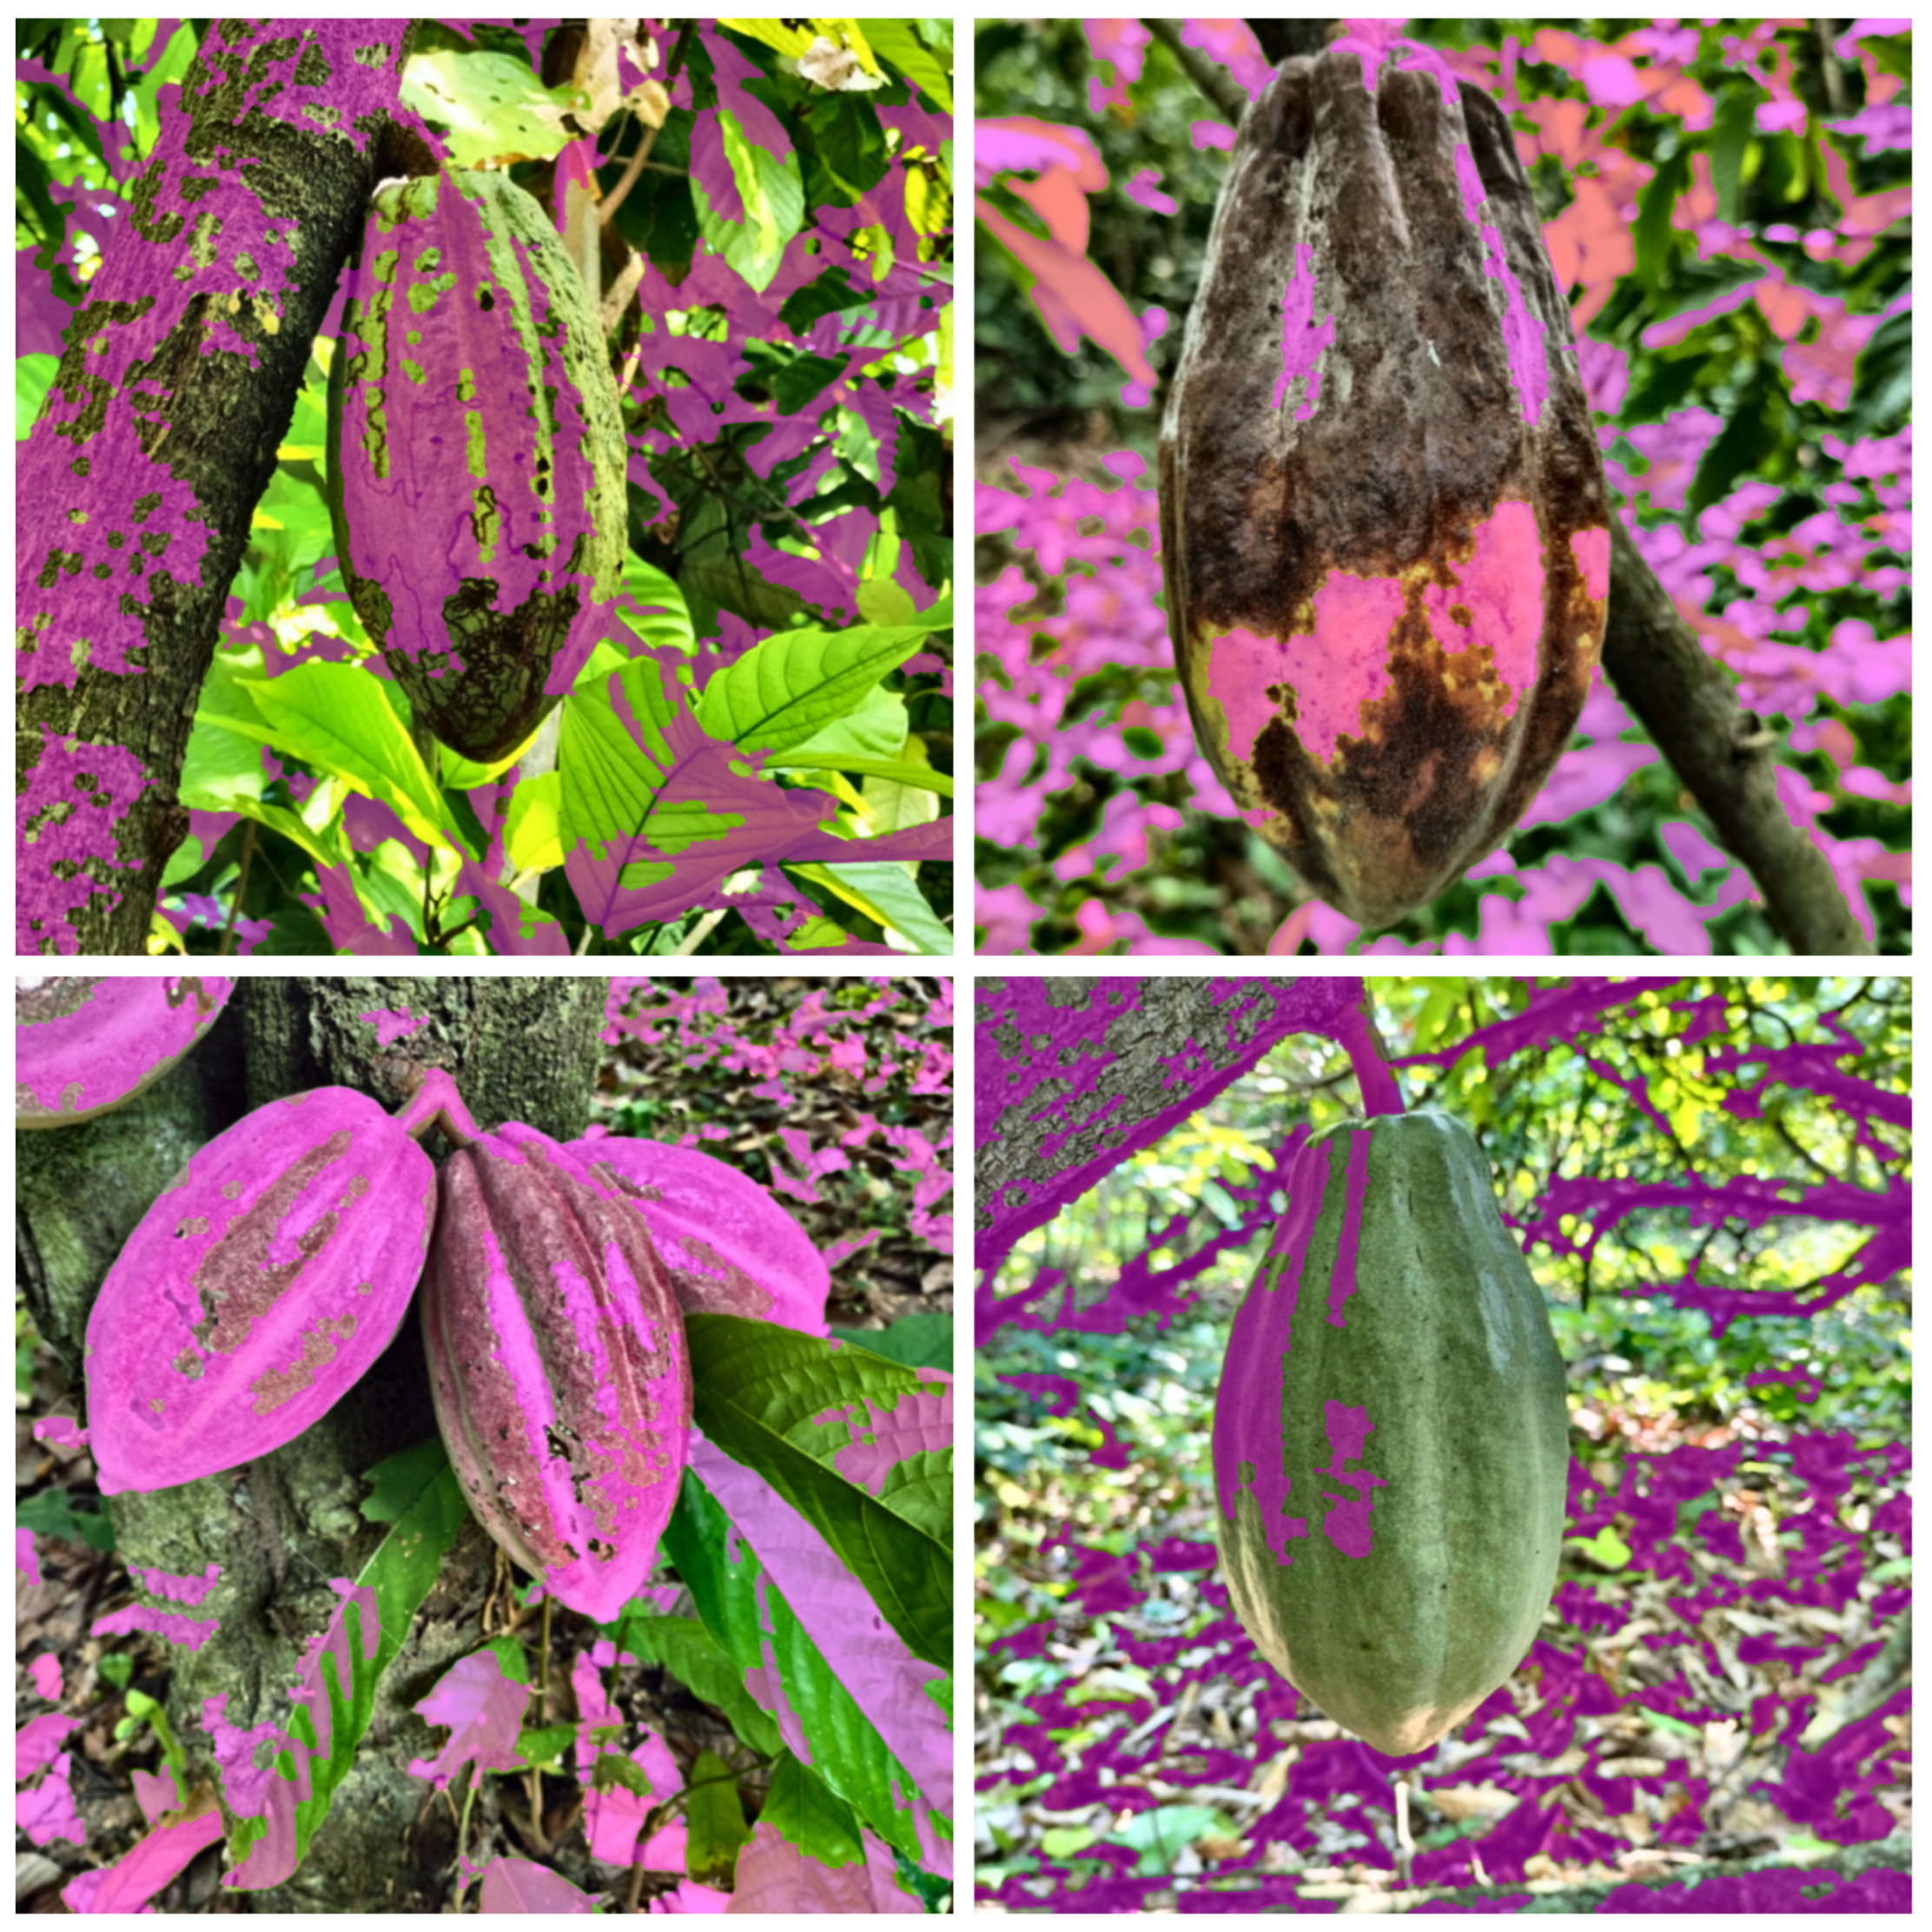
Global thresholding makes it possible to partially isolate the regions corresponding to the fruit; another example of this procedure is illustrated in
Figure 2. However, this approach exhibits systematic background contamination in areas with high chromatic and textural similarity, particularly in the presence of leaves, branches, and variations in natural lighting conditions.
The K-means method, illustrated with an additional example in
Figure 3, improves chromatic discrimination compared to thresholding. However, it exhibits pronounced structural fragmentation in regions with high textural variability, which results in the generation of multiple disconnected components.
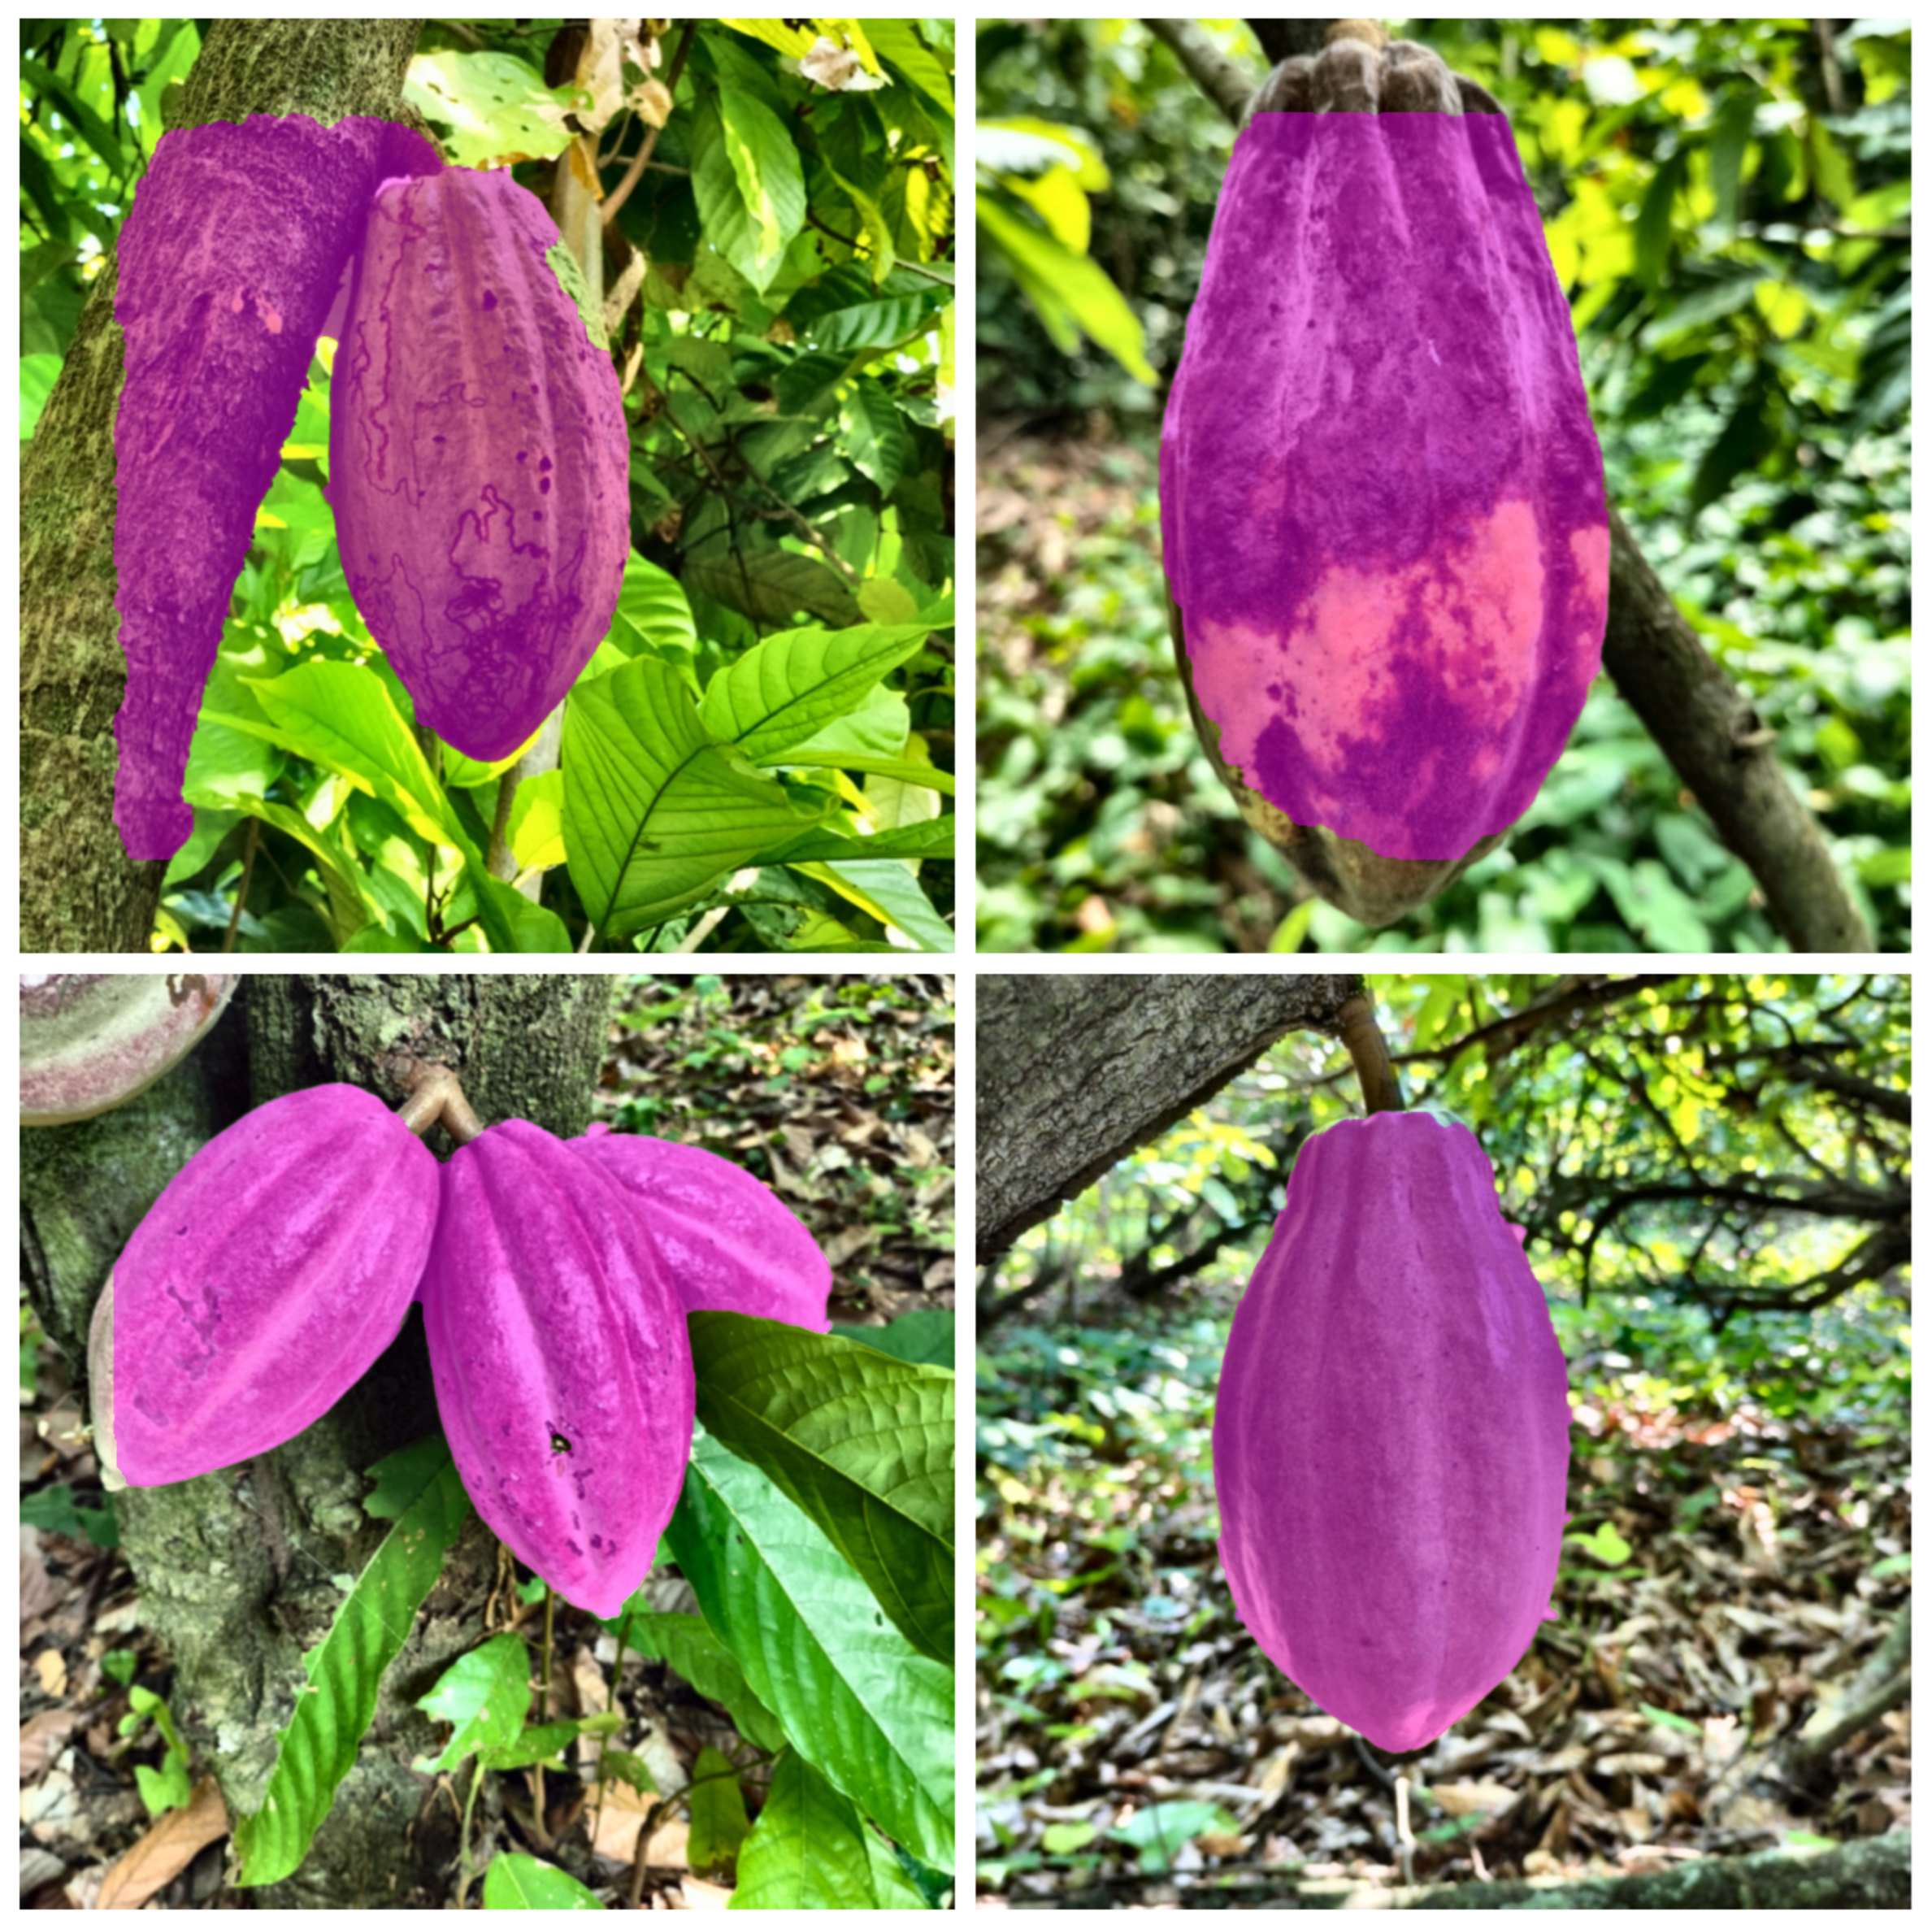
In
Figure 4, other images are presented in which the GrabCut method exhibits a more consistent contour delineation, a substantial reduction in spurious background segmentation, and greater spatial continuity in the representation of the object. This behavior indicates that the iterative probabilistic background–foreground modeling, together with the spatial regularization built into GrabCut, favors a more robust and stable segmentation under uncontrolled agricultural conditions.
In
Figure 3 shows that K-means can improve chromatic separation in some regions compared with thresholding. Nevertheless, its performance remains compromised by the high color similarity between cocoa pods and surrounding vegetation, which often leads to fragmented masks.
In
Figure 4, additional segmentation results obtained using the GrabCut method, applied to images of cocoa pods captured in uncontrolled agricultural environments, are presented. This method enabled a more precise delineation of the cocoa pod contour and a noticeable reduction in background segmentation errors, compared to thresholding techniques and the K-means clustering algorithm. Likewise, the method exhibits remarkable robustness to variations in lighting conditions, partial occlusions, and the presence of backgrounds with high structural complexity.
3.3. Supervised Quantitative Evaluation (n = 50 Images)
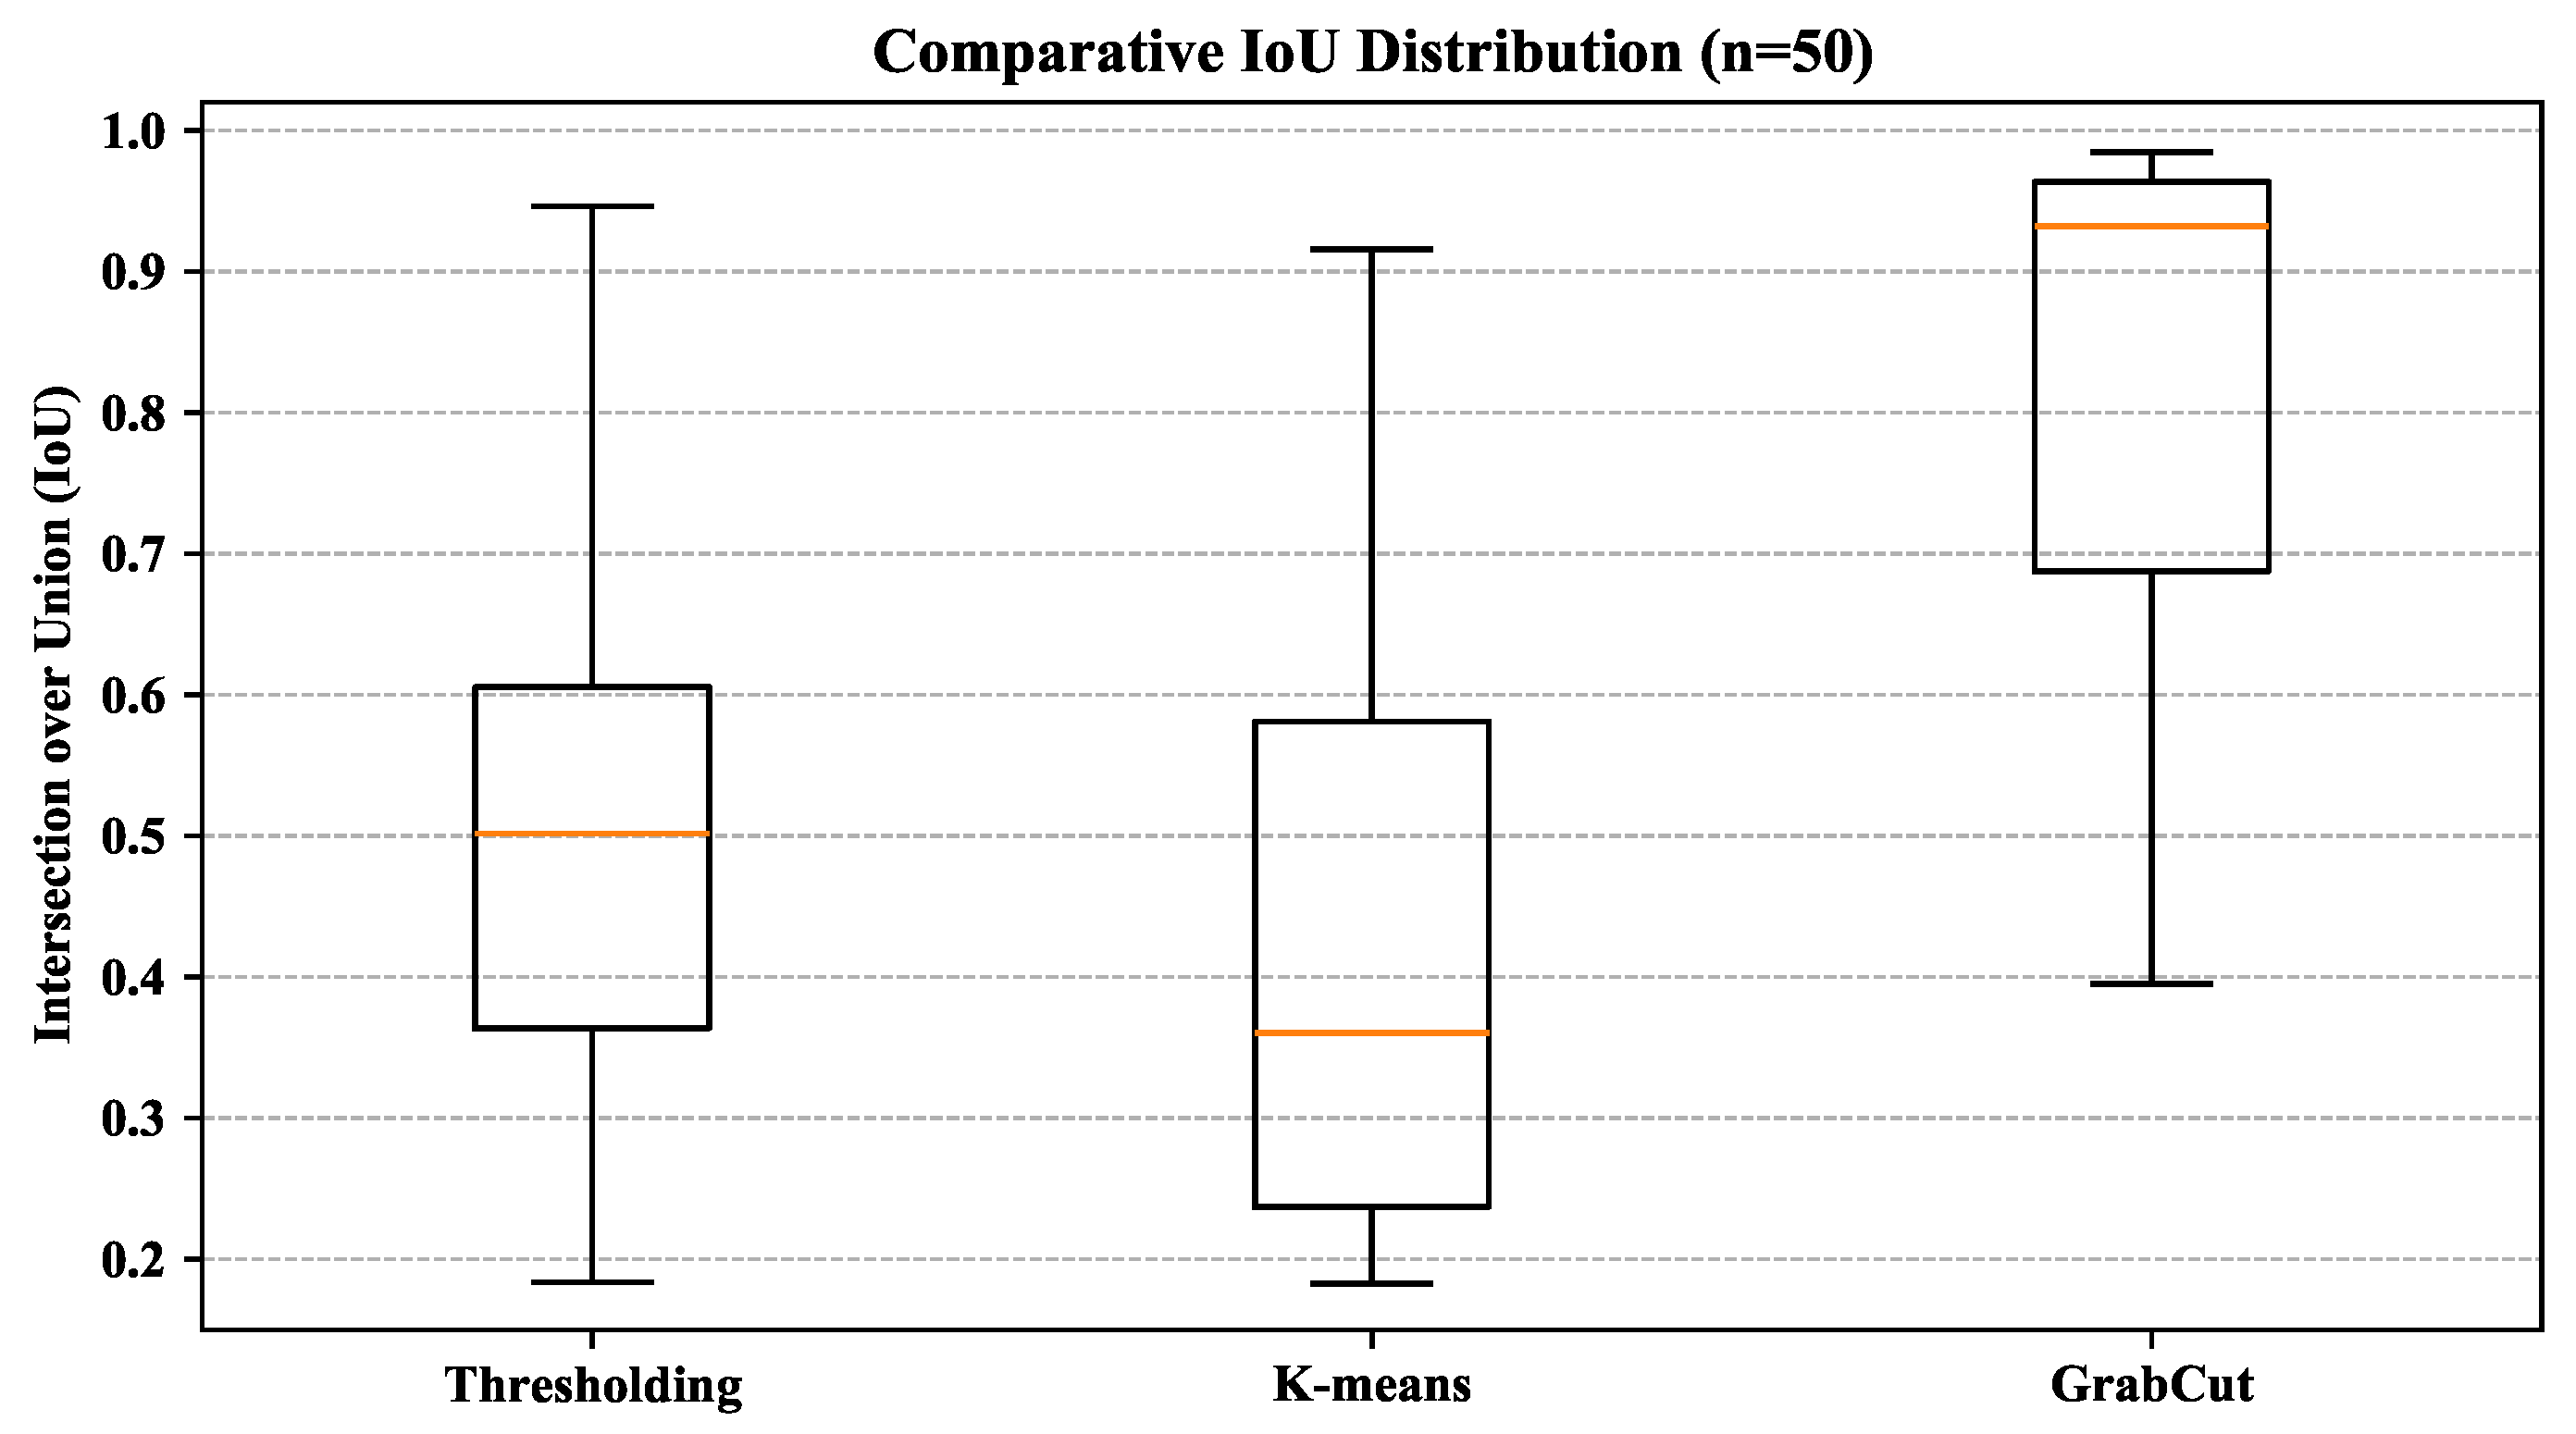
The quantitative evaluation was carried out on a subset of 50 images that had a manual reference segmentation, using the Intersection over Union (IoU) index as the performance metric. The GrabCut method achieved the highest average performance [IoU average = 0.814], significantly outperforming global thresholding [IoU average = 0.505] and the K-means algorithm [IoU average = 0.416].
The box plot in
Figure 5 indicates that GrabCut not only achieves higher mean values but also exhibits a significantly higher median and a smaller interquartile range compared to the classical methods. These results suggest greater consistency between samples and lower variability in the delineation of the object. In contrast, K-means exhibits a broader dispersion and a recurring occurrence of low values, which reflects a notable instability in scenarios characterized by illumination variations and highly structured or complex backgrounds.
Pairwise statistical comparisons among the segmentation methods were performed using the Wilcoxon signed-rank test on the paired IoU values obtained from the same 50 manually annotated images, with a significance level of . The results showed statistically significant differences for all pairwise comparisons: global thresholding vs. K-means (), global thresholding vs. GrabCut (), and K-means vs. GrabCut (). These differences remained significant even under a Bonferroni-corrected significance threshold for three pairwise comparisons. Overall, the results indicate that the observed differences in segmentation performance were unlikely to be attributable only to random variability but rather reflect systematic differences in algorithmic behavior.
3.4. Structural Robustness Analysis (n = 343 Images)
With the aim of assessing full-scale operational stability, the 343 segmentations generated by each method were analyzed using unsupervised metrics: segmented area proportion (AS), the largest connected component ratio (LCR), and the catastrophic failure rate (FC). The full values of AS, LCR and FC are presented in
Table 3.
GrabCut showed a failure rate of 1.74% and an average LCR of 0.985, which indicates predominantly single-component segmentations and high structural coherence. Global thresholding showed an equivalent failure rate of 1.74%, although associated with lower spatial consistency [LCR = 0.771], which suggests the partial inclusion of background regions or episodes of localized over-segmentation. In contrast, K-means exhibited a substantially higher failure rate (17.49%) and an average LCR of 0.516, indicating pronounced structural fragmentation and marked instability in the delineation of the object of interest.
3.5. Failure-Case Analysis of GrabCut Under Field Conditions
In
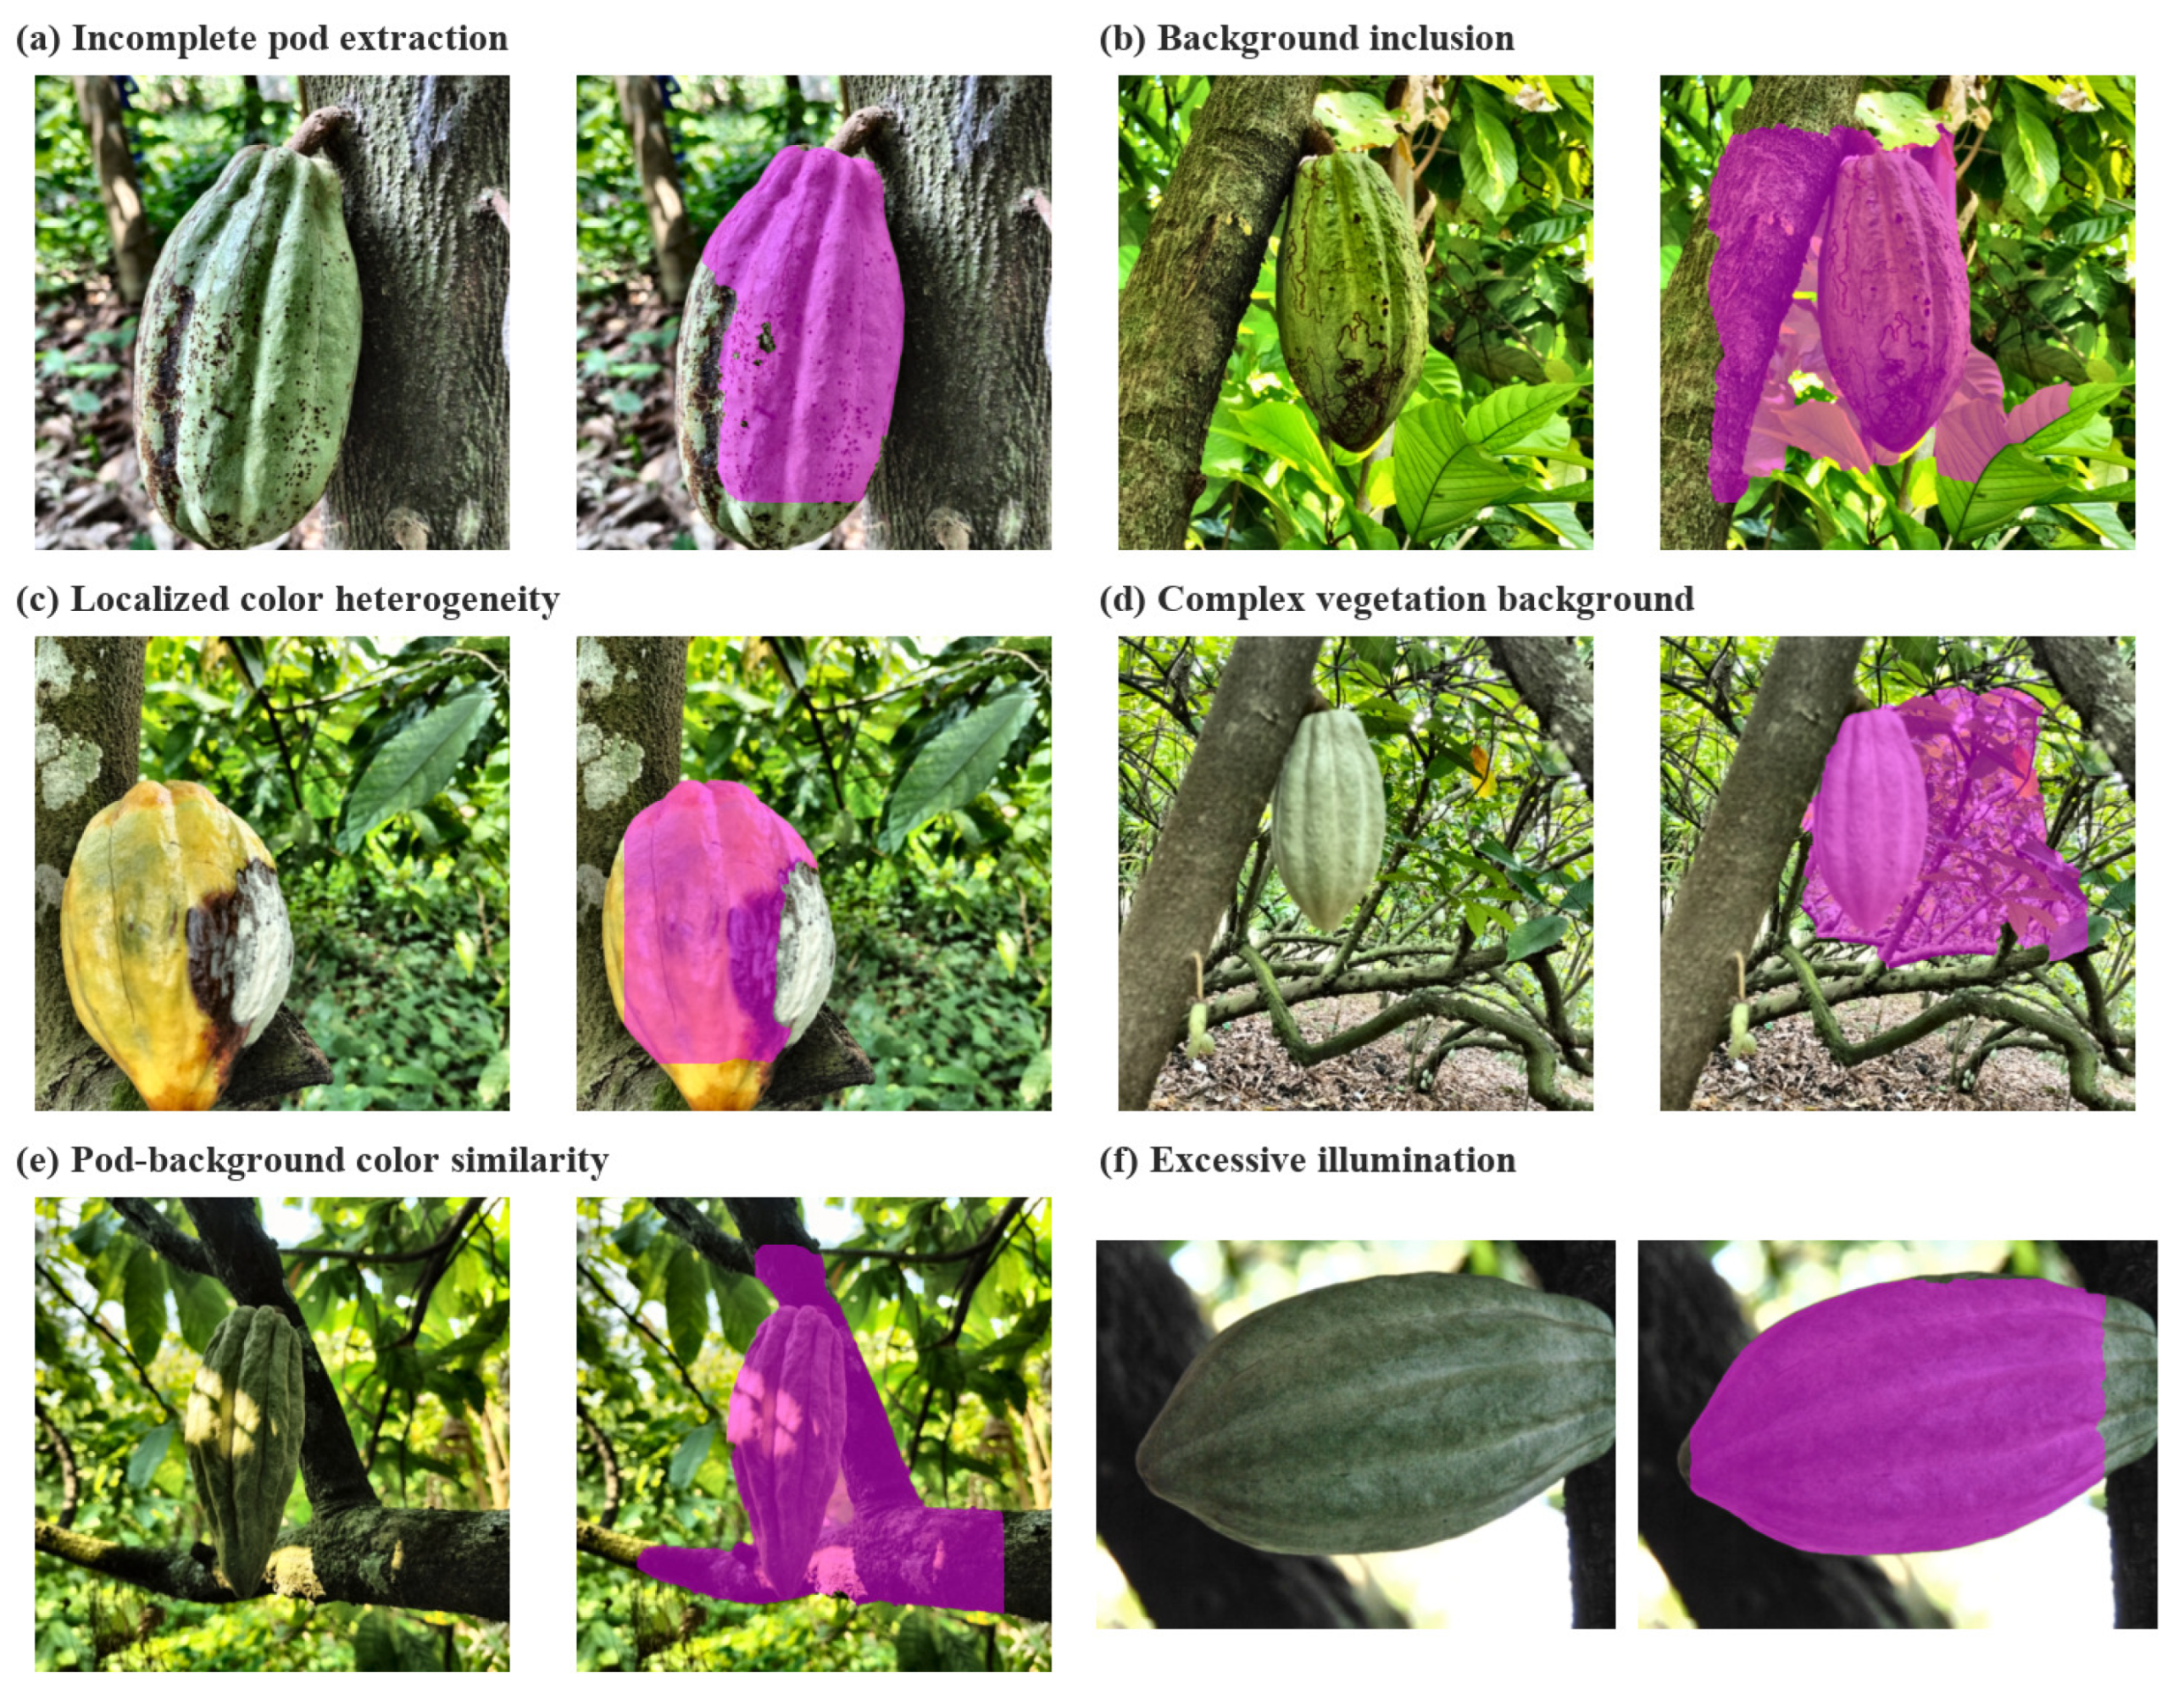
Figure 6 presents six representative catastrophic failure cases of the GrabCut method under challenging field conditions. Although GrabCut achieved the highest overall segmentation accuracy and structural coherence, these examples show that its performance can be affected when foreground–background separation becomes ambiguous or when the visual properties of the pod and the surrounding scene overlap.
The observed failure modes include incomplete pod extraction, background inclusion, localized color heterogeneity, complex vegetation background, pod–background color similarity, and excessive illumination. Overall, these examples indicate that GrabCut loses precision when pod boundaries are poorly defined, when background elements are mistakenly modeled as foreground, when strong local color variations occur within the pod surface, or when illumination conditions alter the apparent contrast between the pod and its surroundings. These cases correspond to catastrophic failures according to the FC metric and do not represent the total number of images with minor segmentation inaccuracies.
In
Table 4 summarizes the probable causes and practical mitigation strategies for the representative GrabCut failure cases shown in
Figure 6. These cases indicate that GrabCut is mainly affected by ambiguous foreground–background separation, color similarity, heterogeneous pod appearance, and uncontrolled illumination conditions.
These mitigation strategies suggest that GrabCut can be strengthened for field deployment by combining improved acquisition protocols with targeted preprocessing and post-processing steps.
3.6. Processing Time per Algorithm
In addition to accuracy and structural robustness, the computational cost of each segmentation method was analyzed in order to evaluate its potential use in practical field monitoring scenarios. The processing time was measured for the three evaluated algorithms using the same set of 343 images. The spatial normalization described in
Section 2.3.1 was preserved; therefore, all images were resized to a fixed width of 900 pixels while maintaining their original aspect ratio, as shown in
Table 2.
The experiments were conducted on a laptop computer equipped with an AMD Ryzen 5 4600H processor (Advanced Micro Devices, Santa Clara, CA, USA) with Radeon Graphics at 3.00 GHz and 8 GB of RAM, running Windows 10. The implementation was developed in Python 3.10.8 using OpenCV 4.10.0, without GPU acceleration. Processing time was measured using Python’s
time.perf_counter() function and included only the segmentation stage, excluding image loading, overlay generation, and file writing operations. In
Table 5 presents the average processing time per image and the corresponding processing speed for each method.
The thresholding-based method was the fastest, achieving 38.06 images/s, which indicates its suitability for near-real-time operation under the evaluated CPU-based conditions. However, this computational advantage must be weighed against its lower segmentation accuracy and higher tendency toward oversegmentation. K-means LAB showed an intermediate cost of 2.63 images/s, making it more appropriate for offline or low-frequency monitoring. GrabCut, although the most accurate and structurally robust method, required 6.738 s per image, limiting its applicability for real-time field deployment. These results highlight a clear trade-off between computational efficiency and segmentation quality, with method selection depending on whether speed or segmentation reliability is prioritized.
These results confirm that robustness cannot be evaluated solely based on average accuracy on annotated subsets but that full-image structural stability at scale must be explicitly incorporated. The high failure rate and the high degree of fragmentation observed in K-means indicate an intrinsic vulnerability to illumination heterogeneity and to the background complexity that characterize real agricultural environments. Although the failure rate was comparable between GrabCut and the thresholding methods, the discrepancy in the LCR value reveals substantial differences in the structural consistency of the generated segmentations.
The integrated comparison between supervised evaluation using IoU and full-scale structural analysis reveals consistent performance patterns across the different methods. GrabCut combines higher average accuracy with high structural coherence (high LCR) and a low failure rate, demonstrating high stability both in geometric delineation and in maintaining the spatial integrity of the generated masks. Global thresholding exhibits an intermediate performance, characterized by acceptable structural stability but lower accuracy in object delineation. In contrast, K-means exhibits significant instability in terms of both accuracy and structural robustness, reflected in a high failure rate and recurrent fragmentation of the segmented regions. These results confirm that methods based on fixed global intensity thresholding or unsupervised color clustering are highly susceptible to segmentation instability under uncontrolled lighting conditions and heterogeneous background textures, which are intrinsic characteristics of real agricultural environments.
4. Discussion
The present study carried out a comparative evaluation of classical segmentation methods applied to images of cocoa pods acquired under real field conditions, characterized by high variability in lighting, heterogeneous backgrounds, and the use of non-standardized capture devices. In contrast to recent research focused on deep learning models [
14,
15,
29], this work shows that, even among classical approaches, there are significant structural differences in terms of accuracy and robustness.
The results obtained show that GrabCut consistently outperforms both global thresholding and K-means in terms of accuracy (IoU) and structural stability (LCR and FC). The low rate of catastrophic failures, 1.7%, together with the high average LCR value of 0.985, indicate that the generated segmentations are predominantly contiguous and structurally coherent. In contrast, K-means exhibits a failure rate of 17.5% and an average LCR value of 0.517, which indicates severe fragmentation and high structural vulnerability to environmental variability. These differences were statistically significant according to the Wilcoxon signed-rank test, suggesting that GrabCut’s superior performance is unlikely to be explained only by random variability in the data.
The observed behavior can be attributed to the intrinsic properties of the algorithms considered. Global thresholding is based on the assumption of clearly separable intensity distributions, which is inadequate in the presence of multimodal histograms, negative kurtosis, and high luminance variability, as observed in the dataset. The k-means algorithm, although it incorporates chromatic information, lacks robust spatial regularization, which leads to over-segmentation and fragmentation in scenes characterized by complex textures. In contrast, GrabCut integrates iterative probabilistic background–object modeling together with a graph-based spatial refinement, which provides greater robustness to variability in lighting conditions and structural heterogeneity in the scene.
Although GrabCut produced the most structurally coherent masks among the evaluated methods, its performance was still affected by specific field conditions that weakened foreground–background separation. As shown in
Figure 6, the main failure modes were associated with incomplete pod extraction, background inclusion, localized color heterogeneity, complex vegetation background, pod–background color similarity, and excessive illumination. These cases indicate that GrabCut is particularly sensitive to ambiguous boundaries, strong intra-pod visual variability, color similarity between the pod and surrounding vegetation, and illumination conditions that alter the apparent contrast of the scene.
A relevant methodological strength of the study was the preservation of images acquired using devices with different levels of technological quality. Instead of excluding the lower-resolution images, these were retained in the analysis in order to safeguard the representativeness of the actual production environment, giving priority to external validity over experimental homogeneity. This methodological decision made it possible to assess the algorithm’s performance under genuinely operational conditions.
Although deep learning-based segmentation methods may provide greater robustness when sufficiently trained on representative annotated datasets, their implementation requires larger pixel-level annotated datasets, supervised training, and greater computational resources. Therefore, the present study provides a practical baseline for classical segmentation methods that can be implemented without a training stage and with lower computational requirements. Nevertheless, the present study has several limitations. First, the supervised evaluation based on the Intersection over Union (IoU) overlap coefficient was restricted to a subset of 50 images with manual segmentation. This subset represents only a fraction of the total dataset and may limit the generalizability of the results. Secondly, spatial normalization to a fixed resolution of 900 pixels could negatively affect the fidelity in representing fine contours and small structures, introducing potential biases in the estimation of segmentation accuracy. Lastly, the comparison did not include deep learning-based models, because the main objective was to establish a controlled baseline among classical segmentation methods under real field conditions.
Taken together, the results confirm that the evaluation of classical segmentation methods under real field conditions remains scientifically relevant. In addition, this study provides applied evidence for the design of phytosanitary diagnostic systems that are accessible and contextually adapted to producers’ needs in tropical regions.
5. Conclusions
This study evaluated global thresholding, K-means clustering, and GrabCut for cocoa pod segmentation under uncontrolled field conditions. The experimental design enabled the assessment of algorithmic behavior in realistic agricultural scenarios rather than idealized acquisition conditions. Under these conditions, GrabCut achieved the highest segmentation accuracy and structural coherence, with an IoU of 0.814, an LCR of 0.985, and a catastrophic failure rate of 1.7%. In contrast, global thresholding was limited by illumination variability and poor foreground–background separability, which favored the inclusion of background regions, whereas K-means exhibited mask fragmentation due to chromatic similarity between pods and vegetation and the lack of robust spatial regularization. The combined evaluation using supervised accuracy metrics and full-dataset structural indicators demonstrated that segmentation reliability cannot be inferred from average overlap performance alone; it also requires assessing mask coherence and failure behavior at scale. These results indicate that iterative foreground–background modeling combined with spatial regularization improves segmentation robustness when field visual complexity limits foreground–background separability. Although GrabCut required a longer CPU-based processing time than simpler classical methods, this cost should be interpreted in relation to its training-free nature. Unlike deep learning-based semantic segmentation, GrabCut does not require large pixel-level annotated datasets, supervised training, or GPU-dependent model development. Therefore, it represents a robust intermediate alternative for offline phytosanitary analysis and low-frequency field monitoring in resource-constrained cacao production contexts. Future work should include a stratified analysis of healthy and diseased cocoa pods to determine how disease-related tonal heterogeneity affects the performance of segmentation methods. Infected pods may exhibit discoloration, necrotic areas, fungal growth, or sporulation, increasing intra-object variability in intensity and color and potentially altering the failure mechanisms of the evaluated classical methods. In addition, improved image acquisition protocols and optimized GrabCut configurations, including iteration-number tuning, should be evaluated to reduce processing time without compromising segmentation quality or field applicability.



 ,
,