Article

Proximate Composition of Rice Grains Grown in Brazil Assessed Using Near-Infrared Spectroscopy: A Strategy for Selecting Superior Genotypes

by
Aguiar Afonso Mariano
1,2,
Gabriel Brandão das Chagas
1,
Larissa Alves Rodrigues
3,
Andreza de Brito Leal
3,
Michel Cavalheiro da Silveira
1,
Maurício de Oliveira
3,
Antonio Costa de Oliveira
1,
Luciano Carlos da Maia
1 and
Camila Pegoraro
1,*
1
Departamento de Fitotecnia, Faculdade de Agronomia Eliseu Maciel, Universidade Federal de Pelotas, Pelotas 96050-500, RS, Brazil
2
Instituto de Investigação Agrária de Moçambique, Avenida das FPLM Number 2698, Maputo 3658, Mozambique
3
Departamento de Ciência e Tecnologia Agroindustrial, Faculdade de Agronomia Eliseu Maciel, Universidade Federal de Pelotas, Pelotas 96050-500, RS, Brazil
*
Author to whom correspondence should be addressed.
AgriEngineering 2025, 7(9), 305; https://doi.org/10.3390/agriengineering7090305
Submission received: 16 August 2025 / Revised: 5 September 2025 / Accepted: 15 September 2025 / Published: 19 September 2025

Abstract

A rice grain’s proximate composition determines its nutritional potential. Macronutrient quantification is essential to identify superior genotypes and direct breeding efforts to reach more people who are vulnerable. Conventional methods to determine proximate composition are highly accurate; however, they remain time-consuming, costly, and destructive. Near-infrared (NIR) spectroscopy enables proximate composition analysis in a non-destructive, rapid, inexpensive, and practical manner, providing results similar to well-established conventional methods. This study aimed to evaluate the feasibility of NIRs-based selection to identify more nutritious rice genotypes. A collection of 155 rice genotypes grown in Southern Brazil was used. After harvest, grains were hulled, polished, and milled. NIRs was used to determine moisture, starch, protein, fat, ash, and fiber contents in rice flour. It was possible to differentiate genotypes with higher and lower levels of the investigated components. Similar and distinct values were observed in comparison to other studies, indicating the accuracy of NIRs and the effect of genotype and environment, respectively. Starch is correlated negatively with protein and fat, preventing the identification of genotypes with high levels of these three components. PCA enabled the separation of the genotypes but highlighted the complexity of sample distribution. NIRs is an effective and accurate method to determine the proximate composition of rice, enabling the selection of more nutritious genotypes.

1. Introduction

Rice (Oryza sativa L.) is a primary source of nutrients for a large portion of the world’s population, contributing to global food security [1]. Brazil is one of the main rice producers outside of Asia, with most of its production concentrated in Rio Grande do Sul [2]. Rice, combined with beans, is a staple food for Brazilians, especially for those with lower incomes [3].
The nutritional composition of rice, determined by its macronutrients, is essential to maintain bodily functions. The proximate composition includes macronutrients, such as carbohydrates, proteins, lipids, moisture, and ash. Studying the macronutrient profile of rice can help to target diets and identify more nutritious genotypes, which is crucial for regions with socially vulnerable populations [4]. Furthermore, it can assist rice breeders in the characterization and selection of parents to be used in crossing panels aimed at developing cultivars with more nutritious grains. Although accurate, conventional methods to analyze proximate composition are costly, input- and labor-intensive, and time-consuming, which limits their viable use in rapid or large-scale analyses [4]. Additionally, these methods are destructive, which makes subsequent use of the samples impossible, a hindrance in breeding programs where seeds from segregating populations are scarce. This scenario highlights the need for innovative and efficient techniques capable of combining sample preservation, precision, agility, and low cost.
Near-infrared (NIR) spectroscopy is an efficient technology for assessing proximate composition in grains [5], including rice [6]. The tool is based on energy absorption and molecular vibration in the infrared region [5,6]. The approach is widely used to determine the physicochemical properties of food due to its low cost, speed, accuracy, and non-destructive nature [7]. Statistical analysis, combined with NIRs technology, is essential to interpret the results. Univariate analyses contribute to evaluating individual variables [8], and multivariate analyses, such as principal component analysis (PCA) and Hierarchical Cluster Analysis (HCA), allow for assessing similarities or differences between genotypes. Chemometric analyses enable the separation and formation of groups; correlations between variables; and detection of outliers, quickly, easily, and simply [9,10].
Within this context, the objective of this study was to evaluate the application of NIRs to characterize the proximate composition of a collection of rice genotypes used in Brazil to guide dietary practices, indicate more nutritious cultivars, and select parents for plant breeding.

2. Materials and Methods

2.1. Plant Material

A panel of 155 rice genotypes belonging to indica and japonica subspecies used in Brazil was evaluated (Supplementary Table S1). The experiment was conducted during the 2023/2024 season (sowing was conducted in October 2023, and harvesting was completed in April 2024) at Embrapa Temperate Climate Lowland Experimental Station in Capão do Leão, Rio Grande do Sul, Brazil (Figure 1a). The soil is classified as a Haplic Planossoil (Albaqualf) [11], with geographic coordinates (31◦46′19′′ S, 52◦20′33′ W), at 17 m altitude. According to the Köppen climate classification, the local climate is Cfa, characterized as humid subtropical, without a defined dry season and hot summers [12]. A completely-randomized block design with three replicates was used; each replicate consisted of a 1 m row, spaced by 0.20 m with a seeding density of 50 viable seeds. The cultivation system was flood irrigation, and crop management followed the technical recommendations of the Southern Brazilian Irrigated Rice Society [13].

2.2. Post-Harvesting Processing

After manual harvesting, the panicles were dried (Figure 1b), and the grains were then manually threshed to ensure the preservation of the identity of each genotype (Figure 1c). Subsequently, the grains were hulled and polished (Figure 1d) using a Testing Rice Mill, model PAZ-1-DTA [14], to achieve uniform hull removal (Figure 1e). Subsequently, the grains were ground in a Perten hammer mill, model 3100, with a 0.8 mm sieve [15], suitable for producing homogeneous and fine-textured samples (Figure 1f). The resulting flour was packaged in plastic containers sealed with parafilm and stored under refrigeration (±4°C) until analysis (Figure 1g).

2.3. Proximate Composition Analysis

For proximate composition analysis, 50 g of rice flour from each sample was analyzed in triplicate. Protein, crude fiber, fat, moisture, ash, and starch contents were determined. The analyses were performed using near-infrared spectroscopy with the NIRS™ FOSS DS2500 L (Hillerød, Denmark) [16], which operates in the 400–2500 nm range (Figure 1h). This method offers high precision and efficiency in quantifying components based on the selective absorption of radiation by the chemical bonds present in the samples.
The calibration of the NIRS™ FOSS DS2500 L equipment used in this study was carried out by a specialized laboratory from FOSS based on curves built from standard samples analyzed using reference laboratory methods (such as Kjeldahl for protein and Soxhlet for oil). FOSS currently employs Artificial Neural Networks in its software to reduce prediction errors and to learn from new samples. For periodic updates of the calibration curves, 60 standard samples are used in triplicate, subjected to standard bench analytical procedures. These samples cover the expected range of variation in the constituents of interest, ensuring representativeness and robustness of the model. Additionally, the software itself indicates when values start to deviate from the curve, which signals that a new calibration should be urgently performed. Regarding accuracy, the average measurement errors (RMSE) are approximately: ±0.3 to 0.5% for protein, ±0.2 to 0.3% for moisture, and ±0.2 to 0.4% for lipids. Models with R2 values above 0.90 are standard for this type of application.

2.4. Statistical Analysis

Proximate composition data for flour components—ash, fat, fiber, moisture, protein, and starch—were recorded for a panel of 155 rice genotypes. Values represent proportion (%); therefore, an ANOVA was carried out using “Generalized Linear Models” with the “proc glimmix” procedure, considering beta distribution, logit link function g(y) = ln[y/(1 − y)], and the LAPLACE option for likelihood approximation [17,18]. Treatment means were re-transformed to the original unit of measurement (%) via the inverse logit function [y = (elogit(y)/(1 + elogit(y)))] using the “lsmeans genotype/llink” parameter. The identification of genotypes with extreme values was performed by ordering the means and separation via z-score values [(x − mean(x))/std(x)] and plotted in graphs to indicate distribution and genotype means using the ggplot2 package in R software version 4.3.3 [19]. To better understand the degree of association between variables, the means of all genotypes were used in Pearson’s correlation analysis according to the “proc corr” procedure. Subsequently, principal component analysis (PCA) was performed to understand the relationship between variables and their effect on the formation of groups of individuals with greater and lesser phenotypic similarity. The mean values of the genotypes were standardized using the “proc stdize” procedure with the method = std([(x − mean(x))/std(x)]), and PCA was performed using the “proc princomp”. The mean of the genotypes classified to each quadrant was calculated. The analyses were performed in SAS software version SAS OnDemand for Academics [20].

3. Results and Discussion

Moisture content can affect the storage life, quality, and palatability of rice grains. The acceptable moisture limit is 12%, and higher values promote pest and disease attack, making long-term storage impossible. Furthermore, reducing moisture content reduces chemical reactions and water activity. However, values below 12% can cause breakage during processing [6,21,22,23].
Moisture contents in grains of the investigated genotypes ranged from 10 to 14%, with an average of 12.5%, within the acceptable limit established in Brazil (14%) [24]. Twenty-two genotypes with moisture values below the average were identified: G157, G102, G133, G6 (z-score < −2), G139, G168, G66, G103, G1, G119, G54, G164, G88, G12, G22, G41, G78, G68, G158, G148, G71, and G113 (z-score < −1). Most genotypes (105) presented grains with moisture content close to the average. Above-average moisture content was observed in 28 genotypes: G9, G112, G134, G152, G69, G98, G153, G36, G159, G146, G96, G101, G172, G167, G162, G73, G91, G108, G156, G25, G50, G72, G136, G52, G116, G143, G26, and G48 (z-score > 1) (Figure 2). These values are within expectations, given that moisture content is influenced by factors such as genotype, field, and postharvest practices. Similar results were observed by Dias et al. [22], who found moisture contents of 13.95 and 14.06% in genotypes grown in Brazil, and Siregar [4], who demonstrated that the moisture content in rice grains grown in Indonesia ranged from 11.4 to 14.2%.
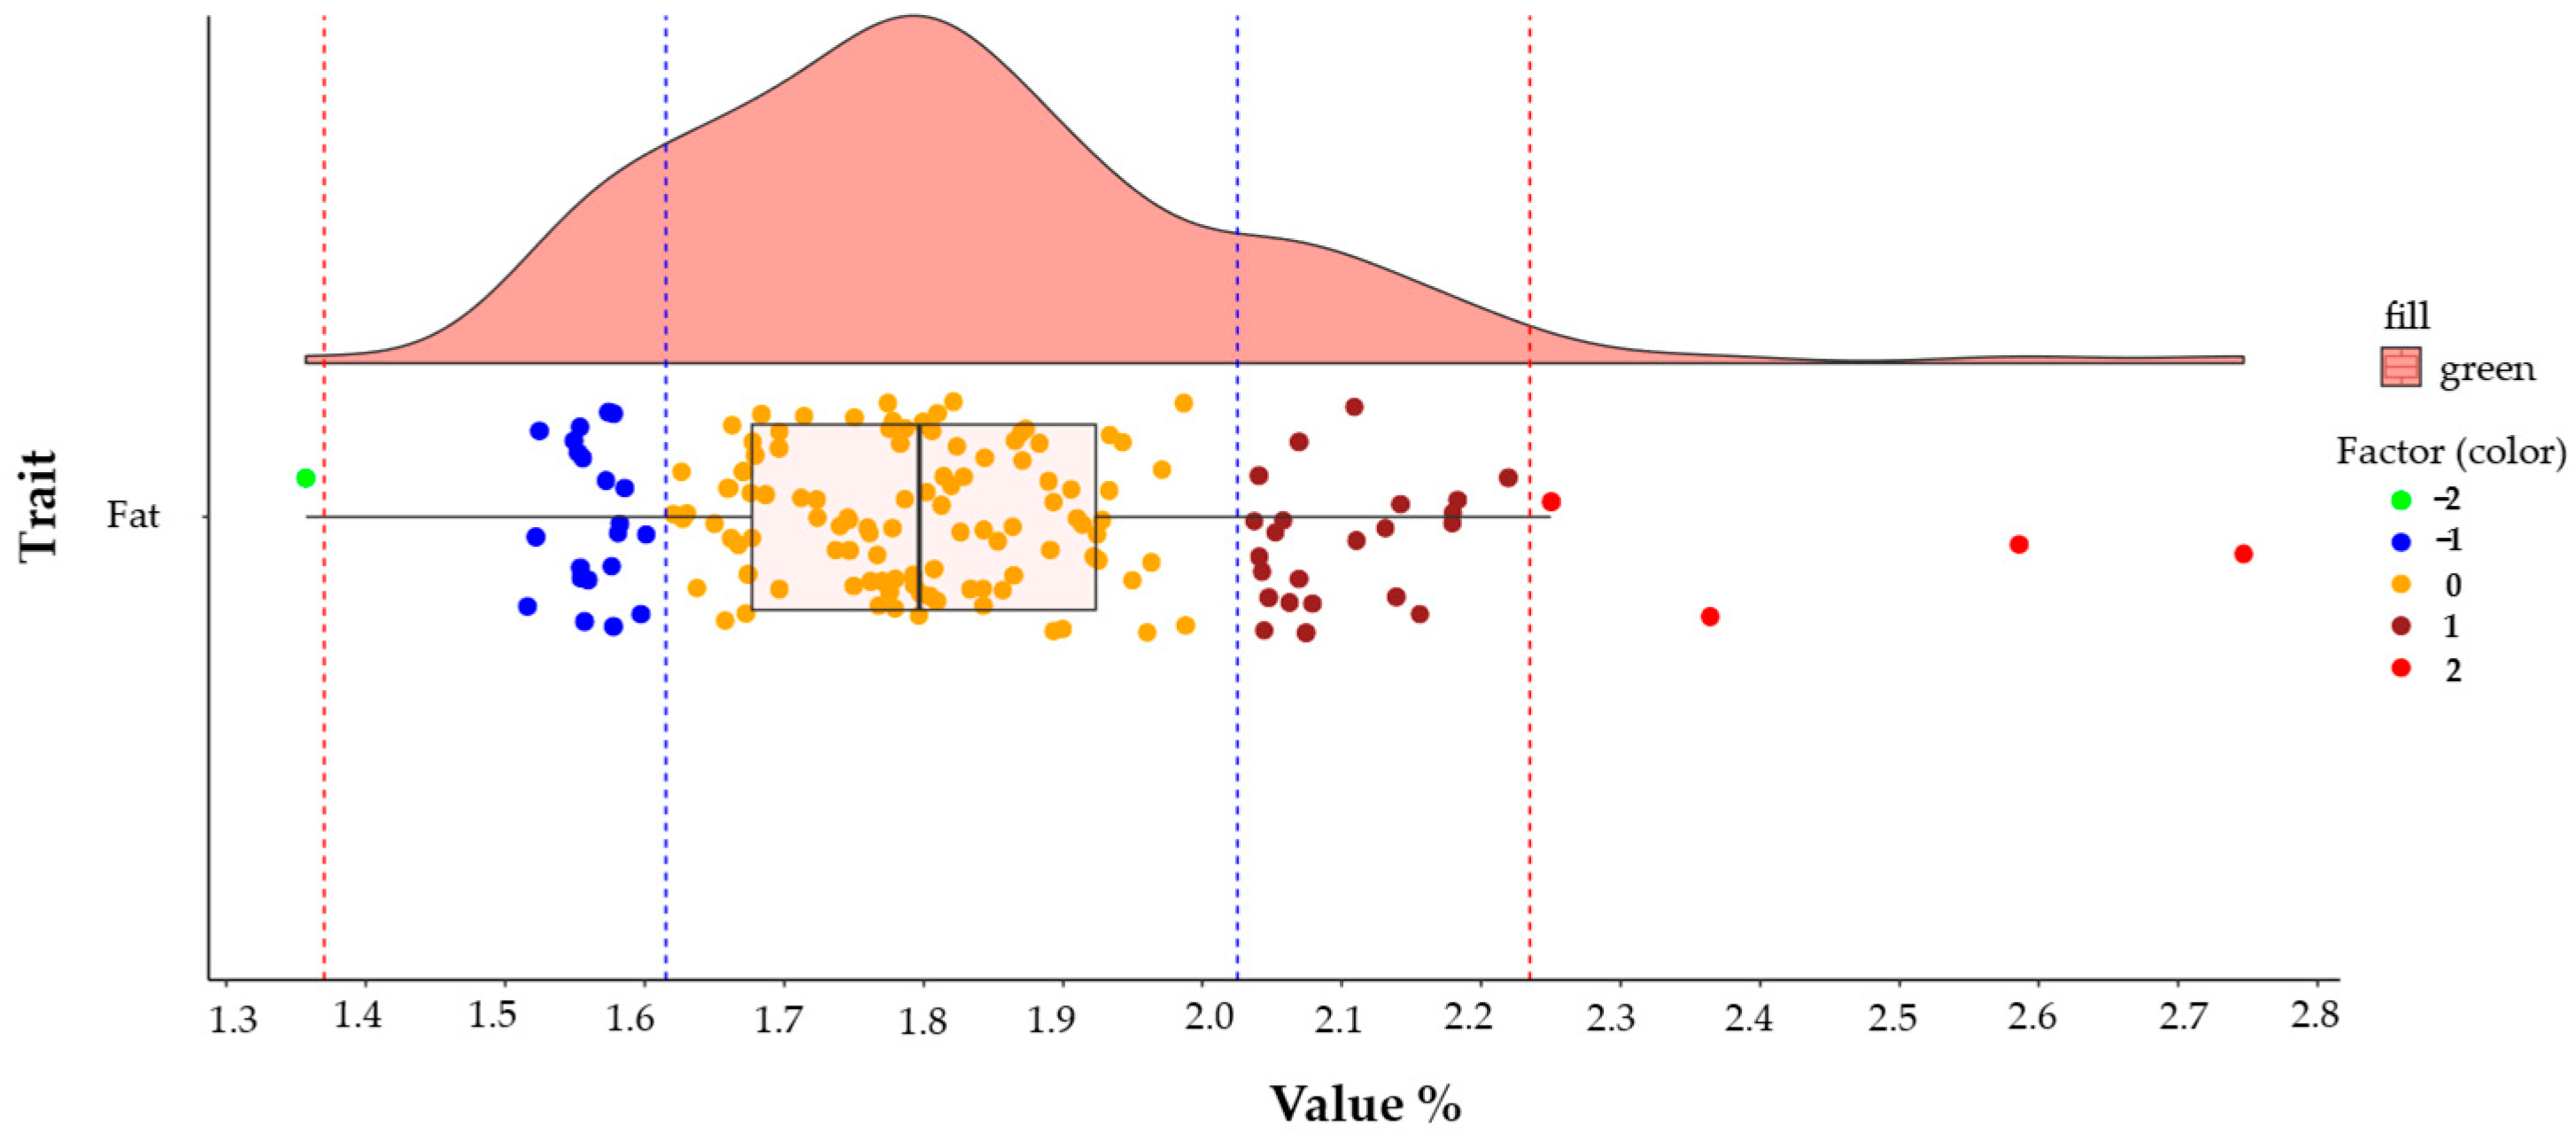
Rice lipids are a source of essential fatty acids, do not contain cholesterol, and generally range from 0.09 to 1.52% in milled rice [21,23]. In the studied collection, the average fat content was 1.82%, with values ranging from 1.35 to 2.74%. Twenty-two genotypes showed low-mean fat content: G42 (z-score < −2), G152, G143, G48, G28, G68, G86, G93, G97, G62, G85, G113, G174, G175, G31, G56, G70, G7, G157, G176, G163, and G88 (z-score < −1). High fat contents were observed in 27 genotypes, G136, G150, G8, G75 (z-score > 2), G89, G151, G52, G109, G117, G123, G82, G51, G118, G149, G46, G134, G127, G10, G63, G122, G61, G83, G1, G115, G137, G144, and G146 (z-score > 1). The remaining genotypes (106) showed fat contents close to the average (Figure 3). The fat content of the studied panel is higher than the values observed by Dias et al. [22], who found 0.84 and 0.92% for genotypes grown in Brazil, and by Verma and Srivastav [21], who detected the variation in lipid content from 0.06 to 0.92% in genotypes grown in India. However, values of 0.5 to 2.0% were observed in other genotypes grown in India [25], and 0.25 to 3.69% in genotypes grown in Indonesia [4], confirming the wide variation of this component in rice. This variation can be explained by the genotypes and growing conditions.
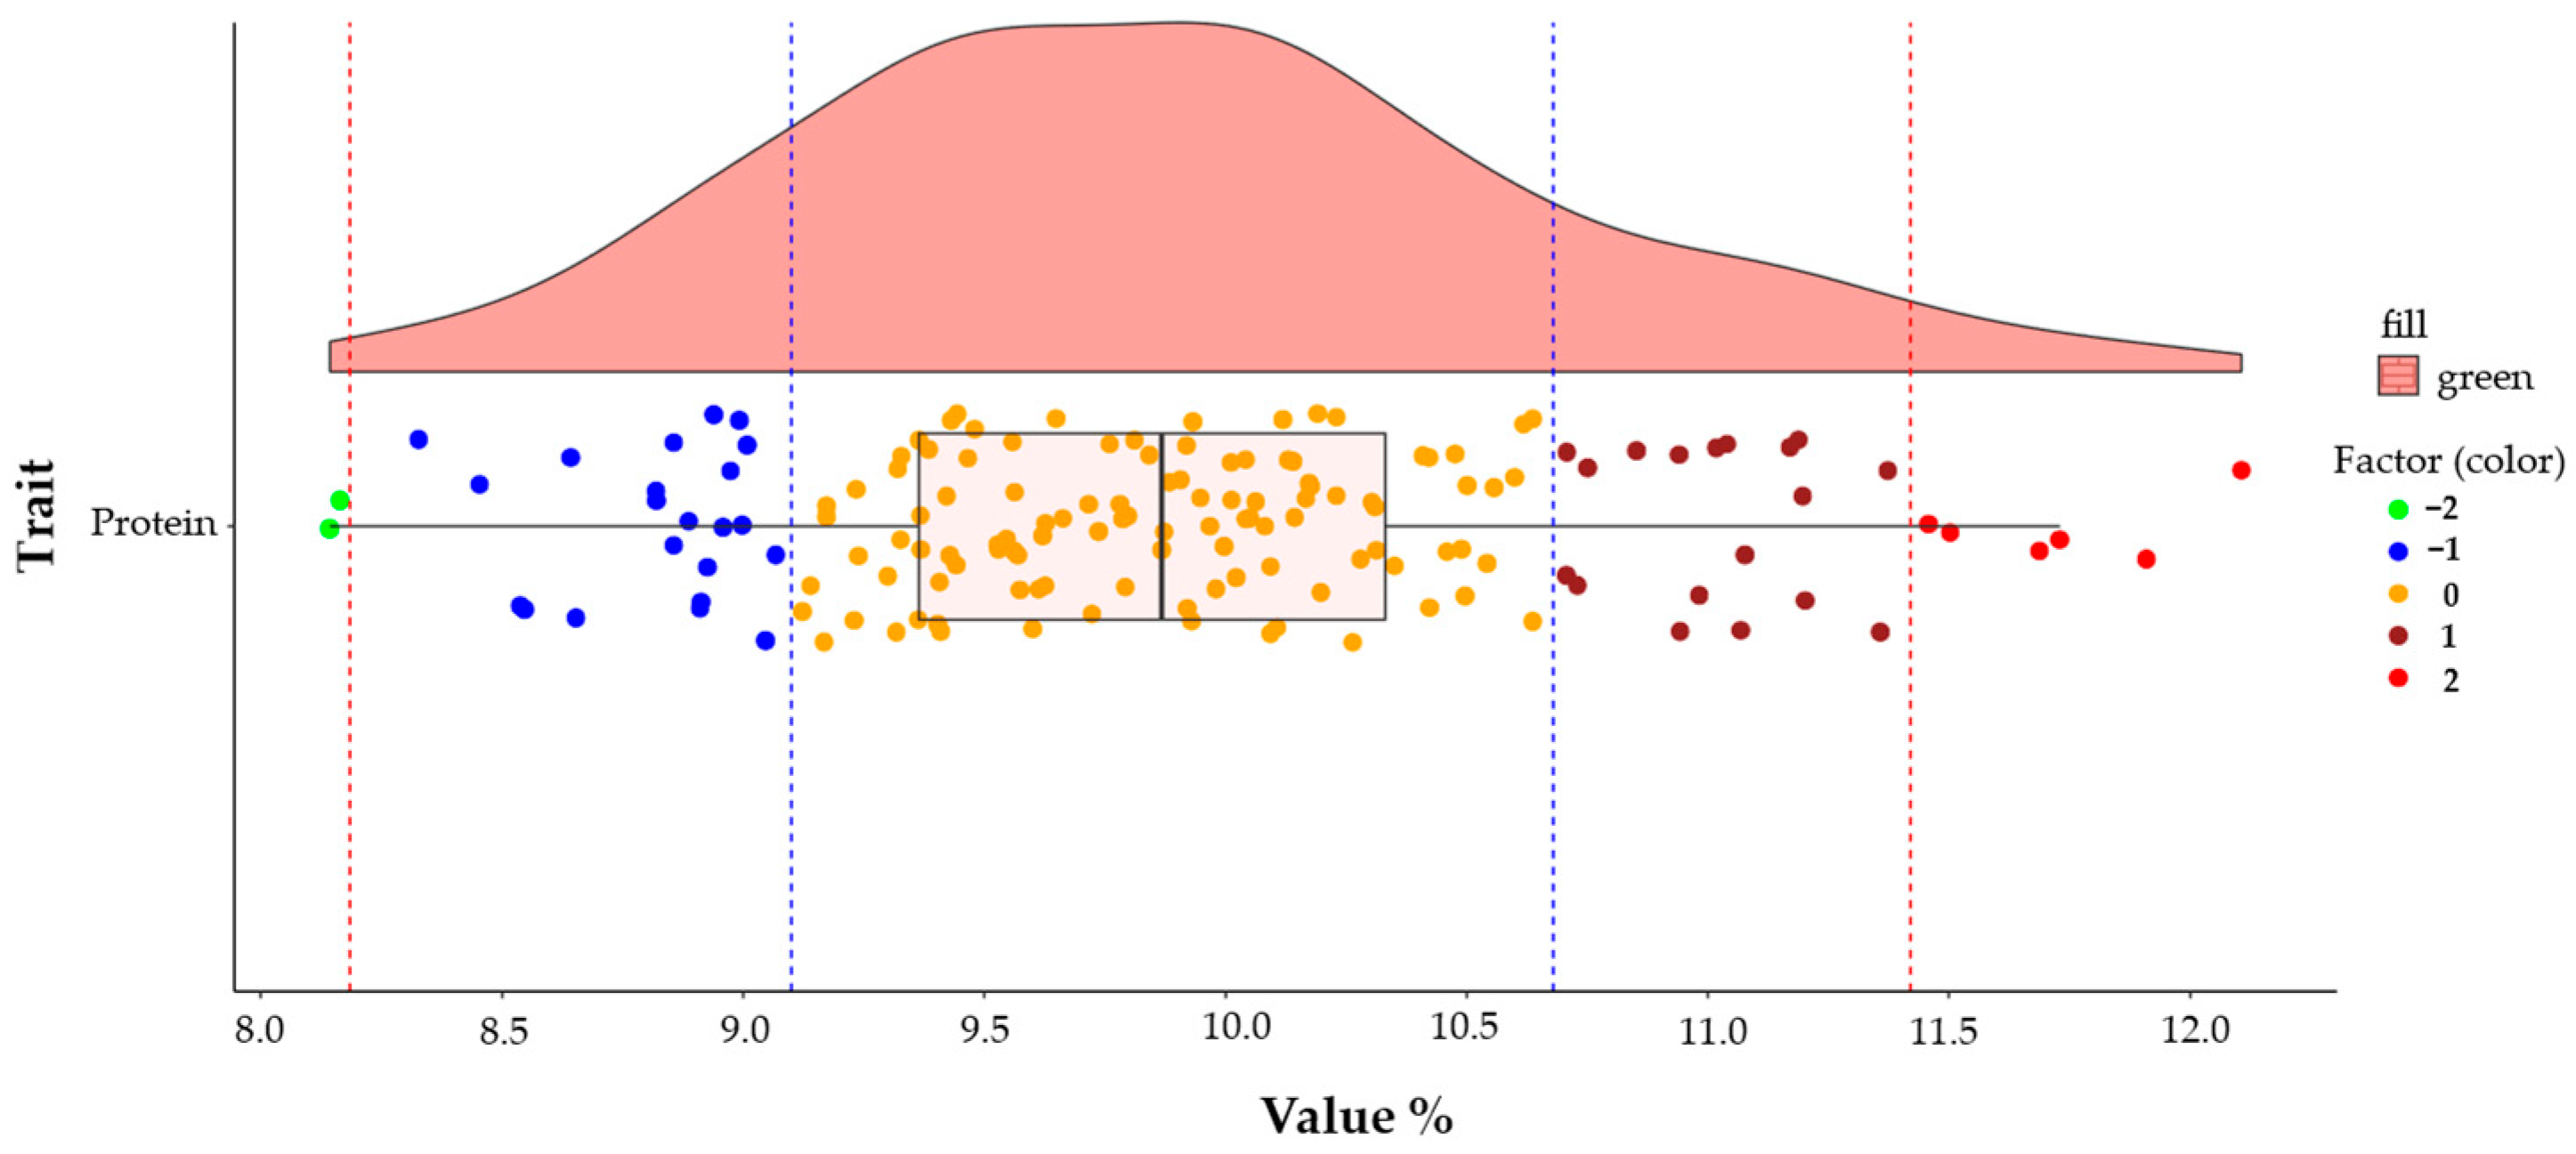
Protein content is related to the nutritional quality of rice. Approximately 8% of the grain consists of proteins, representing high nutritional value. The superiority of proteins found in rice is due to their amino acid composition, especially eight of the essential ones. Rice with higher protein content is crucial for providing nutrition to populations in vulnerable regions [21,23]. The genotypes studied showed grain protein content ranging from 8.1 to 12.1%, with an average of 9.88%. The lowest protein contents were identified in twenty-four genotypes—G98, G158, (z-score < −2), G143, G163, G20, G42, G140, G174, G115, G89, G31, G56, G155, G32, G71, G18, G128, G92, G58, G157, G77, G150, G154, and G27 (z-score < −1)—while the other 24 genotypes had the highest protein contents (G28, G136, G173, G146, G70, G66 (z-score > 2), G1, G5, G96, G6, G164, G83, G139, G102, G13, G8, G144, G126, G168, G88, G107, G142, G14, and G103 (z-score > 1)). The amount of protein in the grains of the remaining genotypes (107) is close to the average (Figure 4). In other reports describing genotypes grown in Brazil, lower values were observed, ranging from 5.53 to 6.36% [22] and 4.19 to 5.25% [6]. For genotypes grown in India, the protein content ranged from 6.87 to 9.51% [21], 7.33 to 9.93% [23], 5.8 to 6.9% [26], and 7.3 to 11.7% [25]. Protein content may be influenced by the genotype, by the action of genes related to the synthesis of grain storage proteins. Agricultural practices, such as water and nutrient availability and sowing time, as well as environmental factors, also influence protein contents in rice grain [23], explaining the variation observed for genotypes and different studies.
Ash contents represent the amount of minerals in the grain and can vary from 0.3 to 0.8% [21,23]. A high amount of ash was detected in grains from the studied collection, with contents ranging from 1.42 to 2.19%, and an average of 1.59%. Nineteen genotypes had the lowest ash contents (G31, G56, G98, G150, G143, G32, G155, G158, G42, G73, G20, G62, G76, G77, G100, G123, G140, G174, and G7 (z-score < −1)), while 23 had the highest values (G75 (z-score > 2), G107, G81, G139, G41, G133, G103, G173, G164, G37, G13, G136, G176, G28, G83, G66, G1, G70, G157, G14, G168, G146, and G8 (z-score > 1)). For 113 genotypes, the ash content was close to the average (Figure 5). These values are higher than reported for genotypes grown in Brazil, ranging from 0.40 to 0.44% [22] and in India, from 0.35 to 0.73% [21], 0.44 to 0.69% [23], and 0.7 to 1.3% [25]. However, a study conducted in India with landraces found different ash content values, ranging from 4.65 to 22.8% [26]. Mineral accumulation in rice depends on genotype, environmental conditions, and cultivation practices.
Dietary fiber has beneficial functions in the human body, including reducing cholesterol and blood sugar in diabetics and combating intestinal disorders. The fiber content in polished rice has been shown to range from 0.5% to 1.0% [21,23]. High fiber values were found in the analyzed genotypes, with a mean of 1.96% and a range between 1.69 and 2.71%. Fiber content was close to the average for 111 genotypes. The lowest values were observed in 21 genotypes (G84 (z-score < −2), G108, G152, G101, G48, G98, G106, G25, G73, G155, G91, G156, G34, G143, G174, G32, G172, G31, G56, G23, and G26 (z-score < −1)), and the highest values are distributed in 23 genotypes (G83, G75 (z-score > 2), G78, G1, G89, G22, G103, G4, G139, G14, G66, G118, G41, G176, G115, G137, G29, G119, G151, G19, G163, G37, and G157 (z-score > 1)) (Figure 6). Regarding the fiber component, values were also higher than those found in genotypes grown in India, which ranged from 0.48 to 0.85% [21], 0.35 to 0.74 [23], 1.5 to 1.8% [26], and 0.9 to 1.9% [25]. However, in parboiled rice grown in Brazil, fiber values were demonstrated to range between 2.68 and 3.45 [6]. Furthermore, a study carried out in China demonstrated that fiber contents vary from 0.74 to 2.14, depending on the degree of polishing [27].
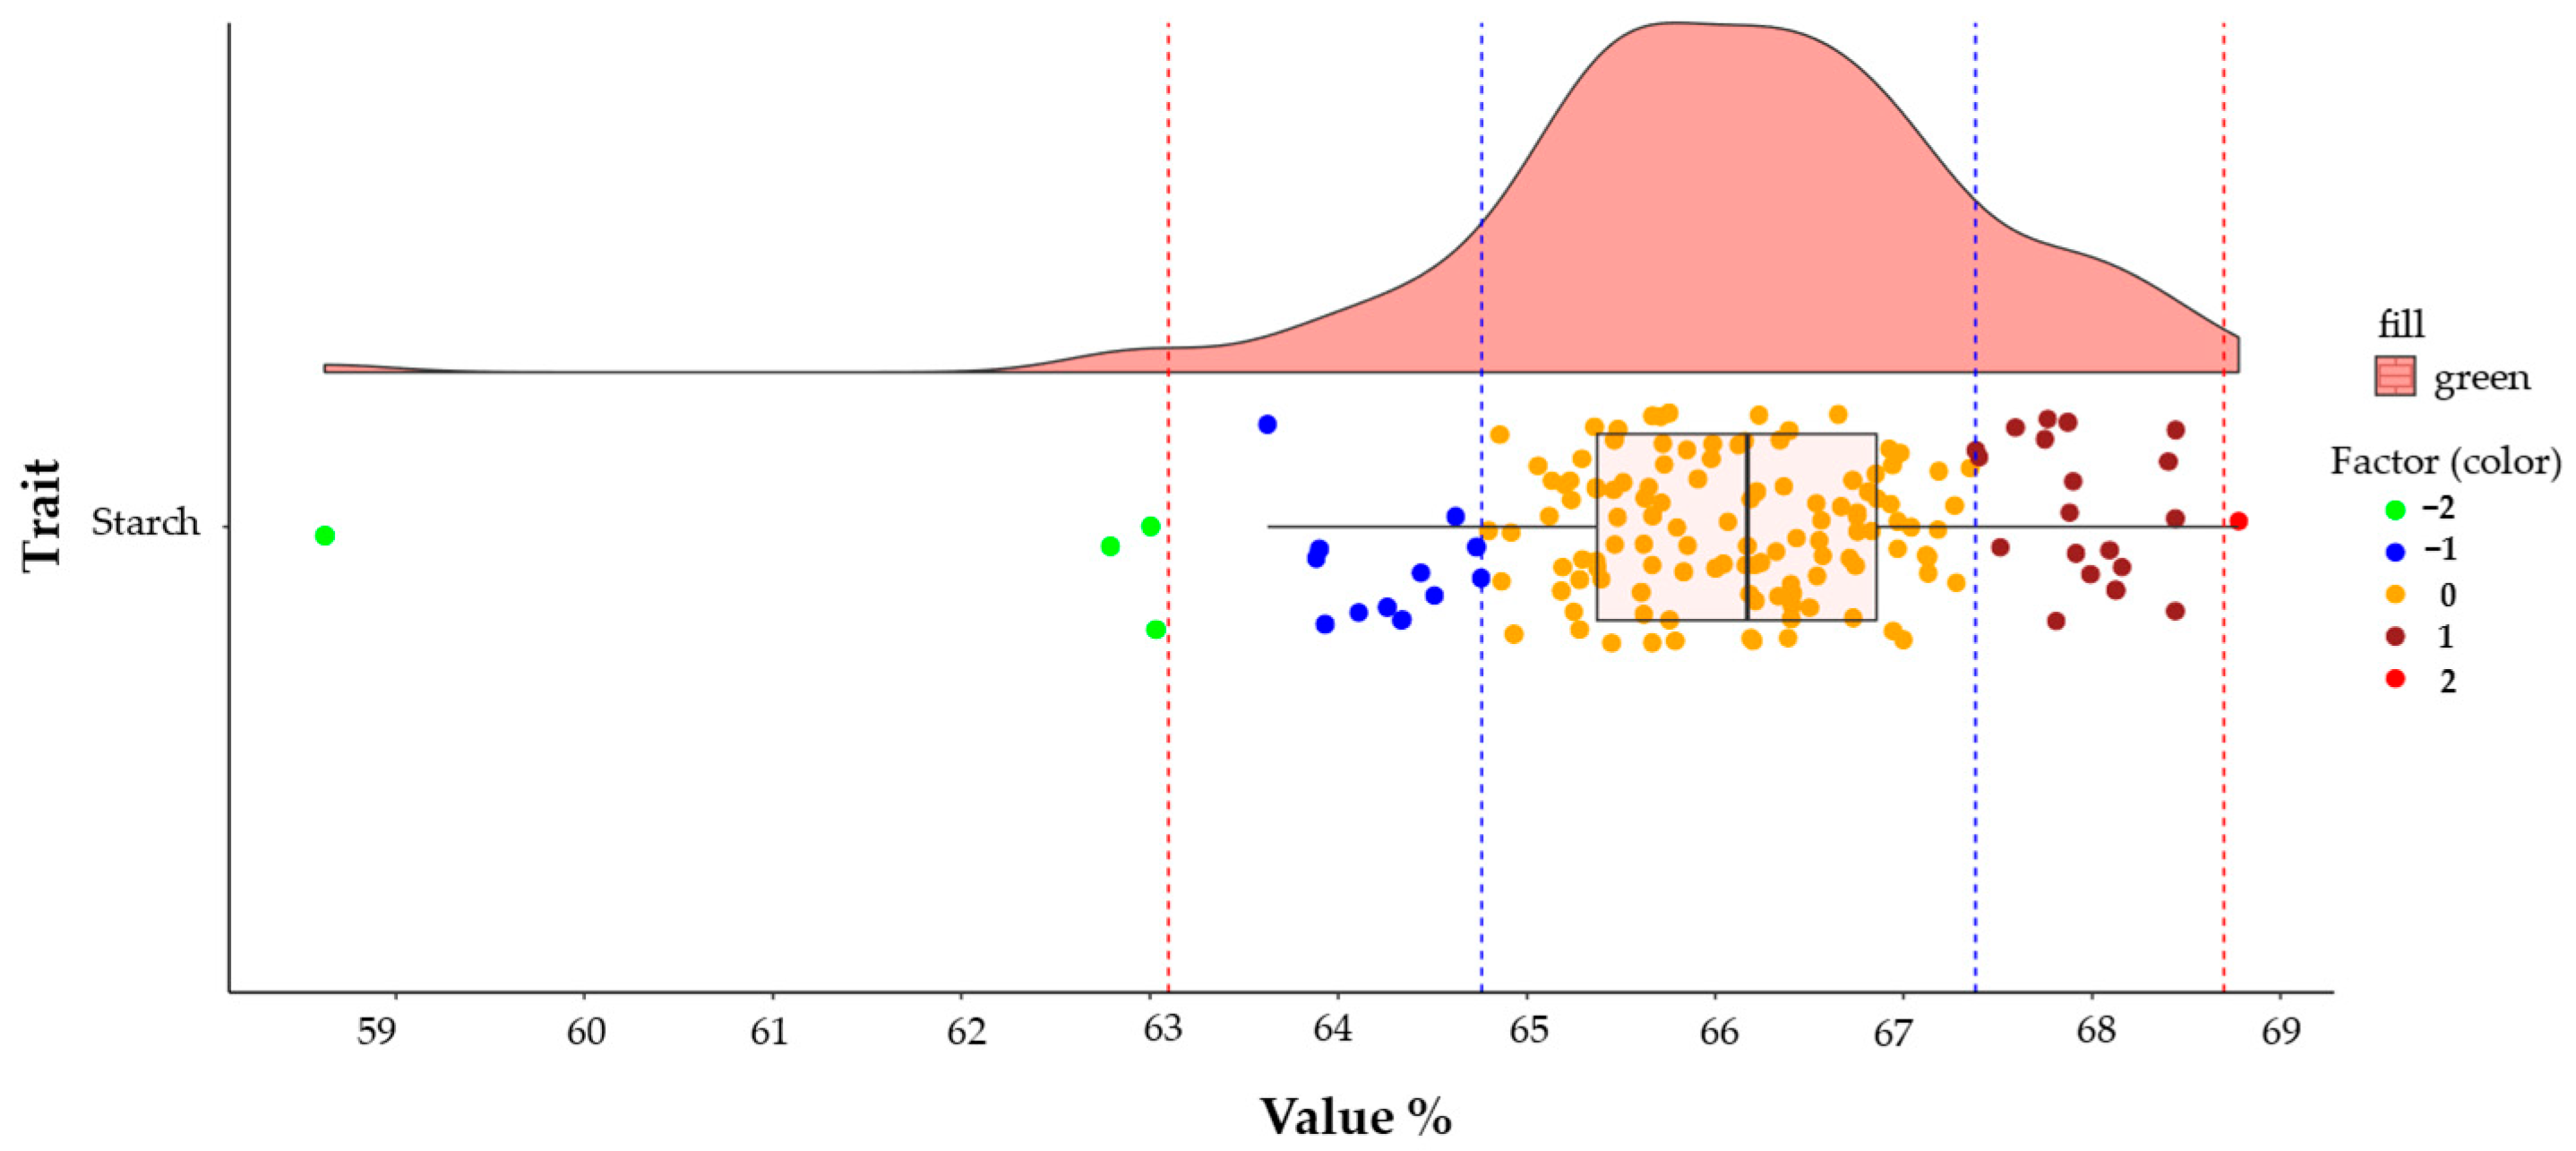
Starch, consisting of amylose and amylopectin, is the main carbohydrate in rice grains. To meet the caloric demand as a staple food, rice must have 80% carbohydrates. Starch contents also influence post-cooking quality, so that grains with higher starch levels tend to stick together [6,21,23]. The average starch content in the grains of the collection was 66%, with values ranging from 58.62 to 68.77%. Values below the mean were identified in 17 genotypes, G75, G8, G146, G136 (z-score < −2), G14, G19, G173, G83, G70, G66, G103, G107, G116, G28, G96, G134, and G139 (z-score < −1), while 21 genotypes showed values above the mean, G158 (z-score > 2), G128, G18, G76, G99, G157, G98, G27, G100, G132, G32, G7, G143, G65, G174, G58, G85, G47, G31, G56, and G163 (z-score > 1). Starch contents close to the average were observed in 117 genotypes (Figure 7). These values are similar to those found by Bilhalva et al. [6], who evaluated parboiled rice grown in Brazil and found starch contents ranging from 66.7 to 70.1%. However, higher values were found in genotypes grown in Indonesia, with 71.6 to 80.4% [4], and in India, with 75.8 to 82.7% [21], 75.3 to 82.6% [26], and 74.6 to 79.8% [25].
Similar values for all components were observed in different studies, demonstrating the reliability of NIRs detection. However, differences were also detected, which may be attributed to the effects of genotype, environment, and cultivation practices. The higher values for ash, fiber, and lipids compared to other studies may be due to genetic background, soil mineral content, and polishing degree. The variations observed among the genotypes studied for each component of the proximate composition are primarily due to genotype, since cultivation conditions, management, and postharvest practices were the same for all plants. Therefore, it is possible to select genotypes with higher and lower levels of each component based on the NIRs results.
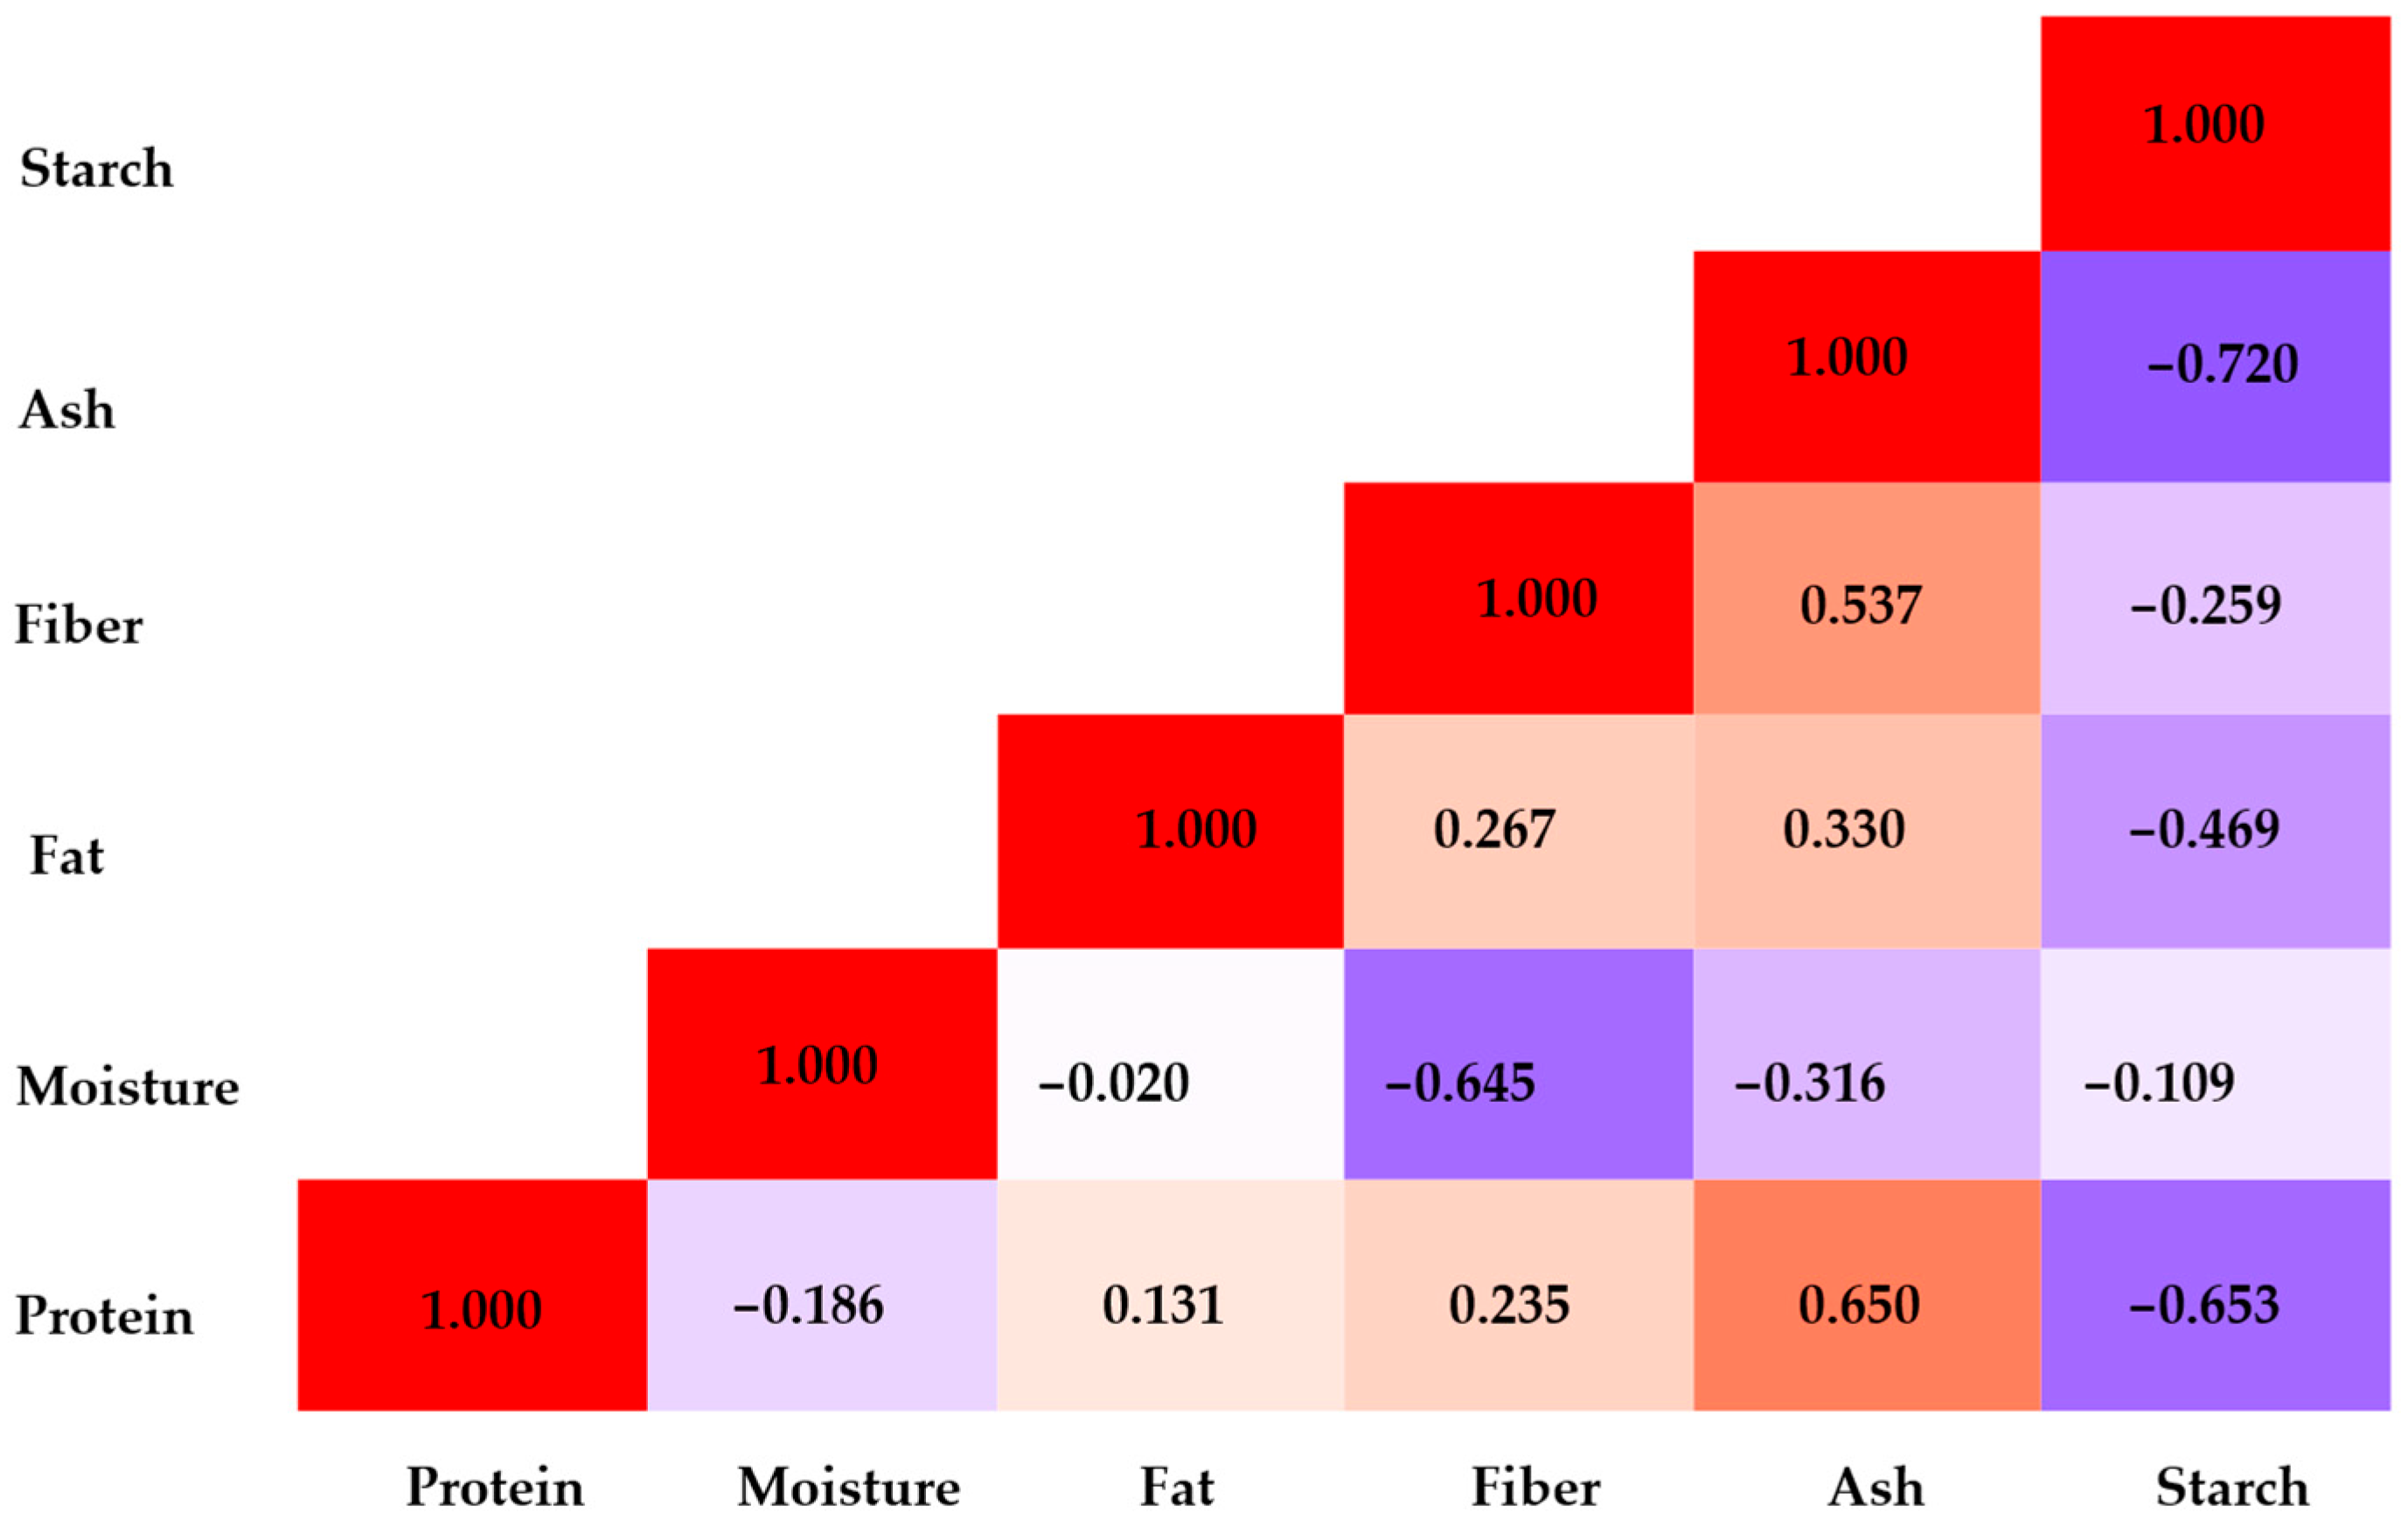
Strong positive correlations were observed between ash and protein (0.650) and ash and fiber (0.537), whereas strong negative correlations were found between starch and ash (−0.720), starch and protein (−0.653), and fiber and moisture (−0.645). A moderate negative correlation was observed between starch and fat (−0.469) and ash and moisture (−0.316), whereas a moderate positive correlation was observed between ash and fat (0.330) (Figure 8). A strong positive correlation between ash and protein (0.96) and ash and fiber (0.95) was also reported in previous studies [25]. Similarly, strong negative correlation values between starch and protein (−0.782; −0.64; −0.99 and −0.705) were also observed [6,21,23,25]. Furthermore, a strong negative correlation between starch and ash was previously verified, with values of −0.97 [25] and −0.925 [6]. Although some correlation patterns between the components of the proximate composition of rice grains were constant across different studies, quite distinct profiles were also identified. The effects of the genotype and environment on the components may explain these discrepancies.
A portion of the carbon assimilated during photosynthesis can be used for starch and sugar biosynthesis, and a substantial fraction is directed to the synthesis of fatty acids, which are then incorporated in the synthesis of membrane lipids and accumulate as triacylglycerol [28,29]. Another fraction of photosynthetic carbon can be used in the synthesis of amino acids [30,31], the raw material for protein synthesis. Studies show that silencing genes involved in starch synthesis leads to a reduction in the contents of the polymer and an increase in lipids and free amino acids [32], suggesting a compensation mechanism between these molecules. These observations could explain the negative correlation between starch and proteins and starch and fat. Another hypothesis is the location of these macronutrients within the grain. While starch accumulates in the innermost layers and is preserved during polishing, fat and proteins accumulate in the outermost layers, being depleted during the polishing process [33]. These negative correlations observed in the local genetic background hinder conventional breeding. Further studies are needed to elucidate the genetic basis controlling these traits, which are complex; strongly influenced by the environment; and can be controlled by additive, epistatic effects, and linked genes. Strategies such as germplasm introduction, mutation induction, and biotechnology tools can be considered to deal with this pattern.
Similarly, minerals also accumulate in the outermost layers [33], explaining the observed negative correlation between ash and starch. In addition to minerals, fat, and proteins, fiber also accumulates in the outermost layers of the rice grain and is removed by polishing [33]. This pattern may explain the positive correlations between ash and fiber, ash and protein, and ash and fat observed in the present study.
Principal components 1 and 2 (PC1 and PC2) represent the highest eigenvalues and explain 75.12% of the total variation (Table 1, Figure 9), enabling genotype dispersion based on proximate composition. The eigenvector values associated with PC1 indicate that components ash, starch, protein, fiber and fat were most important contributors to separate the genotypes (Table 1, Figure 9). Correlation analysis also revealed a negative correlation between starch and ash, protein, fiber and fat (Figure 8). In PC2, the variables with the highest eigenvector values were moisture and fiber (Table 1, Figure 9). Similarly, the correlation analysis detected a negative correlation between moisture and fiber (Figure 8).
The genotypes in the upper left quadrant (Q1) have higher grain moisture, while those in the lower left quadrant (Q2) have higher grain starch content. The lower right quadrant (Q3) contains genotypes with higher grain fiber contents, and the upper right quadrant (Q4) contains genotypes with higher amounts of protein, ash, and fat (Figure 9, Table 2). These results, combined with z-score analyses, enabled the identification of genotypes with higher and lower levels of each component of the proximate composition, as well as grouping similar genotypes.
In a study carried out by Siregar et al. [4], in which proximate composition was estimated by Attenuated Total Reflectance–Fourier Transform Infrared (ATR-FTIR) spectroscopy, data analyses using PCA enabled separation of the genotypes but highlighted the complexity of sample distribution. Additionally, Oh et al. [34], who analyzed rice grain proximate composition using classical methods, did not detect a clear distinction between genotypes and concluded that climatic conditions exerted a stronger influence on proximate composition than the genotype. These results are similar to the present study, where genotypes also presented a complex distribution. This pattern may be due to negative correlations among proximate composition components and environmental effects.
Overall, the quantity of the components of rice grain proximate composition, as well as the correlation between them, was similar to previous studies. These observations demonstrate that NIRs can be used reliably to determine the proximate composition of rice grain. Among the statistical approaches used, univariate and multivariate analyses were effective in explaining the results, enabling the identification of genotypes with higher and lower levels of the different constituents, highlighting clusters of similar and divergent genotypes. Therefore, NIRs was shown to be effective in selecting genotypes for crossing panels and in recommending cultivars based on the demands of the local population. Furthermore, the tool can be used in progeny selection during the breeding process. However, further studies using the same genotypes in different seasons and locations are needed. Although the equipment used undergoes continuous calibration, which ensures the accuracy of the results, some genotypes can be analyzed using conventional methods to compare the results obtained with NIRs.

4. Conclusions

Considering the germplasm used and local conditions, NIRs-based analysis is efficient in determining the proximate composition of rice, exhibiting comparable performance to other techniques used in previous studies. The integration of univariate and multivariate analyses improved data visualization, enabling the identification of genotype clusters according to proximate composition. NIRs is a rapid and cost-effective strategy to aid the selection of more nutritious rice genotypes to be used in genetic breeding programs or cultivar recommendations. However, due to the negative correlation between some components of the proximate composition, such as starch and protein, observed in the current background, the selection of genotypes with high levels of both macronutrients remains inconclusive.

Supplementary Materials

The following supporting information can be downloaded at: https://www.mdpi.com/article/10.3390/agriengineering7090305/s1. Table S1. List of genotypes used in the study.

Author Contributions

Conceptualization, A.A.M. and C.P.; methodology, A.A.M., G.B.d.C., L.A.R., A.d.B.L. and M.C.d.S.; formal analysis, A.A.M., G.B.d.C., L.A.R., A.d.B.L., M.C.d.S. and L.C.d.M.; investigation, A.A.M.; data curation, L.C.d.M.; writing—original draft preparation, A.A.M. and C.P.; writing—review and editing, L.C.d.M., A.C.d.O. and C.P.; supervision, M.d.O. and C.P.; project administration, C.P.; funding acquisition, M.d.O., A.C.d.O. and C.P. All authors have read and agreed to the published version of the manuscript.

Funding

This research was funded by Conselho Nacional de Desenvolvimento Científico e Tecnológico (CNPq) grant N. 306493/2023-3, Coordenação de Aperfeiçoamento de Pessoal de Nível Superior (CAPES) grant No. 001, and Fundação de Amparo à Pesquisa do Estado do Rio Grande do Sul (FAPERGS).

Data Availability Statement

The datasets used and/or analyzed during the current study are available from the corresponding author upon reasonable request.

Acknowledgments

To Embrapa Clima Temperado, Estação Experimental de Terras Baixas for support in carrying out the experiments. Furthermore, we also thank Instituto de Investigação Agrária de Moçambique/IIAM for the license granted to the first author for academic training and execution of the experiment. Finally, we would like to thank Vera Quecini for the English language review.

Conflicts of Interest

The authors declare no conflicts of interest.

References

  1. Wang, L.; Zhang, T.; Zhou, X.; Xu, T.; Li, C.; Li, Z.; Wang, S.; Li, M.; Hong, J. Insights into the Environmental–Economic Sustainability of Rice Production in China. J. Clean. Prod. 2025, 498, 145205. [Google Scholar] [CrossRef]
  2. Xavier, A.I.S.; Arbage, A.P.; da Silva, M.R.; Ribas, G.G.; Meus, L.D.; dos Santos, G.A.d.A.; Streck, N.A.; Zanon, A.J. Economic and Productive Analysis of Irrigated Rice Crops Using a Multicase Study. Pesq. Agropec. Bras. 2021, 56, e02037. [Google Scholar] [CrossRef]
  3. Costa, J.C.; de Jesus, A.C.d.S.; de Jesus, J.G.L.; Madruga, M.F.; Souza, T.N.; Louzada, M.L.d.C. Diferenças no Consumo Alimentar Dda População Brasileira por Raça/Cor da Pele em 2017–2018. Rev. Saúde Pública 2023, 57, 4. [Google Scholar] [CrossRef] [PubMed]
  4. Siregar, S.; Nurhikmat, A.; Amdani, R.Z.; Hatmi, R.U.; Kobarsih, M.; Kusumaningrum, A.; Karim, M.A.; Dameswari, A.H.; Siswanto, N.; Siswoprayogi, S.; et al. Estimation of Proximate Composition in Rice Using ATR-FTIR Spectroscopy and Chemometrics. ACS Omega 2024, 9, 32760–32768. [Google Scholar] [CrossRef]
  5. Leal, M.M.; Bilhalva, N.d.S.; de Moraes, R.S.; Coradi, P.C. Physical Classification of Soybean Grains Based on Physicochemical Characterization Using Near-Infrared Spectroscopy. AgriEngineering 2025, 7, 194. [Google Scholar] [CrossRef]
  6. Bilhalva, N.d.S.; Coradi, P.C.; de Oliveira, D.P.; Nunes, M.T.; Lombardi, B.P.; Beskow, A. Evaluation of the Quality and Classification of Parboiled Rice Using Near-Infrared Spectroscopy and Multivariate Statistical Analyses. Eng. Agrícola 2025, 45, e202470211. [Google Scholar] [CrossRef]
  7. Shi, S.; Zhang, W.; Ma, Y.; Cao, C.; Zhang, G.; Jiang, Y. Near-Infrared Spectroscopy Combined with Effective Variable Selection Algorithm for Rapid Detection of Rice Taste Quality. Biosyst. Eng. 2024, 237, 214–219. [Google Scholar] [CrossRef]
  8. Debra Sandilands. Univariate Analysis. In Encyclopedia of Quality of Life and Well-Being Research; Springer International Publishing: Cham, Switzerland, 2023; pp. 7391–7394. [Google Scholar]
  9. de Barros, H.E.A.; Alexandre, A.C.S.; Campolina, G.A.; Alvarenga, G.F.; Silva, L.M.d.S.F.e.; Natarelli, C.V.L.; Carvalho, E.E.N.; Vilas Boas, E.V.d.B. Edible Seeds Clustering Based on Phenolics and Antioxidant Activity Using Multivariate Analysis. LWT 2021, 152, 112372. [Google Scholar] [CrossRef]
  10. Moura, F.S.H.; de Souza Dias, F.; Beatriz Souza e Souza, L.; de Magalhães, B.E.A.; de Aragão Tannus, C.; Correia de Carvalho, W.; Cardoso Brandão, G.; dos Santos, W.N.L.; Graças Andrade Korn, M.; Cristina Muniz Batista dos Santos, D.; et al. Evaluation of Multielement/Proximate Composition and Bioactive Phenolics Contents of Unconventional Edible Plants from Brazil Using Multivariate Analysis Techniques. Food Chem. 2021, 363, 129995. [Google Scholar] [CrossRef] [PubMed]
  11. Santos, H.G.; Jacomine, P.K.T.; Anjos, L.H.C.; Oliveira, V.A.; Lumbreras, J.F.; Coelho, M.R.; Almeida, J.A.; Araújo Filho, J.C.; Oliveira, J.B.; Cunha, T.J.F. Sistema Brasileiro de Classificação de Solos; Embrapa Solos: Brasília, Brazil, 2018. [Google Scholar]
  12. Wrege, M.S.; Steinmetz, S.; Júnior, C.R.; Almeida, I.R. Atlas Climático da Região Sul do Brasil; Embrapa: Brasília, Brazil, 2012. [Google Scholar]
  13. Sosbai—Sociedade Sul-Brasileira de Arroz Irrigado. Arroz irrigado: Recomendações técnicas da pesquisa para o Sul do Brasil. In Proceedings of the XXXIII Reunião Técnica Da Cultura Do Arroz Irrigado, Restinga Seca, Brazil, 25–26 July 2022. [Google Scholar]
  14. Zaccaria. AZ-1- DTA- Testing Rice Mill. Available online: https://www.zaccaria.com.br/en-US/produtos/equipamentos-para-arroz/laboratorio-de-arroz-h97ha/paz-1dta-provador-para-arroz-amxsw (accessed on 1 April 2025).
  15. Perten. Perten Instruments Laboratory Mill: 3100. Available online: https://contact.perkinelmer.com/perten-food-quality-testing (accessed on 1 April 2025).
  16. Foss Analytics. NIRS TM DS2500 L. The Reliable and Versatile Lab NIR. Available online: https://www.fossanalytics.com/pt-br/products/nirs-ds2500-l (accessed on 1 April 2025).
  17. Salinas Ruíz, J.; Montesinos López, O.A.; Hernández Ramírez, G.; Crossa Hiriart, J. Generalized Linear Mixed Models with Applications in Agriculture and Biology; Springer International Publishing: Cham, Switzerland, 2023; ISBN 978-3-031-32799-5. [Google Scholar]
  18. Rennberger, G.; Turechek, W.W.; Keinath, A.P. Dynamics of the Ascospore Dispersal of Stagonosporopsis Citrulli, a Causal Agent of Gummy Stem Blight of Cucurbits. Plant Pathol. 2021, 70, 1908–1919. [Google Scholar] [CrossRef]
  19. R Core Team-R. R Core Team-R: A Language and Environment for Statistical Computing. Vienna, Austria. Available online: https://www.R-project.org/ (accessed on 1 July 2025).
  20. SAS. SAS OnDemand for Academics. Available online: https://www.sas.com/pt_br/software/on-demand-for-academics.html (accessed on 1 July 2025).
  21. Verma, D.K.; Srivastav, P.P. Proximate Composition, Mineral Content and Fatty Acids Analyses of Aromatic and Non-Aromatic Indian Rice. Rice Sci. 2017, 24, 21–31. [Google Scholar] [CrossRef]
  22. Dias, L.G.; Hacke, A.; dos Santos Souza, E.; Nath, S.; Canesin, M.R.; Vilella, O.V.; Geloneze, B.; Pallone, J.A.L.; Cazarin, C.B.B.; Blakeslee, J.J.; et al. Comparison of Chemical and Nutritional Compositions between Aromatic and Non-Aromatic Rice from Brazil and Effect of Planting Time on Bioactive Compounds. J. Food Compos. Anal. 2022, 111, 104608. [Google Scholar] [CrossRef]
  23. Nath, S.; Bhattacharjee, P.; Bhattacharjee, S.; Datta, J.; Dolai, A.K. Grain Characteristics, Proximate Composition, Phytochemical Capacity, and Mineral Content of Selected Aromatic and Non-Aromatic Rice Accessions Commonly Cultivated in the North-East Indian Plain Belt. Appl. Food Res. 2022, 2, 100067. [Google Scholar] [CrossRef]
  24. Brasil. Ministério Da Agricultura, Pecuária e Abastecimento. Instrução Normativa No 6, de 16 de Fevereiro de 2009. Available online: https://sistemasweb.agricultura.gov.br/sislegis/action/detalhaAto.do?method=visualizarAtoPortalMapa&chave=1687046295 (accessed on 1 August 2025).
  25. M, F.; John, D.; Raman, M. Physicochemical Properties, Eating and Cooking Quality and Genetic Variability: A Comparative Analysis in Selected Rice Varieties of South India. Food Prod. Process. Nutr. 2023, 5, 49. [Google Scholar] [CrossRef]
  26. Panda, K.K.; Bisht, S.S.; Mishra, R.; Sahu, P.K.; Panda, A.K.; Subedi, R. Nutritional Analysis of Rice Landraces from Southern Odisha, India. Food Sci. Nutr. 2024, 12, 227–238. [Google Scholar] [CrossRef]
  27. Jiang, P.; Li, R.; Tian, X.; Liu, Y.; Zhang, D.; Ren, F.; Liu, M.; Tan, B. Effect of milling on proximate composition, γ-oryzanol, vitamin B1, polyphenolic, and bioaccessibility of phenolic of brown rice. J. Food Process. Preserv. 2022, 46, e17215. [Google Scholar] [CrossRef]
  28. Yu, L.; Fan, J.; Yan, C.; Xu, C. Starch Deficiency Enhances Lipid Biosynthesis and Turnover in Leaves. Plant Physiol. 2018, 178, 118–129. [Google Scholar] [CrossRef]
  29. Chang, L.; Liu, Z.; Ying, X.; Kalandarov, B.; Ergashev, M.; Tong, X.; Zhang, J.; Jin, J.; Ying, J. Molecular Basis of Lipid Metabolism in Oryza sativa L. Plants 2024, 13, 3263. [Google Scholar] [CrossRef]
  30. Wang, B.; Guo, T.; Wang, H.; Li, J.; Sun, Z.; Liu, Y.; Xing, Y.; Xu, B.; Yang, B.; Li, J.; et al. Characterization and Expression Profile Analysis of the 3-phosphoglycerate Dehydrogenase Family in Rice. Agron. J. 2021, 113, 1039–1049. [Google Scholar] [CrossRef]
  31. Ouyang, N.; Hu, W.; Meng, J.; Wang, B. Amino Acid Derivatives as Regulatory Molecules: Mechanisms in Plant Growth and Stress Tolerance. Crop J. 2025, 13, 668–680. [Google Scholar] [CrossRef]
  32. Ying, Y.; Deng, B.; Zhang, L.; Hu, Y.; Liu, L.; Bao, J.; Xu, F. Multi-Omics Analyses Reveal Mechanism for High Resistant Starch Formation in an Indica Rice SSIIIa Mutant. Carbohydr. Polym. 2025, 347, 122708. [Google Scholar] [CrossRef] [PubMed]
  33. Liu, J.; Wu, Y.; Chen, H.; An, H.; Liu, Y.; Xu, J. Effect of the Degree of Milling on the Microstructure and Composition of Japonica Rice. Grain Oil Sci. Technol. 2022, 5, 194–203. [Google Scholar] [CrossRef]
  34. Oh, S.; Lee, S.; Park, S.; Lee, S.; Lee, S.; Cho, H.; Chung, Y.; Park, S. Statistical Study on the Environmental Effects on the Natural Variation of Nutritional Components in Rice Varieties. Food Sci. Nutr. 2019, 7, 163–172. [Google Scholar] [CrossRef] [PubMed]
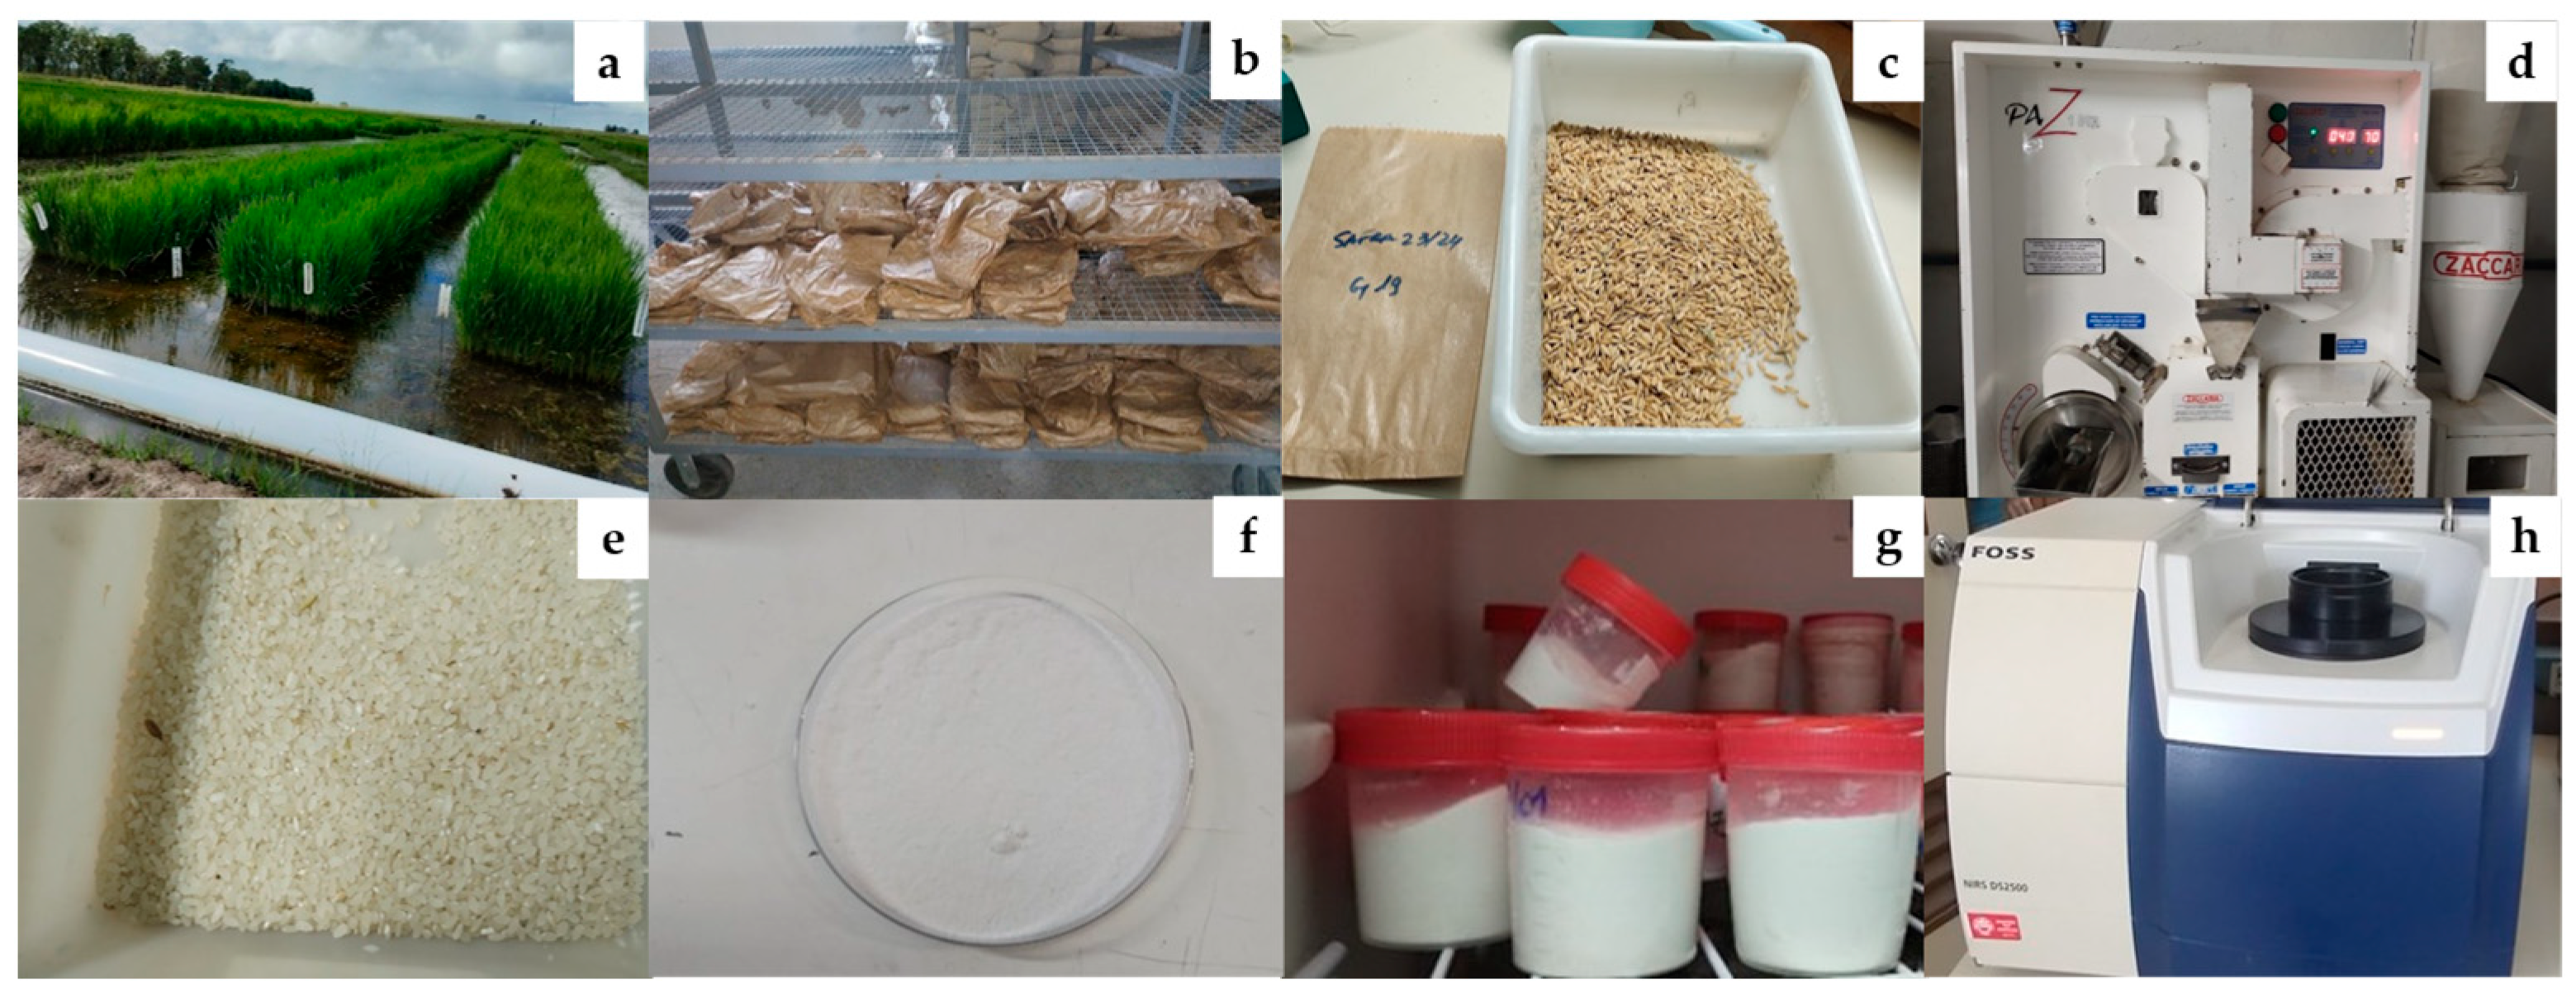
Figure 1. Rice sampling and proximate grain composition analysis using NIRs. (a) Rice cultivation; (b) drying of panicles after harvest; (c) manual grain threshing; (d) mill used for husking and polishing; (e) polished grains; (f) rice flour; (g) stored flour samples; (h) NIRs.
Agriengineering 07 00305 g001
Figure 2. Distribution of genotypes in a rice panel according to grain moisture content. Genotypes are divided into groups based on z-score values. Blue lines indicate values with z-scores below and above −1 and +1, respectively. Red lines indicate values with z-scores below −2.
Agriengineering 07 00305 g002
Figure 3. Distribution of genotypes in a rice panel according to grain fat content. Genotypes are divided into groups based on z-score values. Blue lines indicate values with z-scores below and above −1 and +1, respectively. Red lines indicate values with z-scores below and above −2 and +2, respectively.
Agriengineering 07 00305 g003
Figure 4. Distribution of genotypes in a rice panel according to grain protein content. Genotypes are divided into groups based on z-score values. Blue lines indicate values with z-scores below and above −1 and +1, respectively. Red lines indicate values with z-scores below and above −2 and +2, respectively.
Agriengineering 07 00305 g004
Figure 5. Distribution of genotypes in a rice panel according to grain ash content. Genotypes are divided into groups based on z-score values. Blue lines indicate values with z-scores below and above −1 and +1, respectively. Red lines indicate values with z-scores above +2.
Agriengineering 07 00305 g005
Figure 6. Distribution of genotypes in a rice panel according to grain fiber content. Genotypes are divided into groups based on z-score values. Blue lines indicate values with z-scores below and above −1 and +1, respectively. Red lines indicate values with z-scores below and above −2 and +2, respectively.
Agriengineering 07 00305 g006
Figure 7. Distribution of genotypes in a rice panel according to grain starch content. Genotypes are divided into groups based on z-score values. Blue lines indicate values with z-scores below and above −1 and +1, respectively. Red lines indicate values with z-scores below and above −2 and +2, respectively.
Agriengineering 07 00305 g007
Figure 8. Pearson’s correlation (p < 0.05) among the components of the proximate composition of grains from a panel of 155 rice genotypes. Shades of red and blue represent significant correlations; positive and negative, respectively.
Agriengineering 07 00305 g008
Figure 9. Principal component analysis based on the proximate composition of grains from a rice collection used in Brazil. Blue represents the rice genotypes.
Agriengineering 07 00305 g009
Table 1. Principal component analysis (PCA) of proximate composition of a rice panel, grown in Southern Brazil, indicating the eigenvalues (variance explained by each principal component—PC), variance proportion, cumulative variance by each PC, and eigenvectors (magnitude and direction of each trait).
EigenvaluesEigenvectors
Variance Components
PCEigenvalueProportionCumulativeProteinMoistureFatFiberAshStarch
PC1 *3.0220.5040.5040.4338−0.24720.28620.42090.5307−0.4583
PC2 *1.4850.2480.7510.19570.70430.2115−0.47120.0446−0.4438
PC30.9310.1550.906−0.51920.03050.82460.1761−0.13540.0119
PC40.3080.0510.9580.5840−0.39090.4008−0.3949−0.38180.2091
PC50.1560.0260.984−0.2109−0.19530.1050−0.54750.71850.3006
PC60.0990.0161.0000.34410.50090.14730.33780.18960.6774
* Principal components used in the analysis.
Table 2. Means of the proximate composition components of grains in the rice genotypes allocated in each quadrant.
GroupProteinFiberAshFatStarchMoisture
Q10.09510.01840.01540.01820.66180.1331
Q20.09270.01980.01530.01740.67330.1227
Q30.10300.02100.01650.01830.65920.1156
Q40.10660.01970.01670.01910.64630.1289
Disclaimer/Publisher’s Note: The statements, opinions and data contained in all publications are solely those of the individual author(s) and contributor(s) and not of MDPI and/or the editor(s). MDPI and/or the editor(s) disclaim responsibility for any injury to people or property resulting from any ideas, methods, instructions or products referred to in the content.