Article

Prediction of the Live Weight of Pigs in the Growing and Finishing Phases Through 3D Images in a Semiarid Region

by
Nicoly Farias Gomes
1,
Maria Vitória Neves de Melo
1,
Maria Eduarda Gonçalves de Oliveira
1,
Gledson Luiz Pontes de Almeida
1,
Kenny Ruben Montalvo Morales
1,
Taize Cavalcante Santana
2,
Héliton Pandorfi
1,
João Paulo Silva do Monte Lima
3,
Alexson Pantaleão Machado de Carvalho
4,
Rafaella Resende Andrade
4,*,
Marcio Mesquita
4 and
Marcos Vinícius da Silva
5
1
Graduate Program in Agricultural Engineering, Federal Rural University of Pernambuco, Rua Dom Manoel de Medeiros, SN, Dois Irmãos, Recife 52171-900, PE, Brazil
2
Postgraduate Program in Environmental Sciences, Federal University of Agreste of Pernambuco, Bom Pastor Avenue, s/n—Boa Vista, Garanhuns 55292-270, PE, Brazil
3
Graduate Program in Computing, Federal Rural University of Pernambuco, Rua Dom Manoel de Medeiros, SN, Dois Irmãos, Recife 52171-900, PE, Brazil
4
Agronomy School, Federal University of Goiás, Goiânia 74690-900, GO, Brazil
5
Chapadinha Science Center, Federal University of Maranhão, Chapadinha 65500-000, MA, Brazil
*
Author to whom correspondence should be addressed.
AgriEngineering 2025, 7(9), 307; https://doi.org/10.3390/agriengineering7090307
Submission received: 19 July 2025 / Revised: 3 September 2025 / Accepted: 15 September 2025 / Published: 19 September 2025

Abstract

Estimated population growth and increased demand for food production bring with them the evident need for more efficient and sustainable production systems. Because of this, computer vision plays a fundamental role in the development and application of solutions that help producers with the issues that limit livestock production in Brazil and the world. In addition to being stressful for the producer and the animal, the conventional pig weighing system causes productive losses and can compromise meat quality, being considered a practice that does not value animal welfare. The objective was to develop a computational procedure to predict the live weight of pigs in the growth and finishing phases, through the volume of the animals extracted through the processing of 3D images, as well as to analyze the real and estimated biometric measurements to define the relationships of these with live weight and volume obtained. The study was conducted at Roçadinho farm, in the municipality of Capoeiras, located in the Agreste region of the state of Pernambuco, Brazil. The variables weight and 3D images were obtained using a Kinect®—V2 camera and biometric measurements of 20 animals in the growth phase and 24 animals in the finishing phase, males and females, from the crossing of Pietrain and Large White, totaling 44 animals. To analyze the images, a program developed in Python (PyCharm Community Edition 2020.1.4) was used, to relate the variables, principal component analyses and regression analyzes were performed. The coefficient of linear determination between weight and volume was 73.3, 74.1, and 97.3% for pigs in the growing, finishing, and global phases, showing that this relationship is positive and satisfactorily expressed the weight of the animals. The relationship between the real and estimated biometric variables had a more expressive coefficient of determination in the global phase, having presented values between 77 and 94%.

1. Introduction

By 2050, the global human population is estimated at over 9 billion, consuming between 50 and 60% more food [1] compared to current consumption patterns. In this scenario, Brazil occupies 4th place as the largest producer and exporter of pigs in the world [2], with a growth trend for the coming years.
Because of this, the potential consumption of animal protein tends to grow significantly, but to present a satisfactory and conscious development, it is necessary to apply precision livestock tools that assist in productive performance, with an emphasis on animal welfare. According to [3] animal welfare is both an ethical factor with economic consequences and an economic factor that carries moral weight. Ref. [4] reiterates that people consider that they have obligations to the animals they use, whether for companionship, transport, or food production.
In animal production systems several processes present obsolete strategies that can be replaced to reduce production losses, avoid stress and discomfort to animals, promote well-being and add value to the final product, one of these processes is pig weighing. The most common method practiced is direct weighing by an electronic scale housed in the facility. This process is usually stressful for both the animal and the breeder, as it requires manpower to drive the animals to the handling center and access the scale [5,6].
The problem has been researched for more than three decades, where there was already talk about non-invasive methods for estimating pig live weight through image analysis and processing with supervised [7] and unsupervised [8,9], or even alternatives with different approaches such as forefoot weighing system [10].
Tracking weight gain is important for optimizing management and increasing production as it can be used to determine animal growth rates and potential health challenges. Rapid identification of changes in average daily weight gain is critical for the efficient management of pig nutrition, feed efficiency, and disease outbreak detection [11], as well as helping to define breeding phases and ensure greater accuracy in forecasting sales and slaughter time.
In recent years, some producers have added sensors inside the automatic feeder to weigh and record the pig’s weight in real-time. Most of these appliances are expensive and prone to erosion by contact with waste. Furthermore, to spread the use, they need to deconstruct traditional pig farming [12]. However, the application of new tools with the same purpose is necessary due to the advancement of technologies, intending to modernize, simplify, and make the process cheaper in terms of operation and computational costs.
Automated computer imaging systems can help producers and researchers to solve animal monitoring problems, for example, identification of behavioral patterns and signals, weighing, and other time-consuming and costly routine tasks, which can be made more objective, minimizing costs, for example through image processing [13], a technique that is becoming increasingly efficient, prioritizing high performance and low computational cost, thus becoming more applicable to real-world scenarios [14]. Therefore, computer vision has become a widely used tool, which provides promising results [15,16] when it comes to video [15,17], two-dimensional [18] and three-dimensional [19,20] images.
In these technologies, the use of depth cameras helps in the precision and the extraction of animal characteristics, in addition to avoiding some limitations found in the processing of 2D images, related to the lighting of the place and the color of the animal’s coat, showing an efficient instrument for estimating and sizing parts [21] and the animal’s body as a whole [11].
Because of this, the objective was to develop a computer program to predict the live weight of pigs in the growth and finishing phases, through the volume of animals extracted through 3D image processing, since this type of image has more information including the distances (z-axis) and provides more precise segmentation processes, as well as analyzing real and estimated biometric measurements to define their relationship with live weight and volume obtained.

2. Materials and Methods

This study develops a swine live weight estimation approach based on top-view depth image analysis using computer vision techniques incorporating manual processing stages (Figure 1).
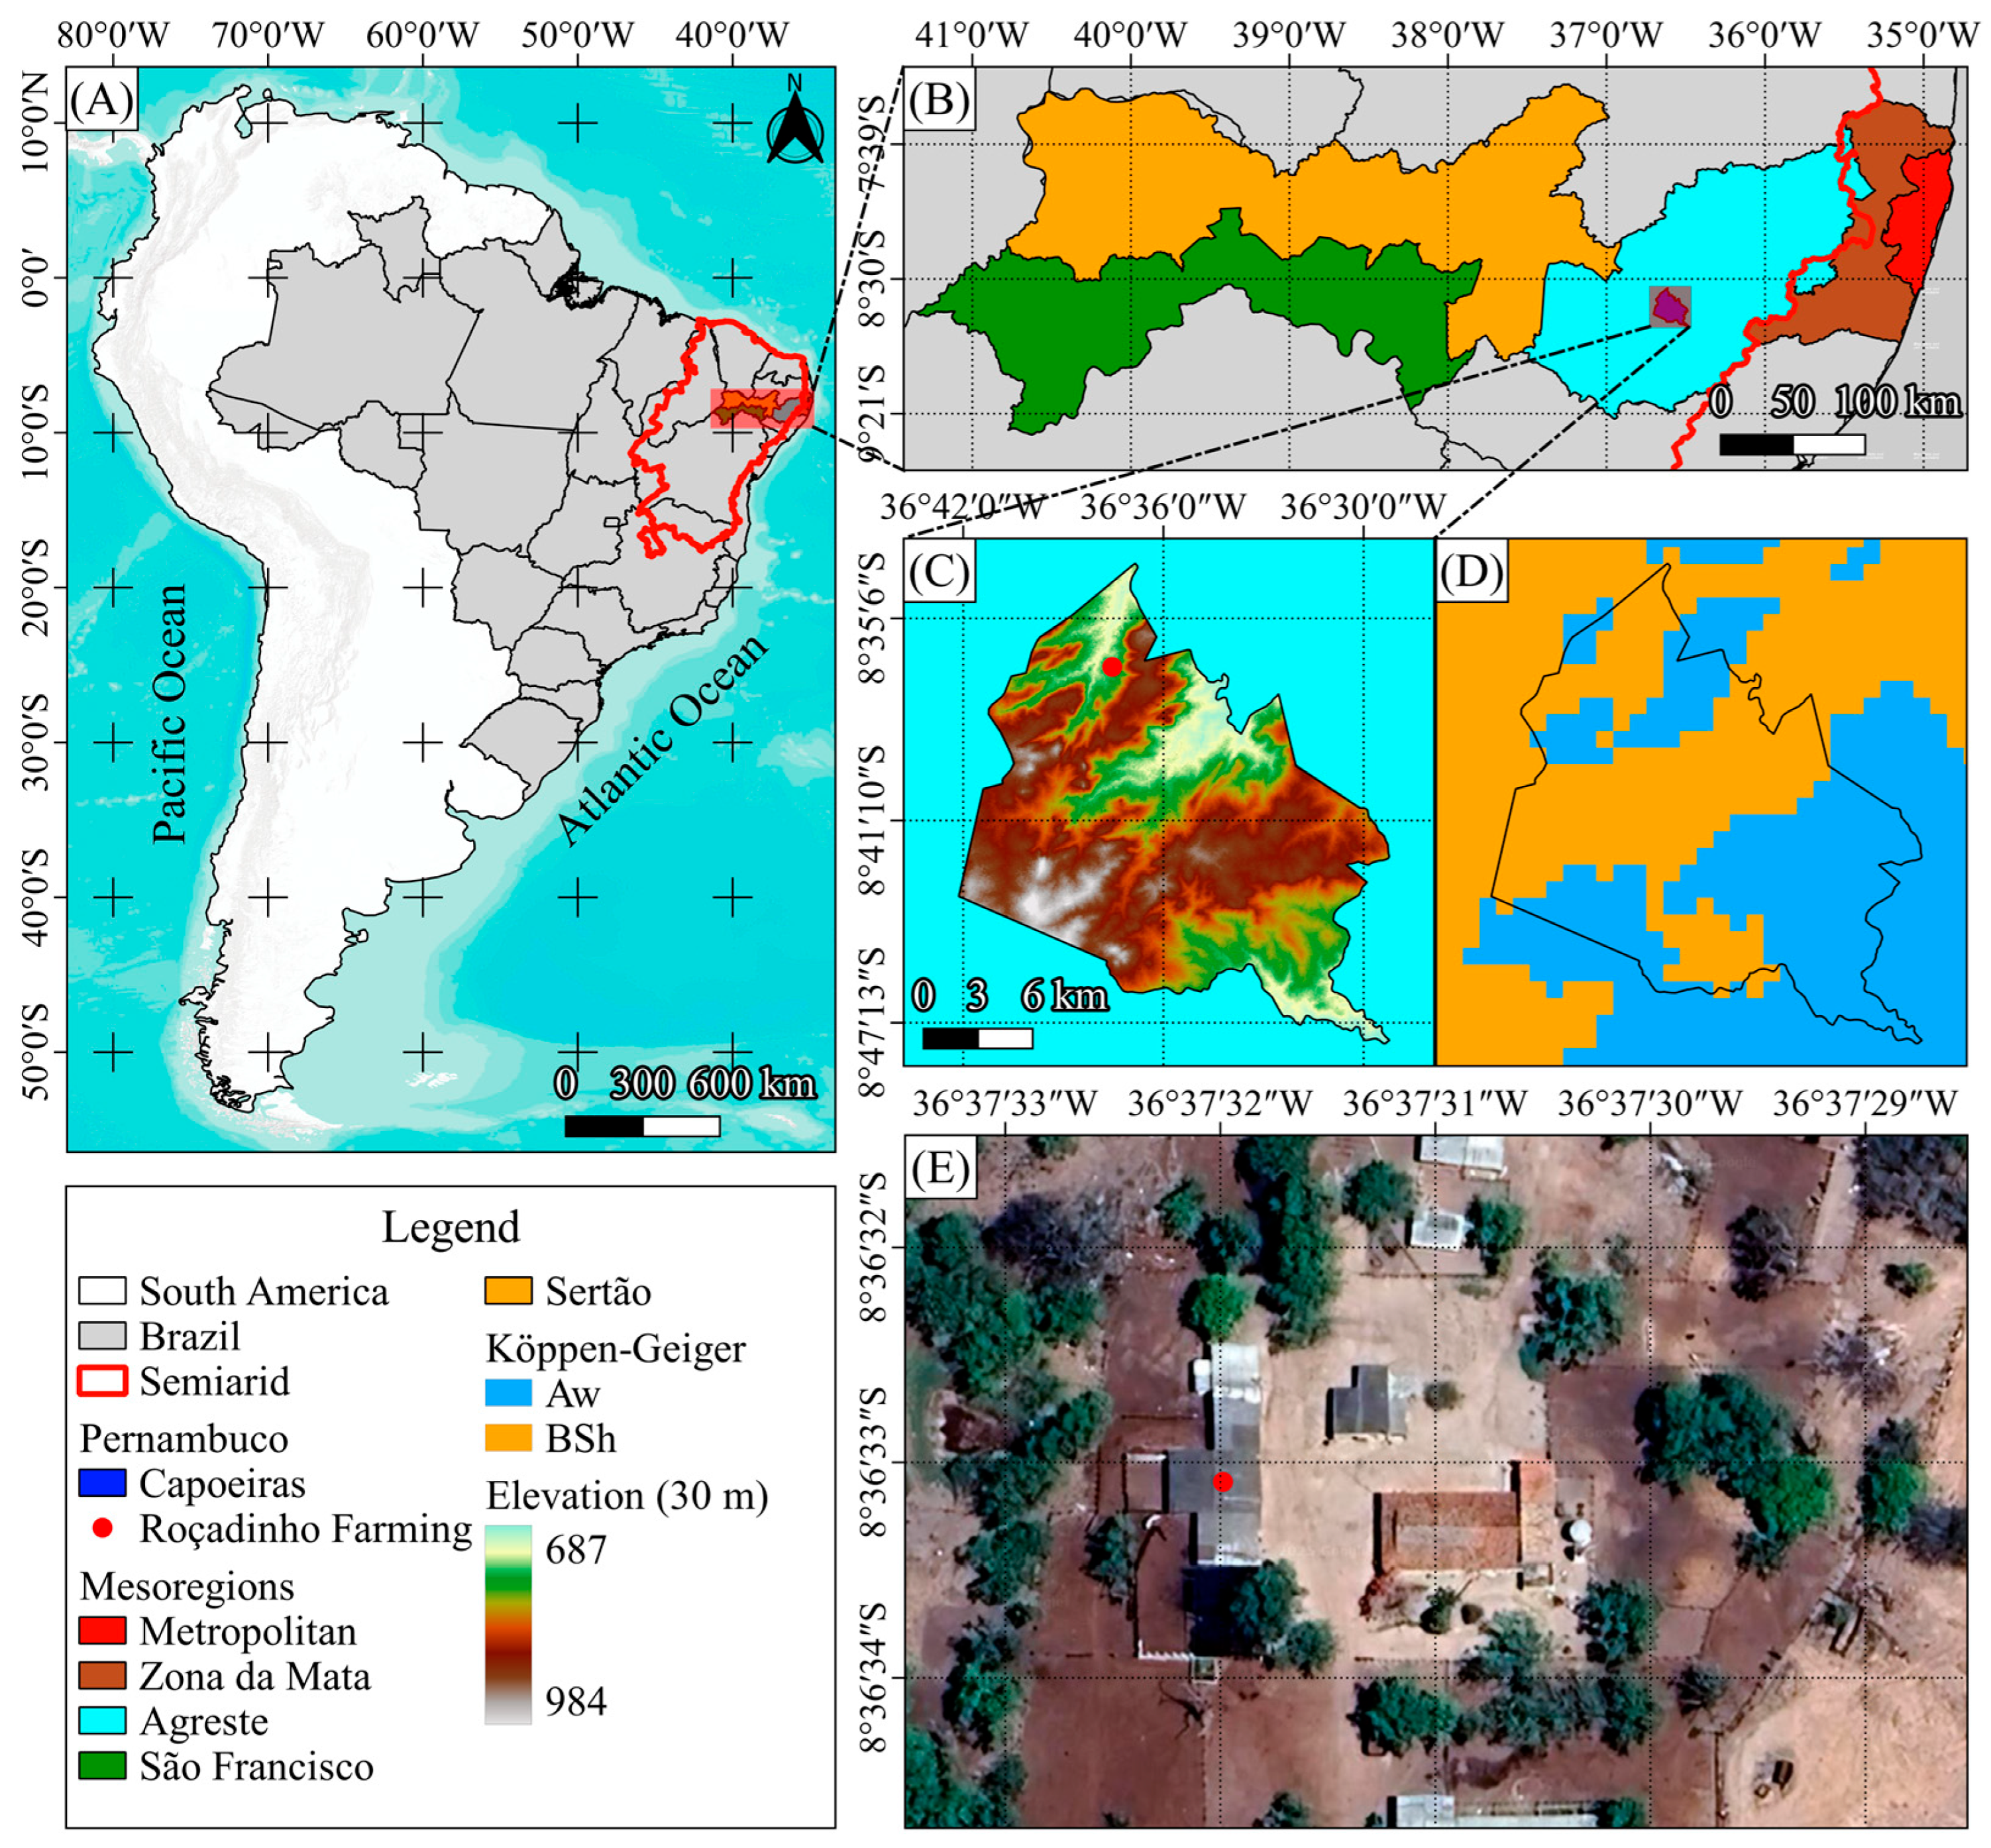
The study was carried out at Roçadinho farm, in the municipality of Capoeiras, located in the Microregion of Vale do Ipojuca, Agreste Mesoregion of the state of Pernambuco, Brazil, latitude 8°6′ S, longitude 36°37′ W an altitude of 850 m (Figure 2). According to the Köppen climate classification, the climate of the region is characterized as semiarid (Bsh).
The variables weight, 3D images, and biometric measurements were obtained from 20 animals in the growth phase and 24 animals in the finishing phase, males and females, from the crossing of Pietrain and Large White, totaling 44 animals. The conduction of the research was certified by the Comissão de Ética no Uso de Animais (CEUA) of the Universidade Federal Rural de Pernambuco (UFRPE), under protocol number 9693071021—ID 000921, by the precepts of Law 11,794 of 8 October 2008, Decree 6899 of 15 July 2009, by the rules issued by the Conselho Nacional de Controle da Experimentação Animal (CONCEA), approved by CEUA/UFRPE on December 2021.
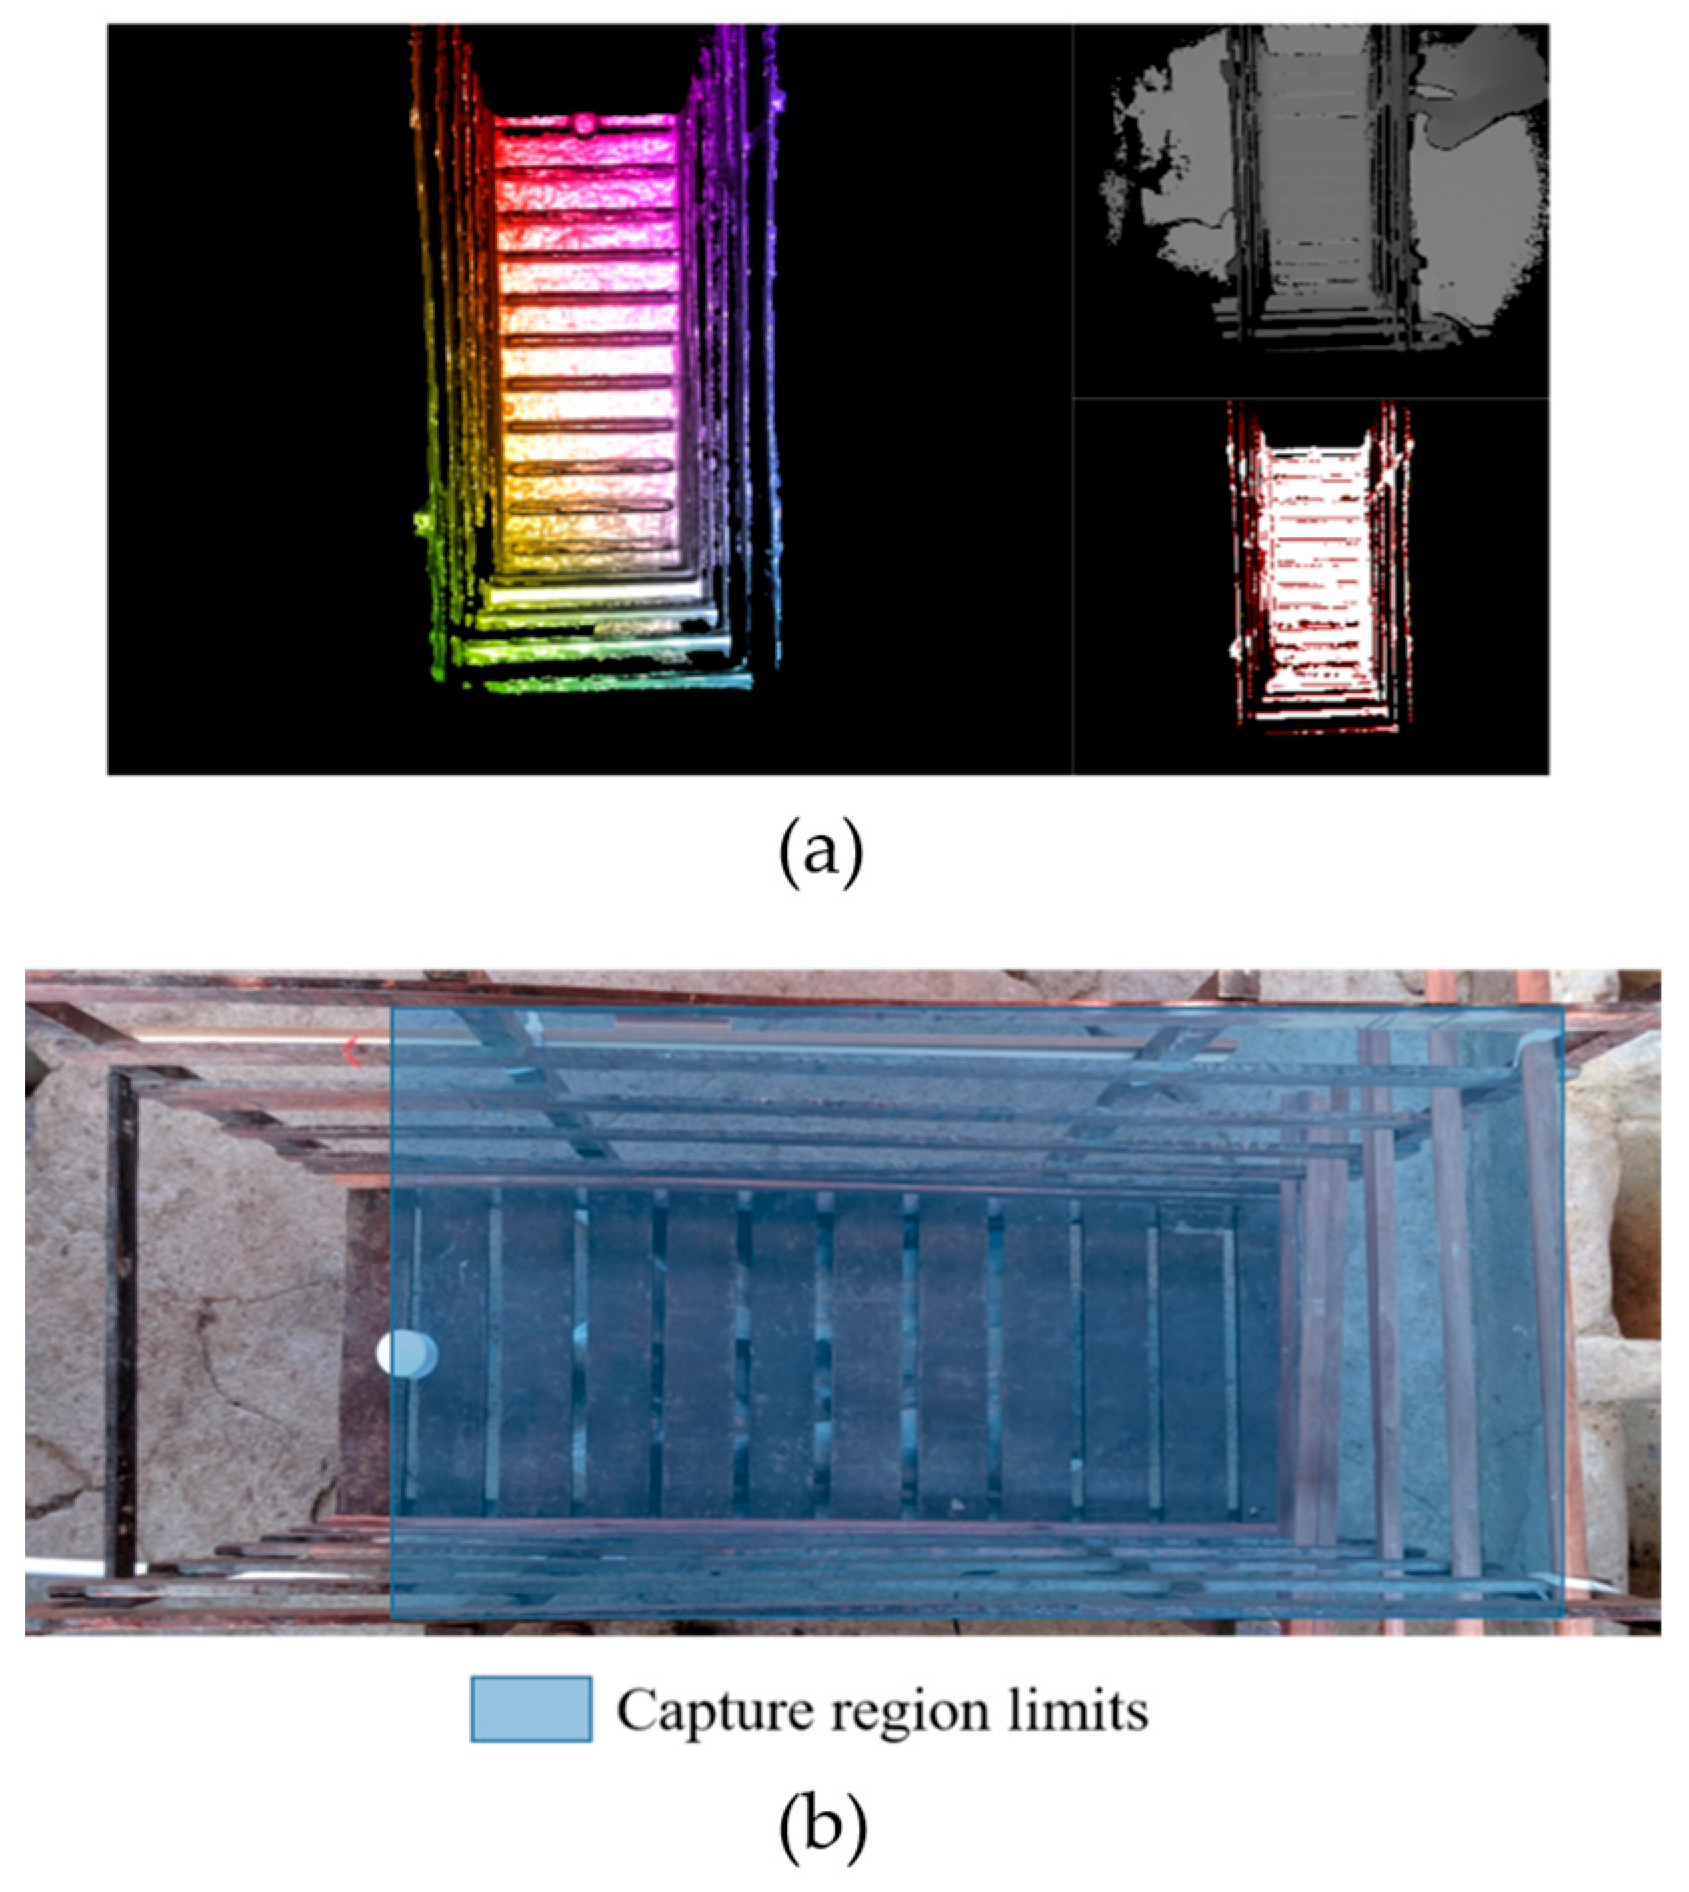
Data acquisition was performed in two moments: for the growth phase (December 2021) and for the finishing phase (March 2022). Before starting the recording of the images of the pigs in the production unit, tests were carried out at the Laboratório de Ambiência of the UFRPE to define the best conditions for obtaining the images, such as positioning of the structure and arrangement of the depth camera for three-dimensional imaging of the animal. Upon arrival at the experiment site, images were captured without the animals under the structure to adjust and ensure that the pigs would be in the camera capture area (Figure 3).
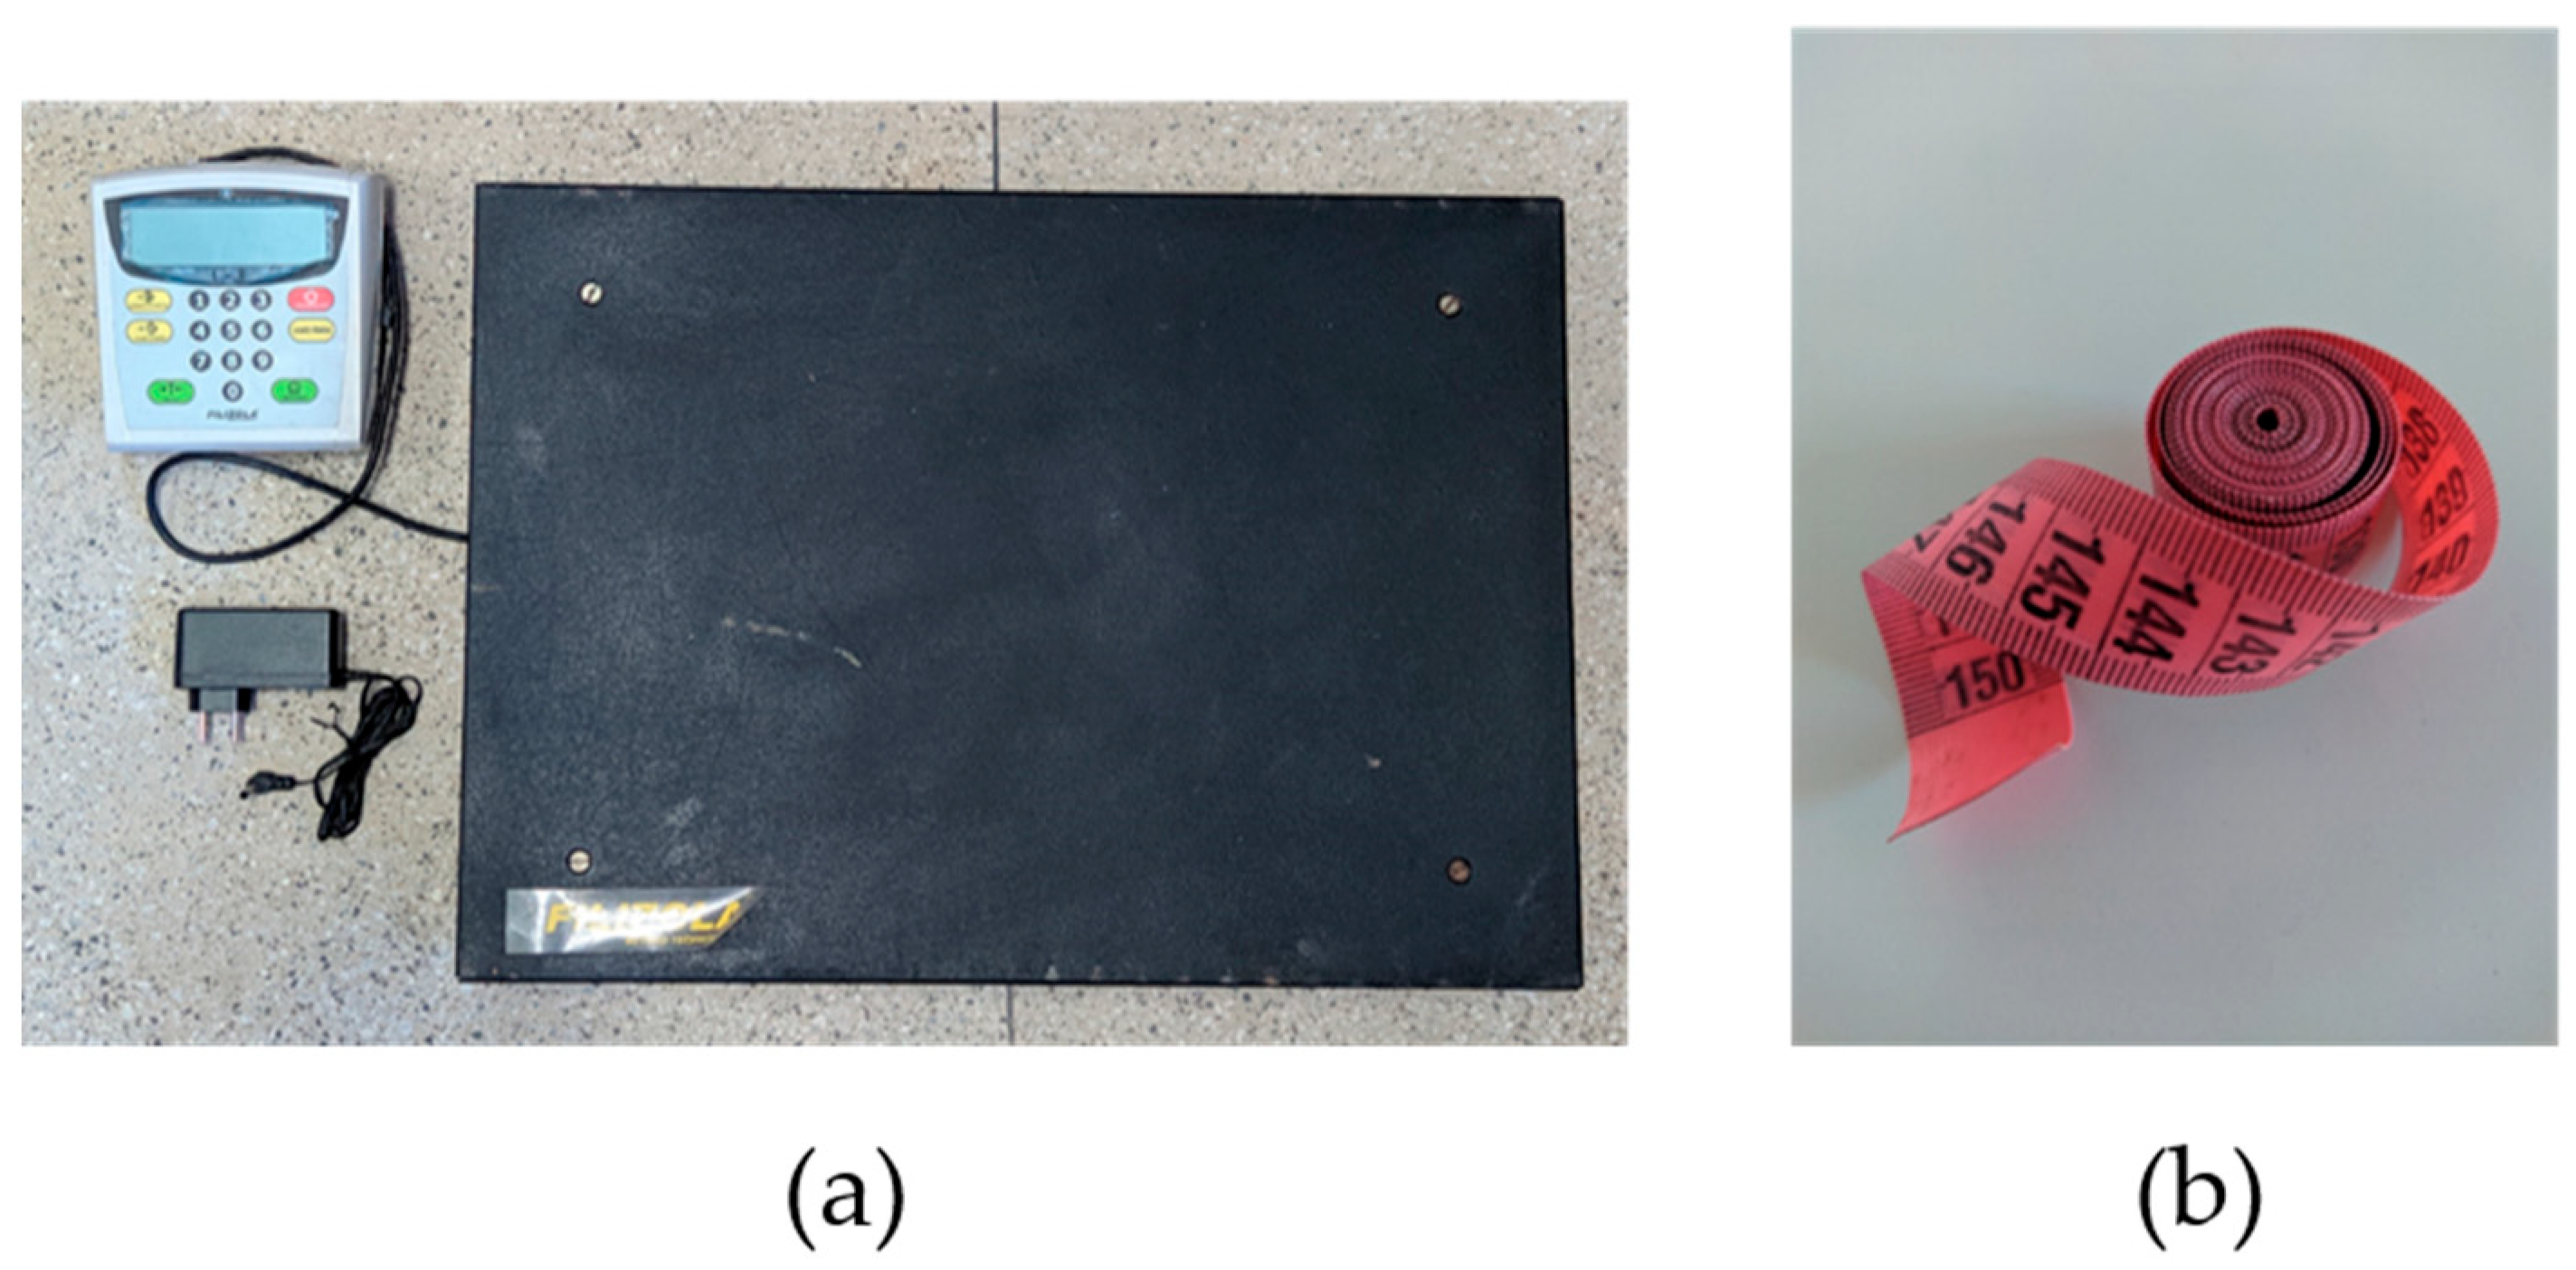
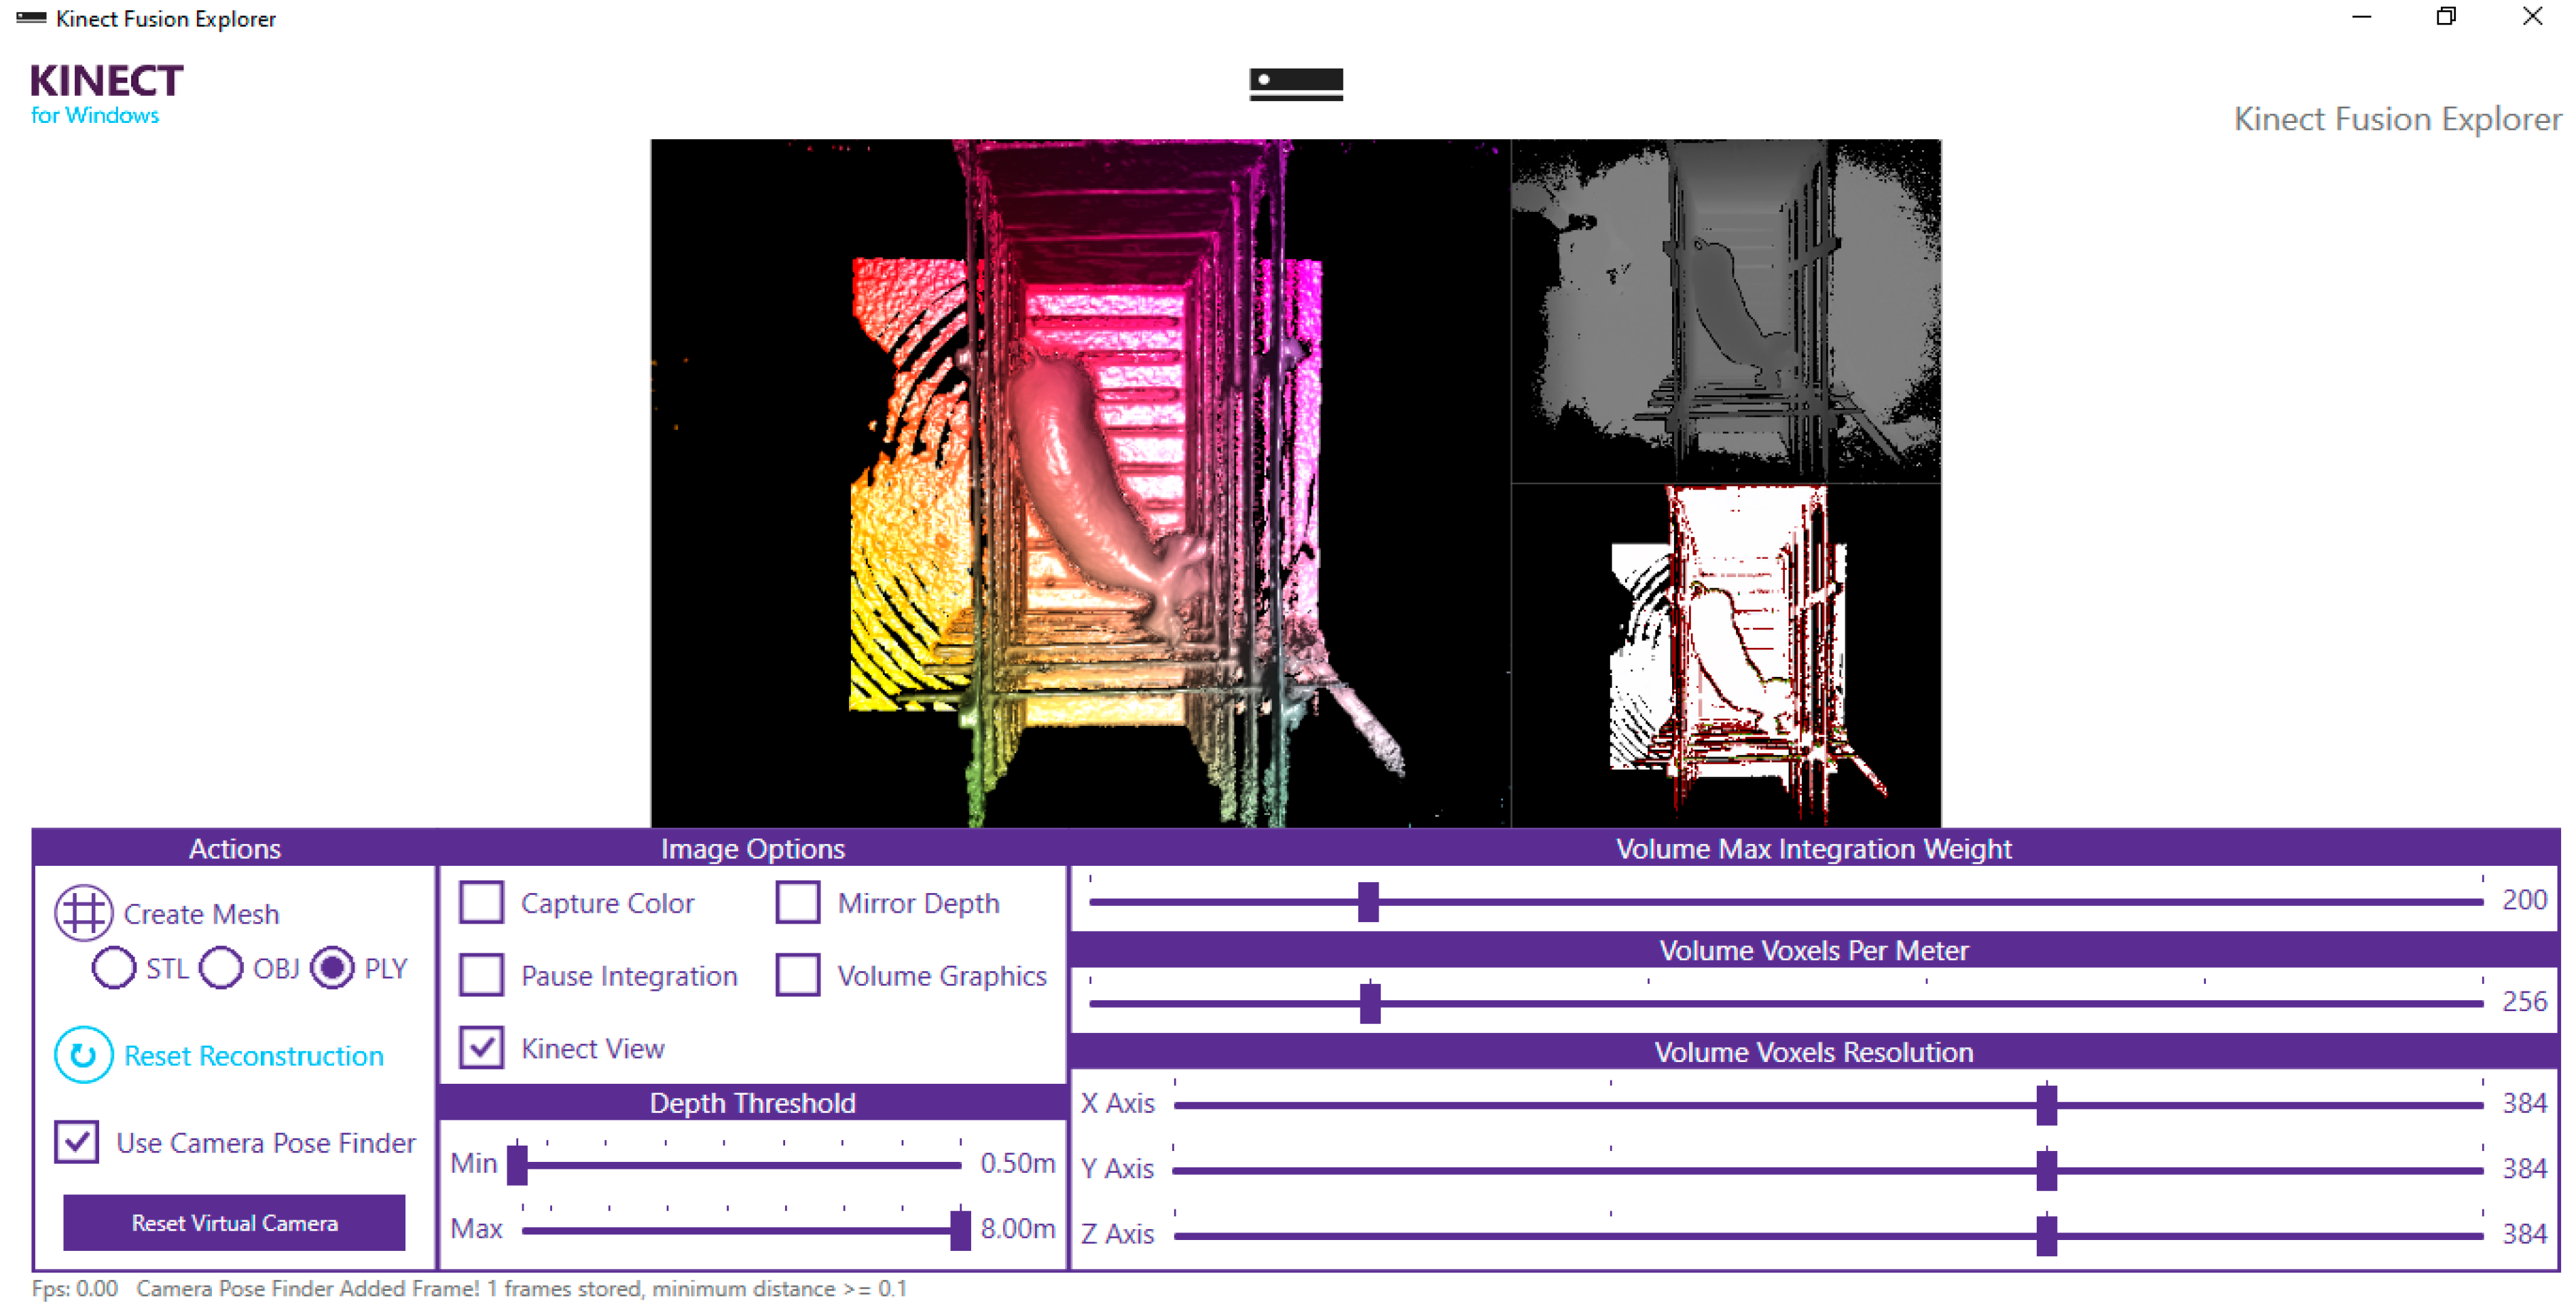
The pigs were taken to a containment chute attached to a Filizola electronic platform scale with a maximum capacity of 300 kg, a minimum of 2 kg, and an accuracy of 100 g (Figure 4a), where the animals were weighed. Images were captured using the Kinect for Windows Software Development Kit (SDK), version 7.1, running on a notebook connected to the camera (Figure 5). Actual biometric measurements were obtained using a simple plastic sewing measuring tape, 1.5 m long (150 × 2 cm), marked in centimeters and graded in millimeters (Figure 4b). Estimated measurements were obtained through depth image analysis. After obtaining the necessary information, the pigs were properly identified and released.
The weight of the animals was considered after the stabilization of the electronic scale, as soon as the pigs entered the chute, then the values were recorded in a spreadsheet.
The calibration of the image acquisition system was carried out using images of polystyrene spheres positioned in a controlled environment, where the capture distances had been previously marked on the floor. Images were acquired using a depth camera (Microsoft Kinect®—V2) installed on the ceiling of the facility (Figure 6), at a height of 1.73 m above the floor of the chute, oriented at a 90° angle relative to the roof slat, so that the camera lens remained directed toward the animals’ dorsal region. Image acquisition was performed at intervals of 3 to 4 min between captures, which could be longer for younger animals due to the time required to guide them into the structure coupled to the scale, allow them to stabilize in a standing position, perform the capture, verify image quality, and subsequently remove the animal from the structure.
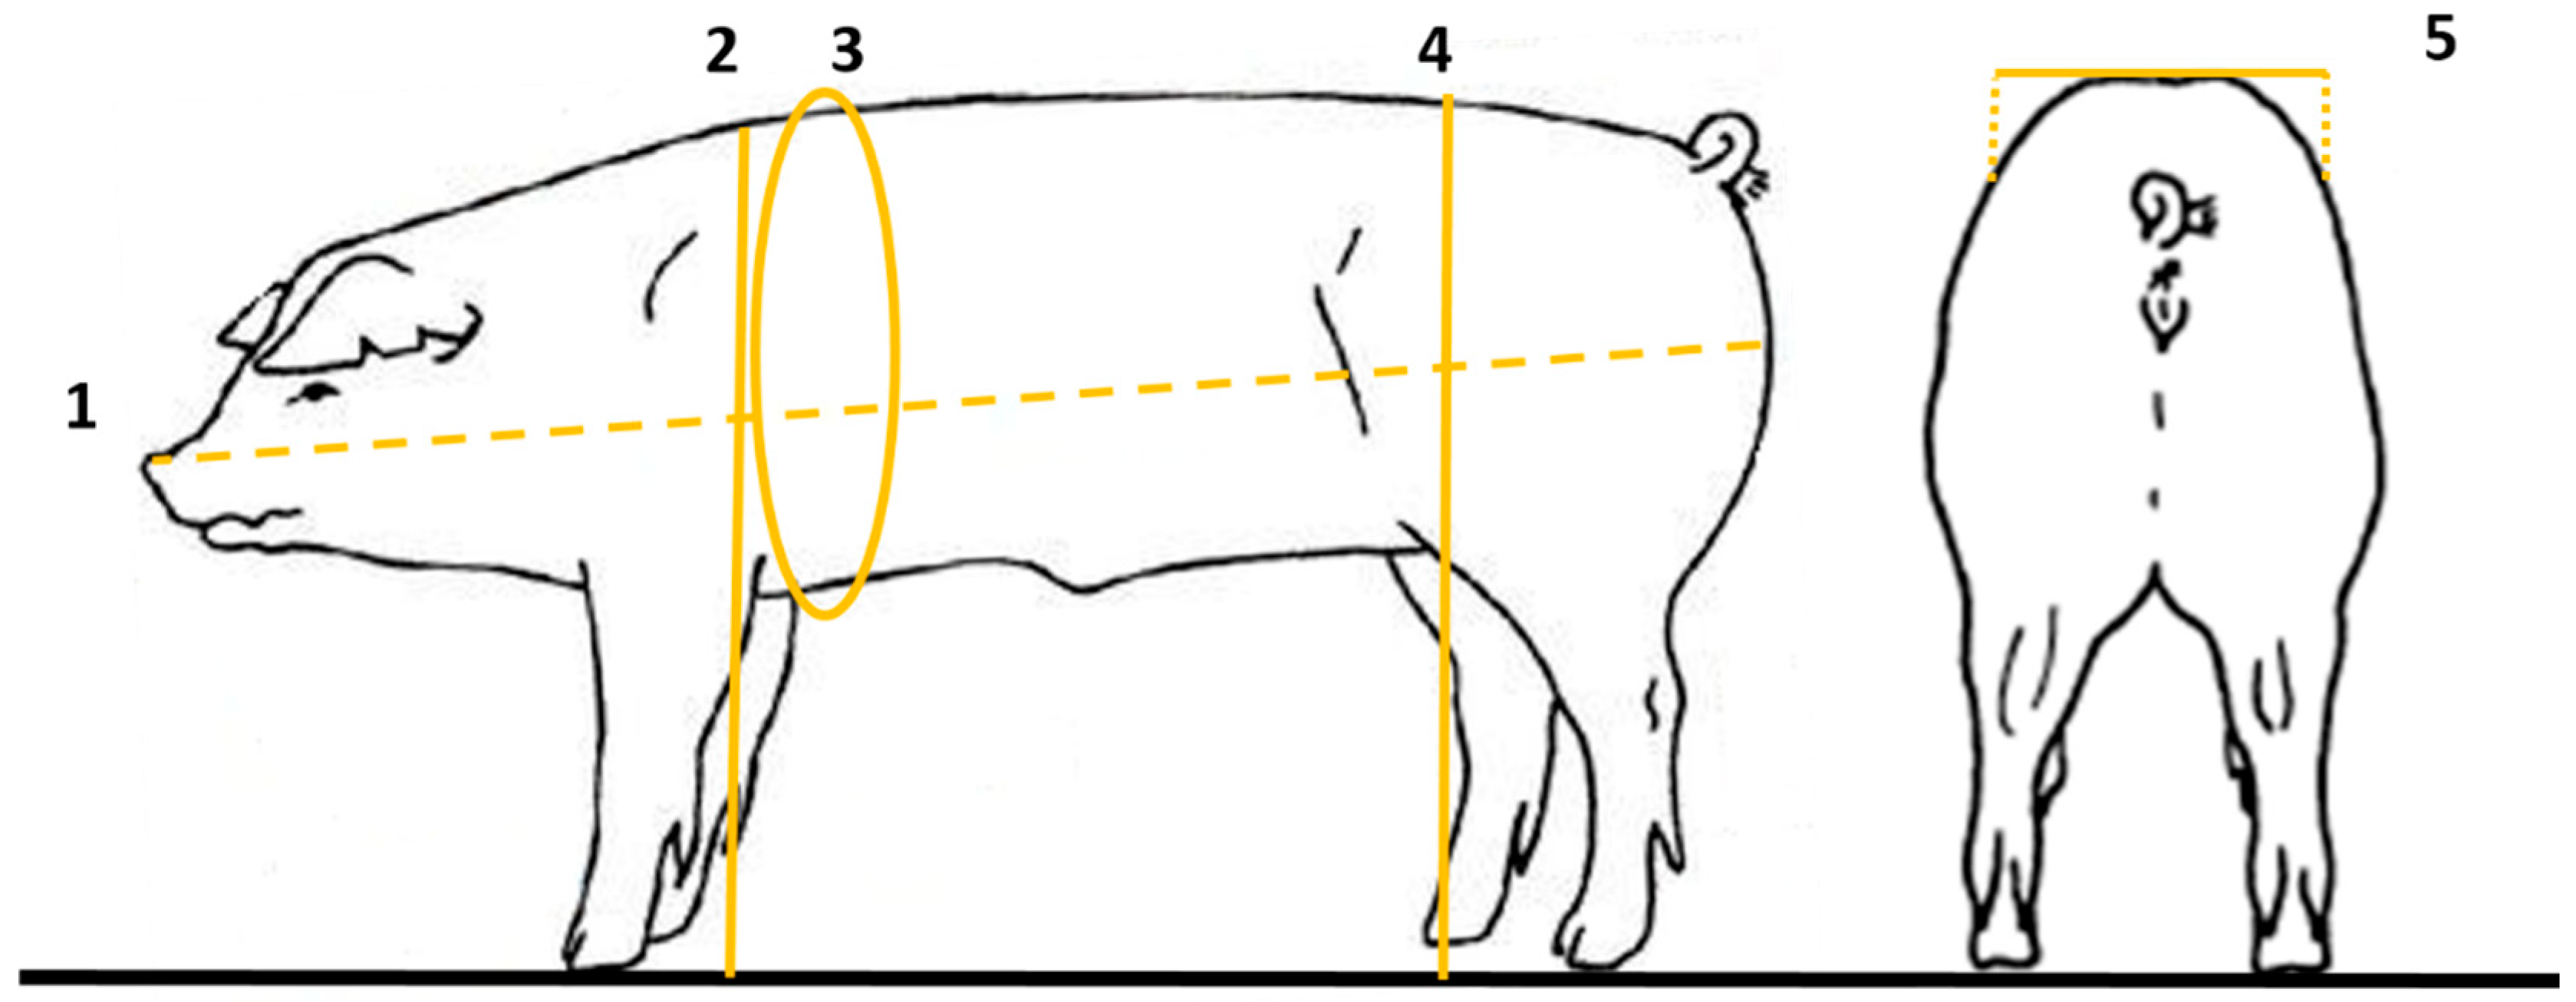
The extraction of biometric measurements included body length (BL—measured from the tip of the snout to the tip of the buttock, cm), thoracic perimeter (TP—measured from the area of greatest slope of the withers through the ventral base of the sternum, cm), height to the withers (HW—measured from the floor to the highest point of the withers, cm), the height of the croup (HC—measured from the floor to the external iliac tuberosity—hip tip, cm) and width of the croup (WC—measured between both external iliac tuberosities, cm), which was performed manually, with the aid of a tape measure (Figure 7).
PyCharm Community Edition 2020.1.4 was used to analyze the images. The code was developed in the Python language using the Open3D library to extract biometric parameters and calculate the volume (VOL) (m3) of the pigs.
For the acquisition of biometric parameters through the definition of points in the 3D image, the captured image was used, without pre-processing. Points were marked and the distances between them were calculated through the pairs of points, using the x, y, and z axes, for the values of body length, height at the withers, croup height, and croup width (Figure 8).
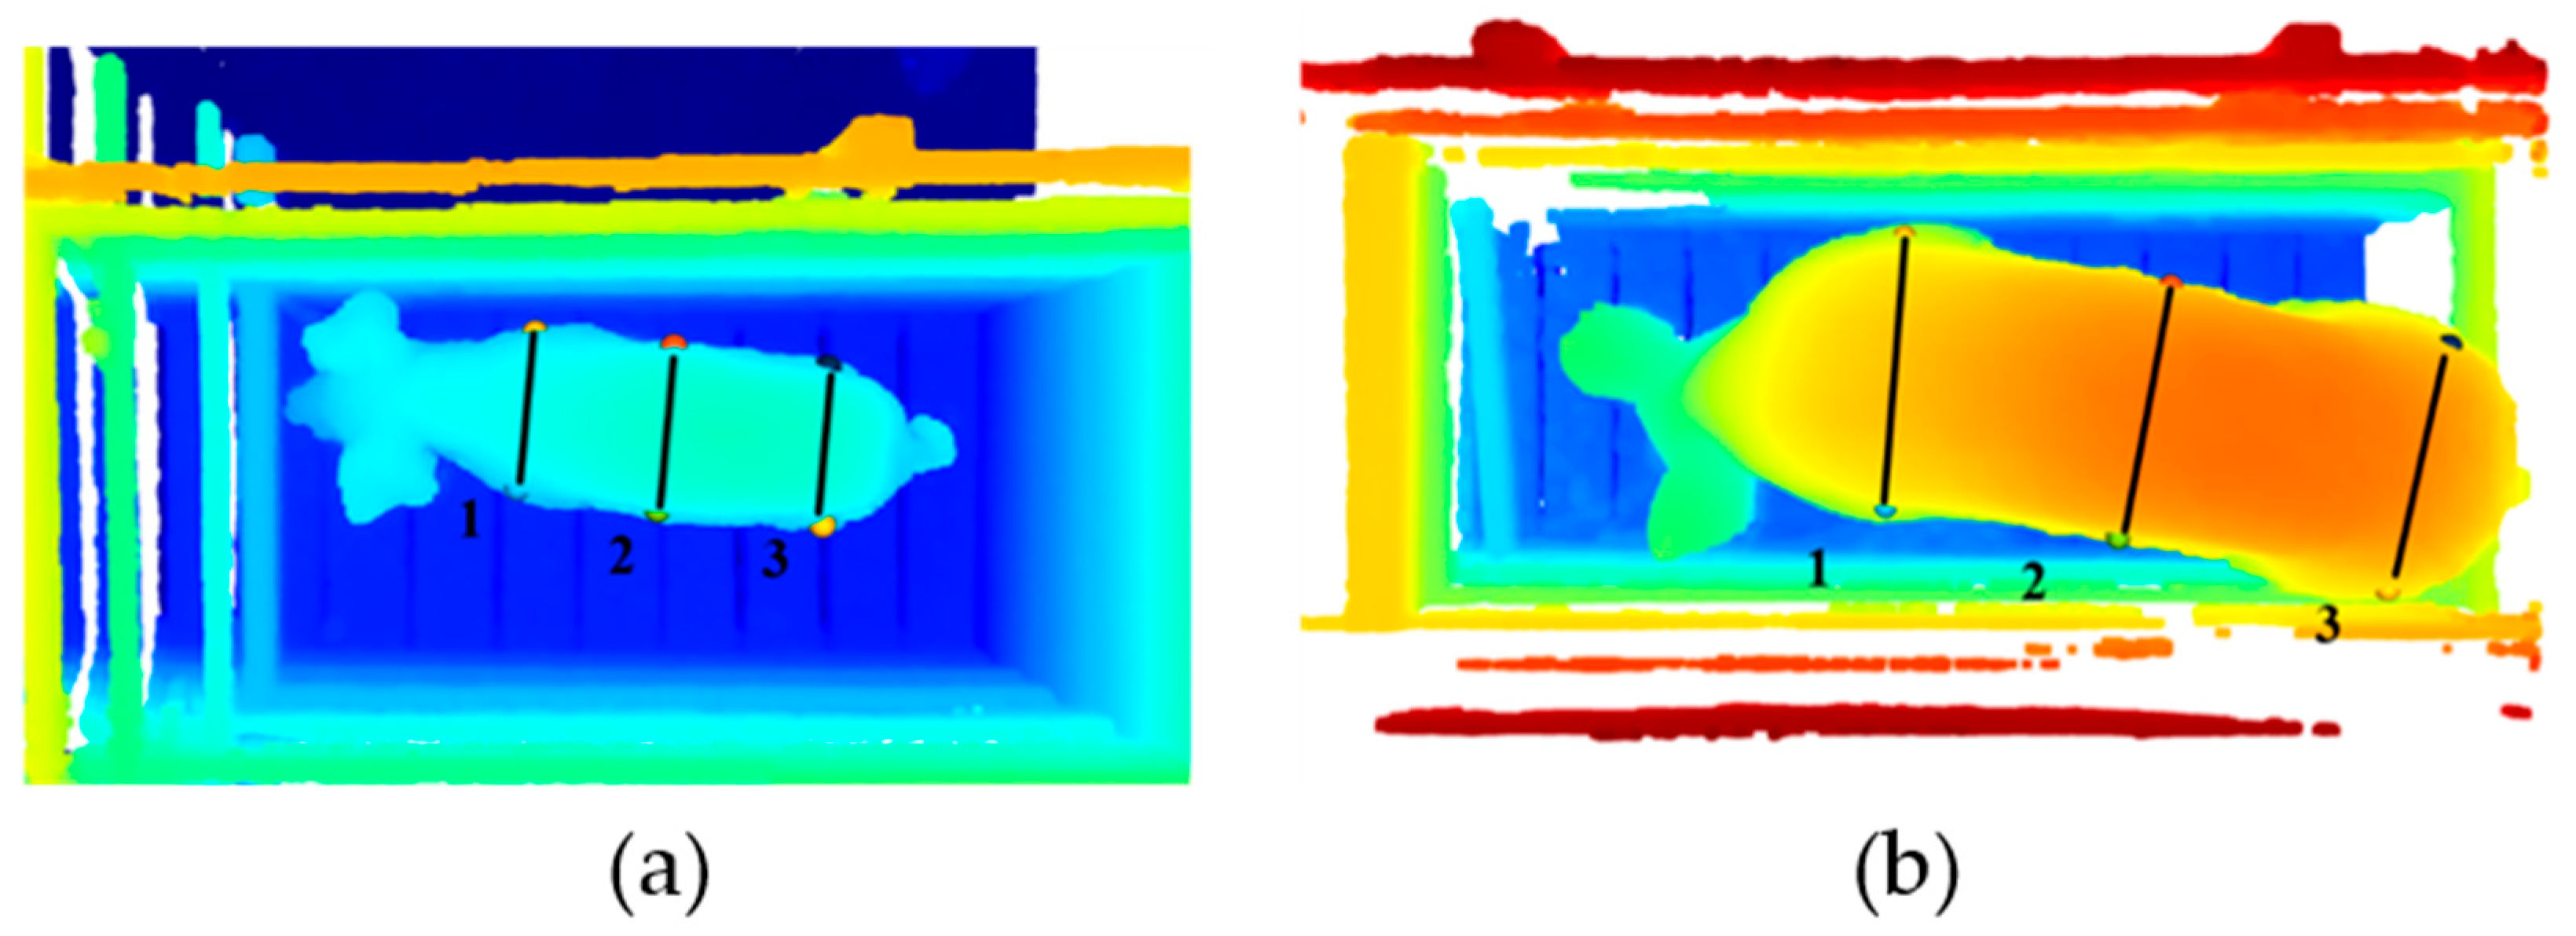
The thoracic perimeter was obtained through mathematical relationships, considering the calculation of the perimeter of the circumference, assuming that the animal’s body is close to the geometry of the cylinder, three pairs of points were traced, one closer to the head (1), one on the middle (2) and one closer to the tail of the animal (3) (Figure 9), the distances between the points was calculated to obtain the radius of the circumference, after obtaining the three perimeters, their average was considered and analyzed the perimeter of the circumference for each of the measurements and the average of the three, using the data set that presented the highest R2, assuming the value of the thoracic perimeter as being.
For the growth phase, the data set of measurement 3 (a measurement that approaches the width of the croup) was considered, for the finishing phase, the set of measurements that best estimated the thoracic perimeter was measurement 1 (approximate measurement of the width at withers) and for the global dataset, the average dataset between the three pairs of points was used.
These measurements were compared to real biometric measurements and the relationship between them was used to describe the reliability of the information acquired through the images.
After the 3D top-view acquisition, which generated the animal’s point cloud, preprocessing steps were applied to reduce external interference and isolate the region of interest (the animal’s body). Two crops were performed, one superior (Figure 10a) and one lateral (Figure 10b), delineated by gray boxes, along with the removal of an additional layer to enhance the definition of the convex hoof (Figure 10f), resulting in the estimation of body volume.
To evaluate the data, regression analysis was performed between pairs of variables that expressed the same measures to perceive the degree of fidelity between the real biometric measures (BL, TP, HW, HC, WC) extracted conventionally and the estimated measurements, the same analysis was performed comparing the live weight to the animal’s body volume, in this case, we used the mean absolute error (MAE), mean squared error (MSE), and root mean square error (RMSE) as metrics to assess quality. These pairs were submitted to descriptive statistical analysis, analysis of variance (ANOVA), obtaining the maximum, minimum, mean, and variation measures, to express the results with the 99% significance test (p-Value < 0.01), if the answers obtained have an error of less than 1% probability.
To determine the correlations between the biometric measurements, weight, and volume of the animals, a multivariate analysis was performed using the principal component analysis (PCA) technique. For the validation of the PCA, the criterion of [22] was adopted, in which it is assumed that the eigenvalues of the components must be greater than 1, for the projection of the two-dimensional graphs. The Varimax rotation, that is, an orthogonal rotation, was applied to the main components to obtain a better physical interpretation of the variables and maximize the correlation between the variables and components [23]. The software used for the analysis of principal components was OriginLab version 8.6.

3. Results and Discussion

A total of 44 3D images were analyzed, one per animal. During the growth phase, the animals had an average weight of 17.9 ± 4.2 kg, while in the finishing phase, the average weight was 90.9 ± 10.3 kg. The relationship between live weight (kg) and volume (VOL) (m3) of the animals (Figure 11) during the growth, finishing, and combined (global) phases showed coefficients of determination (R2) of 0.7326, 0.7412, and 0.9728, respectively. Having better functional relationship between variables for the global data set, as perceived by [24] who obtained an R2 of 0.9907, and [25] with an R2 equal to 0.958, showing that more than 95% of the variability of the mass of the animals could be explained by the volume obtained through the data provided by the Kinect® sensor, these coefficients of the determination being higher than that obtained by [17] in linear regression (R2 = 0.871) in a similar study.
It is essential to acknowledge that several factors can contribute to the variability in weight estimates derived from 3D imaging. Principal sources of error include the resolution of the depth camera employed (Kinect V2), the posture of the pigs during image acquisition, inaccuracies associated with the manual annotation of points within the point cloud, and limitations in image processing, particularly in regions characterized by low data density.
The linear model was the one that best fitted the conditions observed in addition to explaining the nature of the data set and following the growth curve of the animals. The statistical test with a significance of 99% (p-Value < 0.01), p-Value equal to 0, reaffirm the reliability and good representativeness of the model’s real measurements for the defined percentage (Table 1).
The equation generated by the model through regression analysis and applied to the volume values to estimate the weight in the two breeding phases, when the estimated weights were compared with the real weights (Figure 12), with an average difference of 4.38 kg. Using video camera images [17] obtained an accuracy equal to 96.2% with an error of 1.23 kg in predicting the individual weight of pigs, while [25] using a Kinect camera and body parameters obtained a prediction equation with a mean error of 2.961 kg. According to these results, the model is reliable and representative, with less variance in the data referring to the finishing phase.
The values of the Mean Absolute Error (MAE), Mean Absolute Percentage Error (MAPE), and Root Mean Squared Error (RMSE) indicate significant differences in the accuracy of live weight prediction for pigs among the groups analyzed (CRESC, TERM, and GLOBAL), as described in the Table 2.
The lowest RMSE (2.74 kg) and MAE (2.12 kg) observed in the CRESC group indicate that the model achieves higher precision for animals in the growth phase, possibly due to the lower morphological variation within this category. However, the higher MAPE (13.13%) in this group suggests that, in relative terms, the prediction error is proportionally greater, which may be associated with the lower average weight of young pigs, amplifying the percentage impact of deviations.
In the TERM group, the higher RMSE (5.24 kg) and MAE (4.25 kg) reflect greater absolute error, whereas the substantially lower MAPE (4.56%) indicates better relative performance, likely due to the higher average weight of finished pigs.
The GLOBAL dataset shows the highest RMSE (6.14 kg) and MAE (4.90 kg) values, along with an intermediate MAPE (11.88%), demonstrating that combining animals from different production phases increases the variability of prediction errors. These results emphasize the importance of considering both absolute metrics (RMSE, MAE) and relative metrics (MAPE) for a comprehensive evaluation, highlighting that the model’s accuracy varies according to weight category and production stage.
In a comparable study [26], a MAE of 3.263 kg and an RMSE of 4.697 kg were obtained using neural network models, results that are not markedly different from those reported in the present work, suggesting that potential methodological refinements may lead to substantial improvements in such approaches.
Knowing the cultural habits of the region regarding the commercialization of live weight, approximately 5% of the animal’s head weight is disregarded [27], the average variance of the model is around 9%, which partially compensates for this loss, making the prediction more accurate. Like [16] who developed a system to identify the mass of pigs through computer vision tools, with an 8% variation from the real value.
According to the regression analysis performed for the biometric variables, when comparing the real values to those obtained through the 3D image, for the growth phase, the R2 of 0.6604, 0.4521, 0.4023, 0.4647 and 0.7614 referring to croup height, length, croup width, height at withers and thoracic perimeter, respectively (Table 3).
For the finishing phase, R2 of 0.3622, 0.0163, 0.3053, 0.4743, and 0.5240 were observed for croup height, length, croup width, and height at withers and thoracic perimeter, respectively (Table 4). These R2 values below 60% may indicate the need for a larger database or even a strategy for analyzing and extracting features that better fit the conditions presented. These results differ from those reported by [28], who employed a dual-camera system with distinct viewing angles and achieved coefficient of determination (R2) values ranging from 0.91 to 0.98 for the estimation of body length and height at the withers.
When comparing the actual biometric measurements with the estimated measurements, considering the global dataset, determination coefficients of 0.9024, 0.7794, 0.914, 0.9215, and 0.9409 were obtained referring to croup height, length, the width of the croup, height at withers and thoracic perimeter, respectively (Table 5). The values of the coefficients of determination above 77% for length and greater than 90% for TP, HW, HC, and WC, indicate that the biometric measurements acquisition system has a good representation of the real data, as in the similar study carried out by [20] relating body measurements to live weight estimation showed R2 ranging from 0.95 to 0.98, using computer vision systems to predict morphometric characteristics.
The variation of the approximate coefficients of determination between 0.78 and 0.94, shows that for global data, the estimation of biometric measurements through the analysis of 3D images can be considered a reliable source of information, in addition to having presented a significance of 99% (p-Value < 0.01), p-Value equal to 0 (Table 6). Close values were found by [11] who, using image analysis and biometric relationships, observed values between 0.72 and 0.98 for day-ahead predictions of pig body weight.
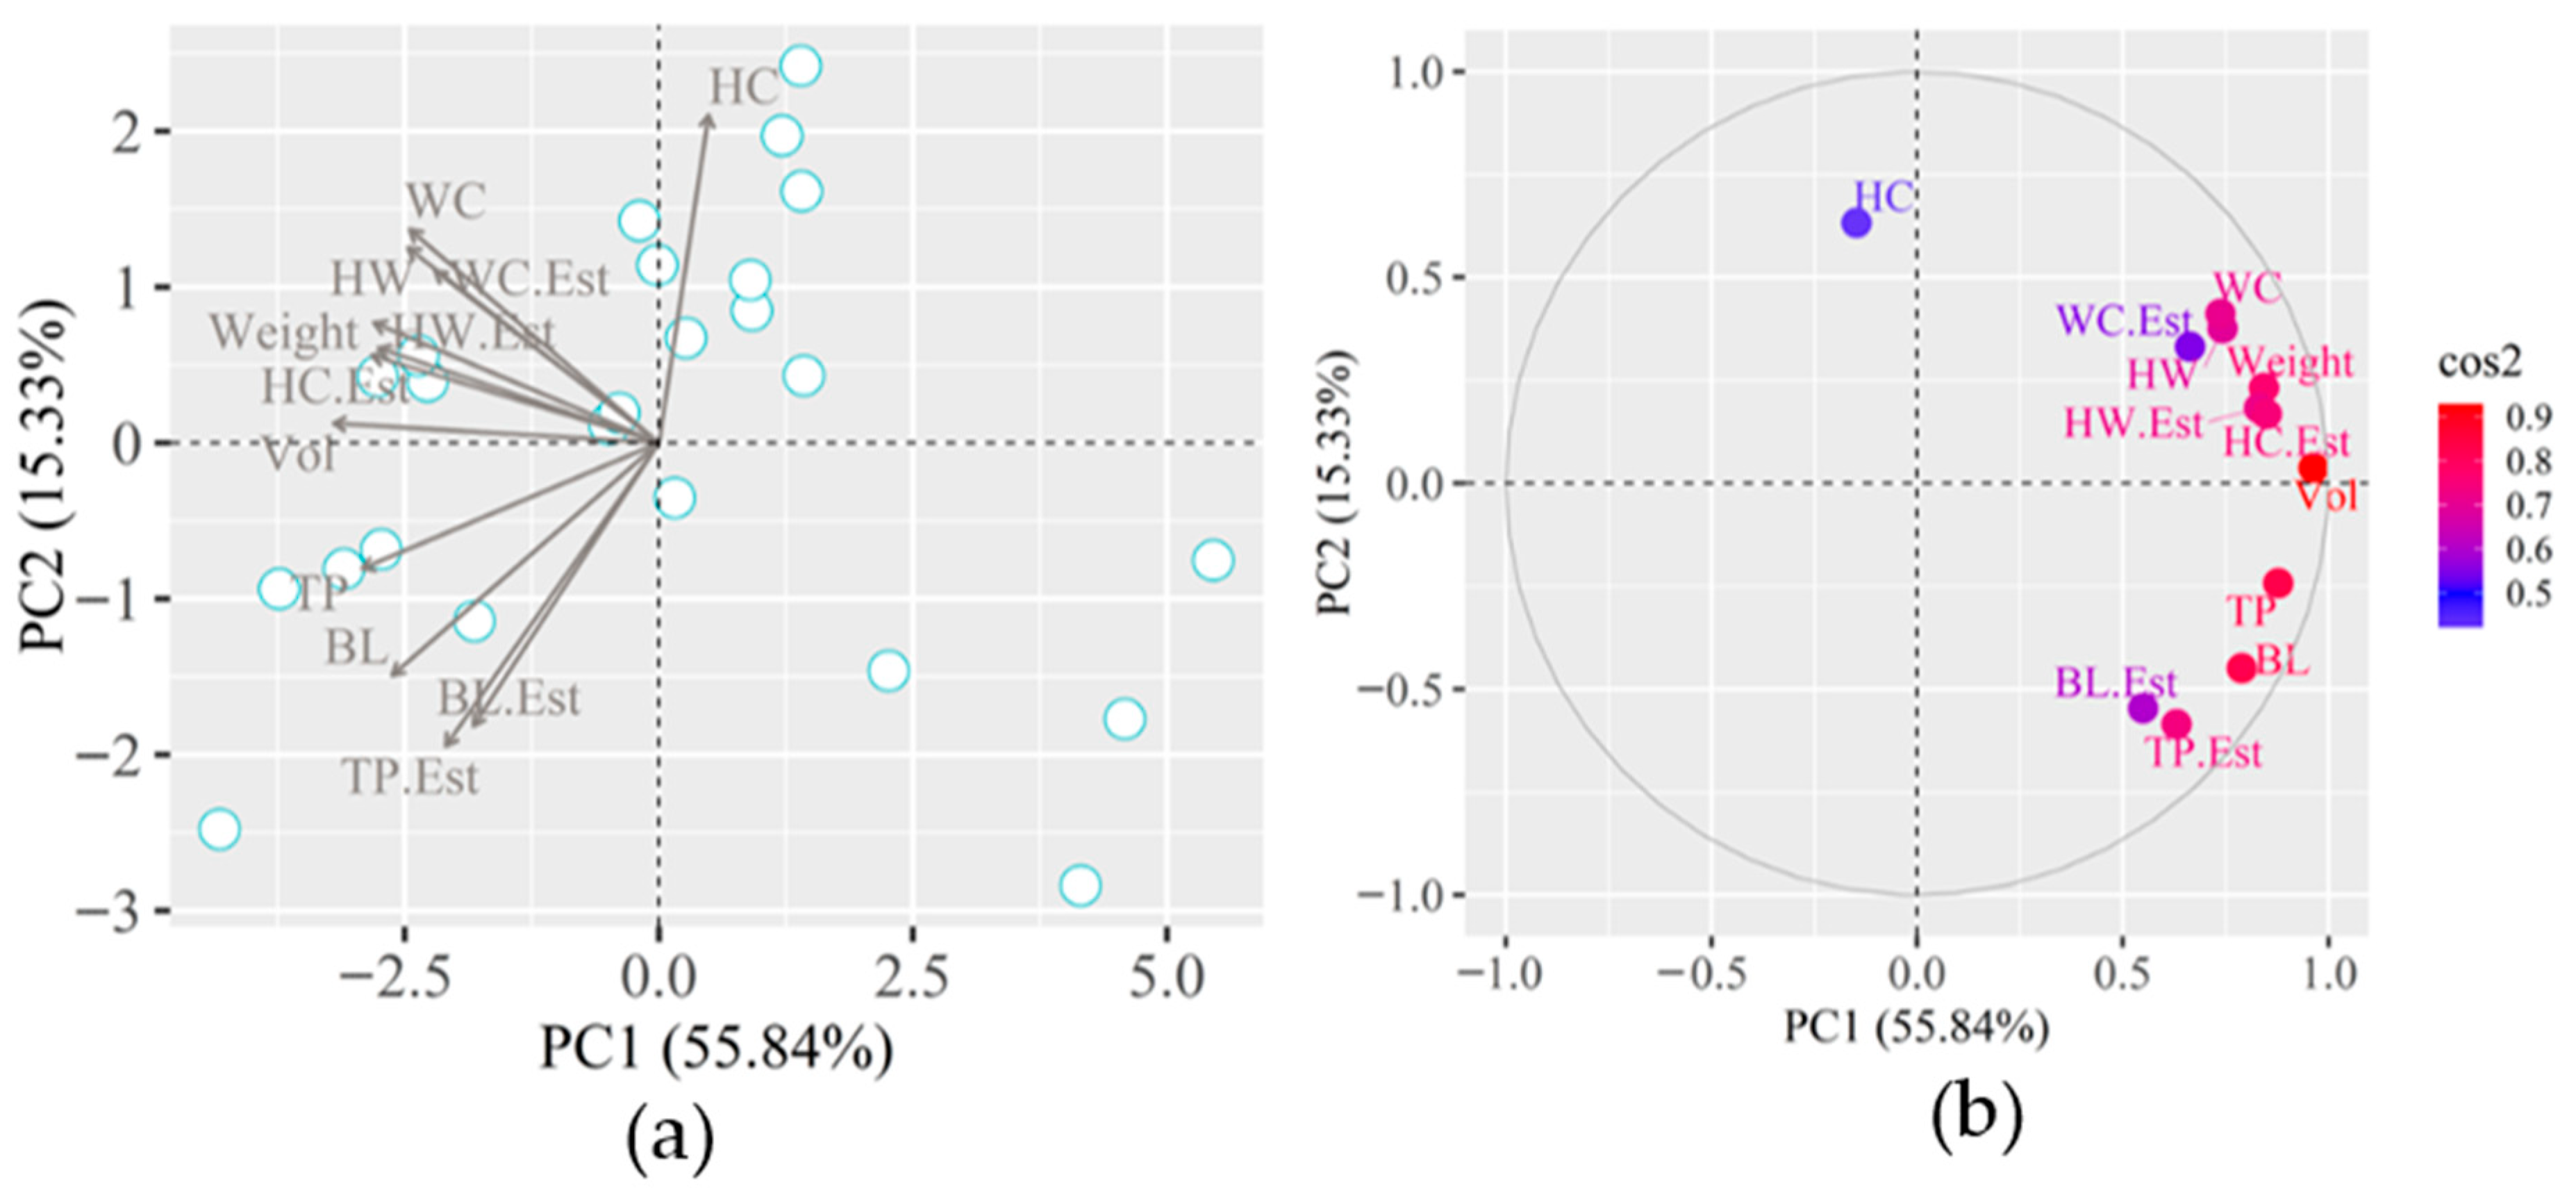
Figure 13a shows the principal component analysis (PCA) and principal component correlation analysis (CCP) (Figure 13b) of the actual and estimated biometric measurements, length (BL, cm), estimated length (BL.Est, cm), chest circumference (TP, cm), chest circumference (TP.Est, cm), croup height (HW, cm), croup height (HW.Est, cm) height at withers (HC, cm), height at withers (HC.Est, cm), rump width (WC, cm), croup width (WC.Est, cm), live weight (Weight, kg) and volume of animals (VOL, m3) in the growth phase.
In the growth phase, it is observed through the PCA that the main component 1 (PC1) is responsible for representing 66.08% of the existing correlation between the variables, while the main component 2 (PC2) is responsible for only 11.43%, therefore, the cumulative total variance of the variables studied was 77.51% (Figure 14b). The correlation of the main components, based on Pearson’s correlation (high correlation—coefficient tends to be 1 or −1) is presented in the color scale, with the correlation coefficient (cos2) lower than 0.7 presented by the estimated variables HC.Est, BL.Est, TP.Est and HW.Est. In this same scenario, the variables that presented a correlation coefficient close to 0.9 were Weight, TP, Vol, HC, and HW.
Figure 14a shows the grouping of animals around the observed variables, when compared to the growth phase, showing that the measurements were more common among the samples, making the relationships between them more expressive.
It is observed through the PCA that the principal component 1 (PC1) is responsible for representing 55.84% of the existing correlation between the variables, while the principal component 2 (PC2) is responsible for only 15.33%, before that, the cumulative total variance of the variables studied was 71.17% (Figure 14b). The color scale shows that the highest correlation was presented by Weight, WC, and TP, with values close to 0.9; HW, HW.Est, HC.Est, Vol, BL, and TP.Est remained with values between 0.8 and 0.6. The variables that showed the lowest correlation were BL.Est, WC.Est and HC, with values lower than 0.6.
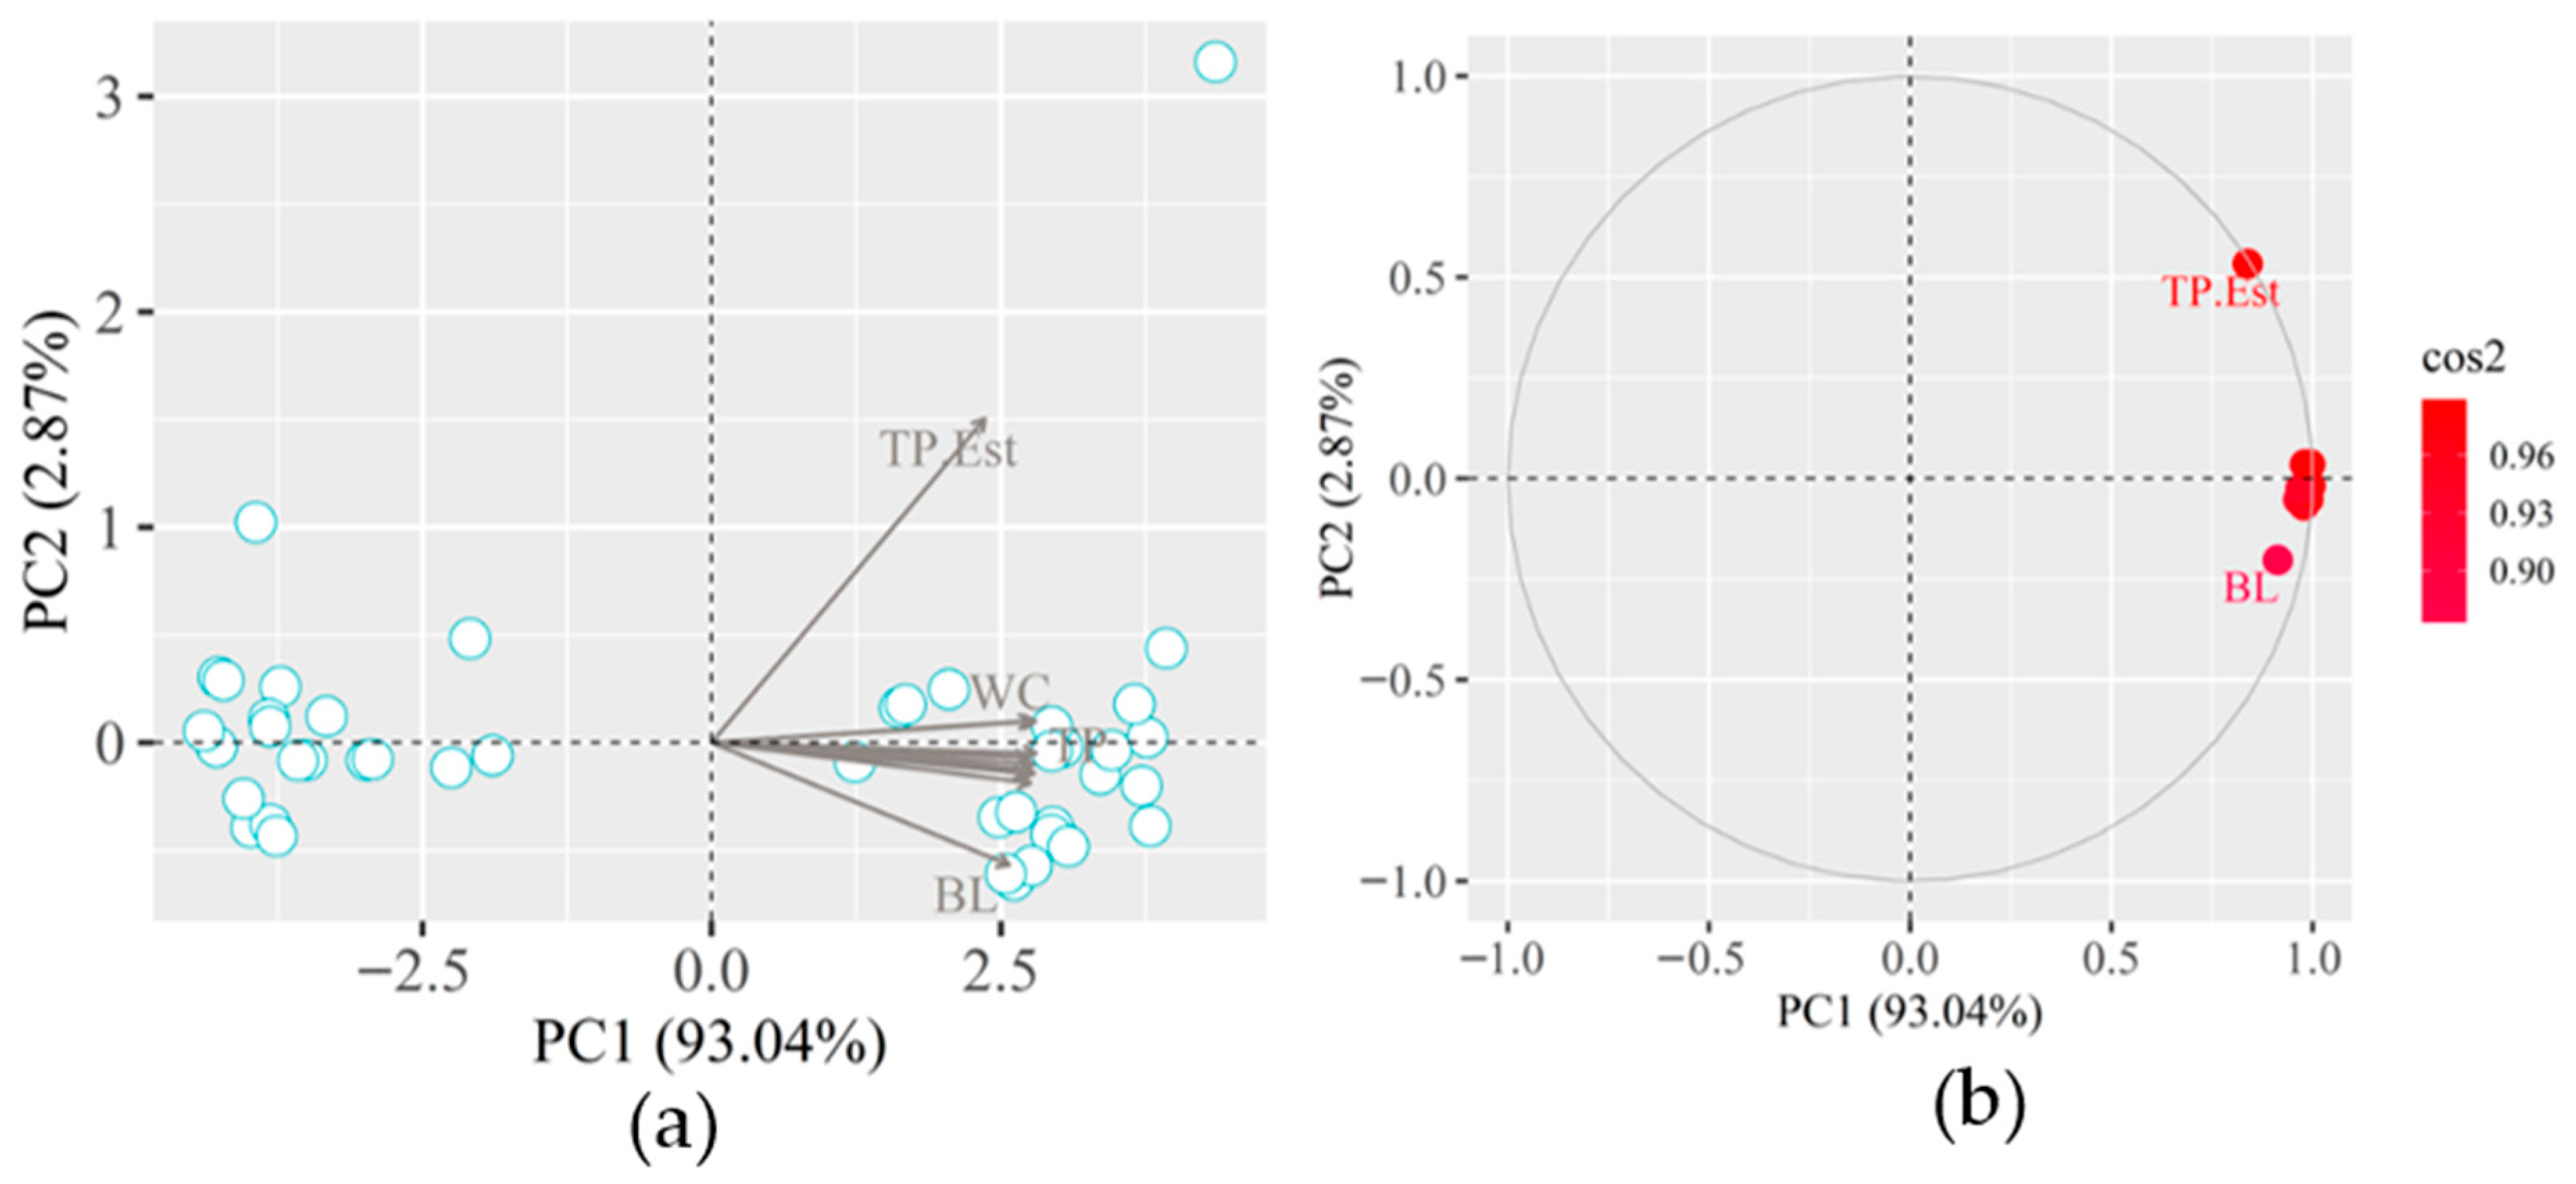
There is a tendency to divide the two groups in terms of the disposition of the animals (Figure 15a), which is probably related to the two breeding phases sampled.
The cumulative of PC1 (93.04%) and PC2 (2.87%) is equal to 95.91% of the existing correlation between the variables (Figure 15b), in this scenario it translates into the variance explained by PC1. The global set of variables presented an expressive cos2 that ranged from 0.90 to 0.96. The BL.Est was the variable that, despite having a high correlation, showed the lowest correlation, even close, while the TP.est, despite appearing further away from the sample group, presented a correlation close to 0.96. The methodology for measuring the actual length of the pig considers the measure from the tail to the snout, which is not possible through the mechanism used to extract information from the 3D images, considering the animal’s anatomy and the height difference between the tail part and of the head, thus causing technical damage. Ref. [28] found that body length (CA) and height at the withers (C) were estimated with R2 ranging from 0.91 to 0.98.
The high degree of correlation between all measurements considered shows that the combination of the two breeding phases makes the prediction more robust and that the real and estimated biometric measurements, as well as weight and volume, present a significant correlation that can be explored in systems automatic live weight prediction.
As found by [11] who used a depth camera to analyze the weight from images of pigs in the growth phase observed that the highest correlation was obtained between length and volume and width and volume (0.92).
Regression models and PCA are more consistent in the global sample, showing the importance of large sampling and representativeness of the researched scenario. In addition, multivariate analysis has been used efficiently in livestock research, relating live weight to biometric measurements of pigs [29].
The modified Xception model proposed by [30] achieved a mean absolute error (MAE) of 1.16 kg for body weight, whereas the authors [25] developed a model to estimate the live weight of pigs using dorsal surface point clouds through mathematical regressions, which resulted in a mean absolute error (MAE) of 2.96 kg. In contrast, the present study aimed to develop a simpler and more accessible procedure, utilizing a low-cost sensor (Kinect V2) and a computational approach of lower complexity, with a focus on opera-tional conditions feasible for animal production systems in semi-arid environments. Therefore, the observed differences in results can largely be attributed to the type of sen-sors, the complexity of the mathematical models employed, and the scale of the evaluated samples.
The present study was conducted in a controlled environment with individual pig passage, minimizing external interference and ensuring high-quality 3D image acquisition. Nevertheless, applying the method in more complex scenarios—such as high-density housing, occlusions, postural variations, and variable lighting—remains a challenge for validation and robustness. These conditions reflect commercial production systems, and their absence constitutes a relevant limitation. Future studies should assess the technique under such operational conditions. Further development could focus on enhancing point cloud acquisition and segmentation through more robust algorithms and alternative sensors capable of maintaining accuracy under variable lighting or reflective surfaces.

4. Conclusions

The linear coefficient of determination between weight and volume was 73.3%, 74.1%, and 97.3% for pigs in the growth, finishing, and global phases, respectively, indicating a positive relationship that satisfactorily reflects the animals’ weight. The relationship between the real and estimated biometric variables had a more expressive coefficient of determination in the global phase, having presented values between 77 and 94%.
The analysis of RMSE, MAE, and MAPE shows that the model’s accuracy varies by production phase, with greater absolute precision in the growth stage but higher relative error, and better relative performance in the finishing stage despite larger absolute errors. The GLOBAL dataset displayed greater variability, and comparison with previous studies suggests that methodological refinements could further improve performance.
The analysis of principal components helped in the analysis of the correlation between the variables, evidencing the reliability of the weight-volume relationship and the precision of the biometric measurements estimated through computational tools.
Current image analysis techniques are efficient for obtaining biometric measurements and live weight prediction that can be applied in rearing systems.

Author Contributions

N.F.G.: Conceptualization, Methodology, Validation, Formal analysis, Investigation, Data Curation, Writing—Original Draft, Writing—Review & Editing, Visualization, Supervision; M.V.N.d.M.: Investigation, Writing—Review & Editing; Supervision; M.E.G.d.O.: Investigation, Writing—Review & Editing; Supervision; G.L.P.d.A.: Writing—Review & Editing; Supervision; K.R.M.M.: Writing—Review & Editing; Supervision; T.C.S.: Investigation, Writing—Review & Editing; Supervision; H.P.: Conceptualization, Validation, Investigation, Data Curation, Writing—Original Draft, Writing—Review & Editing, Visualization, Supervision; M.V.d.S.: Conceptualization, Investigation, Writing—Review & Editing, Visualization, Supervision; J.P.S.d.M.L.: Conceptualization, Validation, Formal analysis, Data Curation, Writing—Original Draft, Writing—Review & Editing, Visualization, Supervision. A.P.M.d.C.: writing—review and editing. R.R.A.: writing—review and editing, Visualization, Supervision. M.M.: writing—review and editing, Visualization, Supervision. All authors have read and agreed to the published version of the manuscript.

Funding

This work was supported by the Conselho Nacional de Desenvolvimento Cientifico e Tecnologico (CNPq).

Institutional Review Board Statement

The conduction of the research was certified by the Comissão de Ética no Uso de Animais (CEUA) of the Universidade Federal Rural de Pernambuco (UFRPE), under protocol number 9693071021—ID 000921, by the precepts of Law 11,794 of 8 October 2008, Decree 6899 of 15 July 2009, by the rules issued by the Conselho Nacional de Controle da Experimentação Animal (CONCEA), approved by CEUA/UFRPE on December 2021.

Informed Consent Statement

Not applicable.

Data Availability Statement

The image database used in this experiment is publicly available at: https://drive.google.com/drive/folders/1Xn3AXyFItMOLowIsXlvi0D8hLILunaLQ?usp=drive_link, accessed on 1 September 2025.

Conflicts of Interest

The authors declare no conflicts of interest.

References

  1. Food and Agriculture Organization (FAO). The State of Food and Agriculture: Livestock in Balance; FAO: Roman, Italy, 2009; p. 180. [Google Scholar]
  2. ABPA—Associação Brasileira de Proteína Animal. Relatório Anual; Associação Brasileira de Proteína Animal: Sao Paulo, Brazil, 2022. [Google Scholar]
  3. Dawkins, M.S.; Roberts, S.J.; Cain, R.J.; Nickson, T.; Donnelly, C.A. Early warning of footpad dermatitis and hockburn in broiler chicken flocks using optical flow, bodyweight and water consumption. Vet. Rec. 2017, 180, 499. [Google Scholar] [CrossRef] [PubMed]
  4. Broom, D.M. Animal welfare: An aspect of care, sustainability, and food quality required by the public. J. Vet. Med. Educ. 2010, 37, 83–88. [Google Scholar] [CrossRef]
  5. Marinello, F.; Pezzuolo, A.; Cillis, D.; Gasparini, F.; Sartori, L. Application of Kinect-Sensor for three-dimensional body measurements of cows. In Proceedings of the 7th European Precision Livestock Farming, ECPLF, Milan, Italy, 15–18 September 2015. [Google Scholar]
  6. Jun, K.; Kim, S.J.; Ji, H.W. Estimating pig weights from images without constraint on posture and illumination. Comput. Electron. Agric. 2018, 153, 169–176. [Google Scholar] [CrossRef]
  7. Schofield, C.P. Evaluation of image analysis as a means of estimating the weight of pigs. J. Agric. Eng. Res. 1990, 47, 287–296. [Google Scholar] [CrossRef]
  8. Schofield, C.P.; Marchant, J.A.; White, R.P.; Brandl, N.; Wilson, M. Monitoring Pig Growth using a Prototype Imaging System. J. Agric. Eng. Res. 1999, 72, 205–210. [Google Scholar] [CrossRef]
  9. Marchant, J.A.; Schofield, C.P.; White, R.P. Pig growth and conformation monitoring using image analysis. Anim. Sci. 1999, 68, 141–150. [Google Scholar] [CrossRef]
  10. Ramaekers, P.J.L.; Huiskes, J.H.; Verstegen, M.W.A.; den Hartog, L.A.; Vesseur, P.C.; Swinkels, J.W.G.M. Estimating individual body weights of group-housed growing-finishing pigs using a forelegs weighing system. Comput. Electron. Agric. 1995, 13, 1–12. [Google Scholar] [CrossRef]
  11. Yu, H.; Lee, K.; Morota, G. Forecasting dynamic body weight of nonrestrained pigs from images using an RGB-D sensor camera. Transl. Anim. Sci. 2021, 5, txab006. [Google Scholar] [CrossRef]
  12. Li, Z.; Luo, C.; Teng, G.; Liu, T. Estimation of Pig Weight by Machine Vision: A Review. In Computer and Computing Technologies in Agriculture VII. CCTA 2013; IFIP Advances in Information and Communication Technology; Li, D., Chen, Y., Eds.; Springer: Berlin/Heidelberg, Germany, 2014; Volume 420. [Google Scholar] [CrossRef]
  13. Pandorfi, H.; Guiselini, C.; Almeida, G.L.P.; Silva, R.A.B.; Gomes, N.F. Suinocultura de precisão: Visão computacional e tecnologias digitais. Rev. Científica Produção Anim. 2020, 22, 73–79. [Google Scholar]
  14. Ji, X.; Li, Q.; Guo, K.; Ma, W.; Li, M.; Xu, Z.; Yang, S.X.; Ren, Z. A Machine Learning-Based Method for Pig Weight Estimation and the PIGRGB-Weight Dataset. Agriculture 2025, 15, 814. [Google Scholar] [CrossRef]
  15. Fernandes, A.F.; Dórea, J.R.; Fitzgerald, R.; Herring, W.; Rosa, G.J. A novel automated system to acquire biometric and morphological measurements and predict body weight of pigs via 3D computer vision. J. Anim. Sci. 2019, 97, 496–508. [Google Scholar] [CrossRef]
  16. Severo, A.M.; Weizenmann, G.D.S. Identificação da Massa de Suínos Utilizando Visão Computacional para Ajuste dos Parâmetros de Insensibilização. In Congresso Brasileiro de Automática—CBA; SBA: São Paulo, Brazil, 2020; Volume 2. [Google Scholar] [CrossRef]
  17. Kashiha, M.; Bahr, C.; Ott, S.; Moons, C.P.; Niewold, T.A.; Ödberg, F.O.; Berckmans, D. Automatic weight estimation of individual pigs using image analysis. Comput. Electron. Agric. 2014, 107, 38–44. [Google Scholar] [CrossRef]
  18. Wongsriworaphon, A.; Arnonkijpanich, B.; Pathumnakul, S. An approach based on digital image analysis to estimate the live weights of pigs in farm environments. Comput. Electron. Agric. 2015, 115, 26–33. [Google Scholar] [CrossRef]
  19. Kongsro, J. Estimation of pig weight using a Microsoft Kinect prototype imaging system. Comput. Electron. Agric. 2014, 109, 32–35. [Google Scholar] [CrossRef]
  20. Ma, Y.; Chen, X.; Zhang, W.; Zheng, L.; Gao, W.; Wang, M. An Approach of On-barn Pig Weight Estimation via 3D Computer Vision by Kinect V2. In 2020 ASABE Annual International Virtual Meeting; American Society of Agricultural and Biological Engineers: St Joseph, MI, USA, 2020; p. 1. [Google Scholar] [CrossRef]
  21. Silva, S.R.; Almeida, M.; Condotta, I.; Arantes, A.; Guedes, C.; Santos, V. Assessing the Feasibility of Using Kinect 3D Images to Predict Light Lamb Carcasses Composition from Leg Volume. Animals 2021, 11, 3595. [Google Scholar] [CrossRef] [PubMed]
  22. Kaiser, H.F. The varimax criterion for analytic rotation in factor analysis. Psychometrika 1958, 23, 187–200. [Google Scholar] [CrossRef]
  23. Nehrani, S.H.; Askari, M.S.; Saadat, S.; Delavar, M.A.; Taheri, M.; Holden, N.M. Quantification of soil quality under semi-arid agriculture in the northwest of Iran. Ecol. Indic. 2020, 108, 105770. [Google Scholar] [CrossRef]
  24. Condotta, I.C.; Brown-Brandl, T.M.; Silva-Miranda, K.O.; Stinn, J.P. Evaluation of a depth sensor for mass estimation of growing and finishing pigs. Biosyst. Eng. 2018, 173, 11–18. [Google Scholar] [CrossRef]
  25. Li, G.; Liu, X.; Ma, Y.; Wang, B.; Zheng, L.; Wang, M. Body size measurement and live body weight estimation for pigs based on back surface point clouds. Biosyst. Eng. 2022, 218, 10–22. [Google Scholar] [CrossRef]
  26. Ma, W.; Xu, Z.; Zhao, C.; Li, Q.; Ji, X.; Yang, S.; Ren, Z. Pig weight estimation using a movable top-mounted depth camera with improved EfficientNetV2. Smart Agric. Technol. 2025, 12, 101198. [Google Scholar] [CrossRef]
  27. Instituto de Tecnologia de Alimentos (TAL/CTC); da Silva Corrêa Lemos, A.L.; Yamada, E.A.; Silveira, E.T.F.; Gonçalves, J.R.; Neto, M.P.; Haguiwara, M.M.H.; Bromberg, R. Suínos: Abate, cortes e processamento na área rural. In Manual Técnico nº2, Campinas; Associação Brasileira de Criadores de Suínos: Brasília, Brasil, 1988; 59p. [Google Scholar]
  28. Shi, C.; Teng, G.; Li, Z. An approach of pig weight estimation using binocular stereo system based on LabVIEW. Comput. Electron. Agric. 2016, 129, 37–43. [Google Scholar] [CrossRef]
  29. Yakubu, A.; Durven, G.; Hagan, J. Multivariate analysis of body weight, morphometric and thermo-physiological traits of indigenous pigs under tropical conditions. Genet. Biodivers. J. 2022, 6, 91–104. [Google Scholar] [CrossRef]
  30. Zhang, J.; Zhuang, Y.; Ji, H.; Teng, G. Pig weight and body size estimation using a multiple output regression convolutional neural network: A fast and fully automatic method. Sensors 2021, 21, 3218. [Google Scholar] [CrossRef] [PubMed]
Figure 1. Methodological flowchart outlining the research development process and experimental workflow stages.
Agriengineering 07 00307 g001
Figure 2. South America (A); Pernambuco Mesoregions (B); Capoeiras hypsometry (C); Köppen classification (D); Geolocation of Roçadinho Farm (E).
Agriengineering 07 00307 g002
Figure 3. Software capture screen showing the empty chute (a); top view of the containment chute and demarcation of the image capture region (b).
Agriengineering 07 00307 g003
Figure 4. Image of Filizola electronic scale (a) and plastic measuring tape (b).
Agriengineering 07 00307 g004
Figure 5. Notebook running the SDK (Kinect Fusion Explorer): view of the 3D image capture window.
Agriengineering 07 00307 g005
Figure 6. Side (a) and front (b) views of the chute attached to the scale and the position of the Kinect attachment to the roof of the facility (red circle).
Agriengineering 07 00307 g006
Figure 7. Schematic of markings for manual measurements of pigs. 1—body length; 2—height at the withers; 3—thoracic perimeter; 4—height of the croup and; 5—croup width.
Agriengineering 07 00307 g007
Figure 8. Marking of points for calculating biometric measurements in the growth (a) and finishing (b) phases.
Agriengineering 07 00307 g008
Figure 9. Marking of the three pairs of points for the calculation of the thoracic perimeter in the growth (a) and finishing (b) phases.
Agriengineering 07 00307 g009
Figure 10. Application of the upper (a), lateral (b) cuts and the result of the application of the two cuts to define the pig’s body (c); Creation of the convex hoof with outliers in the image (d), marking and removal of the outliers (e) and creation of the convex hoof with the animal’s body without outliers (f).
Agriengineering 07 00307 g010
Figure 11. Graphic representation of the relationship between the live weight of pigs (Weight, kg) and Volume (m3) for the growth stages (a); finishing (b) and global (c).
Agriengineering 07 00307 g011
Figure 12. Graphical representation of estimated live weight through volume and actual live weight obtained through electronic scale for the global dataset.
Agriengineering 07 00307 g012
Figure 13. Principal components of the animals sampled in the growth phase related to the variables studied (a); correlation by principal components of actual and estimated biometric measurements related to live weight and volume of animals (b). BL: length (cm), HW: croup height (cm), WC: croup width (cm), HC: height at withers (cm), TP: thoracic perimeter (cm), BL.Est: estimated length (cm), HW.Est: estimated croup height (cm), WC.Est: estimated croup width (cm), HC.Est: estimated height at withers (cm), TP.Est: estimated thoracic perimeter (cm), Vol: volume.
Agriengineering 07 00307 g013
Figure 14. Principal components of the animals sampled in the finishing phase related to the variables studied (a); correlation by principal components of actual and estimated biometric measurements related to live weight and volume of animals (b). BL: length (cm), HW: croup height (cm), WC: croup width (cm), HC: height at withers (cm), TP: thoracic perimeter (cm), BL.Est: estimated length (cm), HW.Est: estimated croup height (cm), WC.Est: estimated croup width (cm), HC.Est: estimated height at withers (cm), TP.Est: estimated thoracic perimeter (cm), Vol: volume.
Agriengineering 07 00307 g014
Figure 15. Principal components of the animals sampled globally related to the variables studied (a); correlation by principal components of actual and estimated biometric measurements related to live weight and volume of animals (b). BL.Est: estimated length (cm), TP.Est: estimated thoracic perimeter (cm).
Agriengineering 07 00307 g015
Table 1. Analysis of variance (ANOVA) and results of regression coefficients for estimating the live weight of animals in the growth (CRESC), finishing (TERM) and GLOBAL phases.
Source of VariationDFSSMSF Valuep-Value
Regression—CRESC1218.929218.92946.57450.000
Error1879.91074.70063
Total19298.84
Regression—TERM11886.91886.963.00650.000
Error22658.8529.9477
Total232545.75
Regression—GLOBAL159,311.159,311.11503.980.000
Error421656.3139.4361
Total4360,967.4
DF: degree of freedom, SS: sum of squares, MS: mean square, CRESC: growth, TERM: termination, GLOBAL: junction of growth and finishing phases.
Table 2. Evaluation metrics (RMSE, MAPE, and MAE) for live weight prediction in swine across growth phases (CRESC, TERM, and GLOBAL).
MetricsPhases
CRESCTERMGLOBAL
RMSE2.74105.23956.1354
MAPE13.13214.561411.8823
MAE2.12064.25494.8981
Table 3. Regression equations for prediction and the coefficient of determination (R2) for croup height (1), length (2), croup width (3), height at withers (4) and thoracic perimeter (5) in the growth phase.
NumberingMeasuresCorrelation
Coefficient (R2)
Prediction Equation
1Croup height (cm)0.6604Y = 0.9118x + 5.7592
2Length (cm)0.4521Y = 0.3047x + 55.269
3Croup width (cm) 0.4023Y = 0.6203x + 5.729
4Height at withers (cm)0.4647Y = 0.6692x + 13.622
5Thoracic perimeter (cm)0.7614Y = 0.5055x + 32.677
Table 4. Regression equations for prediction and the coefficient of determination (R2) for croup height (1), length (2), croup width (3), height at withers (4) and thoracic perimeter (5) in the finishing phase.
NumberingMeasuresCorrelation
Coefficient (R2)
Prediction Equation
1Croup height (cm)0.3622Y = 0.4805x + 39.411
2Length (cm)0.0163Y = −0.0954x + 122.05
3Croup width (cm) 0.3053Y = 0.5795x + 10.918
4Height at withers (cm)0.4743Y = 0.7568x + 21.415
5Thoracic perimeter (cm)0.5240Y = 0.7505x + 34.798
Table 5. Regression equations for prediction and the coefficient of determination (R2) for croup height (1), length (2), croup width (3), height at withers (4) and thoracic perimeter (5) for the global.
NumberingMeasuresCorrelation
Coefficient (R2)
Prediction Equation
1Croup height (cm)0.9024Y = 1.1115x + 0.7065
2Length (cm)0.7794Y = 0.9142x + 18.958
3Croup width (cm) 0.9140Y = 0.9229x + 0.6869
4Height at withers (cm)0.9215Y = 1.2605x − 4.9734
5Thoracic perimeter (cm)0.9409Y = 1.2169x − 4.8936
Table 6. Analysis of variance (ANOVA) and results of regression coefficients for the ratio of real and estimated biometric variables of animals to global data.
Source of VariationDFSSMSF Valuep-Value
Regression—BL113,725.313,725.3148.3650.000
Error423885.4392.5103
Total4317,610.7
Regression—HW17783.27783.2388.5080.000
Error42841.40920.0336
Total438624.61
Regression—WC11572.271572.27446.4050.000
Error42147.9273.52207
Total431720.2
Regression—HC16477.496477.49493.1250.000
Erro42551.69413.1356
Total437029.18
Regression—TP122,556.622,556.6653.290.000
Erro411415.6434.5277
Total4223,972.3
DF: degree of freedom, SS: sum of squares, MS: mean square, BL: length (cm), HW: rump height (cm), WC: rump width (cm), HC: height at withers (cm), TP: thoracic perimeter (cm).
Disclaimer/Publisher’s Note: The statements, opinions and data contained in all publications are solely those of the individual author(s) and contributor(s) and not of MDPI and/or the editor(s). MDPI and/or the editor(s) disclaim responsibility for any injury to people or property resulting from any ideas, methods, instructions or products referred to in the content.