Abstract
The paper presents AgriMicro, a modern Farm Management Information System (FMIS) designed to help farmers monitor and optimize corn crops from sowing to harvest, by leveraging cloud technologies and machine learning algorithms. The platform is built on a modular architecture composed of multiple components implemented through microservices such as the weather and soil service, recommendation and alert engine, field service, and crop service—which continuously communicate to centralize field data and provide real-time insights. Through the ongoing exchange of data between these services, different information pieces about soil conditions, crop health, and agricultural operations are processed and analyzed, resulting in predictions of crop evolution and practical recommendations for future interventions (e.g., fertilization or irrigation). This integrated FMIS transforms collected data into concrete actions, supporting farmers and agricultural consultants in making informed decisions, improving field productivity, and ensuring more efficient resource use. Its microservice-based architecture provides scalability, modularity, and straightforward integration with other information systems. The objectives of this study are threefold. First, to specify and design a modular FMIS architecture based on microservices and cloud computing, ensuring scalability, interoperability and adaptability to different farm contexts. Second, to prototype and integrate initial components and Internet of Things (IoT)-based data collection with machine learning models, specifically Random Forest and XGBoost, to provide maize yield forecasting as a proof of concept. Model performance was evaluated using standard predictive accuracy metrics, including the coefficient of determination (R2) and the root mean square error (RMSE), confirming the reliability of the forecasting pipeline and validated against official harvest data (average maize yield) from the Romanian National Institute of Statistics (INS) for 2024. These results confirm the reliability of the forecasting pipeline under controlled conditions; however, in real-world practice, broader regional and inter-annual variability typically results in considerably higher errors, often on the order of 10–20%. Third, to present a Romania based case study which illustrates the end-to-end workflow and outlines an implementation roadmap toward full deployment. As this is a design-oriented study currently under development, several services remain at the planning or early prototyping stage, and comprehensive system level benchmarks are deferred to future work.
1. Introduction
Over the past decades, the agricultural sector has undergone a profound digital transformation which is still in process, fundamentally altering the way field activities are managed. From crop surveillance and input application to harvesting and administrative tasks such as human resource and financial management, digital tools now permeate every level of farm operations. Emerging technologies like the Internet of Things (IoT), artificial intelligence (AI), and cloud-based farm management systems have facilitated more precise monitoring, optimized resource utilization, and real-time, data-driven decision-making, ultimately enhancing operational efficiency across the agricultural value chain [1,2].
Recent literature confirms that small-scale farms continue to face critical structural constraints, such as limited access to land, capital, training, and technology [3].
Despite the potential advantages brought by agricultural digitalization, small and medium-sized farms frequently encounter substantial barriers to adopting these innovations. Common challenges include high upfront and maintenance costs and inadequate technological infrastructure, both of which may exceed the financial or logistical capacity of farmers. Additionally, limited digital literacy and a general lack of awareness regarding the benefits these technologies can deliver further hinder adoption. Recent research underscores these issues, emphasizing the urgent need for targeted policies and support frameworks that can facilitate digital adoption within this vulnerable segment of the farming community [4].
To address these obstacles, an architectural approach based on microservices and cloud technologies is proposed. This approach enables the development of modular, scalable, and easily maintainable systems that can be adapted to the particular needs of individual farms [5]. By decoupling functional components, microservices allow for more granular control of agricultural processes such as irrigation and fertilization, resulting in more efficient use of resources and reduced operational costs [6]. Furthermore, the integration of IoT devices and machine learning techniques supports real-time data collection and analysis, equipping farmers with essential insights to inform their decisions.
Within this context, the present paper introduces the design and development of a Farm Management Information System (FMIS) tailored primarily for small and medium-sized farms, while remaining scalable for larger agricultural operations. The proposed system is built on a microservice-oriented architecture and uses cloud technologies, enabling core functionalities such as production tracking, inventory management, yield forecasting, weather analysis, and environmental monitoring through sensor networks—all designed to deliver customized, data-driven recommendations for farm management.
In contemporary agriculture, a comprehensive understanding of the crop growth cycle is critical for effective planning and timely intervention. Each phenological stage has distinct requirements regarding inputs, environmental conditions, and agronomic actions. Aligning farm activities with the specific needs of the plant at each stage can significantly influence the final yield. As a result, an FMIS must not only collect and process field data but also provide actionable insights to support decision-making throughout the cultivation process.
To demonstrate this approach, the study focuses on maize, one of the most significant crops in Romanian and European agriculture, and a strong candidate for digital technology adoption. Maize was selected as the focus crop due to its economic prominence and data richness. At global level, maize is cultivated on millions of hectares, with extensive agronomic and phenological data available, making it a reference crop for machine learning-based yield modelling and FMIS implementation. In Romania, maize holds a particularly important role, representing one of the largest shares of cultivated cereals both in terms of sown area and production volume.
The maize production cycle involves several distinct phenological stages, each with specific environmental needs, resource requirements, and technological interventions. By integrating these stages into an FMIS, it becomes possible to monitor crop development in real time, deliver automated recommendations, and enable proactive actions data.
Figure 1 illustrates a Gantt chart representing the annual phenological stages of maize cultivation. In the proposed FMIS, each stage is supported by dedicated functional modules, with one or more specialized microservices managing specific phases. A centralized component provides an overarching view of the entire cultivation process, enabling coordinated decisions that enhance productivity.
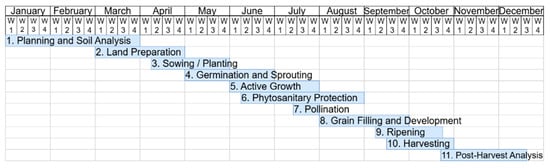
Figure 1.
Phenological development stages in maize cultivation.
The objective of this paper is to present the design and functionalities of a modular, cloud-native FMIS that integrates microservices, IoT technologies, and machine learning, specifically tailored for maize production. Once fully implemented, the platform will support real-time data acquisition, advanced analytics, and predictive decision-making, addressing the operational needs of small and medium-sized farms.
The main contributions of this study can be summarized as follows:
- Design and specification of a modular FMIS architecture based on distributed microservices and centralized cloud technologies, ensuring scalability, interoperability, and adaptability.
- Prototype implementation of core modules integrating IoT-based data collection and machine learning models (Random Forest, XGBoost) for yield forecasting.
- Case study demonstration on maize cultivation in Romania, covering the data flow from acquisition to prediction, and validating the forecasting pipeline.
- Implementation roadmap highlighting how the platform can be extended to additional modules and phenological stages, overcoming gaps in current FMIS solutions.
The remainder of the paper is organized as follows: Section 2 describes relative work, Section 3 presents the overall system architecture, describing each layer from field-level sensors to cloud-based services. Section 4 covers the processes of data acquisition, structuring and management, highlighting modularity and interoperability. Section 5 introduces the analytical and predictive components, along with the methodology planned for system evaluation. Section 6 reports on preliminary experimental results obtained through case study implementation. Finally, Section 7 concludes the paper with a summary of key findings and outlines potential directions for future research.
2. Related Work
Over the last two decades, the process of digital transformation in agriculture has accelerated, leading to the development of FMIS which combines hardware, software and cloud services to support decision-making in multiple fields (e.g., crops and livestock production). Early FMIS solutions were often stand-alone desktop applications with limited interoperability and little capacity for data integration. Along with the emergence of cloud computing, IoT and artificial intelligence, more advanced platforms have been developed and implemented that enable real-time monitoring, multi-source data integration, etc. Today, both large agri-tech corporations and specialized startups are actively promoting digital platforms as part of the precision agriculture paradigm.
Surveying current market solutions, the platforms that have emerged as de facto references include John Deere Operations Center, Climate FieldView and xFarm.
The John Deere Operations Center is among the most widely adopted FMIS platforms worldwide. It integrates data from tractors, combines and other agri-equipment into a unified cloud-based environment, with a strong focus on machinery fleet management, yield mapping and field operations logging. While it is powerful for highly mechanized farms, its functionalities remain strongly tied to John Deere equipment and machinery-centric workflows, which limits openness and interoperability with third-party devices. In contrast, the present work shifts the focus toward data-centric farm management, focus on interoperability with heterogeneous IoT sensors, integration of soil and weather data, and modular machine learning services for predictive analytics [7].
Climate FieldView (Bayer) is a digital agriculture platform that leverages IoT devices (e.g., the FieldView Drive), satellite imagery and machine learning to provide field-level monitoring and analytics. From a technical standpoint, Climate FieldView is implemented on Amazon Web Services (AWS) and reportedly comprises over 180 services. Despite its robustness, FieldView remains a subscription-based, proprietary solution that is tightly integrated into Bayer’s ecosystem, with limited flexibility for custom integration and high costs for long-term adoption by small and medium sized farms [7,8].
xFarm is a European FMIS that provides farmers with mobile and web applications for monitoring and managing agricultural operations. Although it also integrates IoT sensors and weather data, it predominantly centres on supporting operational tasks and machinery-related management for farms. While successful in terms of adoption (>300,000 farmers across 100 countries), xFarm remains a proprietary platform with limited openness for integrating external services or custom analytics. By contrast, AgriMicro is conceived as an open, research-driven architecture that prioritizes modularity, interoperability and extensibility, enabling the possibility incorporation of additional data sources, APIs and predictive models [8,9].
Overall, commercial FMIS platforms demonstrate significant maturity but remain largely machinery-oriented and tied to proprietary ecosystems. Their adoption is strongest in highly mechanized regions, but cost structures, vendor lock-in and limited openness reduce their accessibility for small and medium farms, particularly in developing countries [9,10].
Adoption also shows a strong geographical bias, being concentrated in highly mechanized regions of North America and Western Europe, with limited penetration in developing regions where digital agriculture is most needed.
In addition to commercial systems, academic research has proposed several conceptual and experimental FMIS architectures. For example, Kruize et al. [11] introduced a reference architecture for farm software ecosystems, highlighting interoperability across heterogeneous ICT systems.
The present work introduces AgriMicro, a microservices-based FMIS that aims to address these limitations by combining the robustness of commercial platforms with the openness and adaptability required for broader adoption. Unlike proprietary solutions, AgriMicro is designed to integrate heterogeneous IoT devices and to expose prediction and recommendation functionalities through modular microservices. The system is conceived for deployment in flexible cloud environments, without being dependent on a specific provider. This allows the platform to run on cost-effective public clouds, which are particularly suitable for small and medium sized farms or on private clouds when institutional or cooperative infrastructures are available.
This flexibility reduces costs and avoids vendor lock-in. Also, the modular architecture ensures that new services can be added without structural modifications, and the machine learning component is encapsulated as an independent microservice. This makes it possible to replace or extend prediction models as better algorithms or larger datasets become available. In this way, AgriMicro positions itself as a flexible and cost-effective FMIS architecture.
Moreover, the presented design is anchored in the context of small- and medium-sized farms—numerous in Romanian agriculture—providing a concrete use case where affordability and adaptability are critical. Although our validation remains preliminary, the proposed architecture represents a step forward by combining modular design with a real-world application scenario.
Figure 2 highlights the increasing reliance of the agricultural sector on global cloud providers.
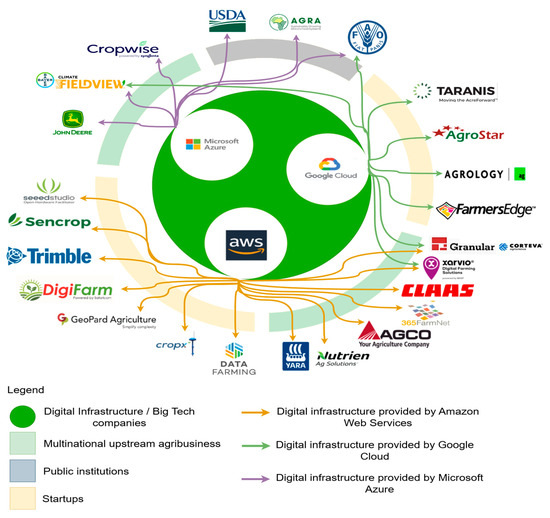
Figure 2.
Cloud provider dependencies in digital agriculture.
Major platforms, including those developed by multinational agribusinesses (e.g., John Deere, BASF, Syngenta) and agri-tech startups (e.g., CropX, Taranis), are hosted on AWS, Microsoft Azure or Google Cloud. This illustrates not only the technological convergence of the industry, but also the growing risk of vendor dependence, as digital agriculture becomes closely tied to a small number of infrastructure providers. While this concentration facilitates scalability and interoperability at global scale, it also raises questions regarding affordability, data sovereignty and long-term sustainability for small and medium farms in developing regions.
3. Overall System Architecture
The FMIS described in this work is built on a distributed architecture leveraging microservices, cloud computing, and IoT technologies. This design was selected in response to the complexity of managing diverse sensor types, information, real-time data flows, and functional modules requiring flexibility and scalability. Conventional monolithic architectures proved insufficient for this use case, as they limit extensibility and hinder modular development. In contrast, the microservice-based model breaks the system into independent, task-specific services that can be individually developed, deployed, and scaled without affecting the overall operation.
Communication between microservices is facilitated through RESTful APIs and asynchronous messaging protocols, depending on the nature of the interaction. Each service is containerized using Docker to ensure isolation and consistent execution environments. These containers are managed and orchestrated by Kubernetes, which enables automated scaling, high availability, and balanced workload distribution across the infrastructure. Kubernetes also monitors system metrics such as CPU and memory usage and can dynamically allocate resources to maintain optimal performance under varying loads [12].
The FMIS architecture adopts a layered design that spans from in-field sensors to cloud-based analytics, following an Edge–Fog–Cloud deployment model. At the base lies the perception layer, which includes sensors and actuators for capturing soil, crop, and environmental data [13]. These data streams pass through a middleware layer that acts as an intermediary, buffering and organizing information to manage latency and ensure data quality. At the top, the application layer hosts cloud-deployed microservices responsible for analysis, optimization, decision-making and recommendation (Figure 3). This separation between physical data collection and cloud services ensures scalable, modular, and responsive farm management capabilities.
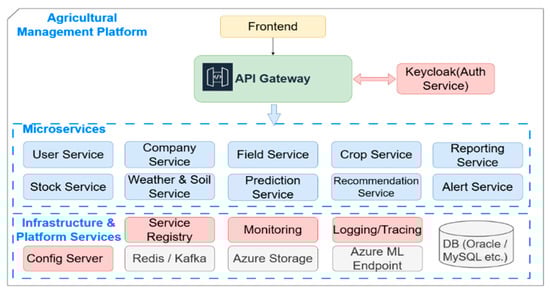
Figure 3.
Overall architecture of the FMIS.
The overall system layout is depicted in Figure 3, which illustrates the core architectural components of the FMIS. These include the user interface, the authentication and authorization service (Keycloak), the API Gateway, a suite of functional microservices, and auxiliary infrastructure components for configuration, monitoring, and data storage.
The system includes a specific authentication and authorization module, named as Auth Service in Figure 3, to guarantee safe and expandable access control. The module’s base is Keycloak, a centralized Identity Provider (IdP) in charge of managing user identities and enforcing granular access controls. Only authenticated clients are granted permission to access internal services via the API Gateway, which was designed with Spring Cloud Gateway and verifies the validity of JWT tokens issued by Keycloak. It also applies security filters to all incoming requests. TLS/SSL protocols are used to encrypt all data transfers between devices and cloud services, and GDPR and other relevant data protection laws are followed while managing personal data.
A custom role-based access control structure was defined within Keycloak, introducing user roles (based on the privileges of “admin” or some other type of “user”) each mapped to specific service-level permissions. These roles are enforced through token scopes and validated within the backend logic of the respective microservices, ensuring controlled and differentiated access across the FMIS.
The FMIS is developed using different modern technologies from the Spring Cloud ecosystem, which provides essential infrastructure support for distributed systems. It includes a service registry for microservice discovery (e.g., Eureka), centralized configuration management through Spring Cloud Config Server, and a complex suite of observability tools. System health and performance metrics are monitored using Prometheus and Grafana, while distributed tracing capabilities are integrated to track service interactions and diagnose performance bottlenecks across the microservices architecture [14,15].
Deploying the design on a cloud infrastructure (like Microsoft Azure) gives the FMIS built-in scalability, high availability, and remote accessibility. The system’s analytical and predictive modules may receive continuous streaming of sensor data, including soil temperature, pH, and humidity, thanks to integration with Azure IoT Hub. This facilitates real-time agricultural operations decision-making. The system’s modular design makes it simple to add other data sources in the future, including drone-based imaging, satellite imagery, or intelligent agricultural equipment, without requiring structural adjustments. As a result, the FMIS may be easily expanded, integrated, and modified to meet the changing requirements of contemporary digital farms [16].
Before presenting the technical details of each microservice, we provide in Figure 4 a high-level overview of the AgriMicro architecture. This diagram highlights the conceptual interactions between the core services (Weather & Soil, Crop, Field, Prediction, Recommendation, Alert, Reporting) and their connection with the FMIS Cloud Database. External users and applications interact through the API Gateway, while service discovery and message queues coordinate the internal communication between services. The purpose of this overview is to offer readers a clear picture of how the components fit together within the Edge–Fog–Cloud framework, facilitating the subsequent detailed description of each module.
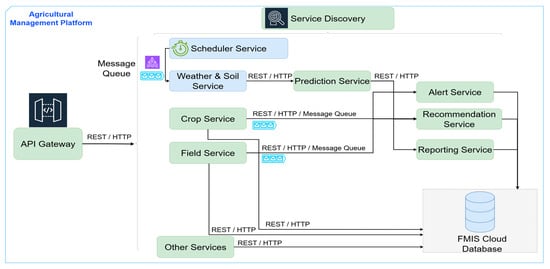
Figure 4.
Conceptual diagram of inter-service connections in the AgriMicro FMIS.
4. Data Structure and Collection Method
The FMIS is designed with a modular data architecture that reflects the diversity of agricultural information and farm operations. Each core function such as data collection, analysis, and forecasting is handled by a dedicated microservice, aligning with standard IoT architectural models for smart farming systems [17]. This modularity supports independent evolution of each component while enabling seamless interoperability between system modules and external agricultural platforms. Communication interfaces are also included to facilitate integration with third-party services and broader agri-tech ecosystems.
This design approach makes it possible for each form of data, whether it be financial data, administrative records, soil parameters, or environmental sensor readings, to be handled by the appropriate specialized module. Application-level modules that address particular farming operations like irrigation, fertilizer, pest management, or livestock monitoring are made possible by the system’s division of business domains into agricultural sub-domains [16,17]. These application services convert raw sensor inputs into useful insights for farm decision-making by running on top of a shared infrastructure for data acquisition and storage.
In terms of data storage and organization, the presented architecture uses dedicated repositories for each data type. To maintain backups and for long-term analytics, historical documents are kept in distinct archives. In order to train prediction models and produce more precise yield estimates and agronomic suggestions, these historical datasets are also essential.
Overall, the FMIS cloud database is structured to reflect real-world farm operations in a scalable and modular way. It revolves around key agricultural entities such as users, farms, plots, crops, inputs, environmental data, predictions, and alerts. This structure facilitates both administrative tracking and deep agronomic analysis, forming the foundation for informed, data-driven decisions in the farming process.
4.1. Modular Data Structure
The FMIS adopts a microservice-oriented structure, in which each service is logically separated and responsible for managing a specific domain of agricultural data. These domains include user profiles, land parcels, crop records, resource inventories, and environmental parameters (soil and weather conditions). This architectural approach aligns with contemporary design principles, enabling a decoupled system where each microservice functions as an independent process with clearly defined responsibilities, minimal interdependencies, and limited reliance on centralized coordination [18].
A simplified segment of the relational cloud database schema is illustrated in Figure 5, highlighting the core entities used for environmental monitoring, crop tracking, and yield prediction. The Field Service manages the registration and geospatial definition of agricultural plots, using attributes such as area of the fields, soil type, GPS coordinates, and field boundaries. Crop data are maintained by the Crop Service, which links each cultivated plot to seasonal information such as crop type, planting and harvest dates, and associated input usage [19].
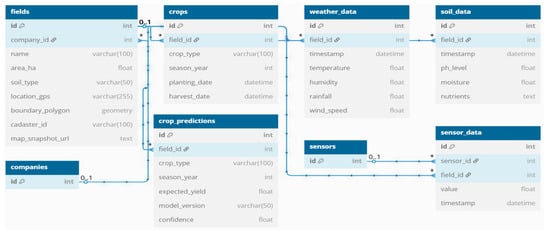
Figure 5.
Simplified relational database schema designed for the FMIS.
Environmental parameters are collected and managed through the Sensor & Data Collection Service, which records time-stamped measurements in the sensor_data table. Complementary weather and soil indicators, for example temperature, humidity, rainfall, pH levels, and soil moisture are handled by the Weather & Soil Service, which saves the data in dedicated tables. This service aggregates localized sensor readings together with external data sources (for example public weather stations or public APIs), to construct a comprehensive, up-to-date model of environmental conditions for each registered plot [18].
The Prediction Service is responsible for integrating historical and real-time data to estimate expected crop yields. The service uses processed inputs from the Weather & Soil Service and historical production records to generate yield forecasts. The results are stored in the crop_predictions table that includes data about the estimated yield, model version, and confidence score. These outputs serve as the foundation for downstream components in the FMIS as recommendation, alert services and others, which transform predictive insights into actionable guidance for farmers [20].
A modular and domain-specific microservice architecture is used by the FMIS to improve system robustness and agility. Each service can grow, change, or be replaced separately thanks to this design, which does away with the strict dependencies that characterize monolithic systems. Without affecting already existing components, the system may adapt to new data types or functionality as they are introduced, such as integration with aerial images or sophisticated forecasting algorithms. Precision agriculture’s flexible, future-ready decision-making framework is supported by this modular separation, which guarantees consistent and effective data flows [21,22].
4.2. Data Collection and Processing Flow
Using a dispersed network of sensors placed throughout the farm, raw field data are gathered. These sensors monitor a number of agro-environmental factors including temperature, precipitation, light intensity, and soil moisture. To guarantee continuous monitoring, sensor readings are taken at regular intervals of 15 to 60 min in the experimental setup. The main gathering point is a central gateway (IoT aggregation node), to which data from sensor nodes is wirelessly sent via LoRaWAN [23,24]. Especially for small to medium-sized plots, this communication solution was chosen due to its ease of setup and compatibility with existing infrastructure.
The use of LoRaWAN for sensor data transmission addresses the key requirements of smart agriculture applications in maize cultivation, particularly regarding coverage, energy efficiency, and scalability. LoRa ensures communication ranges up to 15–20 km in rural areas, which makes it possible to monitor entire maize plots of tens of hectares using only a few gateways. Its ultra-low power consumption allows battery-powered sensors to operate continuously throughout the maize phenological cycle (from sowing to harvest) without replacement. This long autonomy is critical since sensors deployed in open fields are often exposed to mechanical operations such as ploughing, when frequent maintenance or wiring would be impractical. By supporting a topology where hundreds of nodes (up to 1500–2000 nodes) can be connected to a single gateway, LoRaWAN enables dense sensor deployments [25,26].
When compared with other communication solutions, the advantages of LoRa in maize farming are evident. Wi-Fi is constrained to short distances (20–50 m) and consumes too much energy to be viable for large fields. ZigBee is energy-efficient but covers only 10–100 m per hop, being better suited for greenhouses than for open-field maize plots. 4G/LTE networks provide city-wide coverage but rely on SIM cards, recurring fees, and medium-to-high energy use, making them costly and less sustainable for hundreds of distributed sensors. In contrast, LoRa combines kilometre-scale coverage with very low power consumption and the possibility to build private farm networks at minimal costs, which is decisive for long-term deployments in maize cultivation [24,25].
Table 1 compares in terms of coverage, power, cost and suitability the communication technologies mostly used in applications in which amounts of data are transmitted from smart sensors over significant distances with reduced energy consumption.

Table 1.
Comparative analysis of communication technologies.
The adopted architecture groups maize field IoT sensors into communication nodes equipped with embedded microcontrollers (MCUs). Each node collects multiple parameters relevant to maize growth and transmits the values via LoRa modules. Typical energy consumption during active transmission is in the range of 25–100 mW, which enables batteries to last for an entire phenological cycle of maize without replacement. An IoT gateway installed at farm level aggregates the sensor data and stores them first in a local buffer database (Figure 6 top), which ensures reliability and prevents data loss in case of temporary connectivity interruptions [25,26].
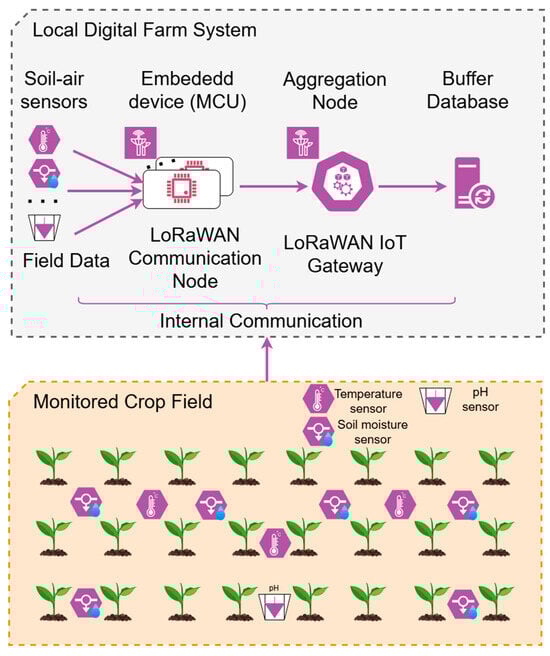
Figure 6.
Field sensor distribution and Local Farm System communication.
We considered a 1-hectare monitoring area (≈100 × 100 m). Sensor deployment follows a variable-density strategy tailored to the spatial dynamics of each parameter. Soil moisture sensors are placed at the highest density (e.g., ≈20 m spacing; ~20–25 units/ha) to capture strong micro-variability and support for irrigation scheduling. Temperature sensors are spaced more sparsely (e.g., ≈30–40 m; ~8–12 units/ha), as air/soil temperature gradients are smoother over short distances. Soil pH is monitored at the lowest density (e.g., ≈50–70 m; ~2–4 units/ha), reflecting its greater temporal and spatial stability. For planning, the hectare can be partitioned into grid cells matching these spacings (e.g., moisture 20 × 20 m; temperature 33 × 33 m; pH 50 × 50 m). This unbalanced distribution will be used to optimize the accuracy and cost trade-off by prioritizing dense sampling for highly dynamic variables while sampling stable variables efficiently.
To support modularity and scalability, the AgriMicro platform follows an Edge–Fog–Cloud architecture, where responsibilities are clearly divided across three layers. The Edge layer is responsible for on-site sensor data acquisition, the Fog layer provides communication and buffering close to the field, and the Cloud layer ensures validation, integration, and advanced analytics. This layered design allows the system to reliably capture raw data in real time, safeguard it during transmission, and process it into actionable insights for farmers. The specific roles of each layer are detailed below:
- Edge layer (Local Farm System): dedicated to raw data acquisition from the field-level IoT infrastructure. This includes soil sensors (moisture, temperature, pH) and weather sensors (air temperature, humidity, etc.). At this level, the primary task is capturing measurements at high temporal resolution and transmitting them without modification. Example: a soil moisture probe records volumetric water content every 15 min and sends the raw value forward.
- Fog layer (Intermediate processing): represented by the internal communication module (LoRaWAN) and the buffer database. This layer ensures reliable data transmission and temporary storage close to the field, reducing data loss during connectivity interruptions and decoupling sensor data rates from cloud ingestion capacity. Example: in case of intermittent network coverage, sensor readings are stored in the buffer database and forwarded to the Cloud once connection is reestablished (via the Scheduler Service).
- Cloud layer (FMIS Infrastructure): responsible for data validation, normalization, long-term storage, and advanced analytics. Here, the weather & soil service processes incoming raw data, applies consistency checks and unit normalization, and feeds downstream modules. Machine learning services perform yield prediction (Random Forest, XGBoost), while the alert service generates warnings (e.g., drought risk), and the recommendation engine provides actionable advice (e.g., irrigation scheduling or fertilization timing). Example: soil moisture trends combined with 7-day weather forecasts trigger an irrigation recommendation through the Cloud-based alert and recommendation services.
Scalability is supported by the distributed, microservice-based architecture of AgriMicro. Each service can be independently deployed and scaled horizontally in the cloud, allowing multiple instances to run in parallel. This ensures that, as the number of sensors or users increases, the system can handle the additional workload by adding more service replicas without the need for costly vertical scaling. Buffering mechanisms at the Fog layer further decouple data ingestion from cloud processing capacity, enabling the platform to absorb temporary spikes in data flow and maintain stable performance. Together, these design choices provide a practical path toward large-scale deployment across diverse farm contexts.
Secure data transfer to the FMIS is made possible by the gateway which compiles the received data and uses an internet connection to pass it to a temporary local buffer database. At the gateway or edge-device level, local data buffering is also used to enable real-time responsiveness in situations with spotty or restricted connectivity. This improves system resilience by separating data collection from later processing operations and guaranteeing data persistence even during network disruptions [21].
At regular intervals, an automatic service defined as a scheduler (Spring Scheduler module presented in Figure 7) gets new datasets from the temporary buffer database. The system filters data, normalizes and standardizes heterogeneous formats received from various sensor types as part of this initial processing step. Before the incoming data stream is further used in analytical workflows, this guarantees consistency and quality throughout [21].
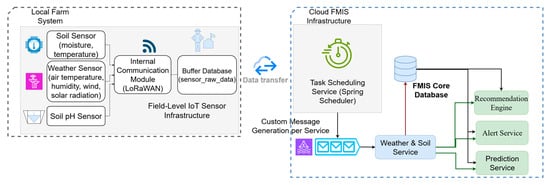
Figure 7.
Sensor data acquisition and integration flow diagram within the FMIS.
The Weather & Soil microservice receives the pre-processed data via a message queue and uses it to update the central FMIS database with the latest environmental measurements. A real-time picture of field conditions is continuously maintained by this service which includes variables like cumulative precipitation, air and soil temperatures, and soil moisture at different depths [22].
Although Wi-Fi offers simplicity for small and medium-sized fields, it has a number of limitations, such as short communication range, higher energy consumption, and increased susceptibility to interference. For this reason, in the present implementation we propose LoRaWAN connectivity as the baseline technology, benefiting from wider coverage and more robust security features. Nevertheless, the platform is designed to remain technology-agnostic: other communication standards such as LoRaWAN, NB-IoT, or even 5G can be integrated seamlessly on the local farm system depending on farm size, infrastructure, and cost considerations, see Figure 7.
Practical implementations further reinforce LoRaWAN’s suitability for agriculture. For instance, the authors of [27] prove that a 22-hectare olive grove was successfully managed using a LoRaWAN-based IoT platform for smart irrigation, showcasing its scalability, remote operability, and adaptability to large-scale monitoring scenarios. Similar results have been reported in fruit orchards, where LoRaWAN networks enabled the long-term monitoring of soil and microclimate conditions with minimal infrastructure and energy costs [28]. These experiences from perennial crops such as olives and orchards underline the robustness of LoRaWAN in rural areas and provide strong arguments for its applicability in seasonal crops like maize, where large plots and dispersed sensors require identical communication performance.
The Prediction, Recommendation, and Alert microservices use the environmental data that has been integrated to assist in agricultural decision-making. In order to produce forecasts, the Prediction Service uses agronomic algorithms and machine learning models to analyze historical and real-time data from the Weather & Soil module. The system can forecast future crop yields, evaluate the danger of disease outbreaks, and predict irrigation requirements based on time series like temperature and soil moisture. This strategy adheres to accepted practices in smart agriculture, where proactive crop management tactics are made possible by the combination of IoT data and predictive analytics [27].
To provide farmers with practical guidance, the Recommendation Service expands on existing environmental observations and prediction results. The system provides recommendations for crop selection based on soil properties and plot histories, modifications to work schedules based on weather conditions, and suggestions on the best times for fertilization or irrigation by fusing machine-generated forecasts with agronomic principles. Farmers are able to make better operational decisions and assist strategic planning with the use of these data-driven insights [29].
In order to identify irregularities or crucial thresholds that need to be addressed right away, the Alert Service continuously analyzes both incoming sensor data and prediction results. Alerts are automatically triggered by the system if specific data, including soil moisture levels or predicted temperatures, exceed predetermined safety limits. Based on the setup and urgency, users can receive these notifications by SMS, email, or in-app messages. Rapid reactions to dangers like drought, frost, or pest outbreaks are made possible by this real-time event detection method, which also complies with IoT-enabled agriculture best practices for preserving crop health and lowering risks [29,30].
The FMIS converts unprocessed sensor data into useful information and tangible operational choices through the Prediction, Recommendation, and Alert services. Within the farm ecosystem, the complete data pipeline—from wireless transmission and sensor-level gathering to automated preprocessing and temporary buffering to real-time analytics and decision support—forms an integrated digital workflow. By enabling quick reactions to shift circumstances and guaranteeing that choices are based on up-to-date, scientifically supported information, this microservice-based design makes intelligent farm management possible [31].
The main elements involved in collecting, verifying, and using field data are delineated in Figure 7, which depicts the entire data collection and processing loop. It records the exchanges between sensor nodes, gateway connectivity, scheduling, data buffering, and the FMIS’s shift to analytical microservices.
The Weather & Soil microservice’s internal data input process is shown in Figure 8. The Task Scheduling Service starts the process by automatically retrieving newly buffered data from the temporary database every 15 min. This scheduler, which is implemented using Spring Boot’s Scheduled Service, manages the ingestion workflow by producing structured messages that are sent to the Weather & Soil service’s controller layer, where they start validation and additional processing.
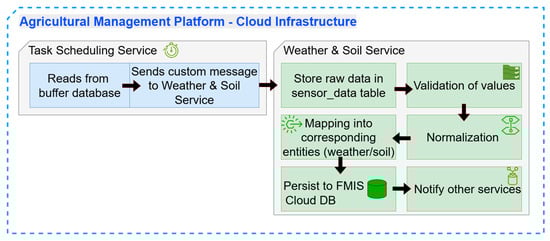
Figure 8.
The Weather & Soil microservice’s sequential data input and processing workflow.
When raw sensor inputs are received by the Weather & Soil microservice, they are initially saved in the sensor_data table for complete traceability and as backup in case of system failures or processing problems. As a safety precaution, this raw storage keeps original data records that can be reprocessed if necessary. The data undergoes a number of transformation processes in the service layer to guarantee quality and consistency following initial persistence.
The processing pipeline applies a number of transformation stages to guarantee data consistency and integrity:
- Validation: Every record is examined for irregularities, such as missing vital variables like pH or values that are out of range (such as temperatures below −30 °C or over 50 °C).
- Normalization: Unit conversions (such as Fahrenheit to Celsius) are applied as needed, and time values are matched to regular intervals.
- Mapping: After data has been verified and normalized, it is mapped to internal entities called WeatherDataEntity and SoilDataEntity that satisfy downstream services’ needs and match the target database tables’ structure.
- Persistence: To facilitate effective retrieval and analytical querying, the processed entities are lastly saved in the corresponding tables (weather_data and soil_data) using JPA repositories.
Data anomalies (e.g., sensor outages, erroneous values) are handled using basic range validation, timestamp checks, etc. More advanced imputation methods will be considered in future development.
The Weather & Soil microservice’s data ingestion architecture was created with scalability, resilience, and adaptability in mind. The system guarantees total traceability and facilitates rollback or reprocessing as necessary by keeping raw and processed data storage separate. Fault tolerance is provided by the validation and transformation pipeline, which lessens the effect of inaccurate or partial sensor readings. Additionally, near real-time responsiveness is made possible using event-based communication across services, which enables downstream modules, like prediction and alarm systems, to respond quickly to changing field circumstances. As a robust fundamental component of the FMIS, this architecture strengthens the system’s capacity to grow and adjust to changing data volumes and sensor networks.
5. Analysis and Prediction Module
The Analysis and Prediction module, which offers projections for crop production and other agronomic outcomes, is essential in assisting with strategic agricultural decisions. A specialized Prediction Service within the FMIS is used to carry out this role, producing yield predictions using machine learning (ML) techniques, namely XGBoost and Random Forest. Historical yield records, soil and weather data, and operational data gathered during the cultivation cycle are all used in these models [31,32].
Historical crop performance, pedological characteristics like soil pH and moisture, and climatic indicators like temperature, rainfall and humidity are a few of the data sources that the prediction engine incorporates. Specialized services within the FMIS preprocess and store these inputs, guaranteeing that the data is clean, organized, and constantly accessible for model execution [31,33].
We selected Random Forest and XGBoost as the core ML methods because tree-based models capture non-linear relationships and complex feature interactions in structured/tabular data, deliver strong accuracy on small to medium datasets with fast training and inference, are comparatively robust to noise, missing values, and outliers. It also offers interpretability via feature-importance analysis. Compared with deep learning, they typically require less data and hyperparameter tuning and are more resource efficient, which is important in operational settings. Within this family, XGBoost (gradient boosting) is a high-performing choice for complex interactions, while Random Forest (bagging) provides a strong, variance-reducing baseline; so, using both gives complementary inductive biases and more reliable predictions. Furthermore, explainable outputs and resistance to overfitting are important characteristics in operational agricultural contexts [34,35].
The FMIS’s Prediction Service is a modular microservice for real-time agronomic data processing and component integration. Figure 9 depicts its internal workflow which includes the collection, processing, and utilization of sensor and historical data to produce production projections. By receiving recent operational and environmental data from the system’s internal services, an integrated scheduler created with Spring Scheduler starts data acquisition tasks on a regular basis. This constant flow of data guarantees that the prediction engine has the most recent inputs for precise and prompt outcomes [34,36].
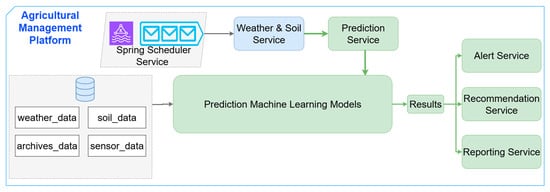
Figure 9.
Diagram of the Prediction Service flow within the FMIS.
As previously described, the Weather & Soil Service processes incoming data first, validating, normalizing, and storing it in specialized cloud database tables. The Prediction Service accesses these data after they have been processed, together with previous yield information. The service applies Random Forest and XGBoost models, which are both pre-trained on local agronomic datasets. Subsequent modules like recommendation and alarm services can access the output, which is saved in the system database and usually stated as expected yield values [37,38].
In practice, yield forecasts are available continuously from crop emergence until physiological maturity. Early season predictions, even if less precise, provide useful indications for strategic planning and resource allocation. As the crop progresses into critical stages such as tasseling and silking, prediction accuracy improves, supporting timely agronomic interventions as irrigation, fertilization, and pest management. During the grain filling stage, the FMIS delivers near-final yield estimates which are particularly relevant for harvest scheduling, logistics, and post-harvest storage management [38,39].
This staged prediction design ensures that farmers benefit from both early-season outlooks for strategic planning and late-season accurate forecasts for operational decision-making, thereby maximizing the practical usefulness of the system in real farming conditions. Like recent approaches in crop yield modelling using satellite and soil data [34], our pipeline emphasizes the real usefulness of yield forecasting in practice by providing timely, actionable information aligned with key growth stages.
In the proposed FMIS, machine learning is implemented as a stand-alone Python microservice (deployed alongside the other services in the cloud) that exposes a REST API. Currently the Weather & Soil Service, via the Prediction Service, is the primary client of this API for yield prediction in kg/ha. After it aggregates recent meteorological and pedological indicators (e.g., temperature, humidity, rainfall, soil pH and moisture) and engineered features (e.g., cumulative GDD (Growing Degree Days), drought stress, days since planting), the Prediction Service issues a request via the API Gateway to the ML microservice.
Upon receiving the response, the Prediction Service persists the prediction into the platform_data_db and publishes an event to the Recommendation and Alert services. This decoupled design ensures scalability (the ML microservice can be scaled independently), extensibility (new models can be added without structural changes to the FMIS), traceability (predictions are stored with metadata), and portability across public or hybrid cloud deployments. This confirms that ML is not only mentioned but operationally embedded in the platform’s data flow and decision-support pipeline.
A data abstraction layer is introduced to support this architectural independence by standardizing and preparing input data for the prediction models, regardless of where it comes from. This layer serves as an in between processing stage, ensuring that all of the data which is provided into the models has already been vetted and normalized. The system can thus incorporate new data sources or change current ones without affecting the core model execution pipeline because the predictive logic is completely independent of how data is received or stored.
The Prediction Service’s internal structure is divided into three functional layers:
- A preprocessing module (as a software component), in charge for validating, nor-malising, and extracting important information from incoming data.
- A model execution module: the prediction is carried out via a model execution module that uses either Random Forest or XGBoost.
- A response module, another FMIS microservices including recommendation, alerting, or reporting can easily consume the output thanks to a response module that presents it as a standardized JSON object.
A closely linked ecosystem of microservices is depicted in the flow shown in Figure 9, where intelligent algorithms assess continuously updated environmental data to generate actionable insights that optimize and guide agricultural operations.
6. Crop and Field Module
The FMIS’s Field Service and Crop Service serve as essential microservice elements that coordinate the primary agricultural entities, namely plots and crops. Each change in agronomic metadata is automatically mirrored throughout the platform in almost real-time thanks to their well-organized internal routines, which enable precise forecasts, notifications, and practical suggestions.
6.1. Field Service
The primary hub for managing agricultural plot data and related treatment operations is the Field Service microservice. Users and higher-level modules can register applied treatments (fields_treatments), set priority settings (field_priority_settings), and add, update, or remove field records (fields) using its available REST API. The field_priority_settings can be configured directly by the users to reflect the relative importance of their plots. Higher-priority fields receive alerts and recommendations earlier and more frequently, particularly for time-critical operations such as irrigation, fertilization or the application of phytosanitary treatments. For example, a farmer may assign a high priority to a maize field at the flowering stage, which will result in the system sending irrigation alerts sooner and providing earlier treatment recommendations compared to lower-priority fields. This mechanism enables users to tailor the system’s behaviour to their operational needs and ensures that resources are allocated where they matter most.
In order to keep a complete audit trail that include metadata like GPS coordinates, soil type, surface area and treatment history, each request is verified and stored in the FMIS Core database.
Every time data is updated, an asynchronous message is sent to all dependent microservices such as the Reporting Service, Alert Service, and Recommendation Service, as shown in Figure 10. To update their outputs appropriately, these services individually retrieve the most recent plot data. Every irrigation advice, alert, or report is always in sync with the current field state thanks to this event-driven propagation.
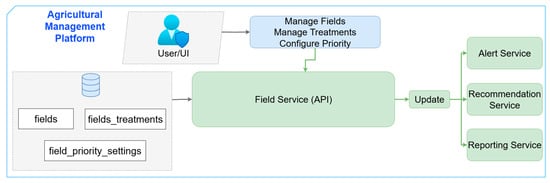
Figure 10.
Flow diagram for Field Service microservice.
6.2. Crop Service
Information about crop lifecycle management and the application of agronomic regulations is centralized via the Crop Service microservice. To generate or edit crop records (crops) containing characteristics like plant type, season year and anticipated sowing or harvesting dates, users or automation agents communicate with their API. Likewise, the crops_guidelines entity is used to establish and store crop-specific guidelines (such as when to fertilize, when to water, and when to apply pesticides).
In order to increase the contextual relevance of the predictions and recommendations provided to farmers, the Crop Service sends update signals to the Prediction Service and Recommendation Service upon creation or modification of these records. These services retrieve the new thresholds and constraints such as thermal GDD or hydric stress levels, as illustrated in Figure 11. This method greatly improves the accuracy and usefulness of the FMIS outputs by matching each advice with the crop’s actual phenological phase.
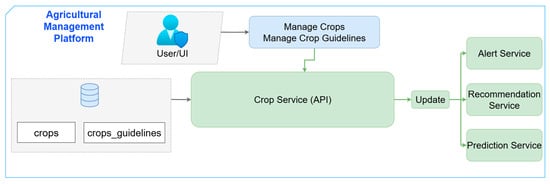
Figure 11.
Flow diagram for Crop Service microservice.
The platform adopts an at-least-once delivery model with acknowledgments and retry policies to minimize message loss. In the event of network outages, sensor readings are stored in the Fog-layer buffer database and retransmitted once connectivity is restored. Duplicate messages are handled through idempotent consumers, which use a combination of sensor_id and timestamp as a unique key, ensuring that reprocessed events do not alter the system state. This approach improves robustness and reliability without requiring sequence numbering.
7. Experimental Results
In this case study, we demonstrate how the FMIS Prediction Service combines historical and real-time data from the Weather & Soil module with two machine learning models (Random Forest and XGBoost), alongside agronomic algorithms such as Growing Degree Days (GDD) and drought stress factors, to generate yield forecasts and operational recommendations.
To validate the FMIS design in a practical setting, we conducted a case study focused on the Giurgiu–Izvoarele region (44.0121° N, 25.8727° E) during the previous maize growing season. We performed an initial, production-like trial that exercised selected components of the asynchronous data flow for collecting, preprocessing, prediction, and recommendation tasks. To verify the system’s integration, publically accessible environmental data services were incorporated matching the structure and cadence expected by the platform.
It should be emphasized that the current results represent a preliminary validation of the FMIS, focusing mainly on machine learning accuracy. Broader system-level benchmarks, including latency, throughput, scalability under varying workloads, and cloud resource utilization will be addressed in future research. These evaluations will provide a more complete understanding of the robustness and efficiency of the platform once it reaches a higher level of maturity [40,41].
7.1. Data Sources and Preprocessing
The data used for the yield prediction experiments were obtained from two public sources, focused on the Giurgiu–Izvoarele test site presented in Figure 12. Meteorological measurements, including air temperature, relative humidity, and precipitation, were retrieved using the Open-Meteo service. Key soil parameter, as soil pH, organic carbon content, and bulk density, were extracted through the ISRIC SoilGrids API.
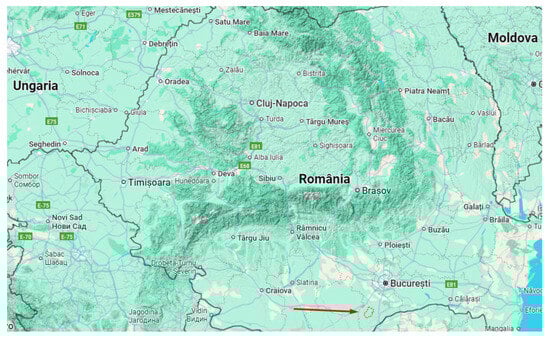
Figure 12.
Geographical overview of the study area (Giurgiu–Izvoarele; 44.0121° N, 25.8727° E).
A Python (version 3.13) script executed every 15 min collected these values, timestamped them using UTC, and inserted them into a buffer database (sensor_buffer), preparing them for further processing by the Weather & Soil microservice via RabbitMQ and the scheduler service that runs on the buffer database.
7.2. Data Processing and Feature Engineering
The FMIS pipeline processed the raw data after it was collected and placed in the buffer database to guarantee its quality, consistency, and suitability for the prediction models.
Hourly aggregates of meteorological recordings were created in order to eliminate redundant data and match agronomic time periods. In order to capture medium-term patterns and lessen the influence of short-term variations, time-based smoothing techniques such as 7-day rolling averages were applied to variables like temperature, soil moisture, and relative humidity. Simultaneously, soil characteristics acquired via the SoilGrids API, including bulk density (BDod), pH, and organic carbon content (SOC), were geospatially matched to every planted parcel and handled as constant properties throughout the growing season.
The prediction target is end-of-season yield (kg/ha). During the growing season, forecasts are recomputed hourly. At each forecast origin t, the pipeline uses all information available up to t, including hourly aggregates, season-to-date cumulative GDD, and time-windowed features (e.g., 7-day rolling precipitation/temperature/humidity) as well as phase-weighted drought indicators and static soil descriptors. Predictions are saved together with the timestamp t to ensure strict time awareness and prevent information leakage.
The dominant soil type is chernozem, and the selected area is part of a broader region of interest characterized by similar soils across the southern region of Romania. This relatively homogeneous pedological context supports comparability across analysis units while remaining representative for the wider southern plain.
Other engineering features were calculated to improve model performance:
- To monitor heat accumulation pertinent to the stages of maize development, Cumulative Growing Degree Days (GDD) is used.
- Based on variations in soil moisture and rainfall during vulnerable phenophases, the drought stress index is calculated.
- Days since planting, indicating the stage of crop development, are counted.
- Hybrid metadata that identifies the type of maize (such as Karpatis or P9241) cultivated in each field is considered.
- Weather effect indicators include daily temperature ranges and precipitation totals.
- Following feature engineering and preprocessing, the final dataset was sent via RabbitMQ to the Prediction Service, where it was used for yield forecasting in real time and saved in the FMIS analytics database (platform_data_db) [41].
7.3. Model Training and Evaluation
Two machine learning models, Random Forest and XGBoost, were trained and assessed in order to estimate agricultural yields based on field characteristics and environmental variables. Both models were chosen because they have demonstrated their usefulness in agricultural prediction tasks and are robust when applied to organized tabular data.
The following made up the training dataset:
- Historical yield data for the Giurgiu–Izvoarele region, compiled at the plot level.
- Meteorological data from the 2024 maize season that is time-aligned.
- Soil properties retrieved per plot.
- Features that are derived from phenological and meteorological data, such as days since planting, drought indices, and GDD.
The model configuration was an 80/20 train–test split, used to train both models. The learning rate for XGBoost, the maximum depth, and the number of estimators were among the hyperparameters that were tuned, to which values are displayed in Table 2 and Table 3. To lessen multicollinearity, input characteristics were normalized and filtered according to correlation levels [42,43].
Table 2.
Hyperparameters for the Random Forest model.
Table 3.
Hyperparameters for the XGBoost model.
According to the results displayed in Figure 13, XGBoost performed better than Random Forest, obtaining a much smaller root mean squared error and a higher explanatory power. This implies that XGBoost is better at capturing intricate relationships between agroclimatic factors and yield in the end, as well as better equipped to adjust to sudden changes in the environment.
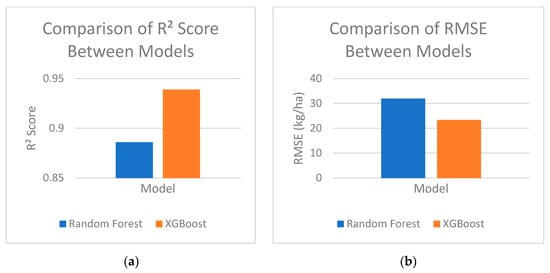
Figure 13.
(a) Coefficient of determination (R2) for Random Forest and XGBoost (b) Root Mean Squared Error (RMSE) for Random Forest and XGBoost.
The predictive performance of the models was validated using the official harvest data provided by the Romanian National Institute of Statistics (INS) for autumn 2024 [36], which reported an average maize yield of 2.83 t/ha. On the experimental dataset, the Random Forest and XGBoost models achieved RMSE values of 31.9 kg/ha and 23.3 kg/ha, respectively. Numerically, this corresponds to less than 1.5% of the national average yield; however, it should be noted that this low error reflects the specific conditions of the case study dataset, whereas broader regional and inter-annual variability in practice can be substantially higher.
Model performance on the case-study dataset achieved low RMSE values due to the relative homogeneity of the study site and the availability of consistent environmental and soil data. When referenced to national statistics (average yield ≈2.83 t/ha in 2024), realistic benchmarks for maize yield forecasting are typically on the order of 10–20% RMSE (≈0.28–0.56 t/ha), with higher errors expected at early-season or broader spatial aggregation. Accordingly, the reported RMSE on our local test set should be interpreted as an internal baseline rather than a national-scale error.
7.4. Model Behaviour and Temporal Trends
Over time, Random Forest generated a prediction curve that is visually smoother and had fewer sharp variations from hour to hour, as shown in Figure 14, but this stability does not always equate to improved accuracy. Because of its conservative nature, the model is less responsive to abrupt changes in the environment, which makes it less effective during stressful situations like brief droughts.
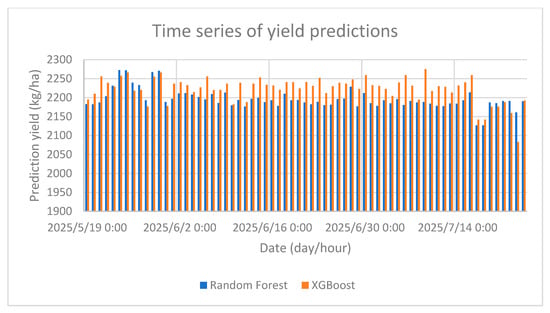
Figure 14.
Predicted yield evolution using Random Forest vs. XGBoost.
XGBoost, on the other hand, showed more drastic fluctuations in its anticipated yield trend, rapidly adjusting to abrupt changes in soil or weather conditions. For instance, XGBoost quickly lowered its output in response to a brief moisture deficit, more closely representing the anticipated agronomic impact.
Even though Random Forest seems stable, XGBoost was definitely superior based on quantitative performance indicators. With a higher R2 score and a noticeably lower RMSE, XGBoost showed greater explanation of the dataset’s variability and closer alignment with real yield values.
8. Conclusions
The proposed Farm Management Information System (FMIS) provides a scalable and modular solution for data-driven agriculture. It is based on a cloud-native microservices architecture and incorporates IoT technologies. Farmers may make better decisions faster by using the technology, which records and analyzes data over the course of the crop lifecycle. Increased productivity, lower operating costs, and more effective use of resources are the outcomes of this.
The results of the case study demonstrate that the integration of Random Forest and XGBoost models within the proposed FMIS generates reliable and complementary yield forecasts, thereby supporting farmers in making informed operational decisions. Quantitatively, the Random Forest model achieved an R2 of 0.886 with an RMSE of 31.89 kg/ha, while the XGBoost model obtained a higher R2 of 0.939 and a lower RMSE of 23.33 kg/ha. These findings confirm the robustness of the forecasting pipeline. Moreover, employing both models in parallel offers additional advantages, providing end users with a more comprehensive and nuanced perspective, and allowing them to select the prediction most appropriate to their specific operational context. By choosing the best prediction based on their unique operational situation, this dual-model method enables farmers to make better informed decisions.
The FMIS is under development; some of its components such as the data structure, prediction logic, and orchestration framework have been fully planned and partially implemented. Real-world case studies and iterative improvements based on feedback from pilot deployments will be used to further validate its efficacy.
This work’s primary contribution is the development of an intelligent, adaptable FMIS that tackles the major issues small and medium-sized farms confront, such as inadequate infrastructure, high implementation costs, and lack of digital skills. The system is suitable for use in a variety of farming scenarios due to its modular design, safe access control, local buffering for sporadic connectivity, and user-friendly interface.
There will be a few primary paths for future development. In the next development iteration, the FMIS will be extended to support the complete maize phenological cycle, from planning and sowing to harvest and post-harvest. Second, the use of advanced computer vision and drone-based multispectral imaging to integrate early pest detection methods. Another path is the improvement in prediction accuracy by using deep learning models and growing training datasets using data from several sources. The FMIS will become an even more comprehensive decision-support tool for intelligent and sustainable agriculture as a result of these developments.
In order to increase the precision and applicability of forecasts, the system will be expanded in the future by adding more climatic and agronomic variables and investigating novel machine learning techniques. More domain-specific variables will improve the system’s capacity to predict operational requirements and capture crop dynamics, thereby solidifying FMIS as a crucial instrument for data-driven precision agriculture. Furthermore, we plan to integrate advanced multi-parameter sensors capable of simultaneously measuring soil moisture, temperature, pH, nutrient content and microclimatic conditions, which will enhance data richness and reduce the need for maintaining multiple single-purpose devices.
Author Contributions
Conceptualization, C.N., T.B., S.R. and V.V.A.; Software, C.N.; Validation, T.B.; Formal analysis, V.V.A.; Investigation, S R. and V.V.A.; Writing—original draft, C.N.; Writing—review and editing, C.N., T.B. and S.R.; Supervision, T.B. and S.R. All authors have read and agreed to the published version of the manuscript.
Funding
This research received no external funding.
Data Availability Statement
The data presented in this study are available on request from the corresponding author.
Conflicts of Interest
The authors declare no conflicts of interest.
Abbreviations
The following abbreviations are used in this manuscript:
| FMIS | Farm Management Information System |
| IoT | Internet of Things |
| INS | Romanian National Institute of Statistics |
| AWS | Amazon Web Services |
| AI | Artificial Intelligence |
| API | Application Programming Interface |
| REST | Representational State Transfer |
| CPU | Central Processing Unit |
| IdP | Identity Provider |
| JWT | Json Web Token |
| TLS | Transport Layer Security |
| SSL | Secure Sockets Layer |
| GDPR | General Data Protection Regulation |
| GPS | Global Positioning System |
| GDD | Growing Degree Days |
| BDod | Bulk Density of Dry Soil |
| JSON | JavaScript Object Notation |
| UTC | Coordinated Universal Time |
| LoRaWAN | Long Range Wide Area Network |
| MCU | Microcontroller Unit |
| Wi-Fi | Wireless Fidelity |
| SOC | Soil Organic Carbon |
| RMSE | Root Mean Square Error |
References
- Ayaz, M.; Ammad-Uddin, M.; Sharif, Z.; Mansour, A.; Aggoune, E.-H.M. Internet-of-Things (IoT)-Based Smart Agriculture: Toward Making the Fields Talk. IEEE Access 2019, 7, 129551–129583. [Google Scholar] [CrossRef]
- Abraham, G.R.R.; Nithya, M. Smart Agriculture Based on IoT and Machine Learning. In Proceedings of the 5th International Conference on Computing Methodologies and Communication (ICCMC), Erode, India, 8–10 April 2021; pp. 414–419. [Google Scholar] [CrossRef]
- Tummers, J.; Kassahun, A.; Tekinerdogan, B. Reference Architecture Design for Farm Management Information Systems: A Multi-Case Study Approach. Comput. Electron. Agric. 2019, 166, 105026. [Google Scholar] [CrossRef]
- Moysiadis, V.; Tsakos, K.; Sarigiannidis, P.; Petrakis, E.; Boursianis, A. A Cloud Computing Web-Based Application for Smart Farming Based on Microservices Architecture. In Proceedings of the 11th International Conference on Modern Circuits and Systems Technologies (MOCAST), Bremen, Germany, 8–10 June 2022; pp. 1–5. [Google Scholar] [CrossRef]
- Dibbern, T.; Romani, L.A.S.; Massruhá, S.M.F. Main Drivers and Barriers to the Adoption of Digital Agriculture Technologies. Smart Agric. Technol. 2024, 8, 100459. [Google Scholar] [CrossRef]
- Truong, T.M.; Huynh, K.Q.; Ngo, T.T.T.; Luu, C.; Le, B.M. The Microservice Based Architecture for IoT Systems in Agriculture and Aquaculture. In Proceedings of the 2025 International Conference on Information Communication and Management (ICICM), Paris, France, 6–8 November 2024; pp. 22–28. [Google Scholar] [CrossRef]
- Basir, M.S.; Buckmaster, D.; Raturi, A.; Zhang, Y. From Pen and Paper to Digital Precision: A Comprehensive Review of On-Farm Recordkeeping. Precis. Agric. 2024, 25, 2643–2682. [Google Scholar] [CrossRef]
- Lim, K.; McFadden, J.; Miller, N.; Lacy, K. America’s Farms and Ranches at a Glance: 2024 Edition; U.S. Department of Agriculture, Economic Research Service, Economic Information Bulletin Number 283; USDA: Washington, DC, USA, 2024.
- Touch, V.; Tan, D.K.Y.; Cook, B.R.; Liu, D.L.; Cross, R.; Tran, T.A.; Utomo, A.; Yous, S.; Grunbuhel, C.; Cowie, A. Smallholder Farmers’ Challenges and Opportunities: Implications for Agricultural Production, Environment and Food Security. J. Environ. Manag. 2024, 370, 122536. [Google Scholar] [CrossRef]
- Chkarat, H.; Abid, T.; Sauvé, L. Conditions for a Convergence between Digital Platforms and Sustainability in Agriculture. Sustainability 2023, 15, 14195. [Google Scholar] [CrossRef]
- Kruize, J.W.; Wolfert, S.; Scholten, H.; Verdouw, C.N.; Kassahun, A.; Beulens, A.J.M. A Reference Architecture for Farm Software Ecosystems. Comput. Electron. Agric. 2016, 125, 12–28. [Google Scholar] [CrossRef]
- Deng, S.; Zhao, H.; Fang, W.; Yin, J.; Dustdar, S.; Zomaya, A.Y. Edge Intelligence: The Confluence of Edge Computing and Artificial Intelligence. IEEE Internet Things J. 2020, 7, 7457–7469. [Google Scholar] [CrossRef]
- Sushanth, G.; Sujatha, S. IoT Based Smart Agriculture System. In Proceedings of the 2018 International Conference on Wireless Communications, Signal Processing and Networking (WiSPNET), Chennai, India, 22–24 March 2018; pp. 1–4. [Google Scholar] [CrossRef]
- Sah, S.; Haldar, D.; Singh, R.N.; Das, B.; Nain, A.S. Rice Yield Prediction Through Integration of Biophysical Parameters with SAR and Optical Remote Sensing Data Using Machine Learning Models. Sci. Rep. 2024, 14, 21674. [Google Scholar] [CrossRef]
- Al-Fuqaha, A.; Guizani, M.; Mohammadi, M.; Aledhari, M.; Ayyash, M. Internet of Things: A Survey on Enabling Technologies, Protocols, and Applications. IEEE Commun. Surv. Tutor. 2015, 17, 2347–2376. [Google Scholar] [CrossRef]
- Verma, S.; Gala, R.; Madhavan, S.; Burkule, S.; Chauhan, S.; Prakash, C. An Internet of Things (IoT) Architecture for Smart Agriculture. In Proceedings of the 4th International Conference on Computing Communication Control and Automation (ICCUBEA), Pune, India, 16–18 August 2018; pp. 1–4. [Google Scholar] [CrossRef]
- Verdouw, C.; Sundmaeker, H.; Tekinerdogan, B.; Conzon, D.; Montanaro, T. Architecture Framework of IoT-Based Food and Farm Systems: A Multiple Case Study. Comput. Electron. Agric. 2019, 165, 104939. [Google Scholar] [CrossRef]
- Akhter, R.; Sofi, S.A. Precision Agriculture Using IoT Data Analytics and Machine Learning. J. King Saud Univ. Comput. Inf. Sci. 2022, 34, 5602–5618. [Google Scholar] [CrossRef]
- Joshi, S.; Sharma, M.; Kaushal, D.; Misra, A.; Gupta, P.; Gopal, S. Optimizing Productivity and Efficiency in Agriculture through the Integration of Digital Technologies: A Smart Agriculture Perspective. In Proceedings of the 2023 9th International Conference on Smart Computing and Communications (ICSCC), Kochi, India, 17–19 August 2023; pp. 119–125. [Google Scholar]
- Neves, R.A.; Cruvinel, P.E. A Cloud-Based Intelligence System for Asian Rust Risk Analysis in Soybean Crops. AgriEngineering 2025, 7, 236. [Google Scholar] [CrossRef]
- Lakhan, A.; Mohammed, M.A.; Rashid, A.N.; Kadry, S.; Panityakul, T.; Abdulkareem, K.H.; Thinnukool, O. Smart-Contract Aware Ethereum and Client-Fog-Cloud Healthcare System. Sensors 2021, 21, 4093. [Google Scholar] [CrossRef]
- Coutinho, M.; Afonso, J.A.; Lopes, S. An Efficient Adaptive Data-Link-Layer Architecture for LoRa Networks. Future Internet 2023, 15, 273. [Google Scholar] [CrossRef]
- Krug, S.; Hutschenreuther, T.; Toepfer, H.; O’Nils, M. Impact of Real-World Energy Consumption Variance on Internet of Things Node Lifetime Predictions. Electronics 2024, 13, 4578. [Google Scholar] [CrossRef]
- Milani, S.; Chatzigiannakis, I.; Garlisi, D.; Di Fraia, M.; Pisani, P. Enabling Edge Processing on LoRaWAN Architecture. arXiv 2024, arXiv:2402.09805. [Google Scholar] [CrossRef]
- Aldhafeeri, L.; Alshehhi, N.; Manzil, I.I.J.; Khalil, R.A.; Javaid, S.; Saeed, N.; Alouini, M.-S. LoRa Communication for Agriculture 4.0: Opportunities, Challenges, and Future Directions. arXiv 2024, arXiv:2409.11200. [Google Scholar] [CrossRef]
- Rafi, M.S.M.; Behjati, M.; Rafsanjani, A.S. Reliable and Cost-Efficient IoT Connectivity for Smart Agriculture: A Comparative Study of LPWAN, 5G, and Hybrid Connectivity Models. arXiv 2024, arXiv:2408.02405. [Google Scholar] [CrossRef]
- Wolfert, S.; Ge, L.; Verdouw, C.; Bogaardt, M.-J. Big Data in Smart Farming—A Review. Agric. Syst. 2017, 153, 69–80. [Google Scholar] [CrossRef]
- Liopa-Tskalidi, A.; Thomopoulos, V.; Barouchas, P.; Boursianis, A.D.; Goudos, S.K. A LoRaWAN-based IoT Platform for Smart Irrigation in Olive Groves. Smart Agric. Technol. 2024, 9, 100673. [Google Scholar] [CrossRef]
- Kumar, V.; Sharma, K.V.; Kedam, N.; Patel, A.; Kate, T.R.; Rathnayake, U. A Comprehensive Review on Smart and Sustainable Agriculture Using IoT Technologies. Smart Agric. Technol. 2024, 8, 100487. [Google Scholar] [CrossRef]
- Faria, R.O.; Marques Filho, A.C.; Santana, L.S.; Martins, M.B.; Sobrinho, R.L.; Zoz, T.; Oliveira, B.R. Models for Predicting Coffee Yield from Chemical Characteristics of Soil and Leaves Using Machine Learning. Sci. Food Agric. 2024, 104, 5197–5206. [Google Scholar] [CrossRef]
- Koliopanos, C.; Gemitzi, A.; Kofakis, P.; Malamos, N.; Tsirogiannis, I. Enhancing Temperature Data Quality for Agricultural Decision-Making with Emphasis to Evapotranspiration Calculation: A Robust Framework Integrating Dynamic Time Warping, Fuzzy Logic, and Machine Learning. AgriEngineering 2025, 7, 174. [Google Scholar] [CrossRef]
- Aitmouden, O.; Housni, M.; Safeh, N.; Namir, A. A Microservices-Based Framework for Scalable Data Analysis in Agriculture with IoT Integration. Int. J. Interact. Mob. Technol. 2023, 17, 65–79. [Google Scholar] [CrossRef]
- Sahbeni, G.; Székely, B.; Musyimi, P.K.; Timár, G.; Sahajpal, R. Crop Yield Estimation Using Sentinel-3 SLSTR, Soil Data, and Topographic Features Combined with Machine Learning Modeling: A Case Study of Nepal. AgriEngineering 2023, 5, 1766–1788. [Google Scholar] [CrossRef]
- Singh, N.; Sharma, A.K.; Sarkar, I.; Prabhu, S.; Chadaga, K. IoT-based greenhouse technologies for enhanced crop monitoring and control: A comprehensive survey. Int. J. Ambient Comput. Intell. 2024, 12, 2306825. [Google Scholar] [CrossRef]
- Akhter, S.; Aida, K.; Honda, K.; Ines, A.V.M. An Integrated (Crop Model, Cloud and Big Data Analytic) Framework to Support Agriculture Activity Monitoring System. arXiv 2024. [Google Scholar] [CrossRef]
- Araújo, S.O.; Peres, R.S.; Filipe, L.; Manta-Costa, A.; Lidon, F.; Ramalho, J.C. Intelligent Data-Driven Decision Support for Agricultural Systems—ID3SAS. IEEE Access 2023, 11, 115798–115815. [Google Scholar] [CrossRef]
- Okayama, A.; Yamamoto, A.; Matsuno, Y.; Kimura, M. Machine Learning for Precision Agriculture: Predicting Persimmon Peak Harvest Dates and Yield Using Meteorological Data. AgriEngineering 2025, 7, 180. [Google Scholar] [CrossRef]
- Apeh, O.O.; Nwulu, N.I. Machine Learning Approach for Short- and Long-Term Global Solar Irradiance Prediction. J. Environ. Earth Sci. 2025, 7, 1–15. [Google Scholar] [CrossRef]
- Vance, J.M.; Smith, B.; Cherukuru, A.; Rasheed, K.; Missaoui, A.; Miller, J.A.; Maier, F.; Arabnia, H. Utility of Domain Adaptation for Biomass Yield Forecasting. AgriEngineering 2025, 7, 237. [Google Scholar] [CrossRef]
- INSSE. Crop Production in 2024 (Preliminary Data); Romanian National Institute of Statistics: Bucharest, Romania, 2024; Available online: https://insse.ro/cms/en (accessed on 10 August 2025).
- Krisnawijaya, N.N.K.; Tekinerdogan, B.; Catal, C.; van der Tol, R. Reference Architecture Design for Developing Data Management Systems in Smart Farming. Ecol. Inform. 2024, 81, 102613. [Google Scholar] [CrossRef]
- Habib, M.; Kabir, M.A.; Zheng, L. LEISA: A Scalable Microservice-based System for Efficient Livestock Data Sharing. arXiv 2025, arXiv:2501.14781v1. [Google Scholar] [CrossRef]
- Melzer, M.; Bellingrath-Kimura, S.; Gandorfer, M. Commercial Farm Management Information Systems—A Demand-Oriented Analysis of Functions in Practical Use. Smart Agric. Technol. 2023, 4, 100203. [Google Scholar] [CrossRef]
Disclaimer/Publisher’s Note: The statements, opinions and data contained in all publications are solely those of the individual author(s) and contributor(s) and not of MDPI and/or the editor(s). MDPI and/or the editor(s) disclaim responsibility for any injury to people or property resulting from any ideas, methods, instructions or products referred to in the content. |
© 2025 by the authors. Licensee MDPI, Basel, Switzerland. This article is an open access article distributed under the terms and conditions of the Creative Commons Attribution (CC BY) license (https://creativecommons.org/licenses/by/4.0/).