Article

An Integrated Deep Learning Approach for Poultry Disease Detection and Classification Based on Analysis of Chicken Manure Images

1
Department of Poultry Science, University of Georgia, Athens, GA 30602, USA
2
School of Electrical and Computer Engineering, University of Georgia, Athens, GA 30602, USA
*
Author to whom correspondence should be addressed.
AgriEngineering 2025, 7(9), 278; https://doi.org/10.3390/agriengineering7090278
Submission received: 22 July 2025 / Revised: 26 August 2025 / Accepted: 27 August 2025 / Published: 29 August 2025
(This article belongs to the Section Livestock Farming Technology)

Abstract

Poultry diseases threaten animal welfare and productivity, especially in cage-free systems where communal environments increase disease transmission risks. Traditional diagnostic methods, though accurate, are often labor-intensive, time-consuming, and not suitable for continuous monitoring. This study aimed to develop a web-based disease screening tool to make this process faster and accurate using fecal images. A publicly available dataset consisting of 6812 PCR-verified images categorized into Coccidiosis, Newcastle Disease (NCD), Salmonella, and Healthy from commercial farms in Tanzania was used in this study. Augmentation was used to address the imbalance present in the dataset, with NCD underrepresented (376 images) compared to other classes (>2000 images). Five YOLOv11 detection models were trained, with YOLO11n selected due to its high mean average precision (mAP@0.5 = 0.881). For classification, EfficientNet-B0 was chosen over the EfficientNet-B1 variant because of its high accuracy (99.12% vs. 98.54% for B1). Despite high class imbalance, B0 had higher precision than B1 for the underrepresented NCD class (0.88 for B1 vs. 1.00 for B0). The system achieved an average total inference time of 25.8 milliseconds, demonstrating real-time capabilities. Field testing, expanding datasets across different regions, and incorporating additional diseases is required to further validate and enhance the robustness of the system.

1. Introduction

Poultry industry represents a significant portion of the U.S. economy, valued at USD 70.2 billion in 2024 alone [1]. However, disease outbreaks have been a global problem in the poultry industry including the U.S., resulting in billions of dollars in production and treatment losses [2]. Housing systems play a major role in disease dynamics. While conventional cages limit bird movement and reduce disease spread [3,4], they are associated with non-infectious health issues like fatty liver disease and bone fractures [5]. In comparison with caged systems, cage-free systems support better welfare by allowing natural behaviors but increase the risk of disease due to shared living, feeding, and drinking spaces.
Addressing the consumer concerns about animal welfare, major U.S. retailers have pledged to transition to cage-free eggs by January 2026, requiring an estimated 75% of egg production systems to convert accordingly [6,7]. In such systems, early disease detection is essential to limit spread and economic loss. For example, a study by Nezworski et al. (2021) [8] reported that early detection of highly pathogenic avian influenza (HPAI) in one out of the two large-scale egg production facilities housing over 1 million birds reduced financial losses by approximately USD 3.3 million. Current detection methods such as serological tests or visual inspections are effective [9,10,11], but they are labor-intensive and may not be suitable for continuous flock monitoring.
Fecal characteristics analysis is a visual inspection method used to identify gastrointestinal diseases. For example, Coccidiosis often causes blood-stained, yellow, watery, or dark brown droppings [12,13], while healthy birds’ feces are generally brown with white areas [14]. While manual identification is possible, automated systems provide scalable and consistent monitoring for large-scale operations. Since deep learning systems can learn complex patterns from large and unstructured datasets such as images, videos, or audio, using layers of neural networks [15], fecal images can be used as an input for disease detection systems.
Previous studies have demonstrated the potential of deep learning for poultry disease classification. Earlier, Srivastava and Pandey (2023) [16] developed a CNN capable of distinguishing between fecal images from healthy and unhealthy birds with 93.23% accuracy. Machuve et al. (2022) [17] used pre-trained deep learning models for poultry diagnostics, achieving a maximum accuracy of 98.24%. Liu et al. (2023) [18] introduced PoultryNet, a specialized model for classifying disease status from poultry feces, reporting an accuracy of 97.77%. Wati and Roestam (2023) [19] utilized the YOLOv7 model to detect poultry feces and classify disease conditions, achieving 96% accuracy. Another example includes proof of concept by Li et al. (2023) [20]. They developed a mobile platform that can classify the disease status of fecal matter from the captured images using a local server, with the whole process completed within a second. Although their system demonstrated the feasibility of fast, localized inference, it required a local processing unit, and feces detection was not included.
Although deep learning methods, specifically classification algorithms, can predict disease occurrence through fecal analysis with high accuracy, a majority of the earlier studies did not consider localization of feces within a single image. In this approach, object detectors such as YOLO detect an object, and an image classifier assigns a label, improving both localization and classification accuracy in complex images [21]. This is important as multiple disease indicators may coexist in a single image and could otherwise be overlooked. Many of the earlier studies have focused on model development, training, and evaluation, but few efforts have emphasized user-friendly implementation.
Deep learning models like You Only Look Once (YOLO), which is a single-pass detection model that simultaneously predicts bounding boxes and class probabilities, provide a significant speed advantage over earlier two-stage detectors like the Fast Recurrent Convolutional Neural Network (Fast R-CNN) [22,23]. Similarly, convolutional neural networks (CNNs) like EfficientNet [24] are known for their balanced scaling of network depth, width, and resolution, allowing them to achieve high accuracy while maintaining computational efficiency in classification tasks. In an experiment conducted by Costa et al. (2025) [25], a variant of EfficientNet outperformed popular models like Inception, the Residual Network (ResNet), and the VGG neural network, in terms of accuracy and efficiency.
Most prior deep learning studies classified diseases from fecal images without localizing feces, a key step for identifying distinct regions when multiple indicators are present. A two-stage approach—using an object detector like YOLO for localization followed by a classifier for labeling—can enhance both localization and classification accuracy in complex images [21]. Additionally, web frameworks like Streamlit can offer a graphical user interface (GUI) platform to improve the user accessibility and usability of the deep learning models developed by researchers. A platform like this also provides simplicity, affordability, ease of use, and support for faster prototyping and development than platform-specific applications [26]. Previous works including that of Warbhe et al. (2025) [27] have implemented Streamlit in a web-based plant disease detection system targeting farming practice. Other implementations include broiler chicken tracking [28] and meat adulteration detection [29].
This study developed a two-stage disease classification system using a publicly available dataset for on-site detection and classification of poultry droppings. We evaluated YOLO11 variants (n, s, m, l, x) for detection and EfficientNet-B0/B1 for classification, selecting them for their high accuracy. Designed to complement rather than replace laboratory diagnostics, the system enables continuous, non-invasive flock-level screening, supports early intervention, and helps reduce disease spread and economic losses in commercial poultry farms.

2. Materials and Methods

2.1. Dataset and Data Preprocessing

The dataset used in this study was obtained from Zenodo [30] and consists of poultry fecal images annotated with their corresponding polymerase chain reaction (PCR)-verified disease status classifications. This widely used dataset consists of poultry fecal images from poultry farms in Tanzania between September 2020 and February 2021. The dataset includes four categories based on disease status: Coccidiosis (2103 images), Healthy (2057 images), NCD (376 images), and Salmonella (2276 images). Fecal matters within each image were labeled with bounding box annotations in YOLO format. The aspect ratios of images (width/height) ranged from 0.45 to 2.22, representing a good variation in the dataset. The dataset captures a wide range of real-world conditions, including variations in lighting, flooring types, and feces accumulation, reflecting the challenging environments typical of poultry farms. However, unavailability of complex farm environments such as occlusions and images representing a single region may potentially limit the models’ capability to achieve good performance in different farm conditions.
For both detection and classification training in this study, the dataset was split into training (70%), validation (20%), and testing (10%) subsets. To enhance model generalization, the ImageNet policy of the AutoAugment technique [31] was applied exclusively to the training sets. Unlike manually designed augmentation methods, AutoAugment uses a combination of techniques such as rotation, translation, shearing, and color adjustments, which are selected automatically to optimize model performance. This automated approach has been shown to improve the accuracy of image classifiers by generating diverse and challenging training examples, thereby reducing overfitting and improving generalization [31]. Augmentation was applied to the training set for both the detector and classifier to improve the model’s ability to generalize unseen data while maintaining realistic evaluation during validation and testing. This approach ensures that the validation and test sets remain representative of real-world conditions and prevents model overfitting to augmented patterns. The resulting training datasets after augmentation included 3186 images per class for the classifier and 6372 total images for the detector, reflecting the larger overall sample size required for robust bounding box localization in the detection task. Some results of augmentation are shown in Figure 1.
This separation of augmentation strategies allowed each model to focus on the specific challenges of its respective task, ensuring optimal performance in both classification and detection stages. Furthermore, this strategy of augmenting images separately for classifier and detector can balance the dataset for each scenario and yield better training results.

2.2. Model Training and Selection

2.2.1. Detection Model

Following a general trend in the development of YOLO object detection models, YOLO11 includes five variants—YOLO11n, YOLO11s, YOLO11m, YOLO11l, and YOLO11x—ranging from the most lightweight (YOLO11n) to the most computationally intensive (YOLO11x) models. Each YOLO model consists of three main components: backbone, neck, and head, each serving a distinct function in the detection pipeline. The backbone extracts essential visual features from input images, the neck aggregates and enhances these features across multiple scales for more accurate detection of small and large objects, and the head generates the final predictions, including bounding box coordinates, object confidence scores, and class probabilities [32].
Recent advancements in YOLO11 have introduced new convolutional blocks, C3k2 and C2PSA, which improve feature extraction and multi-scale performance while reducing computational complexity, resulting in enhanced detection accuracy and efficiency [32]. Five YOLO11 variants (YOLO11-n, -s, -m, -l, and -x) were trained for 150 epochs on the training dataset consisting of single-class label for feces. Prior to final training, a preliminary run of 100 epochs was conducted to monitor signs of overfitting and guide model selection. If the model results show no signs of overfitting or increased validation loss, the number of epochs can be increased with an early stopping parameter [33]. Hence, each model was trained for 150 epochs, with early stopping parameter set to 50, such that model training would stop if there were no improvements in the performance for consecutive 50 epochs. The resulting models were evaluated based on their ability to accurately detect poultry feces under diverse real-world conditions. For each model training, the images were resized into 640 × 640 pixels, batch size of 16, and a learning rate of 0.01. For both detector and classifier training, NVIDIA RTX 4000 Ada Generation graphical processing unit (GPU) (NVIDIA, Santa Clara, CA, USA) with 20 gigabytes of memory was used.

2.2.2. Classification Model

For the disease classification stage, EfficientNet was selected due to its proven performance in image classification tasks. The EfficientNet architecture, including both B0 and B1, utilizes inverted bottleneck residual blocks from MobileNetV2 [34] and squeeze and excitation (SE) modules [35], which improves the performance and results in fewer parameters when compared to traditional CNNs [36]. The major architectural differences between the two EfficientNet models lie in their scale—B1 is a larger variant with more layers, wider channels, and higher input image resolution than the B0 model. The baseline model (B0) is scaled up using compound scaling, which results in B1 model that uses more computational power and generally has higher accuracy in tasks such as tumor and leaf disease classification [37,38].

2.2.3. Model Performance Parameters

Model selection and evaluation were primarily based on the metric—mean average precision (mAP), which is a widely accepted measure for object detection tasks. Specifically, mAP@0.5 was used, where a prediction is true if the intersection over union (IoU) with the ground truth is at least 0.5. Since the models were trained for a single ‘feces’ class, mAP@0.5 is equivalent to the average precision (AP) at IoU of 0.5. Regardless, mAP@0.5 is a standard metric to assess the accuracy and consistency of feces localization across different images.
mAP = 1 N i = 1 N A P i
where N = total number of classes, and APi is the average precision for i-th class (1 in this case).
In addition to mAP, the following metrics were used to assess both detection and classification models:
Precision: The proportion of correctly predicted positive instances (TP) out of all predicted positives. High precision indicates that the model generates fewer false positives (FP).
Precision   ( P ) = T P T P + F P
Recall: The proportion of correctly predicted positive instances out of all actual positives. High recall demonstrates the model’s ability to correctly identify relevant instances.
Recall   ( R ) = T P T P + F N
F1-Score: The harmonic means of precision and recall, providing a balanced measure that accounts for both false positives and false negatives. It is particularly useful when class distribution is imbalanced.
F 1 - Score = 2 × P r e c i s i o n × R e c a l l P r e c i s i o n + R e c a l l
Support: The number of true instances for each class, providing context for interpreting precision, recall, and F1-score.
These metrics were chosen to provide a comprehensive evaluation of the detection and classification performance, ensuring that the final model not only detects feces accurately but also reliably classifies the disease status.

2.3. Integrated Web App

The final detection and classification pipeline integrates the best YOLO11 for feces detection and the best EfficientNet model for disease classification. The trained YOLO11 model first detects feces within the input images and generates bounding boxes around the identified regions. The areas within the bounding boxes are then cropped and passed to the EfficientNet classifier, which assigns a disease label (Coccidiosis, Newcastle Disease, Salmonella) or a Healthy label based on the extracted image areas. This two-stage approach was implemented in a Streamlit app (Version 1.41.0) and generated both the bounding box around fecal matter and the corresponding disease status with associated confidence score of classification. This allows precise, high-speed, and user-friendly disease analysis using fecal images, thereby reducing the need for manual inspections and enhancing disease detection.

3. Results and Discussion

3.1. Feces Detection

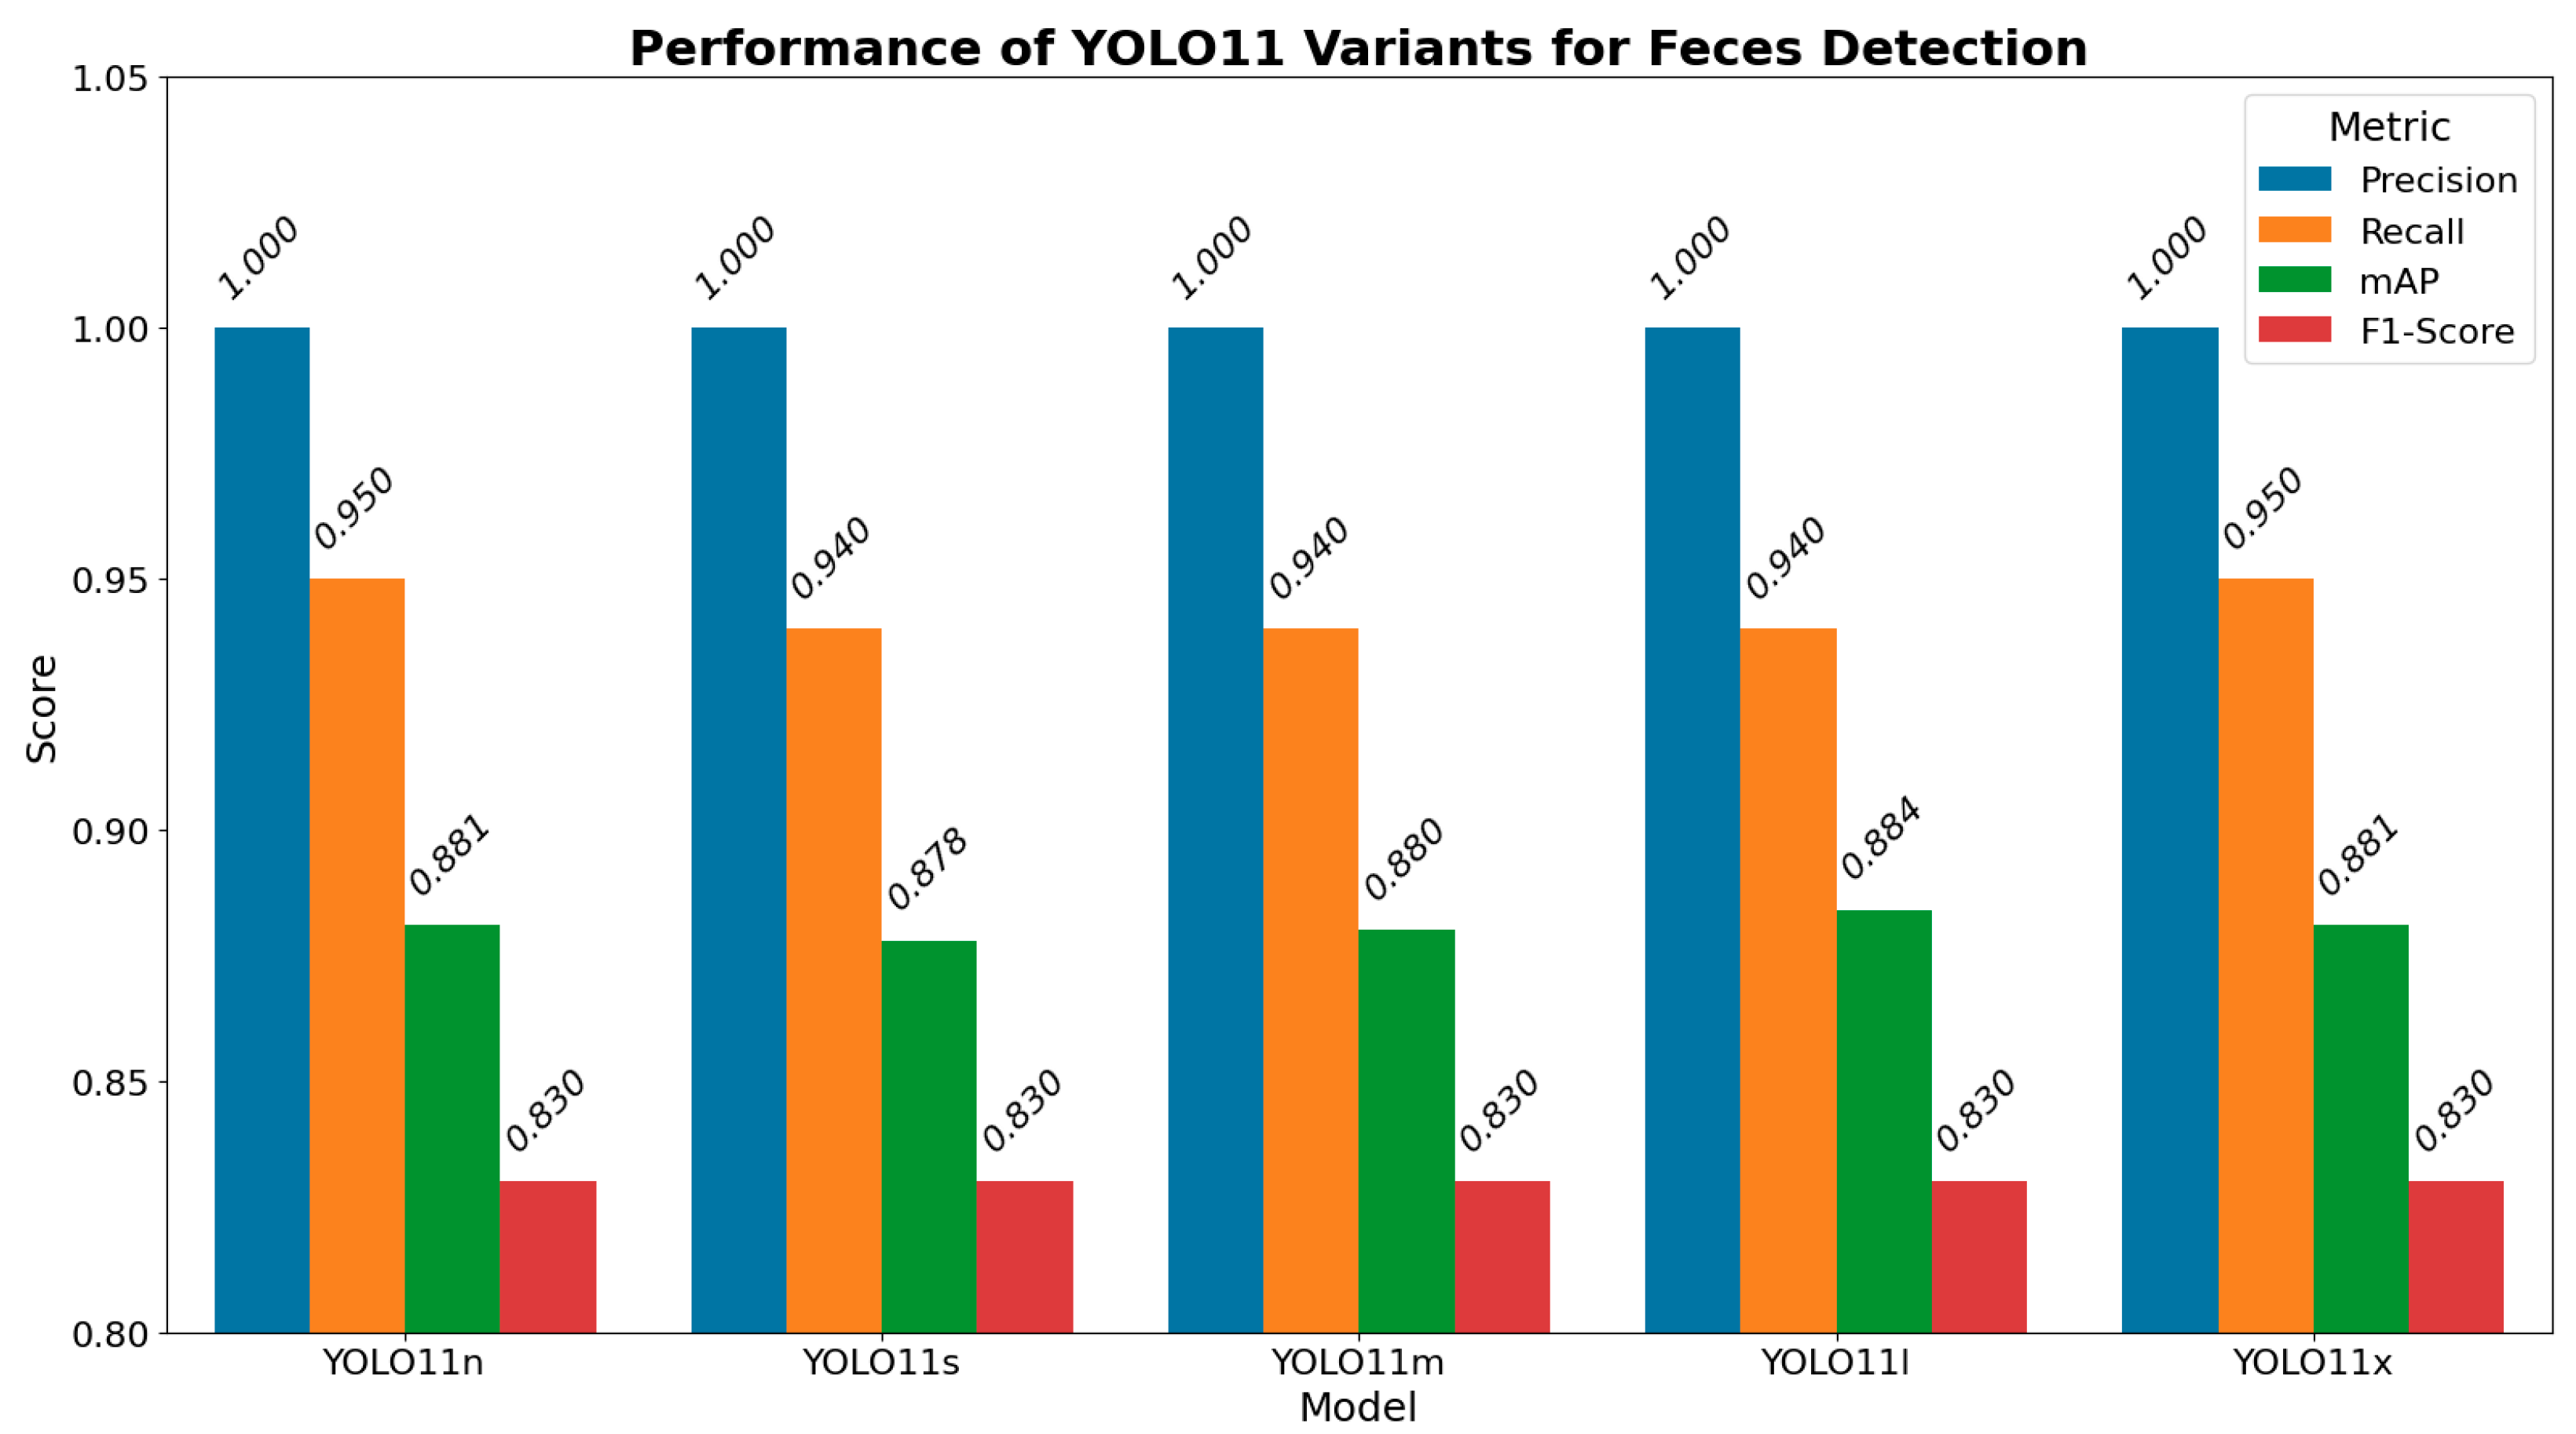
All five models that were trained had similar results across all performance metrics (Figure 2). Similar precision observed across all YOLO11 models was expected to be given the single-class nature of the detection task, where the only positive label is feces. In this case, precision measures the proportion of correctly predicted feces instances out of all positive predictions, without the added complexity of distinguishing between multiple classes. This uniformity in precision likely reflects the models’ ability to consistently differentiate feces from background, benefiting from simplified decision boundaries and reduced class confusion. This consistency also suggests that the models have effectively learned the distinctive features of feces, leading to minimal false positives across different model sizes.
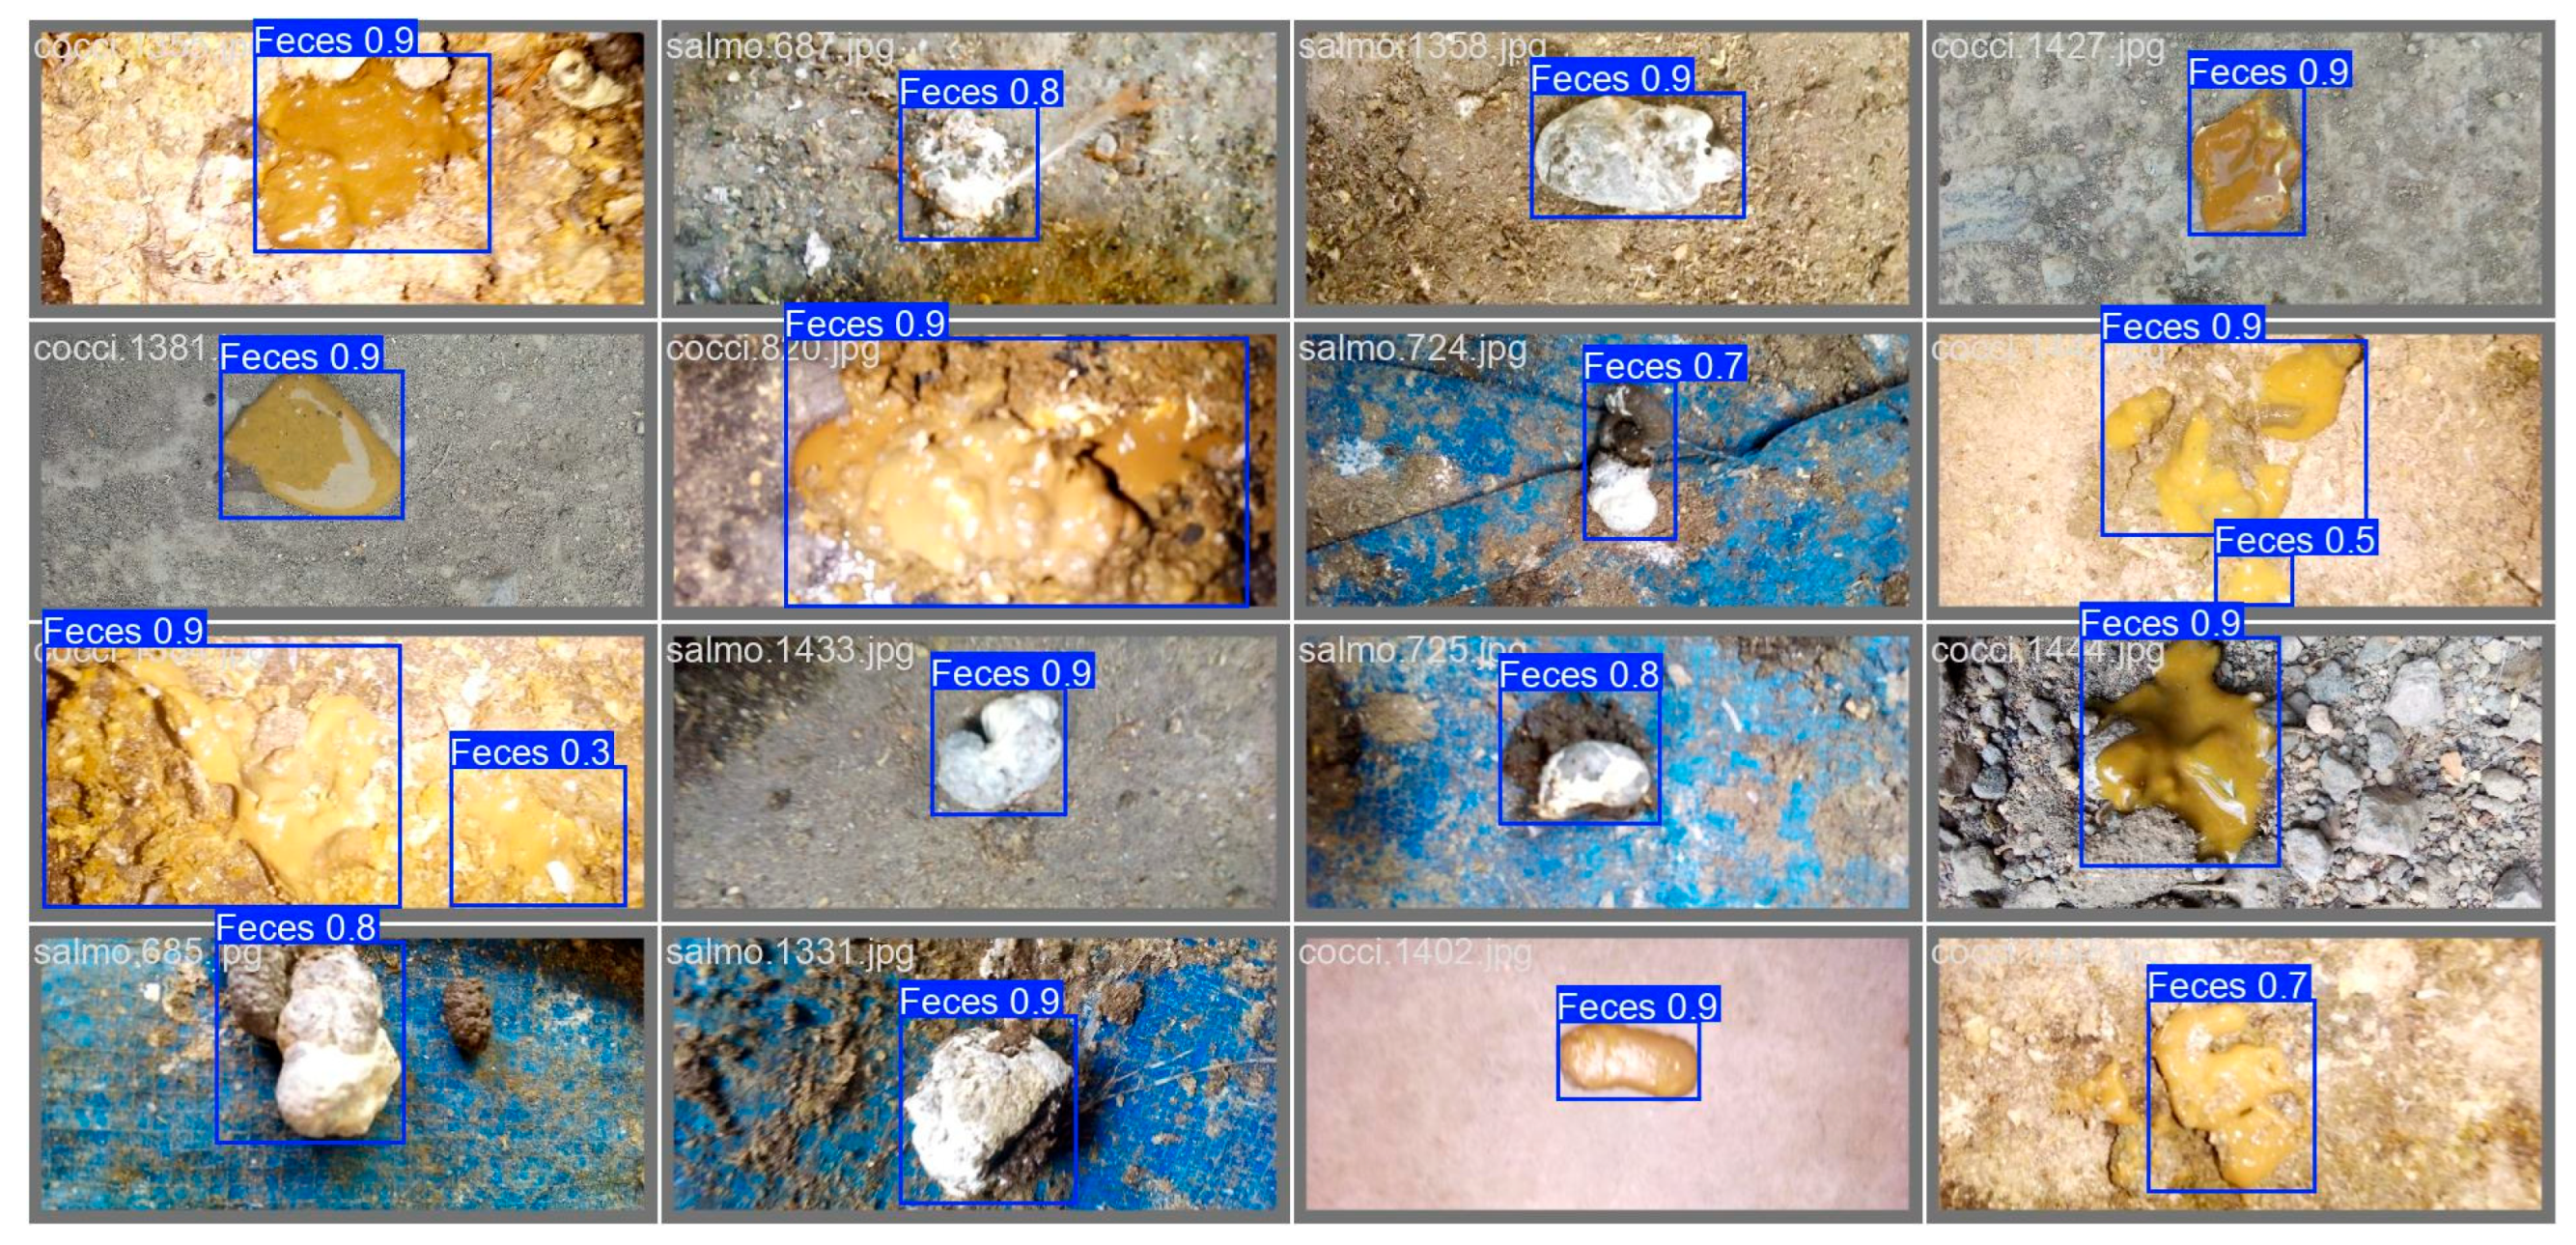
Both YOLO11n and YOLO11x models achieved an mAP@0.5 of 0.881 (Figure 3) for the feces class, indicating well-balanced detection at a 0.5 IoU threshold. Sample detections of the YOLO11n model on different classes of diseases are shown in Figure 3. This high mAP reflects the ability of models to accurately detect feces while minimizing false positives and false negatives, which is essential for the practical applications in poultry house environments. Similarly, the precision and recall scores for both models were high—1.00 and 0.95, respectively. These results suggest that the models consistently detected feces with low false positives (high precision) and very few missed detections (high recall).
All YOLO models had an F1-score of 0.830, reflecting a good tradeoff between precision and recall. This confirms that the models performed consistently well across a range of confidence thresholds, maintaining robustness against both missed detections and incorrect predictions.
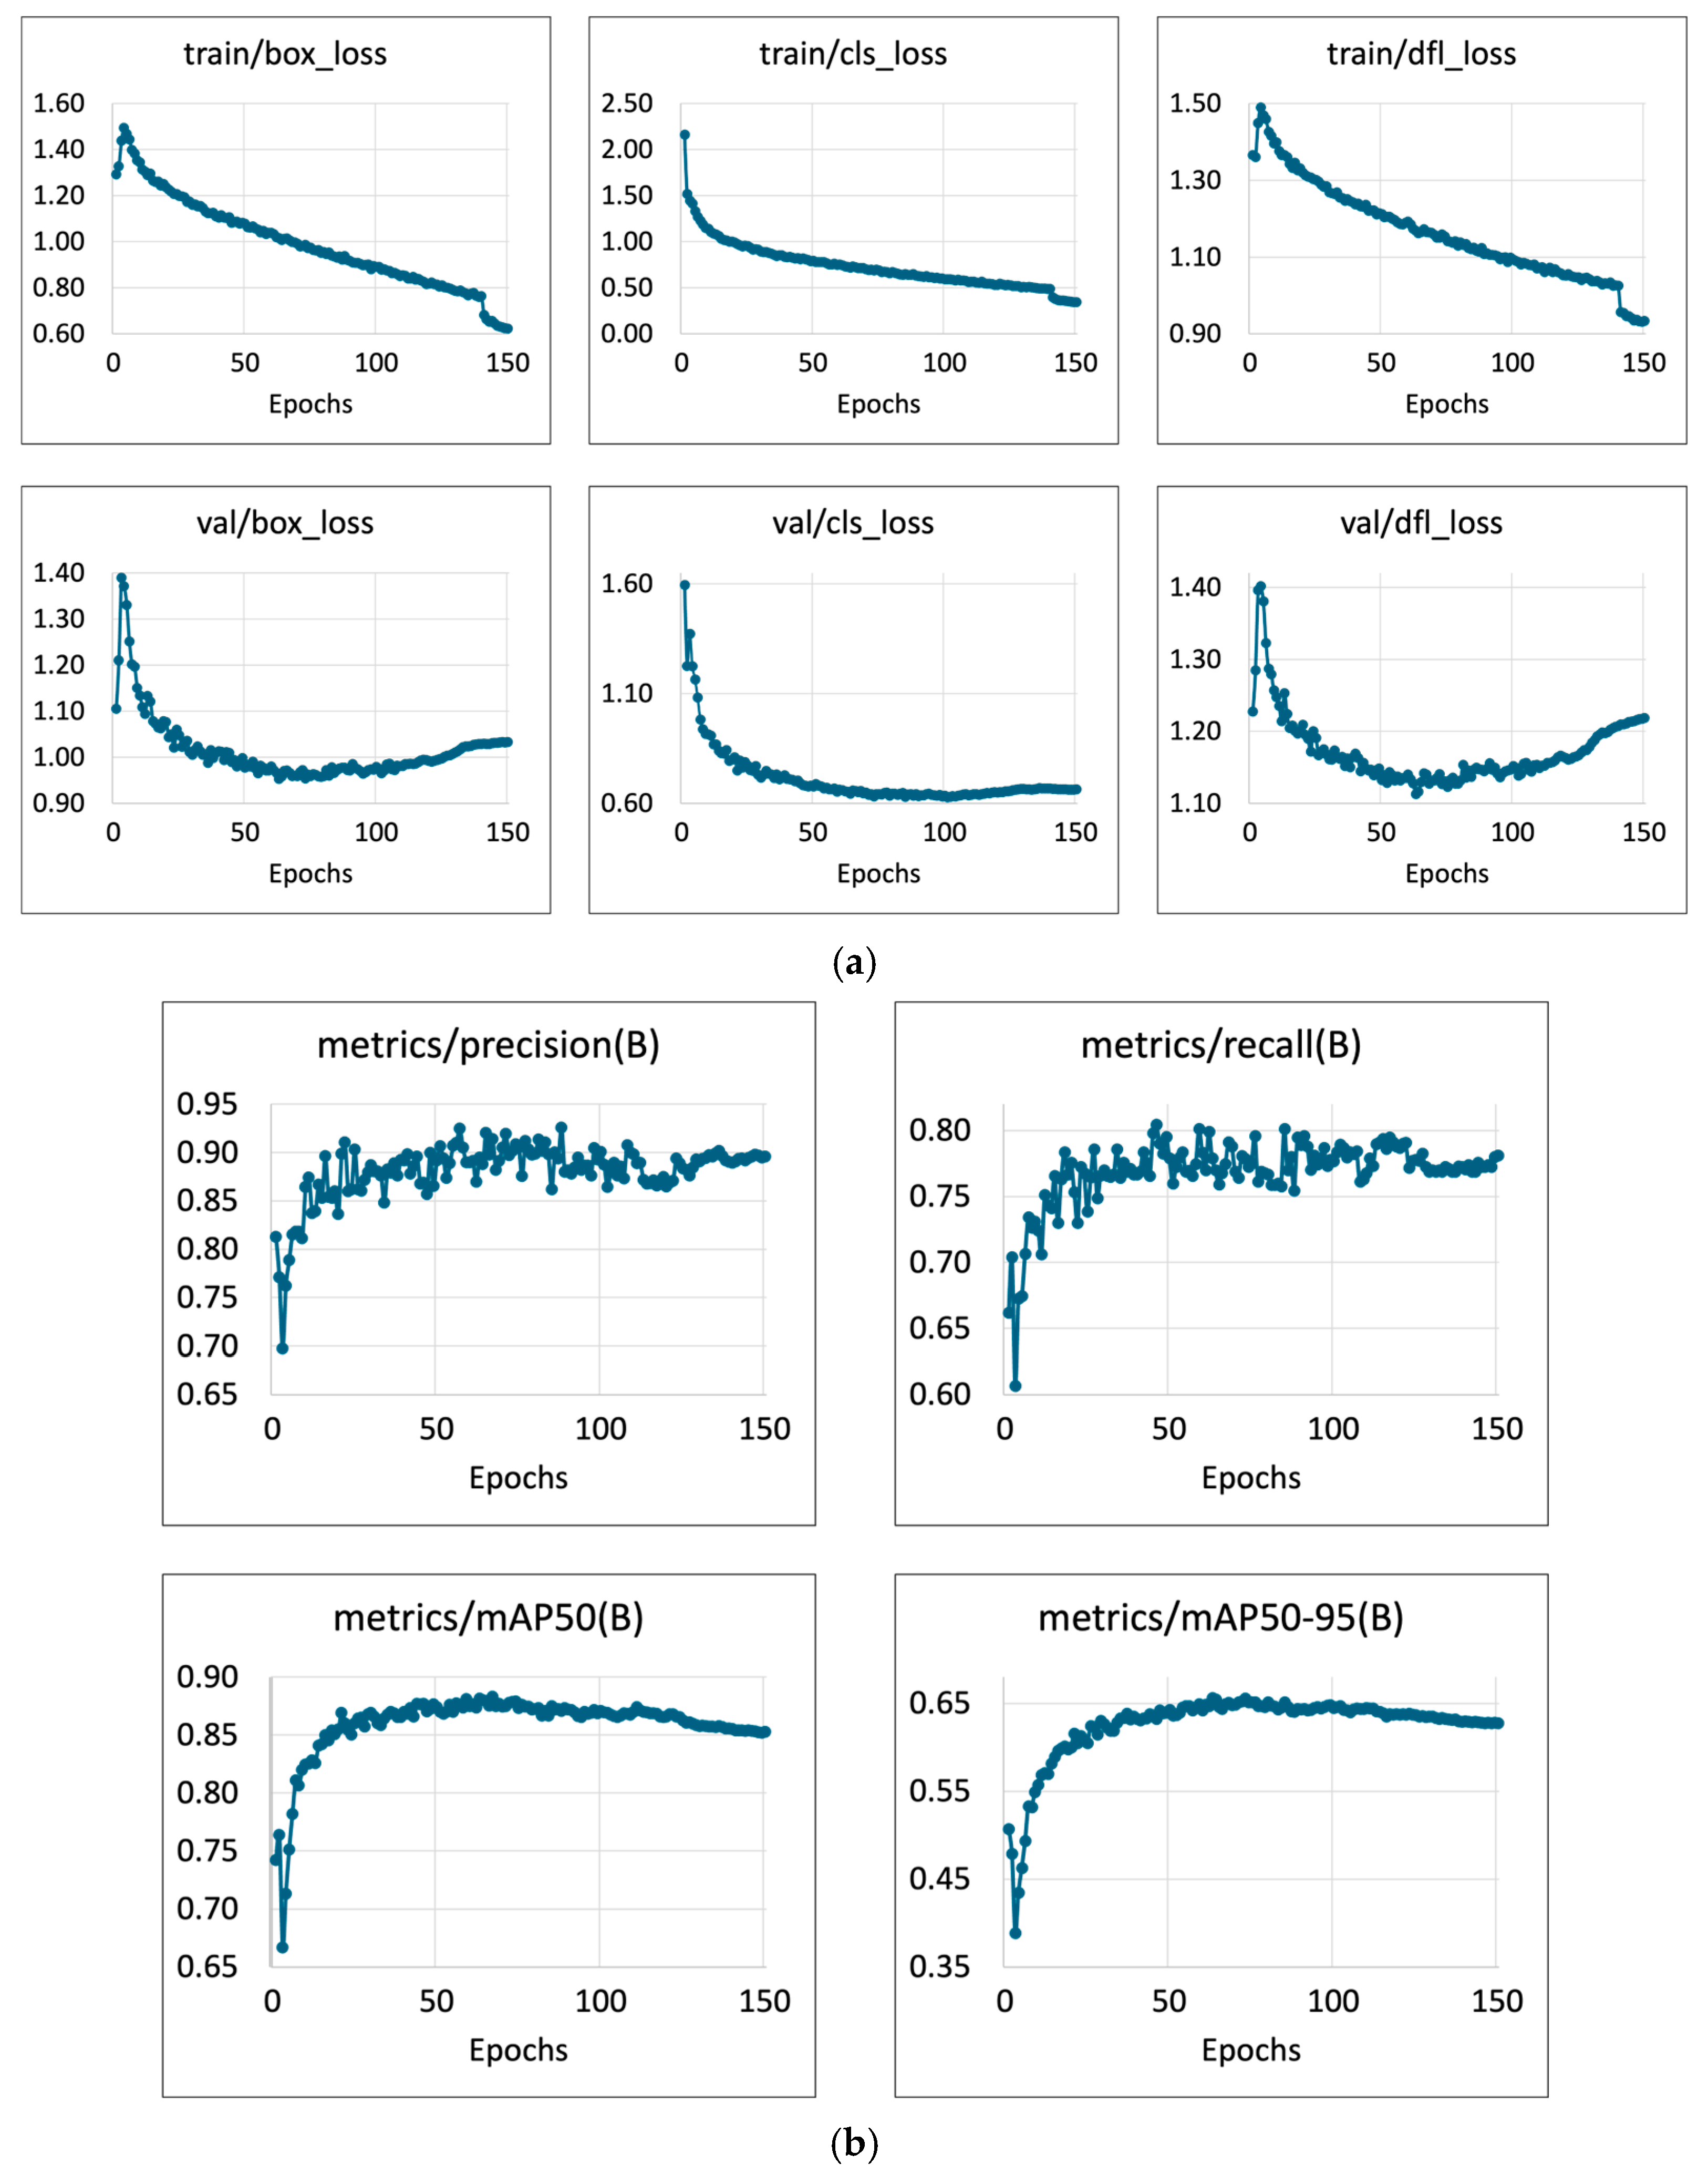
The training and validation loss curves (Figure 4a) for bounding box loss, classification loss, and distribution-focused loss (DFL) show a steady decline over the course of 150 epochs, indicating effective convergence. Precision, recall, and mAP metrics (Figure 4b) also showed progressive improvement, indicating consistent learning during training. However, a notable observation was the increase in validation DFL around 100 epochs, suggesting the onset of overfitting. To mitigate this, early stopping was implemented, which helped prevent further degradation of validation performance. The trends observed in the training phase also align with the final evaluation metrics, where high precision, recall, and F1-scores confirmed the model’s robustness in feces detection.
For detection, YOLO11n achieved equivalent performance metrics as the largest YOLO11x model. This is advantageous for the implementation of disease detection system in real time as the lightweight models require fewer computational resources and provide faster inference speeds. Thus, the selection and deployment of YOLO11n is more practical for resource-limited environments such as web-based or edge applications. This finding is consistent with the prior literature, where lightweight variants like YOLOv8n achieved accuracy comparable to larger models alongside faster inference, as demonstrated by Cordeiro et al. [39] in strawberry quality assessment.

3.2. Disease Classification

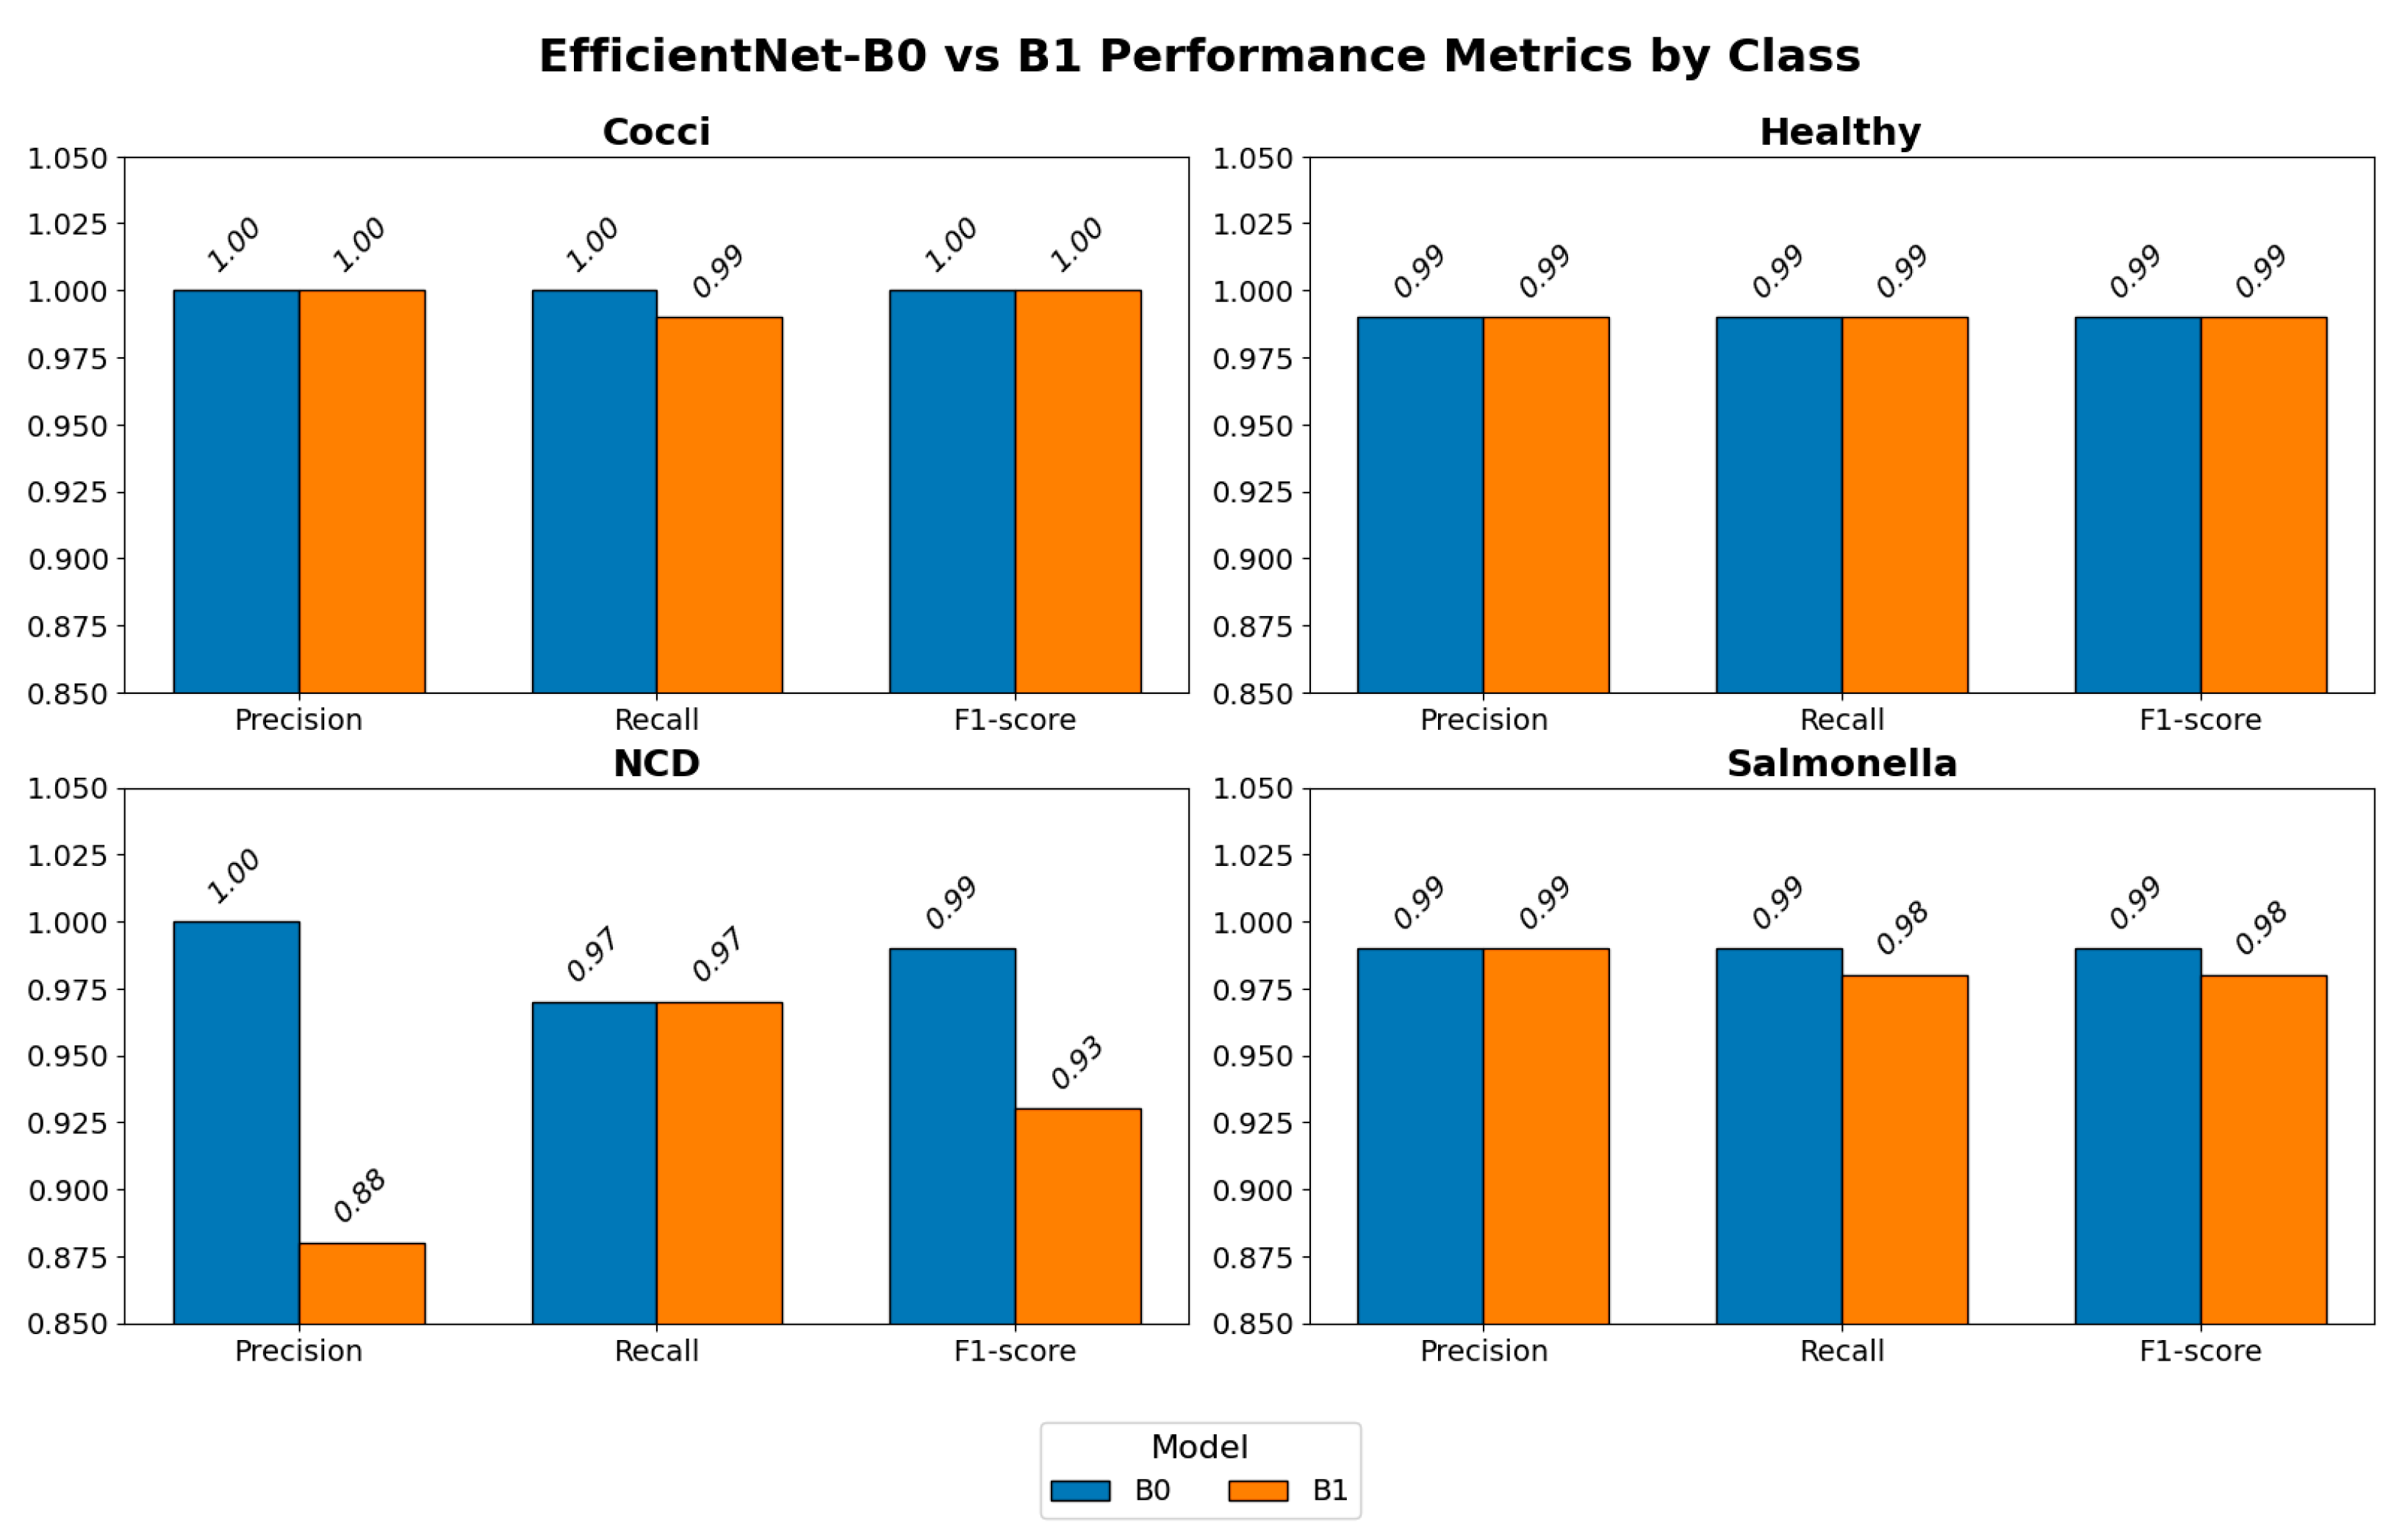
During evaluation, the Efficientnet-B0 model achieved a test accuracy of 99.12% (Figure 5), reflecting its ability to effectively differentiate between various feces classes, including Coccidiosis (Cocci), Healthy, NCD, and Salmonella. The model consistently achieved high levels of precision, recall, and F1-score for most classes, with high performance in Cocci, Healthy, and Salmonella classes.
The EfficientNet-B1 model, in comparison, achieved a slightly lower test accuracy of 98.54% (Figure 5). Although B1 maintained comparable performance across Healthy and Salmonella classes, it showed reduced precision and F1-score for the NCD class, hence suggesting better generalization by the EfficientNet-B0 model.
While earlier studies have shown that larger EfficientNet variants (B3 and B5) can achieve ≥95% classification accuracy for disease detection [40,41], our results suggest that larger models do not necessarily translate to superior performance in fecal image classification. Despite data augmentation, EfficientNet-B0 outperformed the B1 model, especially for the underrepresented NCD class. Furthermore, the drop in precision for the NCD class (0.88 for B1 vs. 1.00 for B0) suggests that the B1 model had higher false positives since precision measures the proportion of true positives against all positive predictions. While recall for NCD remained similar between the two models, the reduced precision highlights the bias of the larger model against the minority class, which may reduce the detection of true NCD prevalence in farm conditions. This also indicates that augmentation alone may be insufficient when the dataset is highly imbalanced. This aligns with reports that larger models tend to become biased toward majority classes, thereby reducing generalization [42].
Recent studies have explored various CNN-based models for poultry disease image classification, with mixed results. For example, Srivastava and Pandey [16] developed a custom CNN to classify fecal images, achieving 93.2% test accuracy. Likewise, Mbelwa et al. [43] reported a validation accuracy of 94% with the XceptionNet CNN. Similarly, Machuve et al. [17] evaluated the off-the-shelf performance of popular CNN architectures like VGG16, InceptionV3, MobileNetV2, and Xception on a similar dataset. Their results showed accuracies between 85% and 95%, which improved to above 95% after fine-tuning. Compared with these approaches, our EfficientNet-B0 model achieved 99.12% test accuracy, suggesting that modern architectures tailored for efficiency can outperform traditional CNNs even without requiring large model sizes. This further supports the use of lightweight, fine-tuned models for resource-constrained environments such as web-based applications.
For practical on-farm applications, performance loss in minority classes such as NCD poses risks of missed detections, which could delay interventions and increase disease spread. Alternative approaches such as undersampling majority classes or oversampling minority classes [44], class weight adjustment [45], and synthetic data generation through Generative Adversarial Networks (GANs) or advanced augmentation techniques like Mixup [46,47] may improve minority-class performance. However, publicly available poultry feces datasets are limited, often skewed towards certain conditions [30] or lack explicit disease categorization [48]. Two steps are therefore necessary: (i) expanding datasets through new data collection efforts that are representative of diverse geographical and management conditions and/or (ii) leveraging generative approaches to synthetically generate minority classes training data when the first option is not viable. Moreover, expansion of datasets beyond the current scope of Coccidiosis, Salmonellosis, and NCD is critical for broader disease coverage.

3.3. Model Selection

For detection model, YOLO11n showed a strong detection performance, similar to that of YOLO11x. However, YOLO11n has a lower computational requirement, making it well-suited for resource-constrained environments like web-based platforms. Its smaller architecture reduces latency, improves inference speed, and requires less computational power, aligning well with the goal of creating a responsive fecal analysis system that can be accessed from a standard web interface.
EfficientNet-B0 was selected as the primary classification backbone for the integrated feces detection and disease classification platform due to its strong overall performance, lower computational requirements, and balanced accuracy across multiple classes.

3.4. Web App and User Interface (UI)

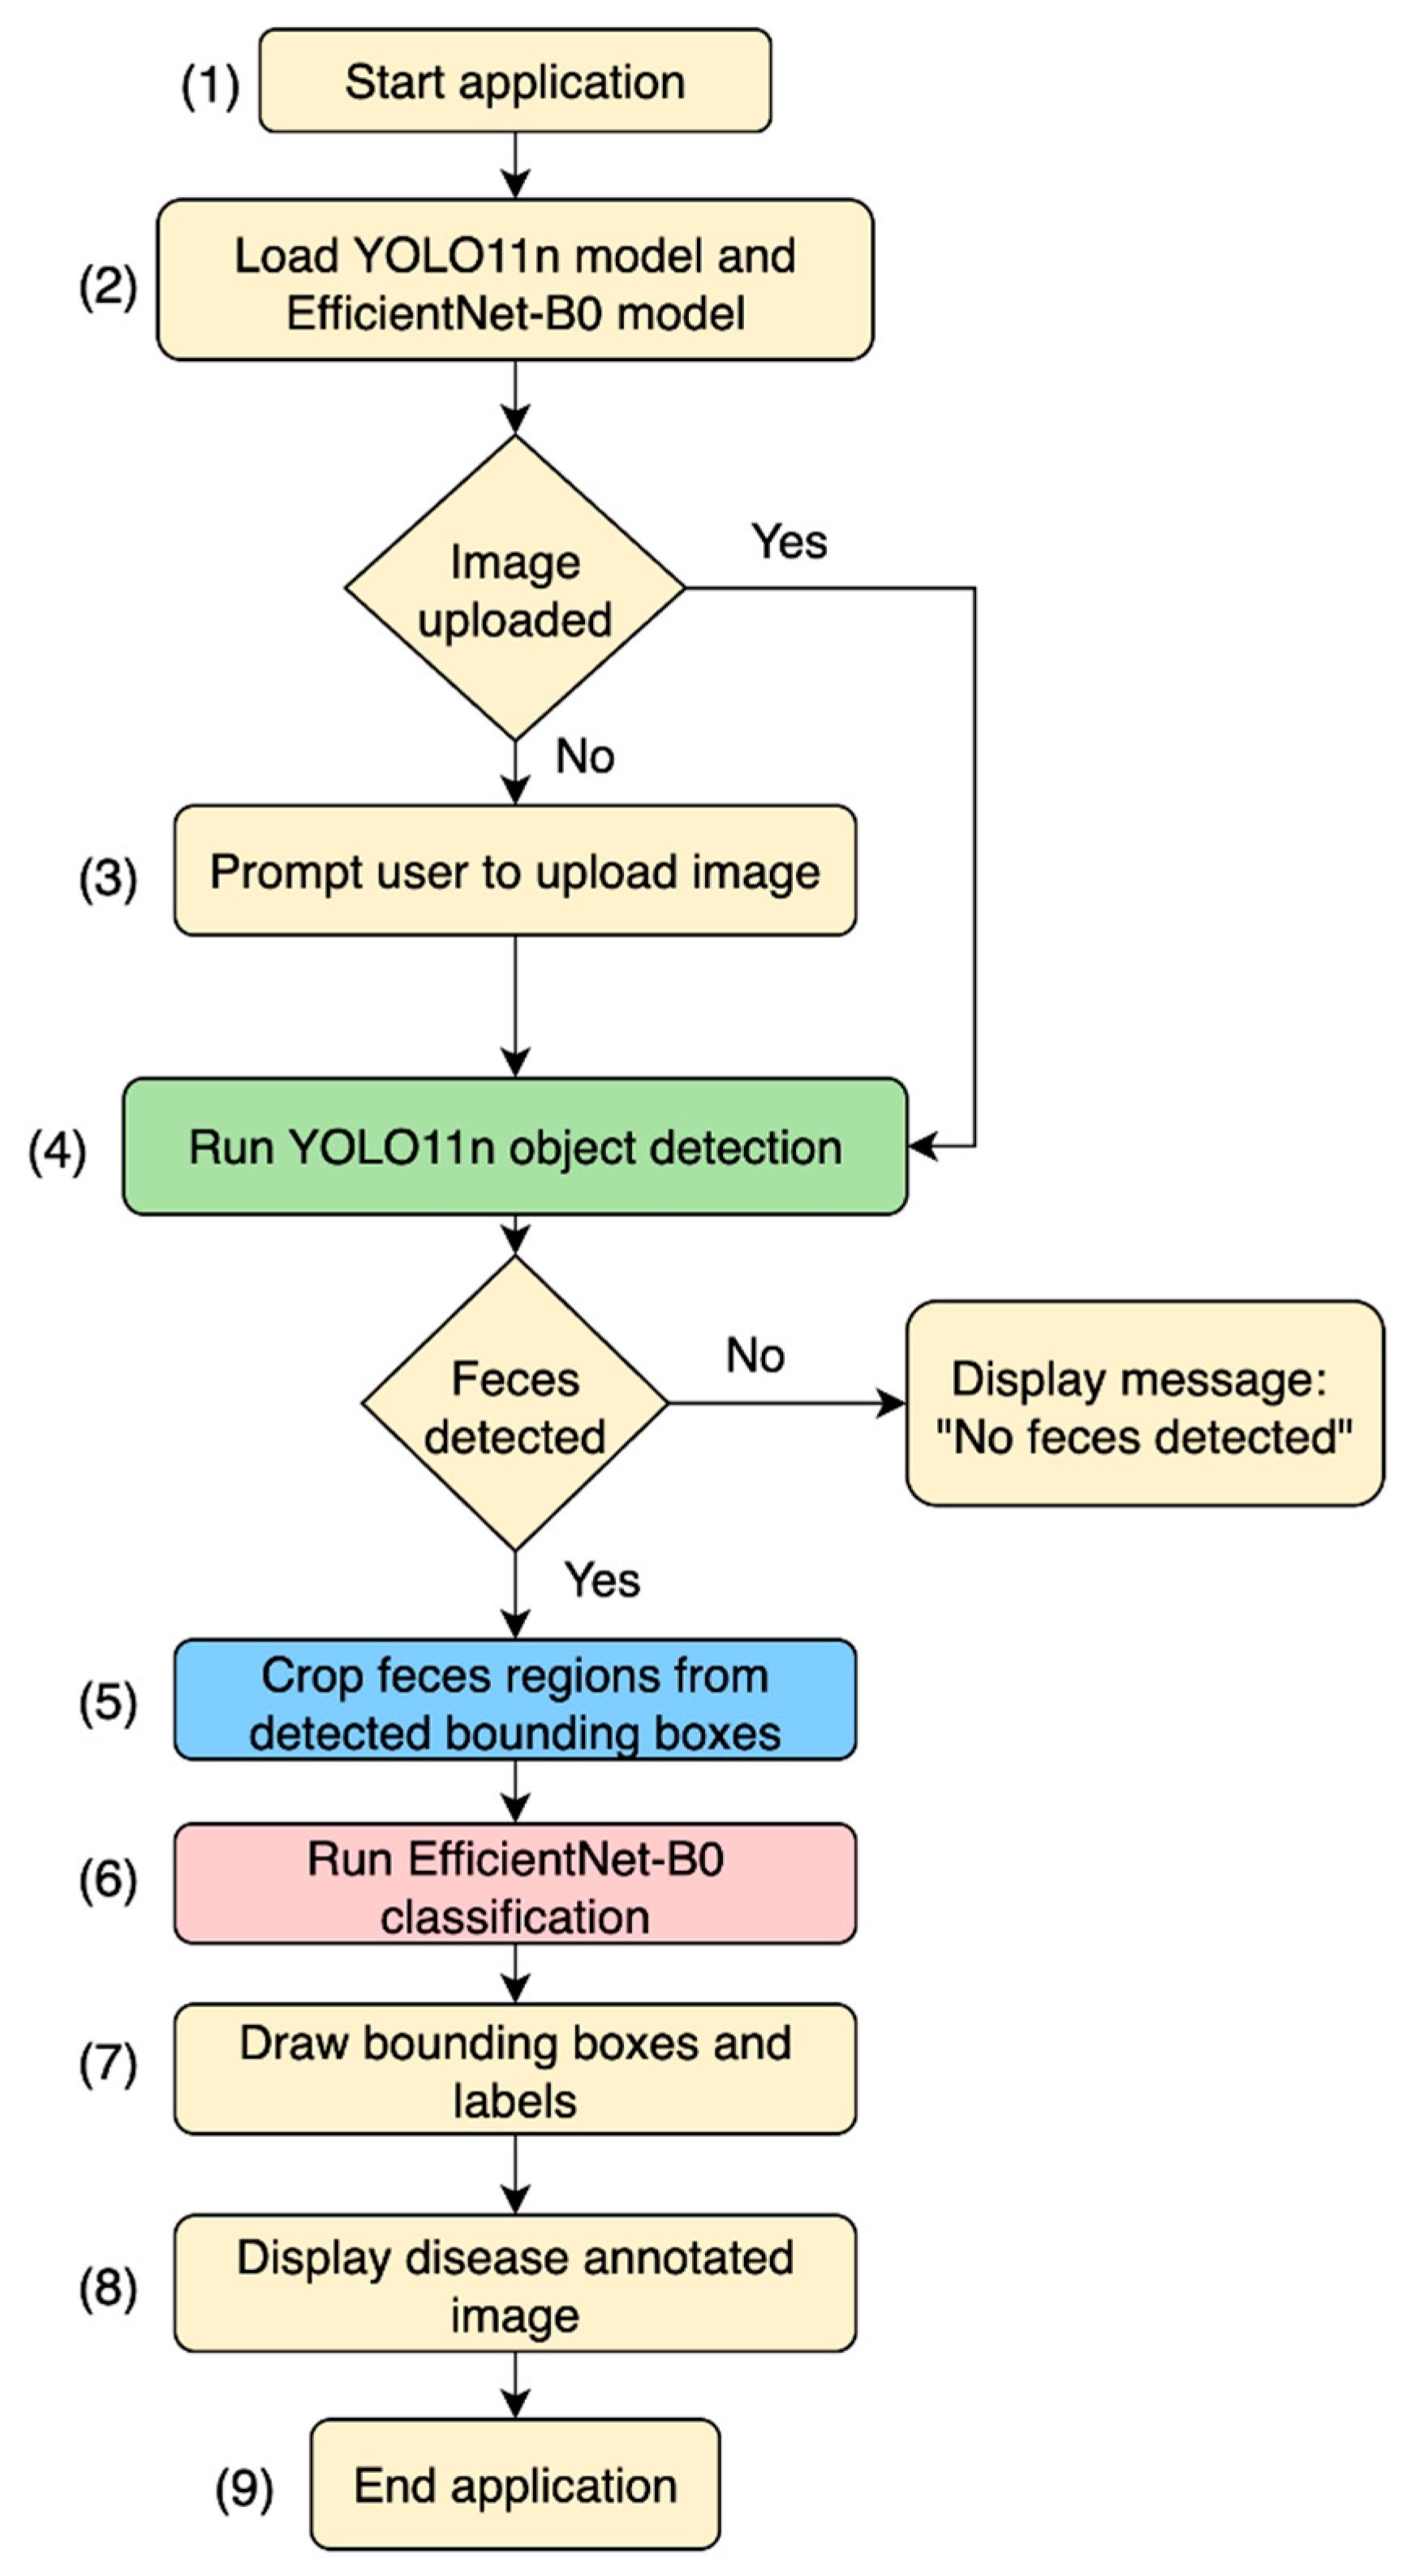
The integrated web application was built and deployed using Streamlit (Version 1.41.0), which is an open-source Python language-based framework that does not require complex web development skills. This allowed us to focus on implementing the study results in a user friendly manner. The workflow of the developed web app is shown in Figure 6.
The deployment of the models as a single web application also allowed the trained YOLO11n and EfficientNet-B0 models to operate within a single workflow accessible via a web browser. The deployment followed a modular structure: (i) YOLO11n detects and crops fecal regions, (ii) EfficientNet-B0 classifies the cropped images into disease categories, and (iii) results are displayed with bounding boxes, labels, and confidence scores. This workflow was containerized within the Streamlit framework, meaning that model weights, image preprocessing, and visualization functions were all embedded into the deployed application.
For testing purposes, the application was deployed to the Streamlit Cloud. This environment automatically handled server setup, dependencies, and hosting, making the system publicly accessible without specialized infrastructure. While the free tier provided limited computational resources (maximum of 2.7 GB of memory and 2 CPU cores), it was sufficient to demonstrate full functionality and user accessibility. Importantly, the deployment allows the system to easily scale to GPU-backed cloud services or run on local machines with GPU support, ensuring adaptability for real-world use.
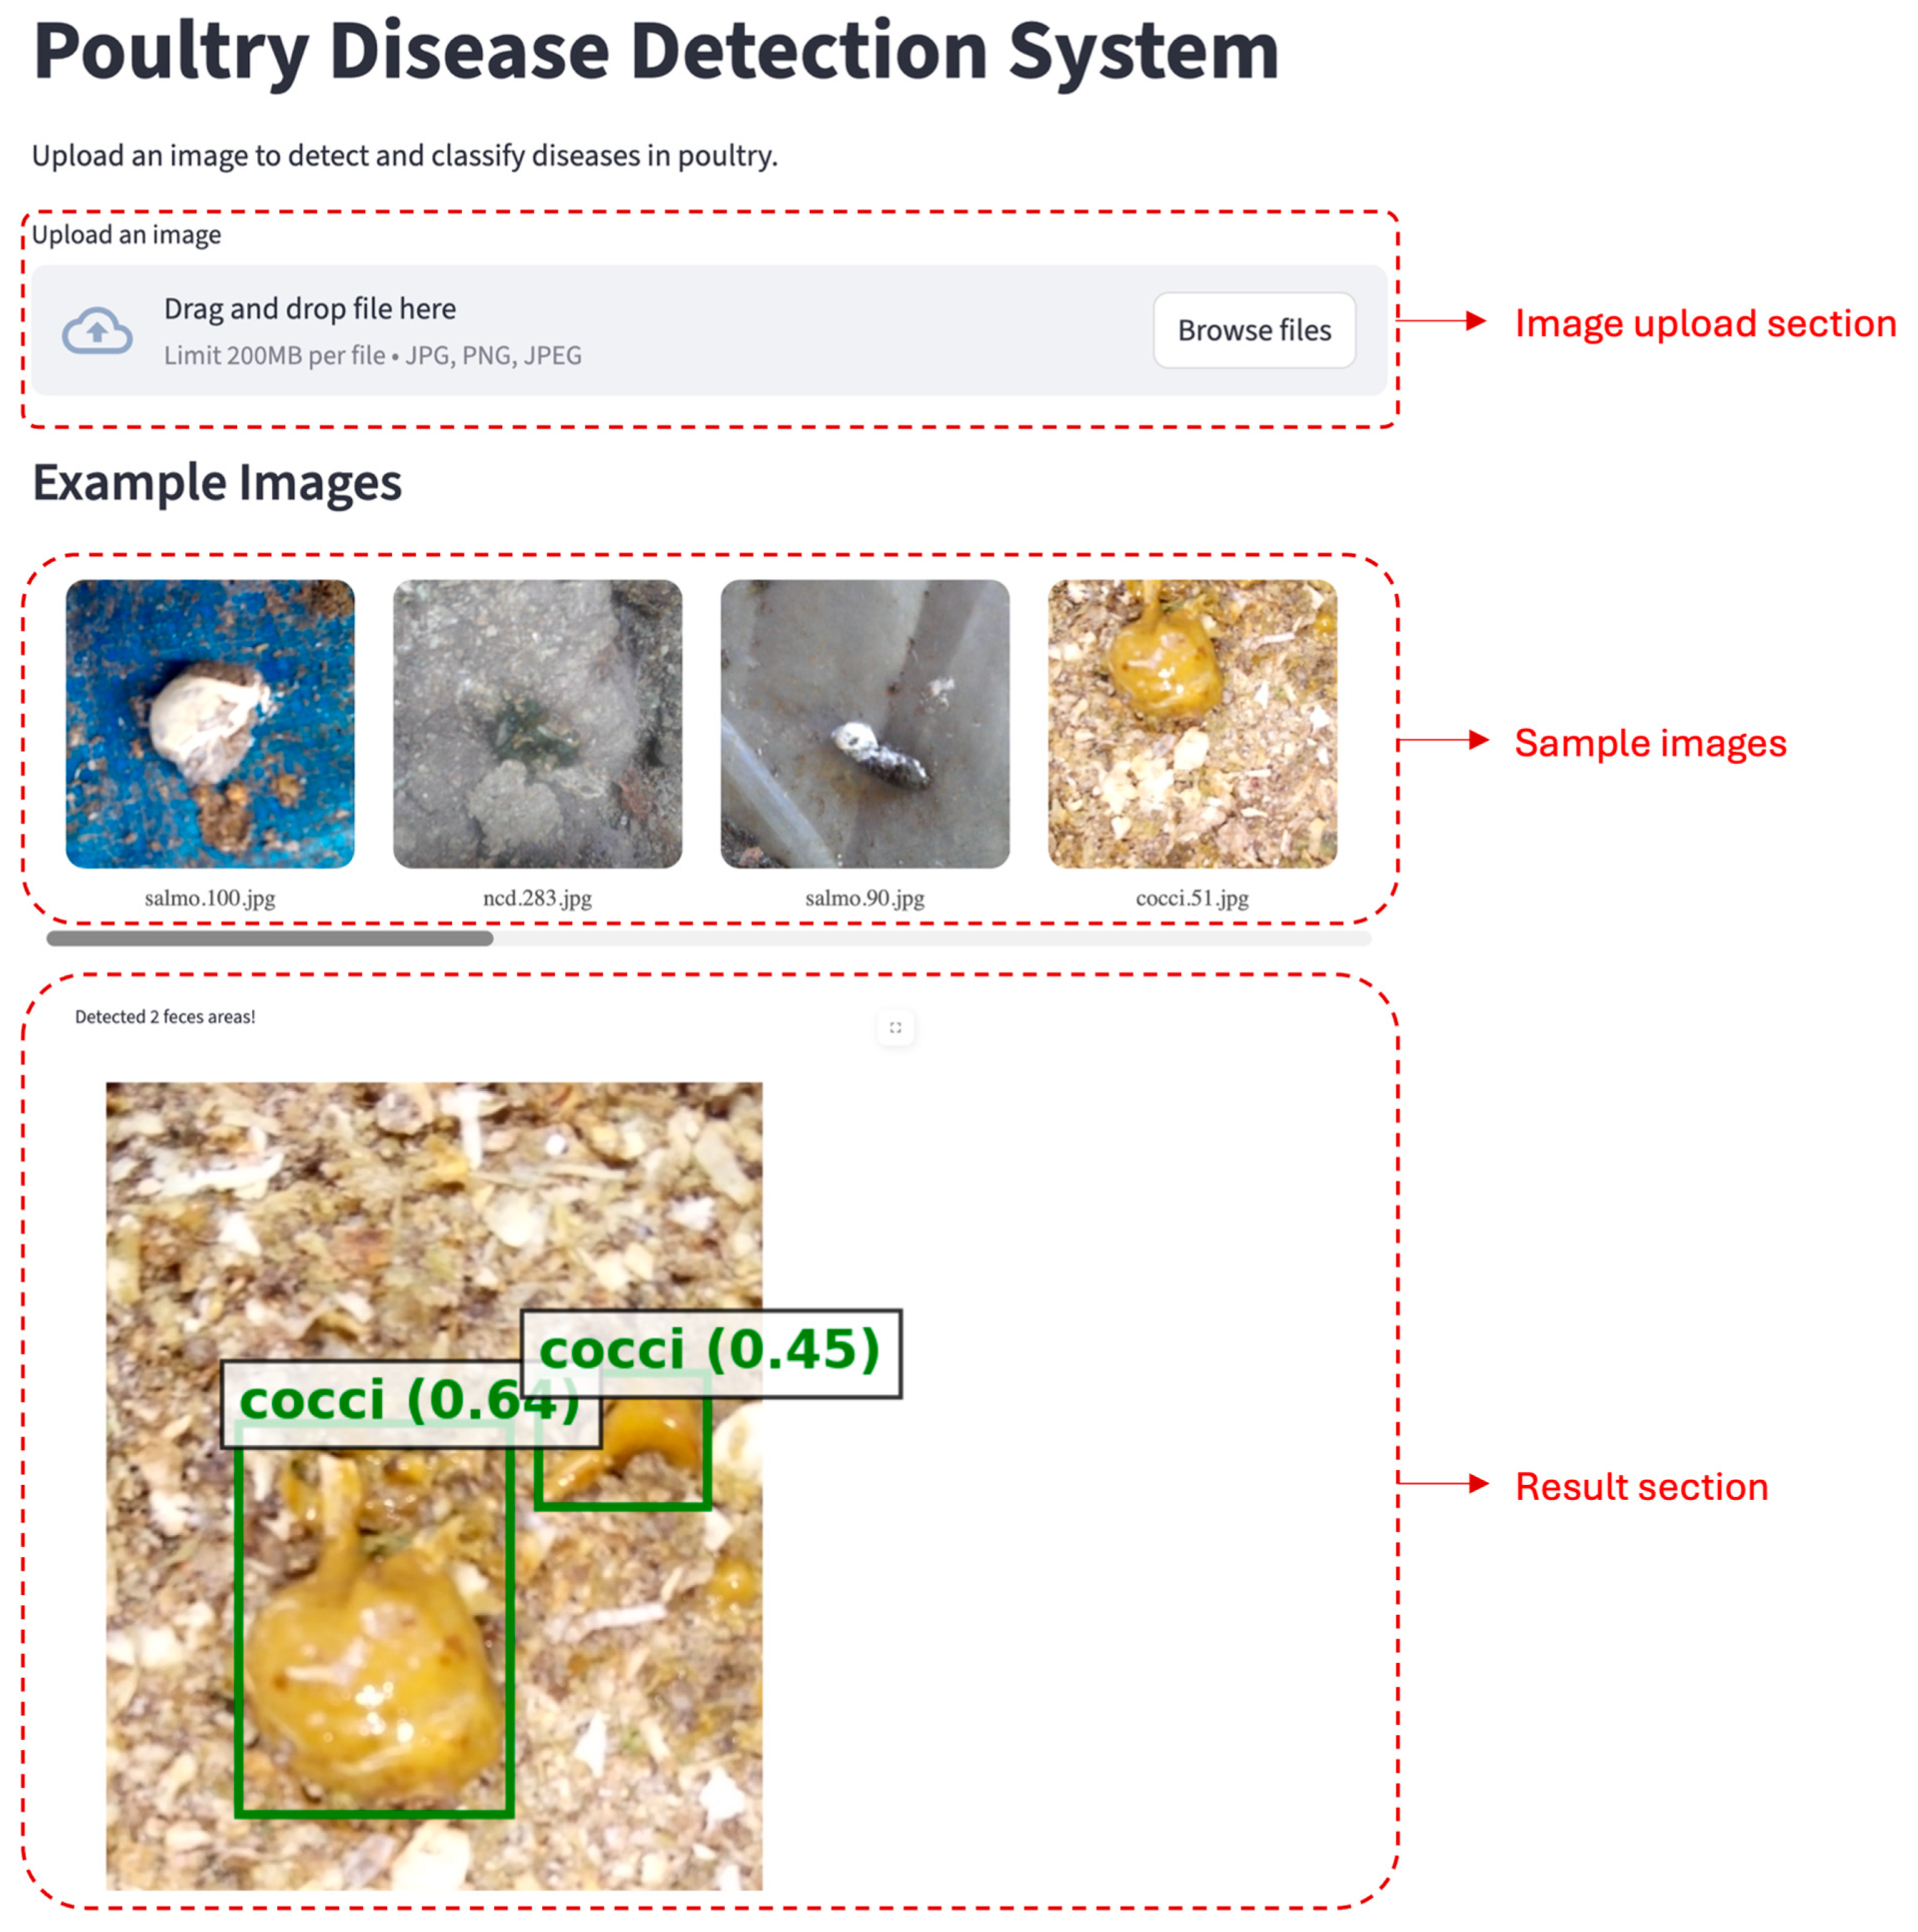
The UI of the application is simple and intuitive, where users can upload fecal images directly (example shown in Figure 6) or select from sample images to test the system. The application then outputs annotated images with bounding boxes, corresponding labels, and disease predictions. Figure 7 shows the UI and annotated output for a test image.

3.5. System Performance

The workflow was benchmarked on an NVIDIA RTX 4000 Ada GPU (NVIDIA, Santa Clara, CA, USA) using 1361 test images. On average, image processing required 25.8 milliseconds (ms) per image, broken into three steps: detection (17.6 ms), cropping/preprocessing (3.5 ms), and classification (4.7 ms). These results indicate that the system can operate at near real-time speeds. However, the actual performance of the web application may vary depending on the hardware resources available during deployment.
In our study, no field experiments were carried out to test the robustness of the developed system under farm conditions. With limited variation in the dataset, a small number of samples for the NCD class, and only the four categories, the generalizability of the model is likely constrained. This aligns with Chidziwisano et al. [49], who found that CNN models trained on a fecal image dataset showed reduced accuracy when tested on unseen data from another region, highlighting the challenge of generalizability. Real-world conditions often introduce additional sources of variability such as lighting changes, different bedding materials, fecal consistency differences, and farm management practices, which were not fully represented in the dataset used in this study. Although a low inference time across the workflow demonstrated feasibility for practical use, further field-based evaluations are needed. Future work will focus on validating the system in farm settings and across a broader range of poultry diseases to ensure the robustness of disease detection.

4. Conclusions

This study introduces a web-based application powered by deep learning models to detect poultry feces and classify them for signs of disease. We evaluated YOLO detection models and EfficientNet classification models within a detect–crop–classify pipeline. Among the detection models, YOLO11n was selected over YOLO11x despite both achieving a high mAP of 0.881, as YOLO11n offers faster inference with lower computational demand, making it more suitable for real-time applications. For classification, EfficientNet-B0 slightly outperformed the B1 variant, reaching 99.12% accuracy on the test dataset.
The integrated pipeline achieved a mean processing time of 25.8 ms per image (17.6 ms for detection, 3.5 ms for cropping, and 4.7 ms for classification), demonstrating the feasibility of near real-time monitoring in farm environments. While detection and classification performance was strong, the dataset used may not fully capture the diversity of fecal characteristics under varying regional and management conditions. This limitation suggests that further expansion of datasets—both in scale and geographic diversity—will be necessary to enhance the model’s robustness and generalizability.

Author Contributions

Methodology: A.D. and L.C.; software: A.D.; validation, A.D.; formal analysis, A.D.; investigation: A.D., X.Y., B.P., S.D., G.L. and L.C.; resources: L.C.; writing—original draft, A.D., X.Y., B.P., S.D., G.L. and L.C.; supervision: L.C.; supervision, L.C.; project administration, L.C.; funding acquisition, L.C. All authors have read and agreed to the published version of the manuscript.

Funding

This research was funded by the USDA-NIFA AFRI (2023-68008-39853), Georgia Research Alliance (Venture Fund), and UGA Institute for Integrative Precision Agriculture.

Data Availability Statement

The data presented in this study are available upon reasonable request to the corresponding author.

Conflicts of Interest

The authors declare no conflicts of interest.

References

  1. USDA-NASS. Poultry—Production and Value, 2024 Summary; USDA: Washington, DC, USA, 2025.
  2. Blake, D.P.; Knox, J.; Dehaeck, B.; Huntington, B.; Rathinam, T.; Ravipati, V.; Ayoade, S.; Gilbert, W.; Adebambo, A.O.; Jatau, I.D. Re-calculating the cost of coccidiosis in chickens. Vet. Res. 2020, 51, 115. [Google Scholar] [CrossRef] [PubMed]
  3. Gast, R.; Jones, D.; Guraya, R.; Anderson, K.; Karcher, D. Research Note: Horizontal transmission and internal organ colonization by Salmonella Enteritidis and Salmonella Kentucky in experimentally infected laying hens in indoor cage-free housing. Poult. Sci. 2020, 99, 6071–6074. [Google Scholar] [CrossRef]
  4. Hoorebeke, S.; Immerseel, F.; Haesebrouck, F.; Ducatelle, R.; Dewulf, J. The Influence of the Housing System on Salmonella Infections in Laying Hens: A Review. Zoonoses Public Health 2011, 58, 304–311. [Google Scholar] [CrossRef]
  5. Hartcher, K.; Jones, B. The Welfare of Layer Hens in Cage and Cage-Free Housing Systems. World S Poult. Sci. J. 2017, 73, 767–782. [Google Scholar] [CrossRef]
  6. Caputo, V.; Staples, A.J.; Tonsor, G.T.; Lusk, J.L. Egg producer attitudes and expectations regarding the transition to cage-free production: A mixed-methods approach. Poult. Sci. 2023, 102, 103058. [Google Scholar] [CrossRef] [PubMed]
  7. Lusk, J.L. Consumer preferences for cage-free eggs and impacts of retailer pledges. Agribusiness 2019, 35, 129–148. [Google Scholar] [CrossRef]
  8. Nezworski, J.; St. Charles, K.; Malladi, S.; Ssematimba, A.; Bonney, P.; Cardona, C.; Halvorson, D.; Culhane, M. A Retrospective Study of Early vs. Late Virus Detection and Depopulation on Egg Laying Chicken Farms Infected with Highly Pathogenic Avian Influenza Virus During the 2015 H5N2 Outbreak in the United States. Avian Dis. 2021, 65, 474–482. [Google Scholar] [CrossRef]
  9. Wen, J.; Gou, H.; Zhan, Z.; Gao, Y.; Chen, Z.; Bai, J.; Wang, S.; Chen, K.; Lin, Q.; Liao, M.; et al. A Rapid Novel Visualized Loop-Mediated Isothermal Amplification Method for Salmonella Detection Targeting at fimW Gene. Poult. Sci. 2020, 99, 3637–3642. [Google Scholar] [CrossRef]
  10. Butt, S.L.; Taylor, T.L.; Volkening, J.D.; Dimitrov, K.M.; Williams-Coplin, D.; Lahmers, K.K.; Miller, P.J.; Rana, A.M.; Suarez, D.L.; Afonso, C.L.; et al. Rapid virulence prediction and identification of Newcastle disease virus genotypes using third-generation sequencing. Virol. J. 2018, 15, 179. [Google Scholar] [CrossRef] [PubMed]
  11. Lee, Y.; Lillehoj, H.S. Development of a new immunodiagnostic tool for poultry coccidiosis using an antigen-capture sandwich assay based on monoclonal antibodies detecting an immunodominant antigen of Eimeria. Poult. Sci. 2023, 102, 102790. [Google Scholar] [CrossRef]
  12. Mesa-Pineda, C.; Navarro-Ruiz, J.L.; López-Osorio, S.; Chaparro-Gutiérrez, J.J.; Gómez-Osorio, L.M. Chicken Coccidiosis: From the Parasite Lifecycle to Control of the Disease. Front. Vet. Sci. 2021, 8, 787653. [Google Scholar] [CrossRef] [PubMed]
  13. Damerow, G. The Chicken Health Handbook; Storey Communications: London, UK, 1994. [Google Scholar]
  14. Morishita, T.Y.; Porter, R.E., Jr. Gastrointestinal and hepatic diseases. In Backyard Poultry Medicine and Surgery: A Guide for Veterinary Practitioners; Wiley-Blackwell: Hoboken, NJ, USA, 2021; pp. 289–316. [Google Scholar]
  15. Janiesch, C.; Zschech, P.; Heinrich, K. Machine learning and deep learning. Electron. Mark. 2021, 31, 685–695. [Google Scholar] [CrossRef]
  16. Srivastava, K.; Pandey, P. Deep Learning Based Classification of Poultry Disease. Int. J. Autom. Smart Technol. 2023, 13, 2439. [Google Scholar] [CrossRef]
  17. Machuve, D.; Nwankwo, E.; Mduma, N.; Mbelwa, J. Poultry diseases diagnostics models using deep learning. Front. Artif. Intell. 2022, 5, 733345. [Google Scholar] [CrossRef]
  18. Liu, X.; Zhou, Y.; Liu, Y. Poultry Disease Identification Based on Light Weight Deep Neural Networks. In Proceedings of the 2023 IEEE 3rd International Conference on Computer Communication and Artificial Intelligence (CCAI), Taiyuan, China, 26–28 May 2023; pp. 92–96. [Google Scholar]
  19. Wati, D.F.; Roestam, R. Poultry Disease Detection in Chicken Fecal Images Through Annotated Polymerase Chain Reaction Dataset Using YOLOv7 And Soft-Nms Algorithm. In Proceedings of the 2023 Eighth International Conference on Informatics and Computing (ICIC), Manado, Indonesia, 8–9 December 2023; pp. 1–7. [Google Scholar] [CrossRef]
  20. Li, G.; Gates, R.S.; Ramirez, B.C. An on-site feces image classifier system for chicken health assessment: A proof of concept. Appl. Eng. Agric. 2023, 39, 417–426. [Google Scholar] [CrossRef]
  21. Sophia, S.; Gladson, J.J. Human Behaviour and Abnormality Detection using YOLO and Conv2D Net. In Proceedings of the 2024 International Conference on Inventive Computation Technologies (ICICT), Lalitpur, Nepal, 24–26 April 2024; pp. 70–75. [Google Scholar] [CrossRef]
  22. Hussain, M. YOLOv1 to v8: Unveiling Each Variant–A Comprehensive Review of YOLO. IEEE Access 2024, 12, 42816–42833. [Google Scholar] [CrossRef]
  23. Redmon, J.; Divvala, S.; Girshick, R.; Farhadi, A. You only look once: Unified, real-time object detection. arXiv 2016, arXiv:1506.02640. [Google Scholar] [CrossRef]
  24. Tan, M.; Le, Q. Efficientnet: Rethinking model scaling for convolutional neural networks. In Proceedings of the International Conference on Machine Learning, Long Beach, CA, USA, 9–15 June 2019; pp. 6105–6114. [Google Scholar]
  25. Costa, A.; Da Silva, F.A.; Rios, R. Deep Learning-Based Transfer Learning for Classification of Cassava Disease. arXiv 2025, arXiv:2502.19351. [Google Scholar]
  26. Sufian, M.A.; Hamzi, W.; Zaman, S.; Alsadder, L.; Hamzi, B.; Varadarajan, J.; Azad, M.A.K. Enhancing Clinical Validation for Early Cardiovascular Disease Prediction through Simulation, AI, and Web Technology. Diagnostics 2024, 14, 1308. [Google Scholar] [CrossRef] [PubMed]
  27. Warbhe, M.K.; Bore, J.J.; Chaudari, S.N. A Deep Learning Based System to Predict the Plant Disease Using Streamlit. In Proceedings of the 2025 4th International Conference on Sentiment Analysis and Deep Learning (ICSADL), Bhimdatta, Nepal, 18–20 February 2025; pp. 1744–1751. [Google Scholar]
  28. Depuru, B.K.; Putsala, S.; Mishra, P. Automating poultry farm management with artificial intelligence: Real-time detection and tracking of broiler chickens for enhanced and efficient health monitoring. Trop. Anim. Health Prod. 2024, 56, 75. [Google Scholar] [CrossRef]
  29. Lu, H.; Yao, C.; An, L.; Song, A.; Ling, F.; Huang, Q.; Cai, Y.; Liu, Y.; Kang, D. Classification and identification of chicken-derived adulteration in pork patties: A multi-dimensional quality profile and machine learning-based approach. Food Control 2025, 176, 111381. [Google Scholar] [CrossRef]
  30. Machuve, D.; Nwankwo, E.; Lyimo, E.; Maguo, E.; Munisi, C. Machine learning dataset for poultry diseases diagnostics-PCR annotated. Zenodo 2021. Available online: https://zenodo.org/records/5801834 (accessed on 1 May 2025).
  31. Cubuk, E.; Zoph, B.; Mané, D.; Vasudevan, V.; Le, Q. AutoAugment: Learning Augmentation Strategies From Data. In Proceedings of the 2019 IEEE/CVF Conference on Computer Vision and Pattern Recognition (CVPR), Long Beach, CA, USA, 15–20 June 2019; pp. 113–123. [Google Scholar] [CrossRef]
  32. Khanam, R.; Hussain, M. Yolov11: An overview of the key architectural enhancements. arXiv 2024, arXiv:2410.17725. [Google Scholar] [CrossRef]
  33. Afaq, S.; Rao, S. Significance of epochs on training a neural network. Int. J. Sci. Technol. Res 2020, 9, 485–488. [Google Scholar]
  34. Sandler, M.; Howard, A.; Zhu, M.; Zhmoginov, A.; Chen, L.-C. Mobilenetv2: Inverted residuals and linear bottlenecks. In Proceedings of the IEEE Conference on Computer Vision and Pattern Recognition, Salt Lake City, UT, USA, 18–23 June 2018; pp. 4510–4520. [Google Scholar]
  35. Hu, J.; Shen, L.; Sun, G. Squeeze-and-excitation networks. In Proceedings of the IEEE Conference on Computer Vision and Pattern Recognition, Salt Lake City, UT, USA, 18–23 June 2018; pp. 7132–7141. [Google Scholar]
  36. Hoang, V.-T.; Jo, K. Practical Analysis on Architecture of EfficientNet. In Proceedings of the 2021 14th International Conference on Human System Interaction (HSI), Gdańsk, Poland, 8–10 July 2021; pp. 1–4. [Google Scholar] [CrossRef]
  37. Hastomo, W.; Karno, A.S.B.; Arif, D.; Wardhana, I.S.K.; Kamilia, N.; Yulianto, R.; Digdoyo, A.; Surawan, T. Brain Tumor Classification Using Four Versions of EfficientNet. Insearch Inf. Syst. Res. J. 2023, 3, 16–23. [Google Scholar] [CrossRef]
  38. Rosadi, M.I.; Hakim, L. Classification of Coffee Leaf Diseases using the Convolutional Neural Network (CNN) EfficientNet Model. Conf. Ser. 2023, 4, 58–69. [Google Scholar] [CrossRef]
  39. Cordeiro, L.D.; Nääs, I.D.; Okano, M.T. Smart Postharvest Management of Strawberries: YOLOv8-Driven Detection of Defects, Diseases, and Maturity. AgriEngineering 2025, 7, 246. [Google Scholar] [CrossRef]
  40. Singh, R.; Sharma, N.; Chauhan, R.; Choudhary, A.; Gupta, R. Precision kidney disease classification using efficientnet-b3 and ct imaging. In Proceedings of the 2023 3rd International Conference on Smart Generation Computing, Communication and Networking (SMART GENCON), Bangalore, India, 29–31 December 2023; pp. 1–6. [Google Scholar]
  41. Verma, G. Chicken Disease Detection: A Deep Learning Approach. In Proceedings of the 2024 Second International Conference on Intelligent Cyber Physical Systems and Internet of Things (ICoICI), Coimbatore, India, 28–30 August 2024; pp. 725–729. [Google Scholar]
  42. Kumar, P.; Bhatnagar, R.; Gaur, K.; Bhatnagar, A. Classification of Imbalanced Data: Review of Methods and Applications. IOP Conf. Ser. Mater. Sci. Eng. 2021, 1099, 012077. [Google Scholar] [CrossRef]
  43. Mbelwa, H.; Mbelwa, J.; Machuve, D. Deep Convolutional Neural Network for Chicken Diseases Detection. Int. J. Adv. Comput. Sci. Appl. 2021, 12, 759–765. [Google Scholar] [CrossRef]
  44. Mohammed, R.; Rawashdeh, J.; Abdullah, M. Machine Learning with Oversampling and Undersampling Techniques: Overview Study and Experimental Results. In Proceedings of the 2020 11th International Conference on Information and Communication Systems (ICICS), Irbid, Jordan, 7–9 April 2020; pp. 243–248. [Google Scholar]
  45. Johnson, J.M.; Khoshgoftaar, T.M. Survey on deep learning with class imbalance. J. Big Data 2019, 6, 27. [Google Scholar] [CrossRef]
  46. Goodfellow, I.J.; Pouget-Abadie, J.; Mirza, M.; Xu, B.; Warde-Farley, D.; Ozair, S.; Courville, A.; Bengio, Y. Generative adversarial nets. Adv. Neural Inf. Process. Syst. 27, NIPS 2014. Available online: https://proceedings.neurips.cc/paper_files/paper/2014/file/f033ed80deb0234979a61f95710dbe25-Paper.pdf (accessed on 1 May 2025).
  47. Zhang, H.; Cisse, M.; Dauphin, Y.N.; Lopez-Paz, D. mixup: Beyond empirical risk minimization. arXiv 2017, arXiv:1710.09412. [Google Scholar]
  48. Aworinde, H.O.; Adebayo, S.; Akinwunmi, A.; Alabi, O.M.; Ayandiji, A.; Sakpere, A.; Oyebamiji, A.; Olaide, O.; Kizito, E.; Olawuyi, A. Poultry fecal imagery dataset for health status prediction: A case of South-West Nigeria. Data Brief 2023, 50, 109517. [Google Scholar] [CrossRef] [PubMed]
  49. Chidziwisano, G.; Samikwa, E.; Daka, C. Deep learning methods for poultry disease prediction using images. Comput. Electron. Agric. 2025, 230, 109765. [Google Scholar] [CrossRef]
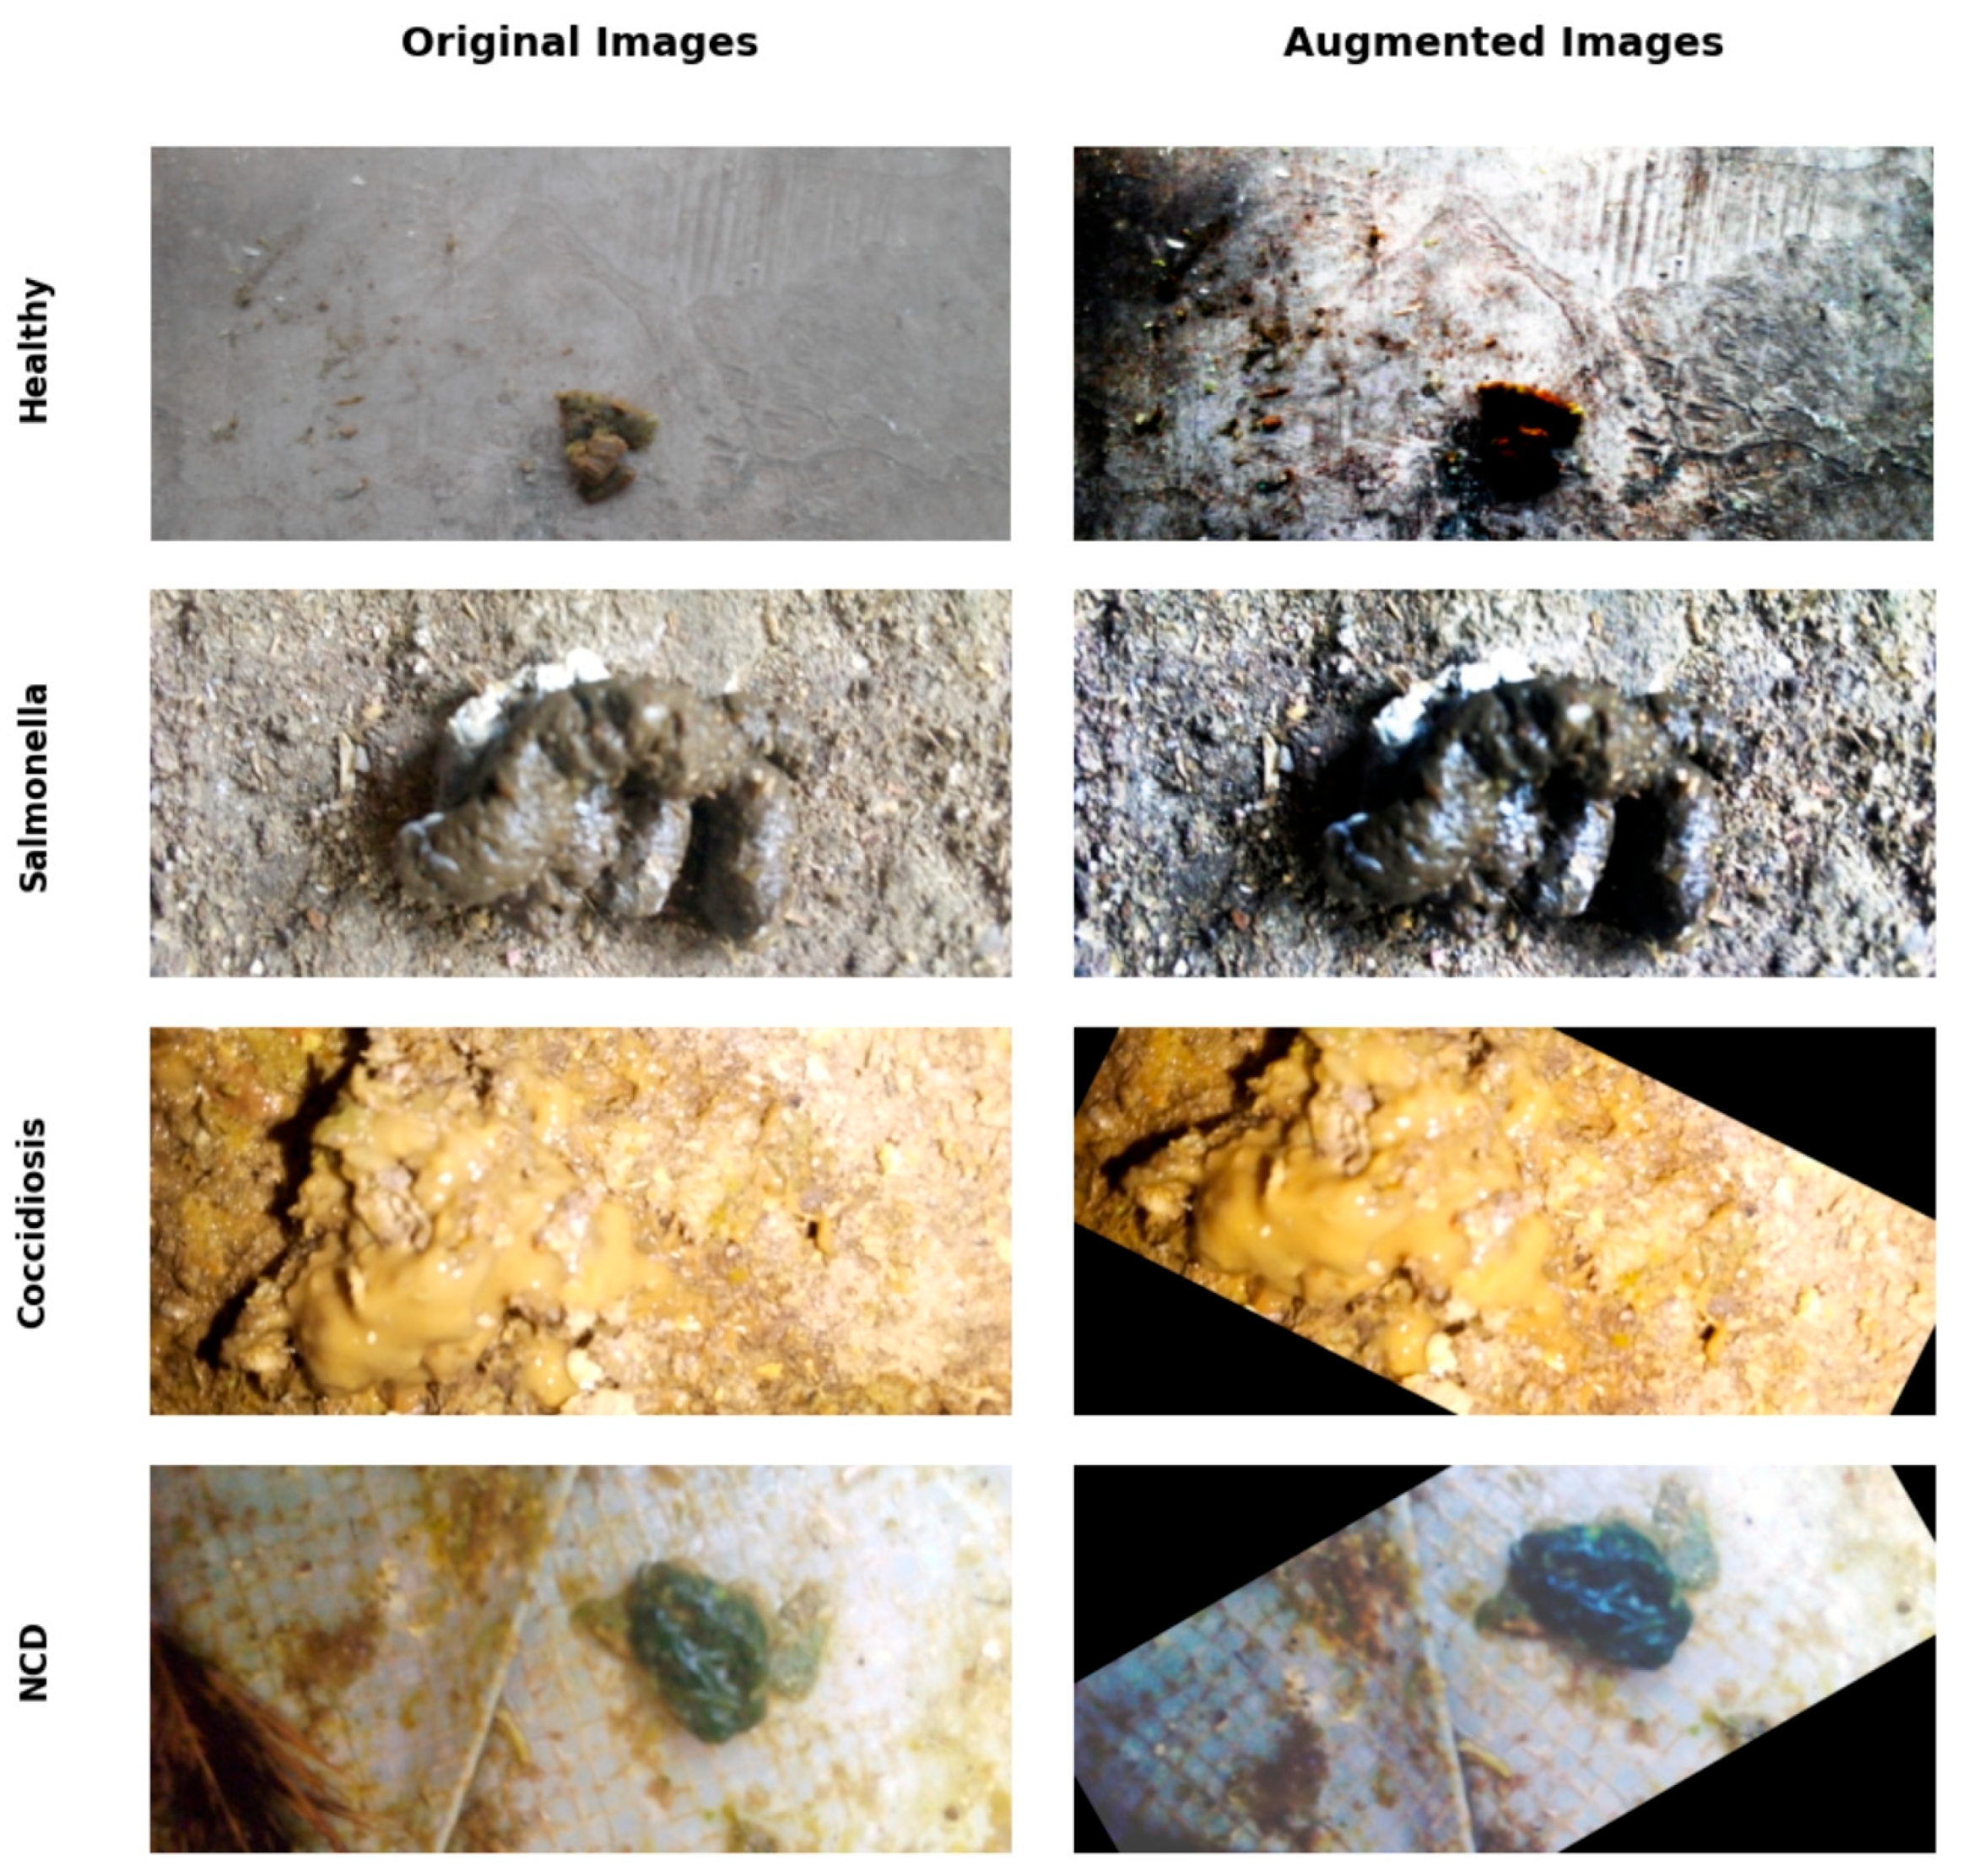
Figure 1. Results of image augmentation. A variety of augmentation techniques were applied to the training dataset using AutoAugment and ImageNet policy.
Agriengineering 07 00278 g001
Figure 2. YOLO11 variant performance on test dataset for feces detection.
Agriengineering 07 00278 g002
Figure 3. Feces detection on the test dataset by YOLO11n. The blue detection area shows the class name (feces) of the detected fecal region followed by the confidence of detection.
Agriengineering 07 00278 g003
Figure 4. (a) Training and validation losses; (b) metrics for YOLO11n model.
Agriengineering 07 00278 g004
Figure 5. Comparison of EfficientNet-B0 and EfficientNet-B1 model performance across four disease classes.
Agriengineering 07 00278 g005
Figure 6. Workflow of the poultry disease detection web app. Steps 4, 5, and 6 show the detection, cropping, and classification steps of the application, respectively.
Agriengineering 07 00278 g006
Figure 7. User interface and the components of the web-based application.
Agriengineering 07 00278 g007
Disclaimer/Publisher’s Note: The statements, opinions and data contained in all publications are solely those of the individual author(s) and contributor(s) and not of MDPI and/or the editor(s). MDPI and/or the editor(s) disclaim responsibility for any injury to people or property resulting from any ideas, methods, instructions or products referred to in the content.