Article

Improving YOLO-Based Plant Disease Detection Using αSILU: A Novel Activation Function for Smart Agriculture

by
Duyen Thi Nguyen
1,
Thanh Dang Bui
2,*,
Tien Manh Ngo
3 and
Uoc Quang Ngo
1,*
1
Faculty of Engineering, Vietnam National University of Agriculture, Hanoi 131000, Vietnam
2
School of Electrical and Electronic Engineering, Hanoi University of Science and Technology, Hanoi 100000, Vietnam
3
Institute of Physics, Vietnam Academy of Science and Technology, Hanoi 100000, Vietnam
*
Authors to whom correspondence should be addressed.
AgriEngineering 2025, 7(9), 271; https://doi.org/10.3390/agriengineering7090271
Submission received: 25 June 2025 / Revised: 12 August 2025 / Accepted: 14 August 2025 / Published: 22 August 2025

Abstract

The precise identification of plant diseases is essential for improving agricultural productivity and reducing reliance on human expertise. Deep learning frameworks, belonging to the YOLO series, have demonstrated significant potential in the real-time detection of plant diseases. There are various factors influencing model performance; activation functions play an important role in improving both accuracy and efficiency. This study proposes αSiLU, a modified activation function developed to optimize the performance of YOLOv11n for plant disease-detection tasks. By integrating a scaling factor α into the standard SiLU function, αSiLU improved the effectiveness of feature extraction. Experiments are conducted on two different plant disease datasets—tomato and cucumber—to demonstrate that YOLOv11n models equipped with αSiLU outperform their counterparts using the conventional SiLU function. Specifically, with α = 1.05, mAP@50 increased by 1.1% for tomato and 0.2% for cucumber, while mAP@50–95 improved by 0.7% and 0.2% each. Additional evaluations across various YOLO versions confirmed consistently superior performance. Furthermore, notable enhancements in precision, recall, and F1-score were observed across multiple configurations. Crucially, αSiLU achieves these performance improvements with minimal effect on inference speed, thereby enhancing its appropriateness for application in practical agricultural contexts, particularly as hardware advancements progress. This study highlights the efficiency of αSiLU in the plant disease-detection task, showing the potential in applying deep learning models in intelligent agriculture.

1. Introduction

Agriculture plays a vital role in maintaining global food security and supporting economic resilience. However, plant diseases remain a significant barrier to sustainable agricultural productivity, contributing to substantial losses in crop yield and quality annually [1]. It is estimated that plant diseases account for 20–40% of global crop losses, adversely affecting food supply chains and farmer livelihoods [2].
The damage caused by plant diseases is often substantial. However, assessing the extent of such “damage” requires specific, observable criteria. Ref. [3] evaluated tissue colonization levels and identified pathogen structures such as hyphae, spores, and sporangia. Similarly, ref. [4] emphasized that understanding crop loss involves a clear progression from physical injury caused by the pathogen to functional damage, ultimately resulting in reduced yield or quality. Recent advancements in image-based analysis—particularly deep learning-based lesion segmentation—have significantly improved disease quantification. For instance, authors in ref. [5] demonstrated that neural networks can effectively assess barley disease severity by detecting both lesion area and pathogen-specific features. Therefore, early detection of plant diseases is essential for timely intervention, reducing the overuse of chemical pesticides, and supporting sustainable farming practices.
Traditional plant disease diagnosis methods heavily rely on human expertise and manual inspection, which are often time-consuming, labor-intensive, and prone to human error [6]. With the rapid advancement of artificial intelligence (AI) and deep learning techniques, there has been a growing interest in leveraging these technologies to automate plant disease detection, thereby enhancing diagnostic accuracy and reducing reliance on expert-based evaluations [7,8]. Despite the promising results achieved under controlled conditions, real-world deployment of AI models remains challenging due to hardware limitations and environmental noise [9]. These constraints lead to performance degradation in field settings, underscoring the need for models that not only maintain high accuracy but also operate efficiently on low-power edge devices commonly used in agricultural environments.
Among various computer vision architectures, the YOLO (You Only Look Once) series has emerged as one of the most effective frameworks for real-time object detection. YOLO has been successfully applied in innovative agriculture applications [10] and has been widely applied across various domains [11], particularly in identifying plant diseases in crops such as rice, wheat, tomatoes, cucumbers, and grapes [12,13,14,15,16]. Owing to its speed and precision, YOLO-based models have received considerable attention for real-time disease-detection tasks. For instance, a comparative study across different YOLO versions has demonstrated the feasibility of using YOLO for plant disease identification [17]. In ref. [18], YOLOv5 was utilized to identify multiple types of cucumber leaf diseases across diverse environmental conditions, demonstrating high detection accuracy while maintaining low computational overhead. Recent developments in YOLO-based plant disease detection have incorporated advanced techniques such as attention mechanisms and feature fusion to improve recognition performance further. For instance, an enhanced YOLOv6 model incorporating an attention mechanism has been proposed to improve the classification accuracy of tomato leaf disease detection [19]. Similarly, the DM-YOLO model, an improved variant of YOLOv8, has demonstrated robust performance in detecting cucumber diseases under challenging lighting conditions [20]. These improvements in YOLO architectures—ranging from structural redesign to feature optimization—have collectively contributed to better performance in complex agricultural tasks [21,22,23,24].
To date, YOLO has evolved through twelve versions, with successive iterations focusing primarily on architectural enhancements and algorithmic optimizations to improve detection accuracy [25]. A large portion of this research has centered on modifying network backbones, attention layers, and loss functions [26,27,28,29,30,31,32]. However, comparatively little attention has been paid to activation functions, which are fundamental to the learning dynamics of deep neural networks. While traditional activation functions like ReLU (Rectified Linear Unit), LeakyReLU (Leaky Rectified Linear Unit), and Mish were commonly employed in earlier YOLO implementations, recent advancements have explored the use of SiLU (Sigmoid-weighted Linear Unit) due to its smoother output profile, which facilitates better gradient propagation and more stable network convergence [33]. Recent advances in adaptive activation functions have demonstrated substantial potential to improve further the learning dynamics and representational capacity of deep neural networks. Notably, functions such as Adaptive ReLU and Dynamic GELU have been introduced to modulate activation behavior based on input characteristics dynamically, offering enhanced flexibility and adaptability across diverse tasks. For instance, Adaptive ReLU, including the Competition-based Adaptive ReLU (CAReLU), adjusts activation thresholds in response to input data distributions, enabling better modeling of complex and heterogeneous feature spaces. Similarly, Dynamic GELU introduces layer-wise and input-dependent scaling, thereby facilitating more efficient learning and improved generalization [34,35,36,37].
This shift toward more flexible and input-aware activation functions has contributed significantly to the recent performance improvements observed in object-detection models.
In parallel with these developments, recent research has proposed novel architectural strategies that integrate seamlessly into the YOLO framework to improve performance in domain-specific contexts. For example, study [38] presents a Foreign Object Detection Method for Railway Catenary, incorporating a scarce image generation model alongside a lightweight perception architecture, effectively enhancing detection performance in environments with limited annotated data. Likewise, a hybrid U-shaped learning architecture has been utilized to automatically assess safety hazards in high-speed railway environments, providing a scalable and intelligent system for risk detection and mitigation [39].
These innovations underscore the adaptability and extensibility of YOLO-based architectures, highlighting their ability to address both general purpose and application-specific challenges in real-world computer vision systems.
This study aims to address the underexplored aspect of activation function design in YOLO-based models. We introduce αSiLU, an adaptive extension of the SiLU activation function that incorporates a tunable scaling factor to enhance gradient dynamics during training. Specifically, the proposed αSiLU is integrated into the lightweight YOLOv11n architecture, which is well suited for deployment in resource-constrained agricultural settings. The target crops selected for this study are tomatoes and cucumbers, which are among the most economically significant and disease-prone horticultural crops.
The key contributions of this research are summarized as follows:
  • We introduce αSiLU, a novel parameterized and adaptive activation function tailored to enhance gradient flow and convergence stability in YOLO-based object detectors. Beyond proposing the function, we conduct a systematic evaluation of αSiLU against standard SiLU and other prevalent activation functions across multiple YOLO architectures. Our results reveal consistent improvements in detection accuracy—quantified by precision, recall, F1-score, mAP@0.5, and mAP@0.5:0.95—while preserving computational efficiency, thereby demonstrating both algorithmic and practical advantages.
  • To validate its applicability in real-world agricultural settings, we benchmark αSiLU on two plant disease datasets—tomato and cucumber leaves—demonstrating its robustness and effectiveness under domain-specific conditions.

2. Materials and Methods

2.1. YOLOv11 Models

The YOLO framework has become a prominent deep learning architecture widely employed for real-time object detection. YOLOv11, as introduced in [40], presents significant architectural enhancements, including an optimized backbone, advanced attention mechanisms, and more efficient feature fusion techniques. These improvements enable superior performance in a variety of complex visual tasks.
YOLOv11 represents a notable advancement in object detection, offering enhanced scalability, efficiency, and task versatility. With model variants ranging from nano to extra large, it adapts well across deployment contexts, from low-power edge devices to high-performance computing environments. The nano version, in particular, achieves significant gains in inference speed and responsiveness, making it highly suitable for real-time applications.
The primary architectural innovations introduced in YOLOv11:
  • Backbone: The backbone of YOLOv11 is meticulously designed to efficiently extract feature representations at multiple scales. A key advancement is the introduction of the C3k2 block (Cross Stage Partial block with a kernel size of 2), which replaces the previous C2f block. This block employs two smaller convolutions rather than a single large convolution, facilitating faster processing while maintaining the model’s representational capacity. Additionally, YOLOv11 continues to utilize the Spatial Pyramid Pooling—Fast (SPPF) module for multi-scale feature aggregation, enhanced by the integration of the novel C2PSA (Cross Stage Partial with Parallel Spatial Attention) block. The C2PSA block leverages spatial attention mechanisms to direct the model’s focus toward salient regions of an image, thereby improving detection accuracy, particularly for objects with varying sizes or those that are partially occluded.
  • Neck: In YOLOv11, the neck serves as the stage where features from different scales are fused and refined before being passed to the head. Similar to the backbone, YOLOv11 substitutes the C2f block with the more computationally efficient C3k2 block at this stage. Moreover, the incorporation of spatial attention mechanisms through the C2PSA module enables the model to prioritize and emphasize critical spatial information, thereby enhancing the robustness and precision of the detection process.
  • Head: YOLOv11’s head consists of multiple C3k2 blocks that process the refined feature representations at various depths, effectively balancing parameter efficiency and model expressiveness. It also incorporates CBS blocks (Convolution-BatchNorm-SiLU), which stabilize the training process through normalization and apply the SiLU activation function to enhance non-linearity and improve feature-extraction quality. The final prediction is generated through convolutional layers coupled with a Detect layer, which produces bounding box coordinates, objectness confidence scores, and class probabilities.
Its architectural flexibility and computational balance position YOLOv11 as a powerful solution across a wide range of domains, including autonomous systems, surveillance, healthcare, and smart agriculture.
The architecture of the YOLOv11n model, as depicted in Figure 1, serves as the foundational framework for evaluating the effectiveness of the improved activation function proposed in this study.

2.2. αSiLU Activation Function—Proposed Improvement

2.2.1. Introduction to Activation Functions

Activation functions are fundamental components in deep neural architectures, serving to introduce non-linear representations and regulate the propagation of gradients during training. Their effectiveness is inherently tied to both the architectural depth and the overall design of the network [41], and they exert a substantial impact on the convergence dynamics and trainability of deep models [42]. While theoretical considerations guide the initial selection of activation functions, their ultimate adoption is often contingent upon empirical performance across specific tasks and datasets [43].
Historically, YOLO architectures have employed various activation functions tailored to their generation-specific optimization strategies. Early versions (v1–v3) utilized LeakyReLU due to its simplicity and ability to mitigate the dying neuron problem. Subsequent iterations, such as YOLOv4, introduced more advanced activations like Mish and Swish, which offer smoother gradient transitions and enhanced expressiveness. However, these benefits come at the cost of increased computational overhead—Mish, for example, involves complex mathematical operations that can hinder efficiency during inference [44], while Swish, though effective due to its smooth and non-monotonic characteristics, also demands greater computational resources [45].
The SiLU, also referred to as Swish-1, has become the default activation in YOLO versions from v5 to v12. It offers a favorable trade-off between non-linear representation and computational cost, making it well suited for a wide range of vision tasks [46]. Nonetheless, despite its practical advantages, SiLU exhibits limitations—most notably, its fixed functional form, which may restrict adaptability across diverse data distributions.
The Sigmoid-weighted Linear Unit (SiLU) [47] is a type of activation function that has proven to be particularly effective in neural network function approximation, especially within reinforcement learning. SiLU is computed by multiplying the input to a unit by the output of a sigmoid function applied to that input:
α k ( z k ) = z k . σ z k
where z k represents the input to the unit and σ z k   is the sigmoid function. The sigmoid itself is defined as:
σ ( x ) = 1 1 + e x
An important characteristic of SiLU is its behavior for significant inputs, which is similar to the Rectified Linear Unit (ReLU). However, unlike ReLU, SiLU is not monotonically increasing and has a global minimum value around −0.28 at z k   ≈ −1.28, acting as a “soft floor” that regularizes the weights. This self-stabilizing feature helps prevent the model from learning substantial weights, contributing to better performance and stability during training.

2.2.2. Proposed αSiLU Activation Function

To address these limitations, we introduce αSiLU, α parameterized variant of SiLU that introduces a scaling factor (α) to allow adaptive gradient modulation. The mathematical formulation is:
f x = x α 1 1 + e α x = α x · s i g m o i d α x   = α x · σ α x
The derivative of αSiLU:
f x = α 1 1 + e α x + α x α e α x 1 + e α x 2 = α   σ ( α x ) + α 2 x   ( σ ( α x )   σ 2 ( α x ) ) = α   [ f ( x )   +   σ ( α x ) ( 1   f ( x ) ) ]
where σ(x) represents the sigmoid function, and α is a tunable parameter that controls the activation slope.
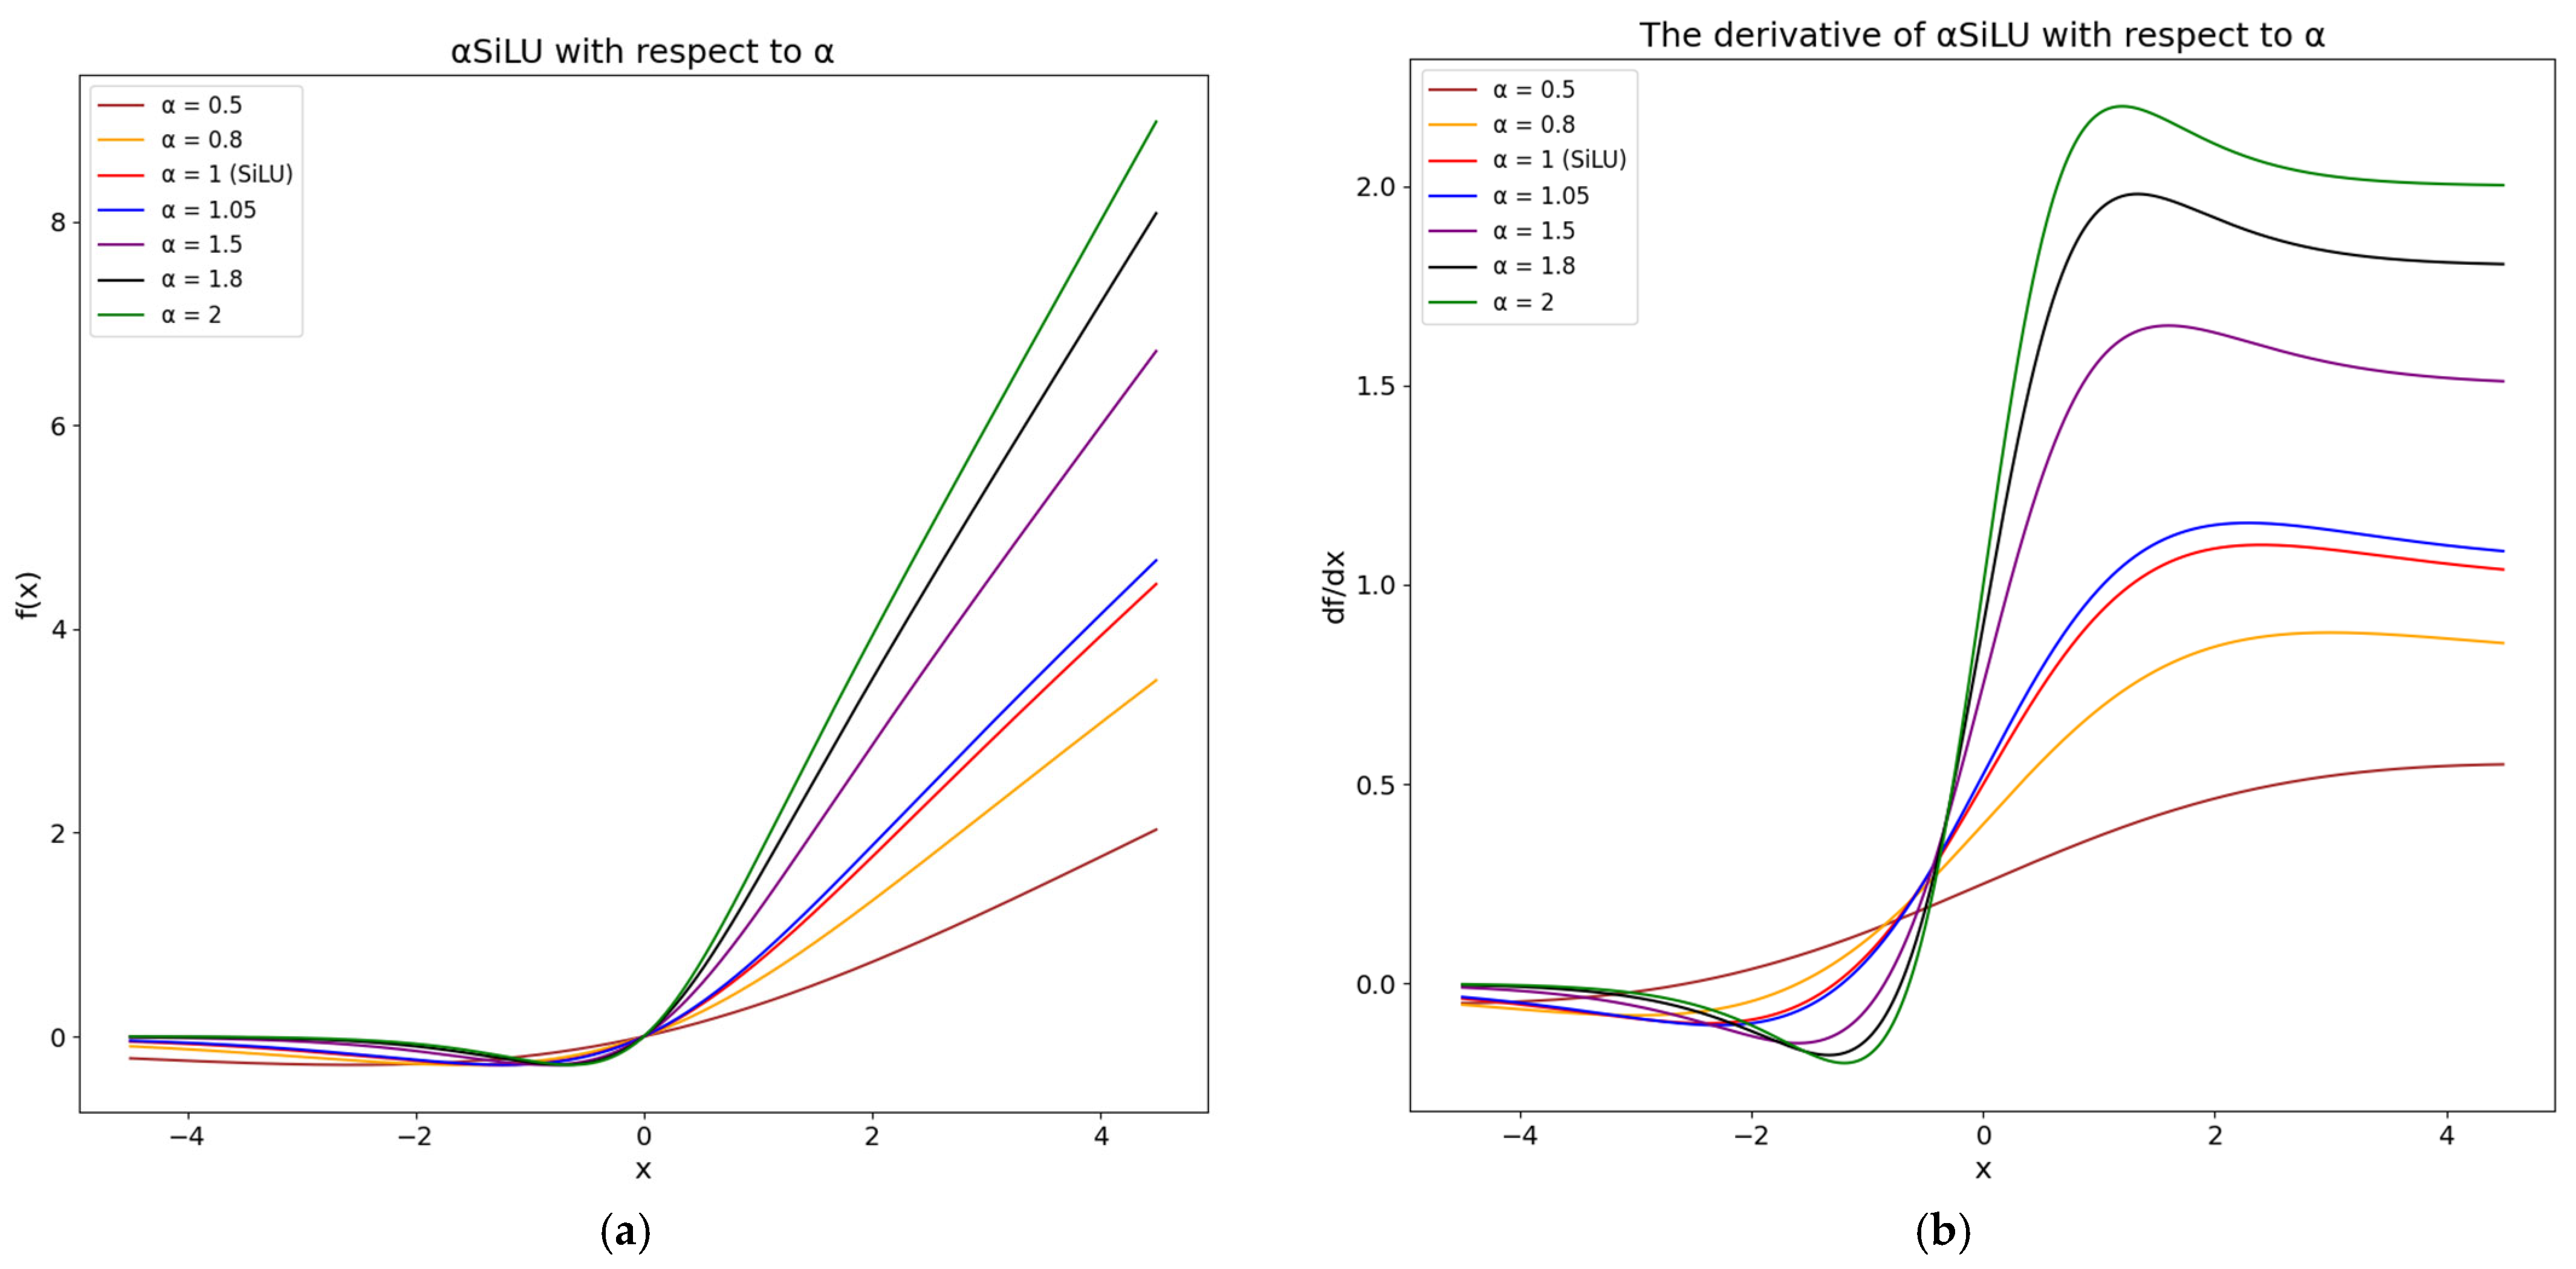
Figure 2a,b visualize the behavior of αSiLU and its derivative across different α values. As illustrated in Figure 2a, increasing α steepens the function’s slope, enhancing its non-linear characteristics. Conversely, lower α values lead to a smoother response, which can be beneficial in reducing sensitivity to input noise. Figure 2b shows the corresponding derivatives: larger α yields sharper gradients, accelerating training dynamics, while smaller values slow the updates, potentially improving training stability and mitigating overfitting.
To empirically evaluate the effectiveness of αSiLU, we explore values of α in the range [0.5, 2.0] on two benchmark datasets: cucumber and tomato plant disease classification. The experimental results reveal that α = 1.05 consistently achieves a favorable balance between convergence speed and accuracy.
Table 1 compares the core attributes of widely adopted activation functions commonly utilized in modern object-detection architectures. The proposed αSiLU activation function demonstrates significant advantages over traditional SiLU by introducing an adjustable parameter α, enabling fine-tuning based on specific task requirements. Compared to ReLU and Leaky ReLU, αSiLU effectively mitigates the vanishing gradient problem while maintaining a smooth activation curve, improving gradient flow. In contrast to Mish and GELU (Gaussian Error Linear Unit), αSiLU offers a more computationally efficient alternative while preserving non-linearity and smoothness. Additionally, αSiLU provides greater flexibility than ELU (Exponential Linear Unit) by dynamically adjusting the activation slope, allowing better optimization across different datasets and architectures. Given these properties, αSiLU strikes a balance between computational efficiency, gradient stability, and adaptability, making it a promising activation function for deep learning models.
To further assess the performance of αSiLU, we include the recently introduced CAReLU (Competition-based Adaptive ReLU) in our comparison. CAReLU integrates task-driven competition mechanisms, such as entropy or loss-based feedback, into the activation process via a smoothed tanh-modulated ReLU structure. This design enhances gradient stability and adaptiveness, especially in classification scenarios with ambiguous boundaries or complex inter-class variations. However, CAReLU relies on multiple learnable parameters (e.g., α, β, and context-dependent signals like entropy or L1 loss), which increases implementation complexity and computational overhead. These factors may limit its suitability for real-time detection tasks like YOLO or deployments on edge devices with constrained resources.
In contrast, αSiLU offers a more lightweight and streamlined structure while retaining smooth gradient propagation and flexible activation scaling. This practical efficiency renders αSiLU better aligned with real-time and embedded object-detection applications, where inference speed and model simplicity are critical.
The αSiLU activation function introduces an adjustable parameter (α) to modulate the activation slope dynamically, enhancing gradient flow and improving convergence speed. Unlike traditional SiLU, where the scaling factor remains fixed, αSiLU allows fine-tuning based on dataset characteristics and model architecture.

2.3. Dataset

To evaluate the proposed αSiLU activation, we use two real-world plant disease datasets, each containing images of healthy and diseased leaves:

2.3.1. Tomato Disease Dataset

This dataset comprises a total of 16,075 images categorized into eight classes, including seven common tomato diseases—Bacterial Spot, Early Blight, Late Blight, Leaf Mold, Yellow Leaf Curl Virus, Mosaic Virus, Septoria Leaf Spot—and one healthy class [48,49]. The tomato leaf disease dataset utilized in this study was constructed by merging two publicly available sources: a controlled-condition dataset from [48] and the field-acquired PlantDoc dataset from [49]. Both sources contain the same disease categories, which facilitated seamless integration.
The dataset from [48] contains images that were uniformly resized to 256 × 256 pixels and captured under laboratory-controlled conditions. Diseased leaves were manually detached from the plant and placed on a neutral gray background before being photographed. This method ensured high image clarity and minimized environmental noise. However, the controlled setting also limited variability in background complexity and disease severity, which can reduce the dataset’s representativeness of real-world scenarios.
In contrast, the PlantDoc dataset introduces greater heterogeneity in terms of image resolution (e.g., 400 × 275, 800 × 599 pixels) and environmental complexity. Images in PlantDoc were collected in natural field conditions and thus reflect a wide range of illumination, backgrounds, and disease manifestations. Although PlantDoc contributes fewer total samples, its inclusion significantly improves the diversity and realism of the overall dataset.
While no explicit scale bars were included in the datasets, the plant leaves appear in their natural size, with disease symptoms visible on the leaf surface. This provides a reasonable implicit scale reference for both human observers and automated systems. The lack of standard physical scale annotations represents a known limitation. However, this aligns with real-world data acquisition practices where physical measurement references are rarely included. We acknowledge this as a factor for future dataset construction, especially when aiming to quantify disease severity.
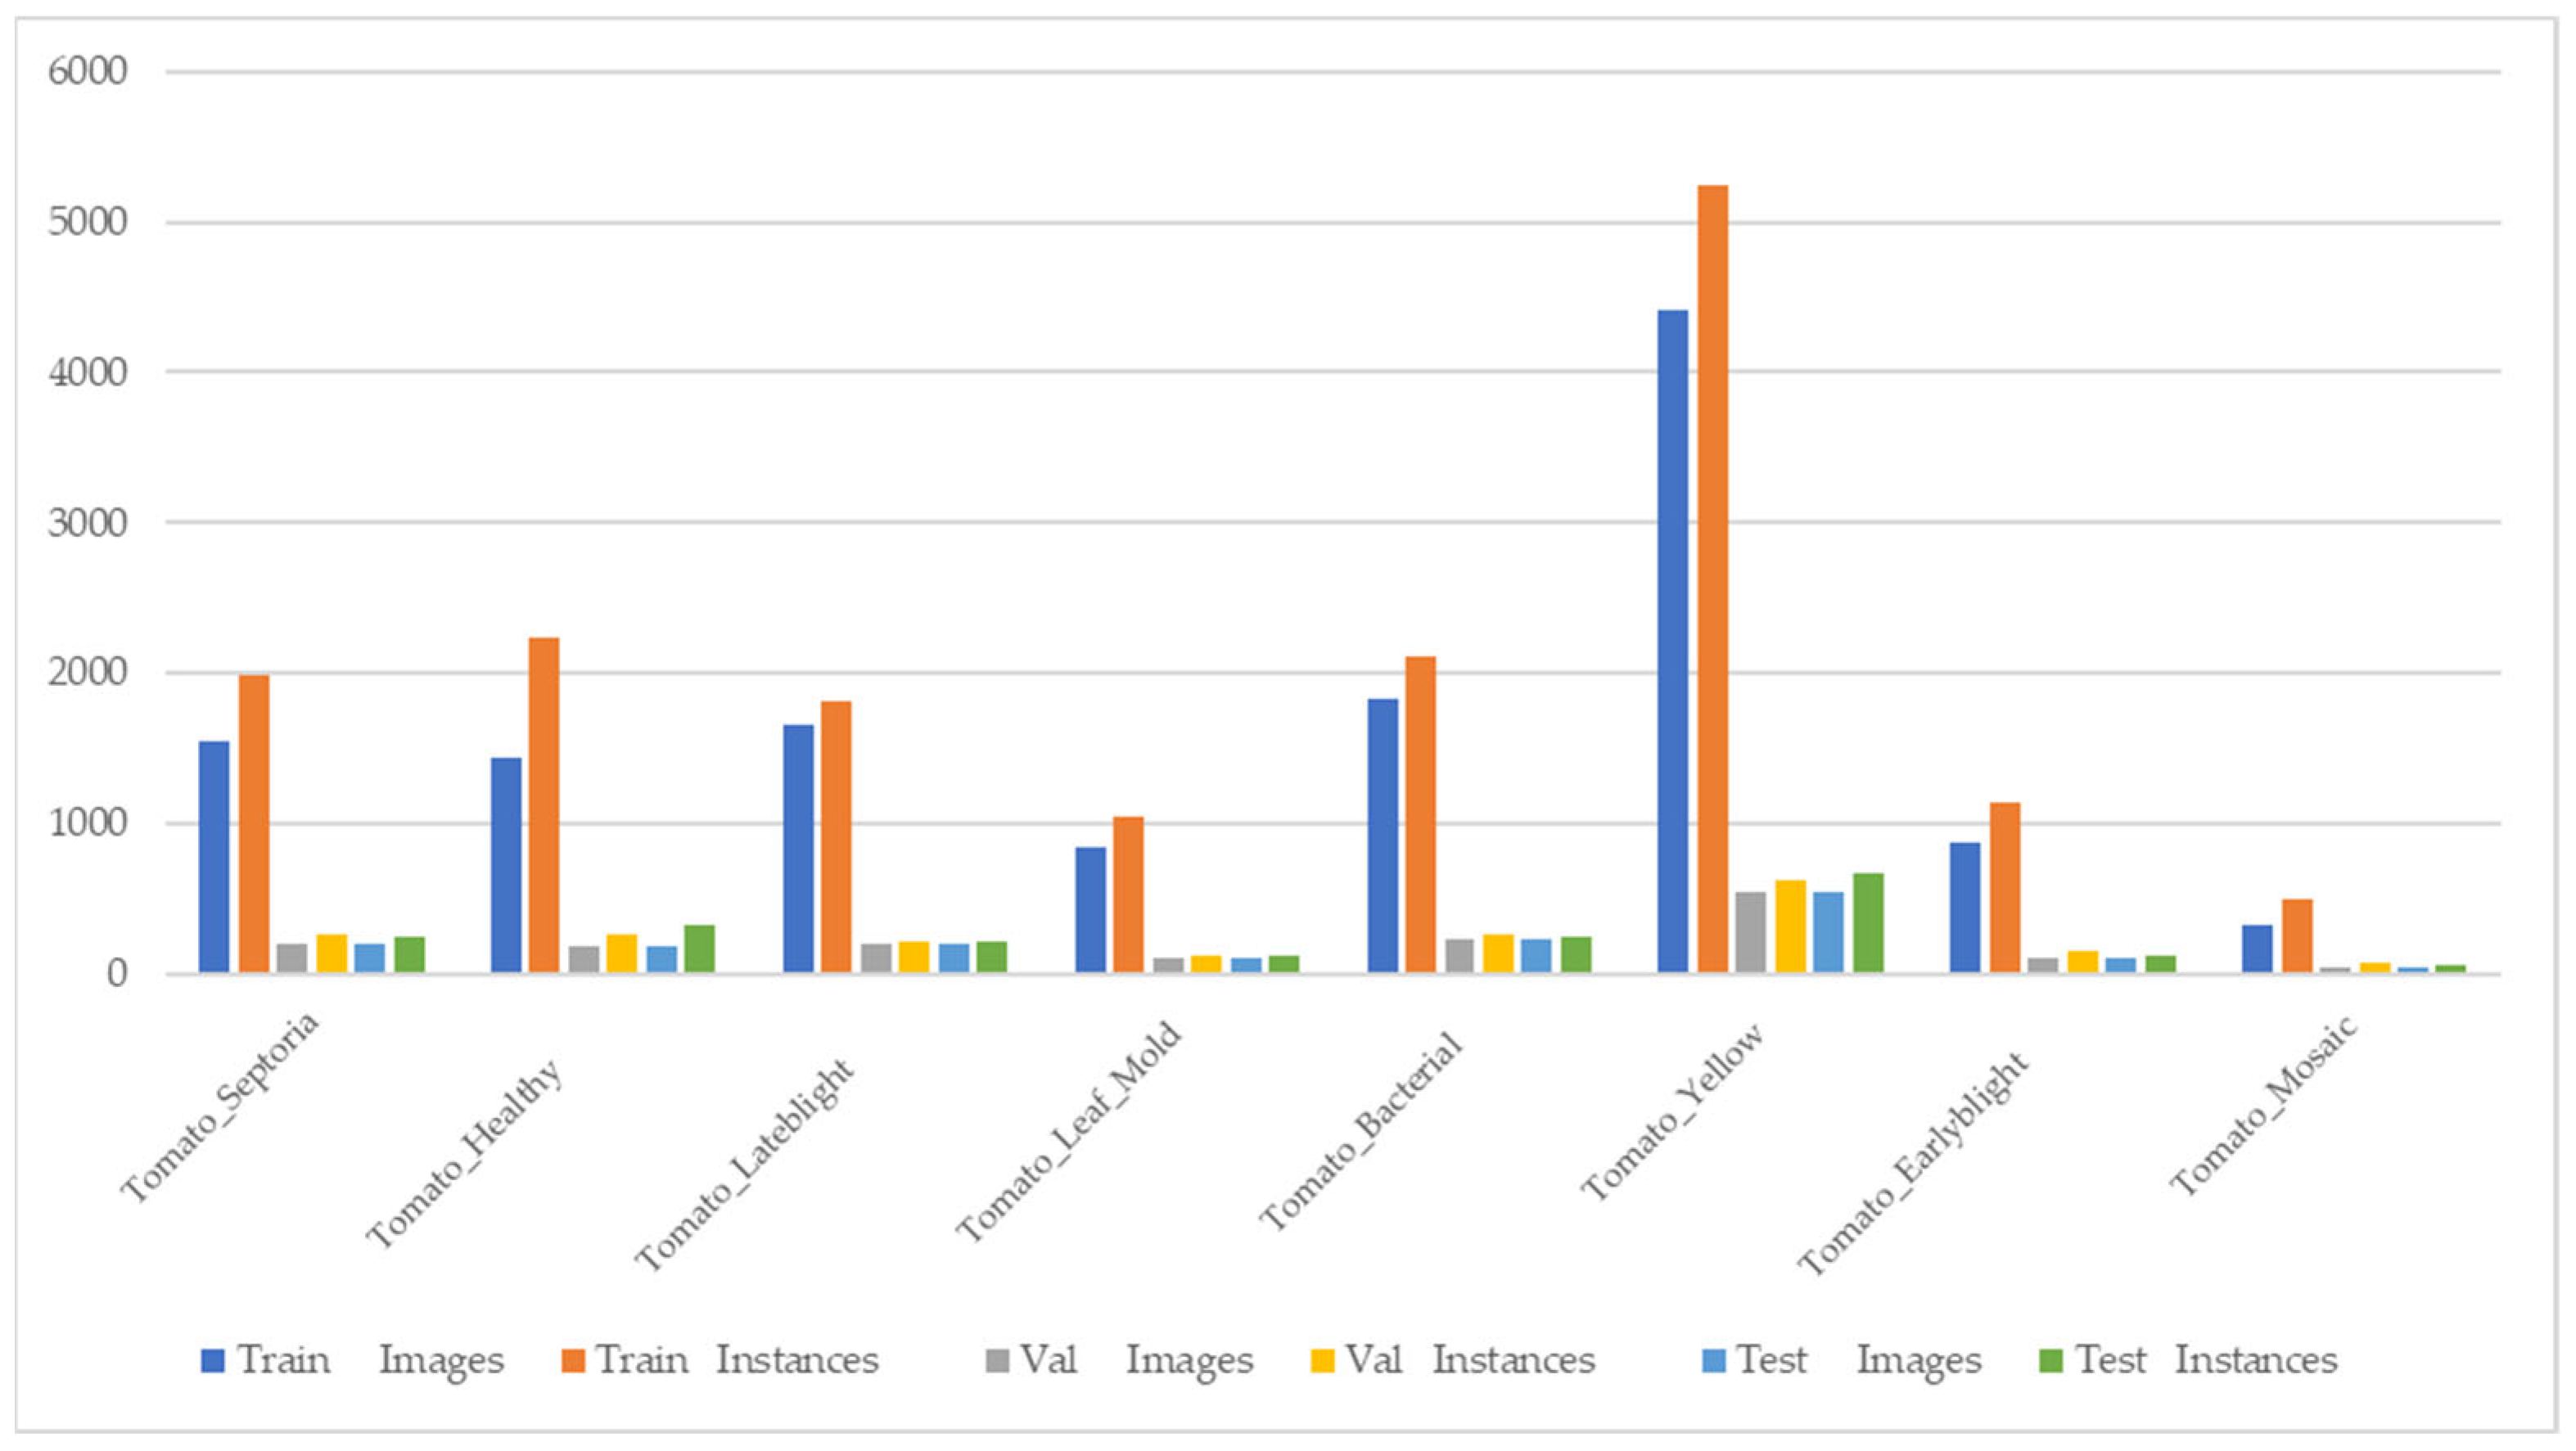
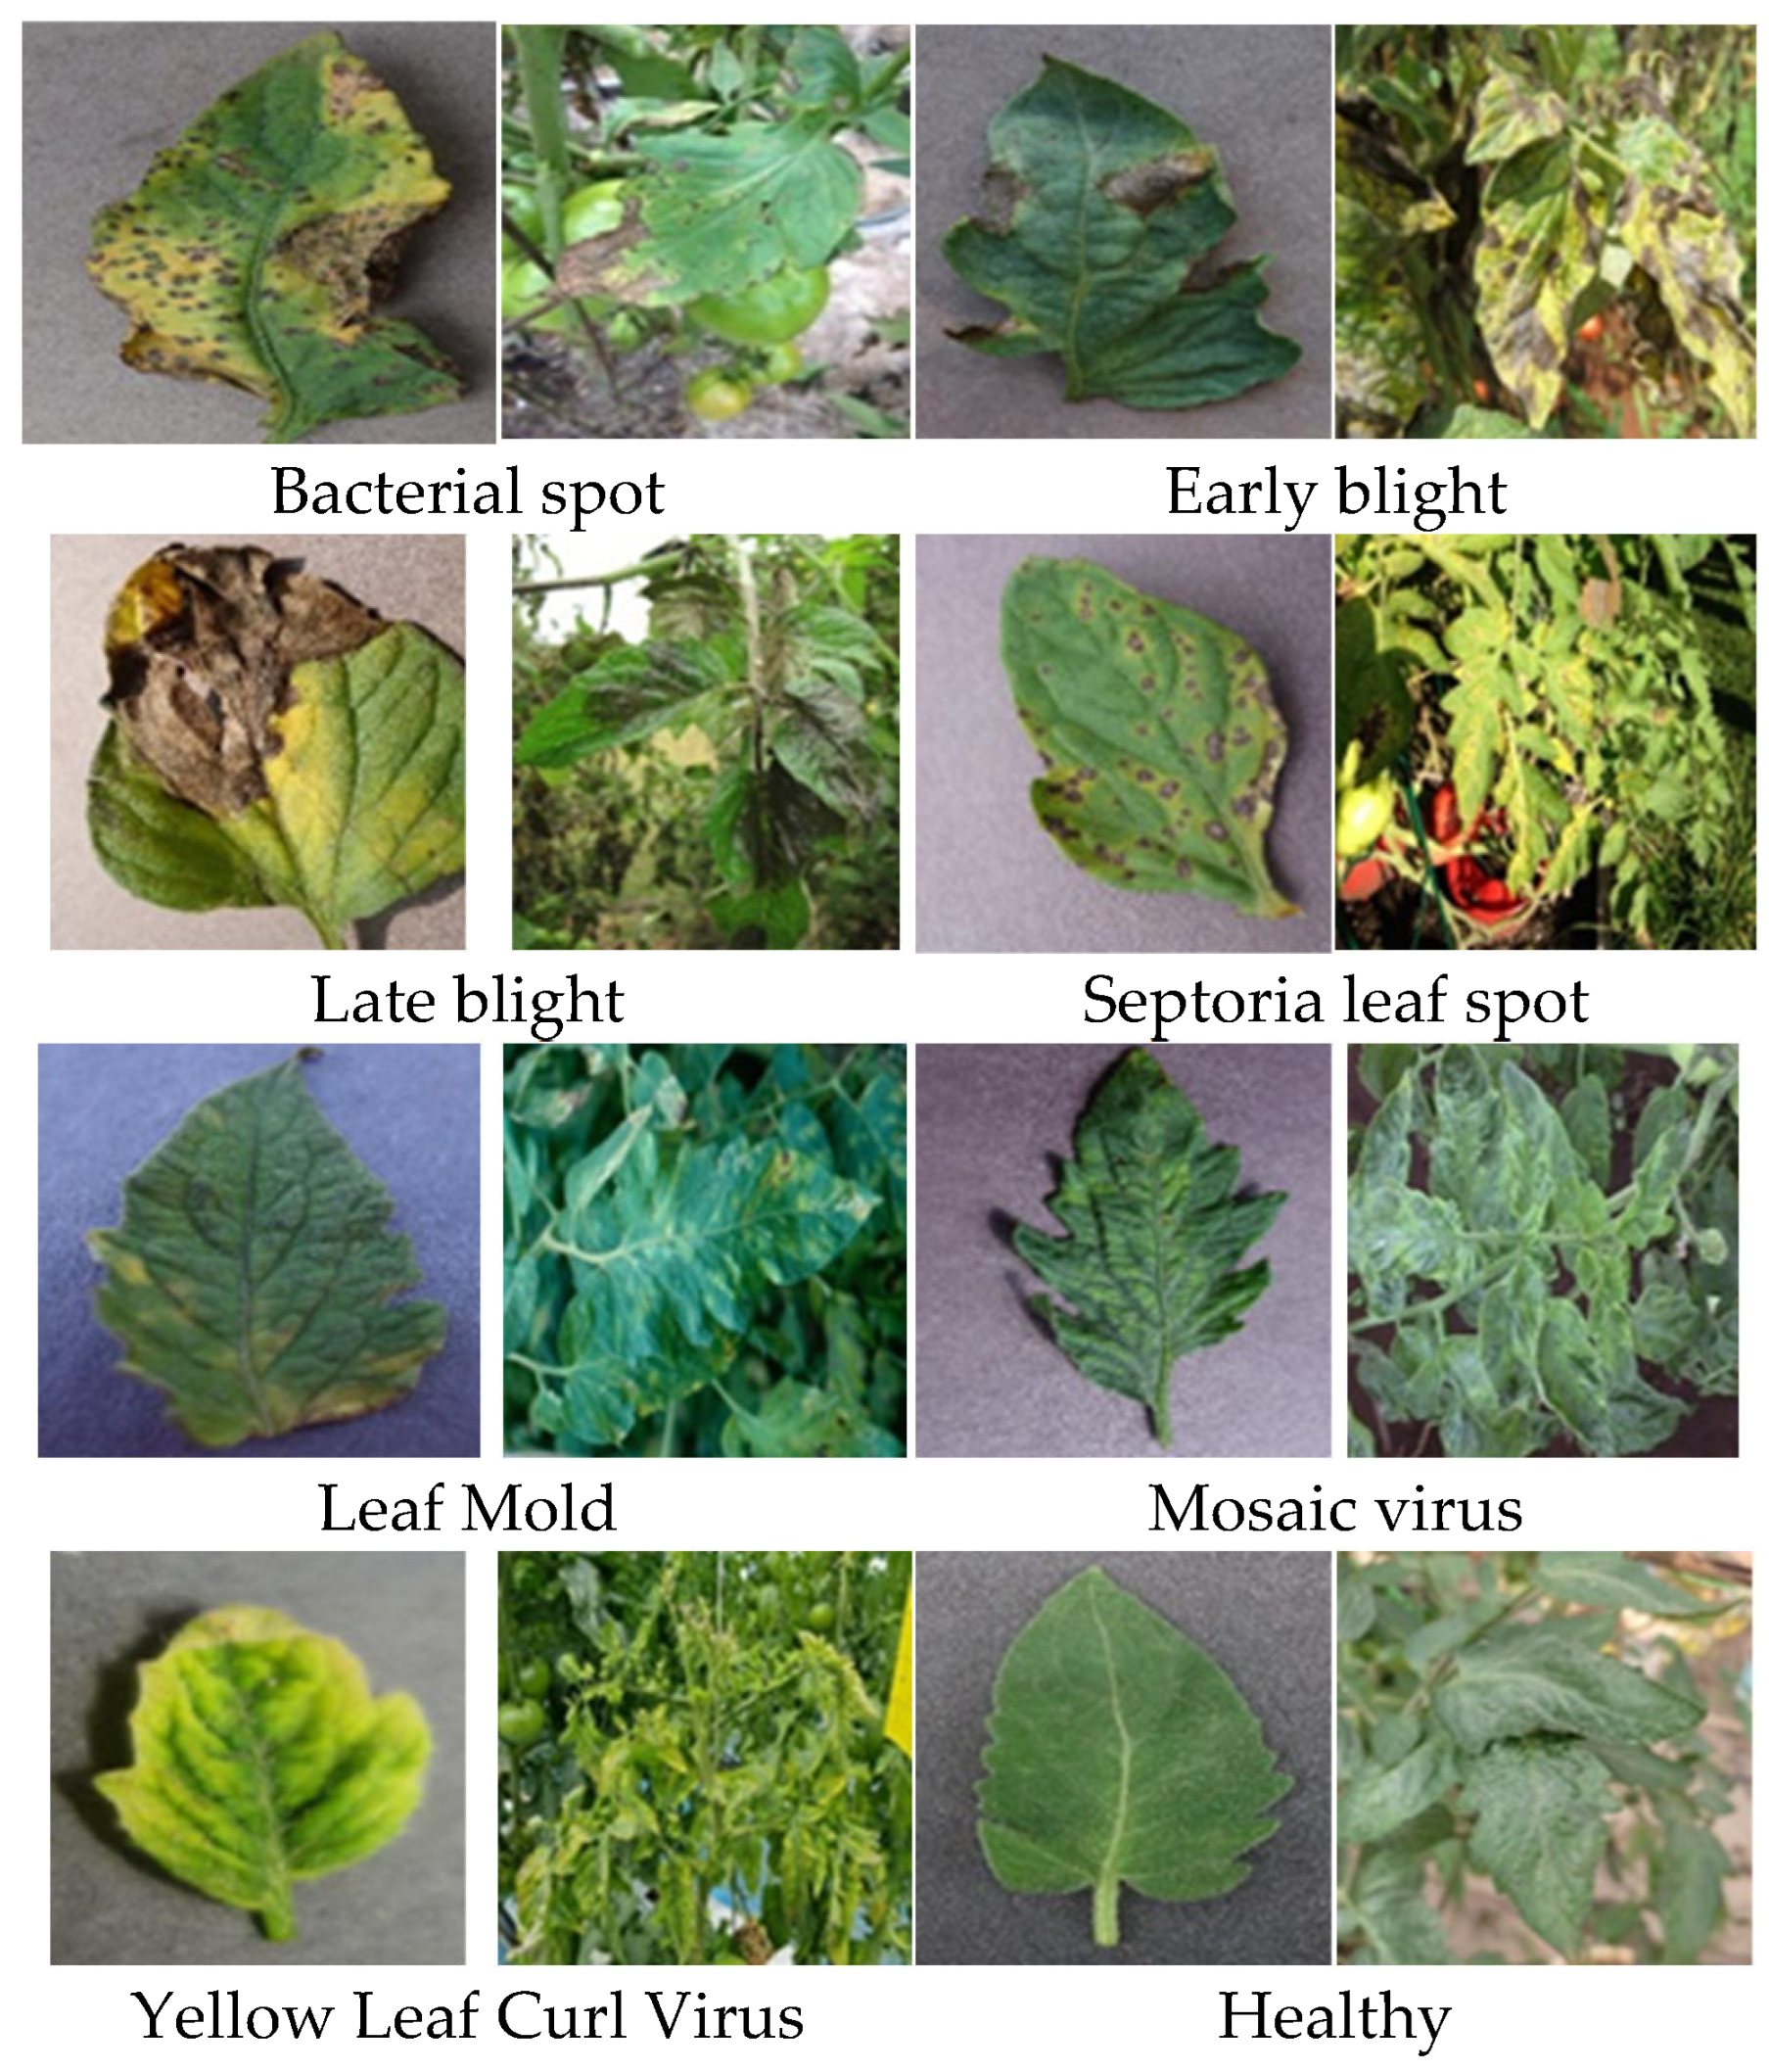
To ensure consistency with the YOLO model’s input requirements, all images were preprocessed to 640 × 640 pixels. The combined dataset was randomly split into training (80%), validation (10%), and testing (10%) subsets to facilitate objective model evaluation. Figure 3 illustrates representative images from the tomato disease dataset, highlighting the diversity of the collected data, which includes both laboratory-controlled images captured under simplified conditions and field-acquired images from real-world cultivation environments. Figure 4 shows the number of images and annotated instances for each tomato disease class across the training, validation, and test subsets.

2.3.2. Cucumber Disease Dataset

This dataset comprises 7920 images, categorized into three classes [50]: Healthy cucumber leaves, Powdery mildew-infected leaves, and Downy mildew-infected leaves. The cucumber leaf disease dataset employed in this study was provided by the research team in [40] and consists of high-resolution images (e.g., 1280 × 1280, 1224 × 1224, 2448 × 2448, 1620 × 1620 pixels) acquired directly from agricultural field conditions.
Unlike controlled laboratory datasets, this collection captures real-world variability in both disease severity—ranging from mild to advanced stages—and lighting conditions, spanning from low-light environments to intense natural sunlight. No artificial illumination or post-processing (e.g., white balance correction) was applied to standardize the appearance. This strategy preserves the dataset’s authenticity and challenges the detection model to learn under diverse and realistic visual inputs. Such diversity enhances the dataset’s representativeness for practical deployment scenarios and challenges the model’s ability to generalize effectively in dynamic environments.
Similar to the tomato dataset, no standard scale markers are embedded within the cucumber leaf images. Nonetheless, leaf features appear in full view, and the image framing allows visual estimation of object scale. While this lacks physical measurement precision, it retains consistency with field deployment realities.
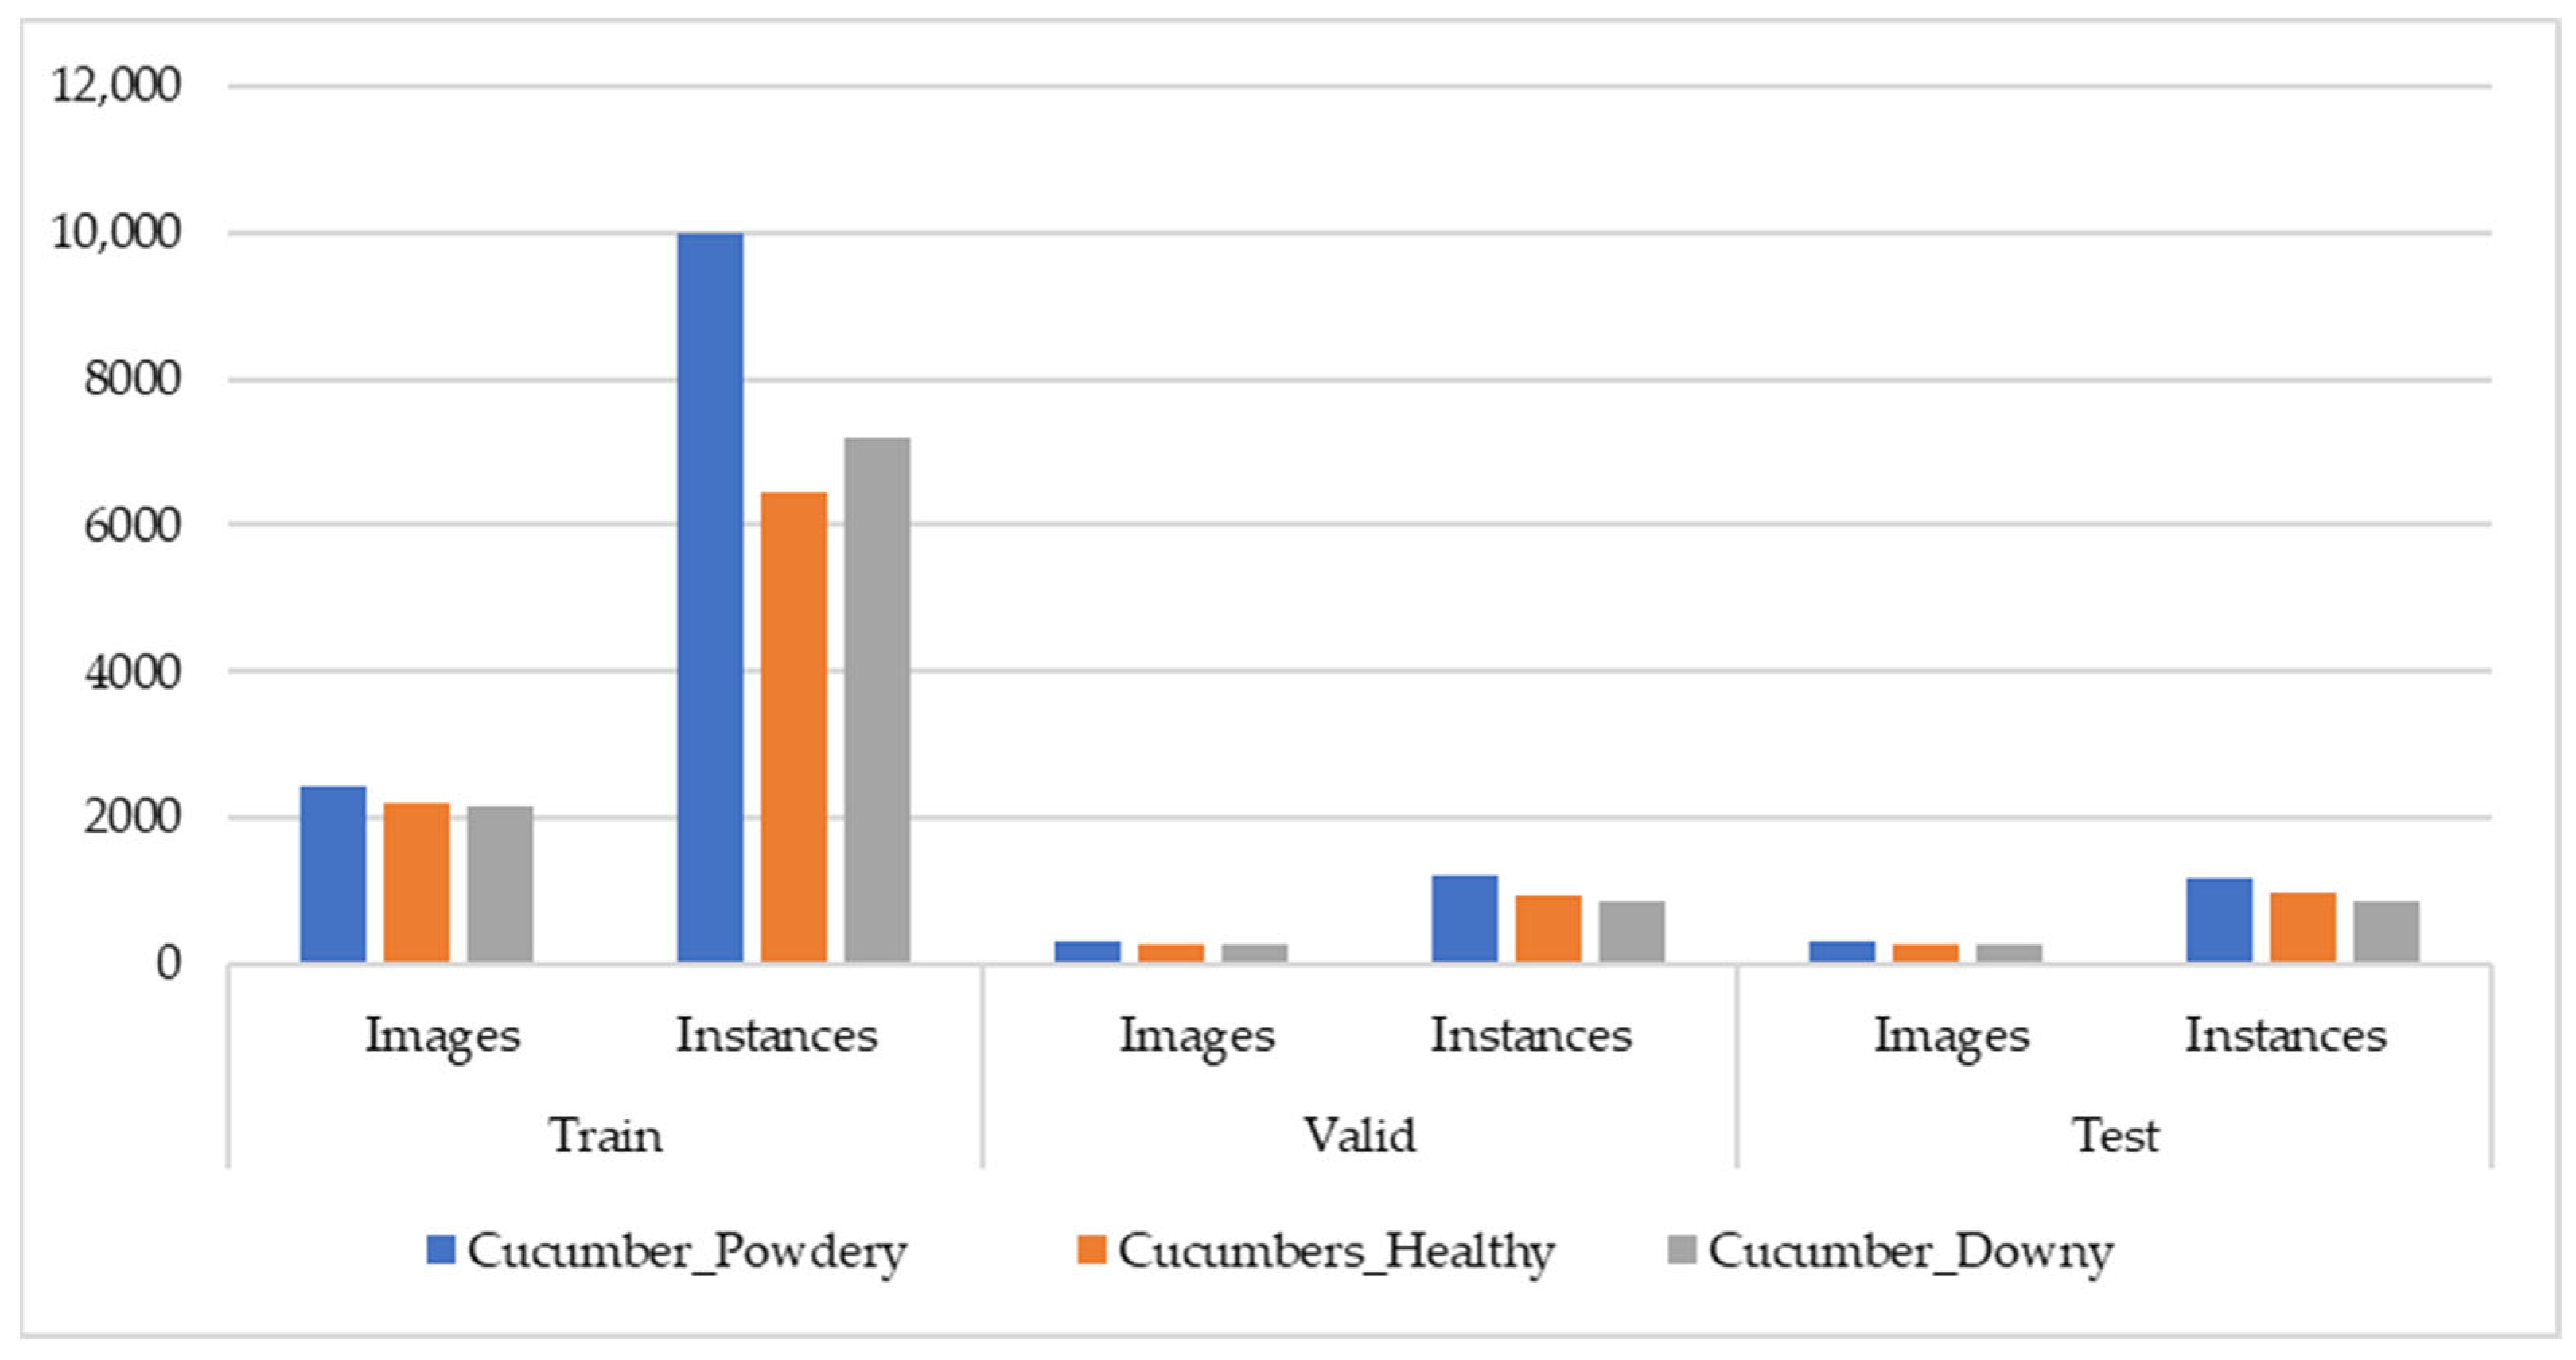
To standardize input for training, all images were resized to 640 × 640 pixels, aligning with the requirements of the YOLO-based detection model. The dataset was then randomly partitioned into training (80%), validation (10%), and testing (10%) subsets to ensure rigorous and unbiased model evaluation. Figure 5 presents representative samples from the cucumber disease dataset, clearly illustrating the visual complexity and natural variability present in the collected images, including diverse lighting conditions and symptom manifestations. Figure 6 illustrates the class-wise distribution of images and corresponding annotations for cucumber diseases, reflecting how the dataset is partitioned into training, validation, and test subsets.
Together, Figure 4 and Figure 6 emphasize the distinction between imbalanced and balanced datasets employed during the training process of the YOLO model enhanced with a modified activation function. While the cucumber dataset presents a relatively uniform distribution across categories, the tomato dataset shows a substantial imbalance among classes, which can potentially affect both the model’s convergence behavior and detection capability.
Regarding imaging conditions—particularly for the field-acquired tomato disease dataset from PlantDoc [49] and the cucumber disease dataset [50]—no white balance correction was applied. Original lighting conditions were preserved to maintain natural scene variability. These images encompass a broad range of illumination environments, from diffuse cloudy light to intense direct sunlight, introducing visual challenges such as shadows, color shifts, and glare. Although such variability poses difficulties for detection algorithms, it closely reflects real-world deployment scenarios and enhances model generalizability in unconstrained environments.
This comparative analysis offers a foundation for assessing the influence of data distribution on model performance, particularly regarding the generalization ability of the enhanced activation function under differing data balance scenarios.

2.4. Evaluation Method

To evaluate the effectiveness of the proposed αSiLU activation function in YOLO models, we utilize several standard evaluation metrics that are commonly employed in object-detection tasks.

2.4.1. Performance Metrics

The following metrics are employed to quantitatively assess model performance: precision (P), recall (R), F1-score, mAP@50, and mAP@50:95:
P = T P T P + F P   100 %
R = T P T P + F N   100 %
F 1 - score = 2     P     R P + R     100 %
mAP   = c = 1 C A P c C     100 %
where:
  • True Positives (TP): Correctly detected and classified objects that actually exist in the image.
  • False Positives (FP): Predictions that either do not match any real object or are assigned an incorrect class.
  • False Negatives (FN): Ground-truth objects that the model fails to detect, either due to omission or low IoU overlap.
  • Precision (P) measures the proportion of predicted bounding boxes that are correct, indicating how well the model avoids false detections.
  • Recall (R) quantifies the model’s ability to retrieve all relevant instances, reflecting its sensitivity to missed objects.
  • F1-score is the harmonic mean of precision and recall, offering a balanced performance indicator, particularly in scenarios with class imbalance.
  • Mean Average Precision (mAP) summarizes overall detection accuracy across all object categories by averaging the Average Precision (AP) scores:
    +
    mAP@50: Computed at a fixed IoU threshold of 0.50.
    +
    mAP@50:95: Calculated by averaging AP over IoU thresholds ranging from 0.50 to 0.95 in 0.05 increments, following the COCO evaluation protocol.

2.4.2. Experimental Setup

The experimental setup was carefully designed to ensure the reliability and reproducibility of model performance evaluation. Model optimization was conducted in accordance with the default algorithms of each respective YOLO version. Specifically, for YOLOv11n, the training process employed the Stochastic Gradient Descent (SGD) algorithm with an initial learning rate of 0.01 and a batch size of 16. Each model was trained for up to 100 epochs, with early stopping applied based on validation performance to prevent overfitting. Validation was performed at the end of each epoch to monitor convergence trends. Transfer learning was applied to all models in this study to accelerate training and enhance overall performance.
All experiments were carried out on a hardware platform comprising an NVIDIA GeForce GTX 1660 GPU (6GB VRAM), an Intel Xeon E5-2689 CPU, and 64GB of RAM, operating on Windows 10. The software environment included Python 3.9.19, PyTorch 2.3.1 with CUDA 11.8 support, and Ultralytics 8.3.9.
This configuration ensured a consistent and fair comparison between the baseline YOLO models using the original SiLU activation function and the proposed αSiLU-enhanced variants.

3. Results and Discussion

3.1. Experimental Results

To rigorously assess the effectiveness of the proposed αSiLU activation function, extensive experiments were first conducted on a primary dataset involving tomato plant disease detection using the YOLOv11n architecture. To validate the generalizability of the approach, an additional dataset comprising cucumber plant diseases was employed, focusing on evaluating model performance under the optimal α configuration. Furthermore, to ensure broader applicability and to benchmark consistency across architectures, αSiLU was integrated into multiple YOLO variants for extended comparative analysis.

3.1.1. YOLOv11-αSiLU Performance

  • Tomato Dataset:
Table 2 presents the model performance on the tomato disease dataset.
Table 2 presents a comprehensive quantitative assessment of the proposed αSiLU activation function, benchmarked against the standard SiLU on YOLOv11n. The evaluation spans a wide range of α values (0.5 to 2.0), offering a granular view of how parametric modulation influences detection performance under varying operational conditions.
With α = 1.05, the most balanced performance was achieved, yielding a F1-score of 89.70%, mAP@50 of 92.40%, and mAP@50–95 of 82.00%, all of which outperform the SiLU baseline (α = 1.0) by notable margins. These results indicate that a slight positive scaling of the activation’s slope enhances gradient flow and convergence stability, particularly in deeper architectures where vanishing gradients are more prominent.
Crucially, the configuration with α = 0.9 produced the highest mAP@50–95 of 82.20%, suggesting that attenuating the activation’s curvature slightly below that of SiLU improves the model’s ability to generalize under stricter localization thresholds. This peak, though isolated, underscores the sensitivity of fine-grained detection tasks—such as plant disease classification—to subtle shifts in activation dynamics. However, α = 0.9 offered only marginal improvements in F1-score compared to α = 1.05, and did not consistently dominate across all performance indicators.
B.
Cucumber Dataset:
Table 3 presents an empirical evaluation of the αSiLU activation function on the cucumber leaf disease dataset; a more balanced dataset compared to the tomato counterpart. This balance provides a clearer lens through which to assess the functional impact of varying α values, isolating activation dynamics from confounding effects of class imbalance.
The results reveal a relatively stable performance across a broad α range. The configuration α = 1.05 achieved the highest mAP@50–95 score (81.00%), along with an F1-score of 87.70%, indicating a favorable trade-off between localization accuracy and classification confidence. These gains, albeit modest over the SiLU baseline (which yielded mAP@50–95 = 80.80%), reaffirm the earlier findings on tomato data, further validating α = 1.05 as a robust and generalizable setting.
Interestingly, several other α values (e.g., α = 1.5 with F1 = 88.00%, and α = 0.95 with F1 = 87.47%) also demonstrated competitive results, indicating that the balanced nature of the dataset renders the model less sensitive to minor variations in activation slope. This performance stability suggests that in more statistically homogeneous datasets, αSiLU provides reliable behavior across a wider parametric spectrum.
Nonetheless, the consistent advantage of αSiLU over standard SiLU—particularly in mAP@50–95—underscores its capacity to enhance fine-grained localization. This metric is especially crucial in agricultural image diagnostics, where lesions, color changes, or disease markers may be subtle or spatially ambiguous.
Importantly, the range α ∈ [0.95, 1.1] again emerges as the practical sweet spot, striking a balance between expressiveness and gradient flow. The convergence of high F1-scores and peak mAP within this interval demonstrates αSiLU’s capacity to provide task-adaptive flexibility without architectural modification—a significant advantage for real-time models deployed on edge devices.
In summary, the results on the cucumber dataset corroborate the general trend observed in tomato experiments, with αSiLU offering modular, data-adaptive gains in detection performance. The smoother and more interpretable behavior across α values further suggests that in well-curated datasets, αSiLU introduces both stability and precision—making it an attractive choice for precision agriculture and other domains requiring high-fidelity detection under computational constraints.
C.
Discussion:
From a deployment perspective, the range α ∈ [0.95, 1.1] emerged as a practically optimal interval, offering stable and high-performing trade-offs across precision, recall, F1-score, and both mAP variants. This range reflects a region of robust convergence and representational efficacy, where performance gains are not confined to a single metric but are instead distributed coherently across evaluation axes.
Collectively, these findings emphasize the importance of activation function design as a low-cost yet impactful lever for performance optimization in deep object detectors. Unlike structurally invasive approaches, αSiLU offers fine-grained tunability without architectural disruption, enabling task-specific calibration and improved adaptability to domain-specific challenges such as subtle disease symptom detection in agriculture.
The superior outcomes in mAP@50–95 further demonstrate αSiLU’s capacity to improve localization precision under complex visual conditions, including partial occlusion, blur, or subtle color shifts—scenarios commonly observed in real-world agricultural datasets. Such characteristics position αSiLU as a promising direction in the emerging line of adaptive, data-aware activation functions, especially in domains where precision and computational efficiency must coexist.
Although formal statistical significance tests (e.g., confidence intervals, standard deviations, or paired t-tests) were not performed due to computational constraints, the performance trend observed—particularly the consistent improvements at α = 1.05—was validated across multiple experimental setups. As detailed in Section 3.1.2, these include comparisons over two heterogeneous datasets (tomato and cucumber) and several YOLO architectures ranging from YOLOv5n to YOLOv11n. This consistency across diverse model backbones and data distributions provides strong empirical support for the reliability of the proposed activation scaling. In future work, we aim to incorporate multi-run experiments under randomized seeds and appropriate statistical hypothesis testing to rigorously quantify variance and enhance reproducibility.

3.1.2. Comparison with Other YOLO Versions

To further validate the generalizability of the proposed αSiLU activation function, we extended our experiments to encompass additional YOLO variants, specifically YOLOv5n, YOLOv8n and YOLOv10n. Evaluations were conducted on two distinct plant disease datasets—cucumber (balanced) and tomato (imbalanced)—to examine the robustness of αSiLU across varied data distributions and model configurations.
On the tomato dataset (Table 4)—characterized by a pronounced class imbalance— αSiLU continued to demonstrate favorable outcomes, particularly in YOLOv10n and YOLOv11n. The α = 1.05 configuration improved mAP@50 by up to 1.1% and mAP@50–95 by 0.7%, accompanied by consistent gains in F1-score and precision. While YOLOv5n and YOLOv8n with αSiLU exhibited marginal decreases in recall-related metrics, the overall trade-off remained acceptable, reaffirming the compatibility of αSiLU with a range of network backbones.
In contrast, onthe cucumber dataset (Table 5), the integration of αSiLU (α = 1.05) consistently yielded performance enhancements across all evaluated models. YOLOv10n experienced a gain of +0.5% in mAP@50 and +0.4% in mAP@50–95, while YOLOv11n attained the highest detection accuracy overall, reaching 94.3% mAP@50 and 81.0% mAP@50–95—surpassing its SiLU-based counterpart by 0.2% in both metrics. These improvements highlight the efficacy of αSiLU in refining localization accuracy and semantic discrimination, even within lightweight detection frameworks.
Collectively, these findings underscore αSiLU’s practical advantage as a drop-in replacement activation function that requires no architectural modifications, yet delivers measurable performance benefits. Its scalability across generations of YOLO architectures positions αSiLU as a versatile enhancement strategy for object-detection pipelines, particularly in domains where both accuracy and computational efficiency are essential.

3.2. Comparative Analysis of Activation Functions

To gain deeper insights into the functional impact of αSiLU, we benchmarked it against several widely adopted activation functions, including LeakyReLU, ReLU, Mish, GELU, ELU, and the default SiLU. The comparative analysis was conducted using the YOLOv11n architecture on two datasets—tomato and cucumber diseases—differing in image resolution, label balance, and visual complexity. Performance metrics include mAP@50, mAP@50–95, and inference latency per image, as summarized in Table 6 and Table 7.
On the tomato disease dataset, which exhibits relatively low image resolution and an imbalanced class distribution, αSiLU (α = 1.05) demonstrated the highest detection accuracy, achieving 92.40% mAP@50 and 82.00% mAP@50–95. These represent notable improvements of +1.1% and +0.7%, respectively, over the SiLU baseline. Although Mish, GELU, and ELU exhibited competitive performance in mAP@50–95 (ranging from 81.3% to 81.6%), they lack the adaptive scaling mechanism introduced in αSiLU. This adaptivity contributes to better gradient flow and more nuanced feature representation, particularly beneficial in scenarios with subtle symptom variation and class imbalance, as commonly found in tomato leaf disease images.
The recently introduced CAReLU activation function was also evaluated to provide a broader comparison. On the tomato dataset, CAReLU achieved 91.50% mAP@50 and 80.90% mAP@50–95, which are comparable to traditional activations but still lower than αSiLU in both metrics. Notably, CAReLU incurred the highest inference latency at 12.1 ms—nearly double that of other functions—due to its complex structure involving multiple learnable parameters and context-driven modulation. This latency overhead may hinder its deployment in real-time object-detection scenarios such as in-field plant monitoring.
On the cucumber dataset, characterized by higher image quality and more balanced label distribution, αSiLU continued to deliver superior results, achieving a mAP@50 of 94.30% and mAP@50–95 of 81.00%. While the absolute performance gain over SiLU was more modest (+0.2% mAP@50 and +0.2% mAP@50–95), the consistent improvement across both datasets reinforces the robustness and generalizability of the proposed activation function. Importantly, despite the increased image resolution and richer texture information in the cucumber dataset—factors that can elevate computational demands—αSiLU maintained stable inference performance, incurring only a minor latency increase (7.0 ms vs. 6.6 ms for SiLU).
In contrast, CAReLU yielded slightly lower accuracy on the cucumber dataset (93.80% mAP@50 and 80.10% mAP@50–95) while exhibiting the highest latency (12.4 ms). This further underscores the trade-off between its adaptiveness and computational efficiency. While CAReLU’s context-aware design may benefit specific classification tasks, its resource-intensive nature limits practical use in edge-based or latency-sensitive applications.
From a systems perspective, this moderate trade-off in inference time is acceptable, especially in accuracy-critical applications such as precision agriculture, where even marginal gains in detection fidelity can translate to substantial real-world impact. With continual advancements in edge computing hardware (e.g., NVIDIA Jetson, Coral TPU), the practical deployment of αSiLU in real-time plant-monitoring systems becomes increasingly feasible.
In summary, αSiLU outperforms CAReLU in detection accuracy across both datasets while maintaining significantly lower computational cost. These findings reaffirm αSiLU’s effectiveness not only as a plug-and-play replacement for SiLU but also as a practical and efficient alternative to more complex activations like Mish, GELU, and CAReLU.
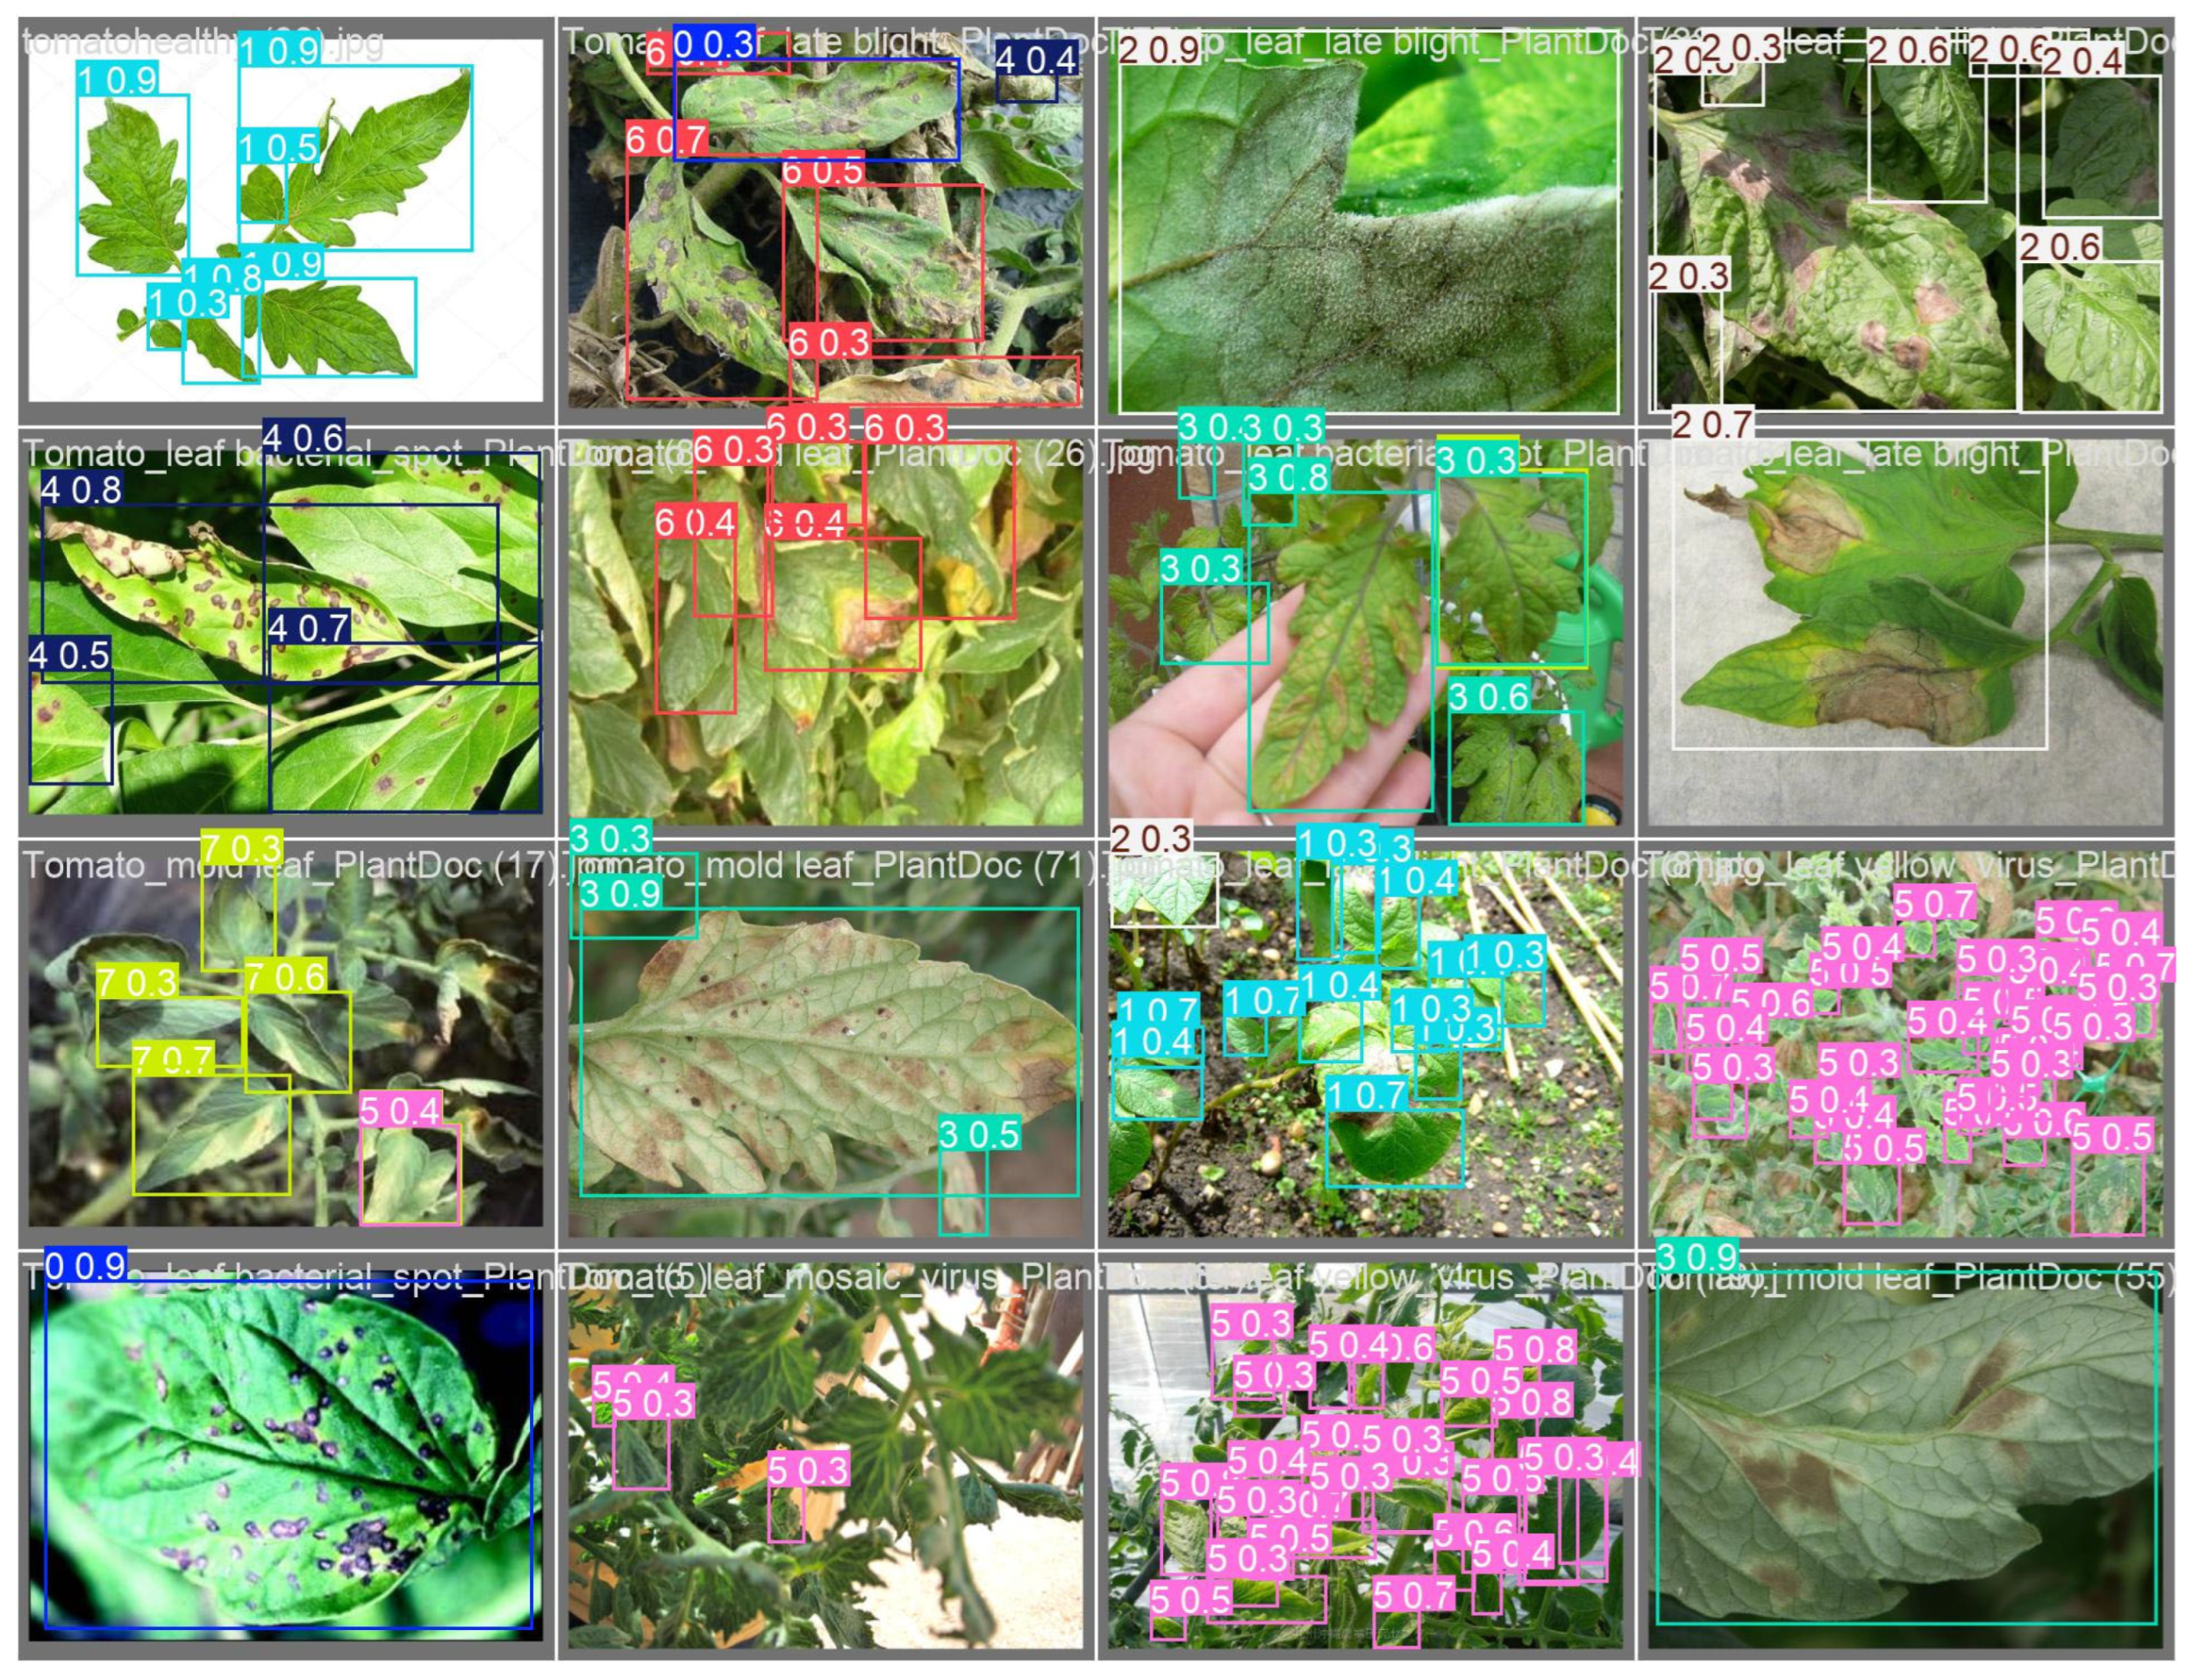
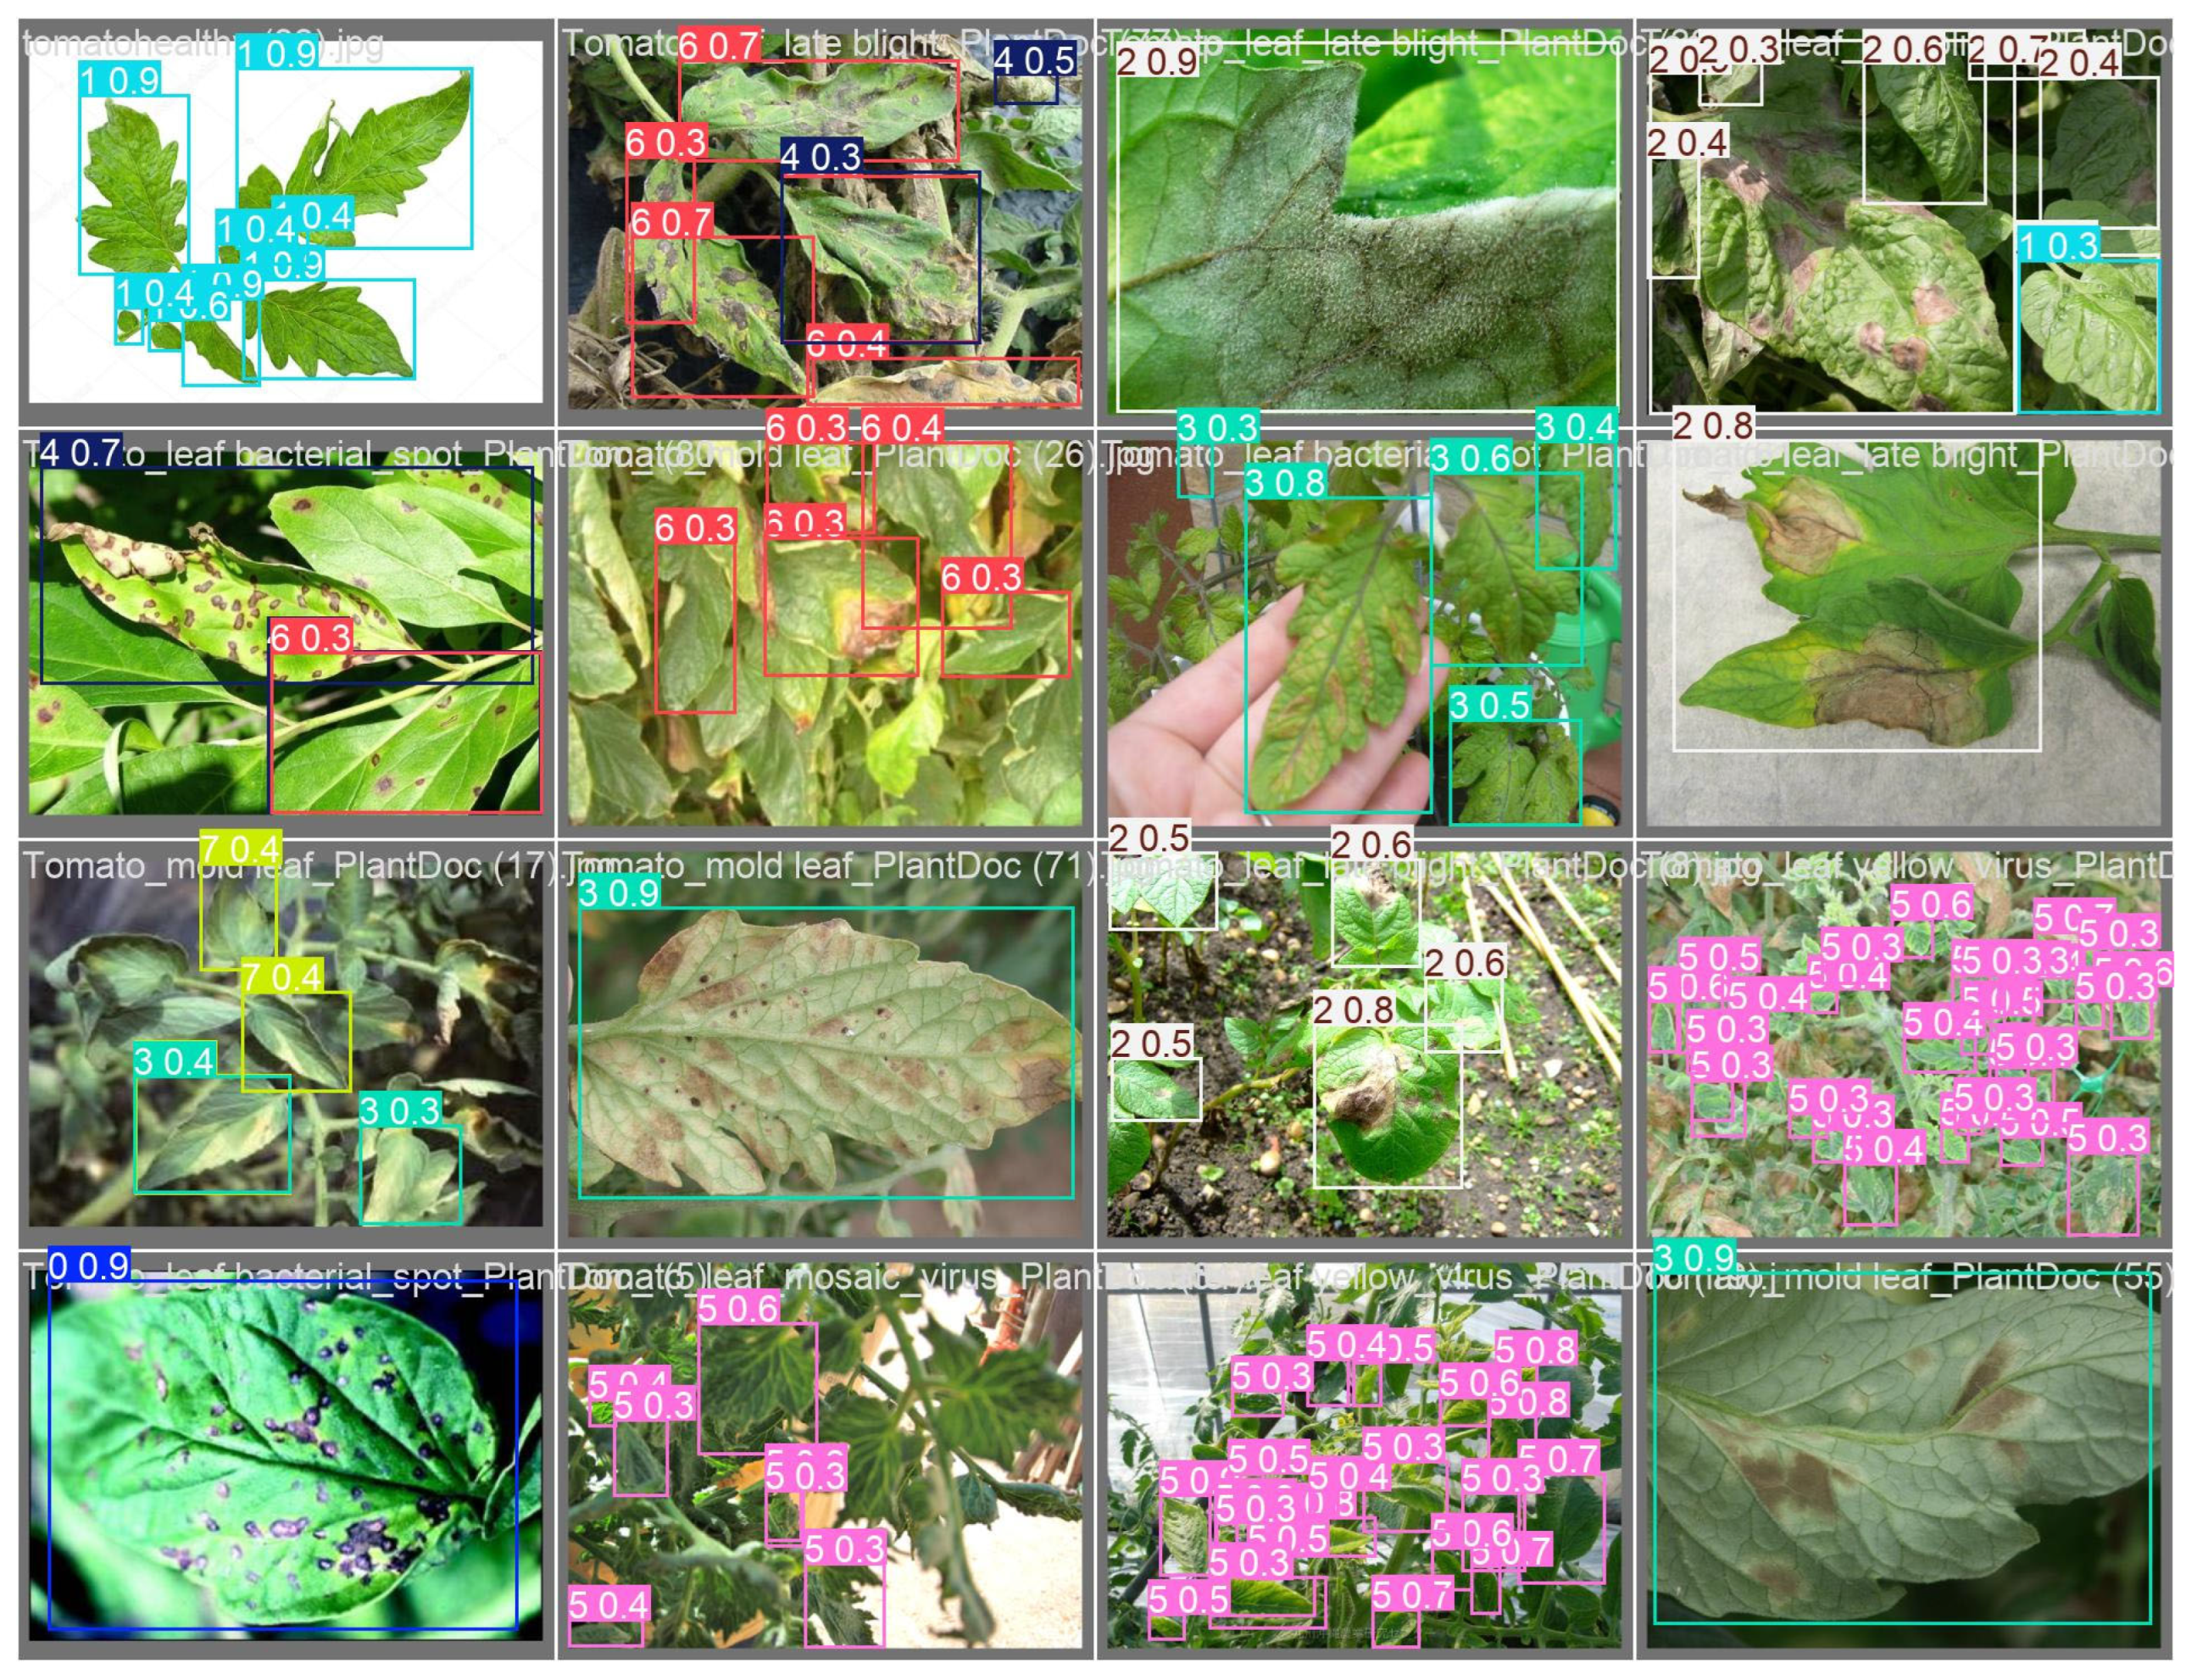
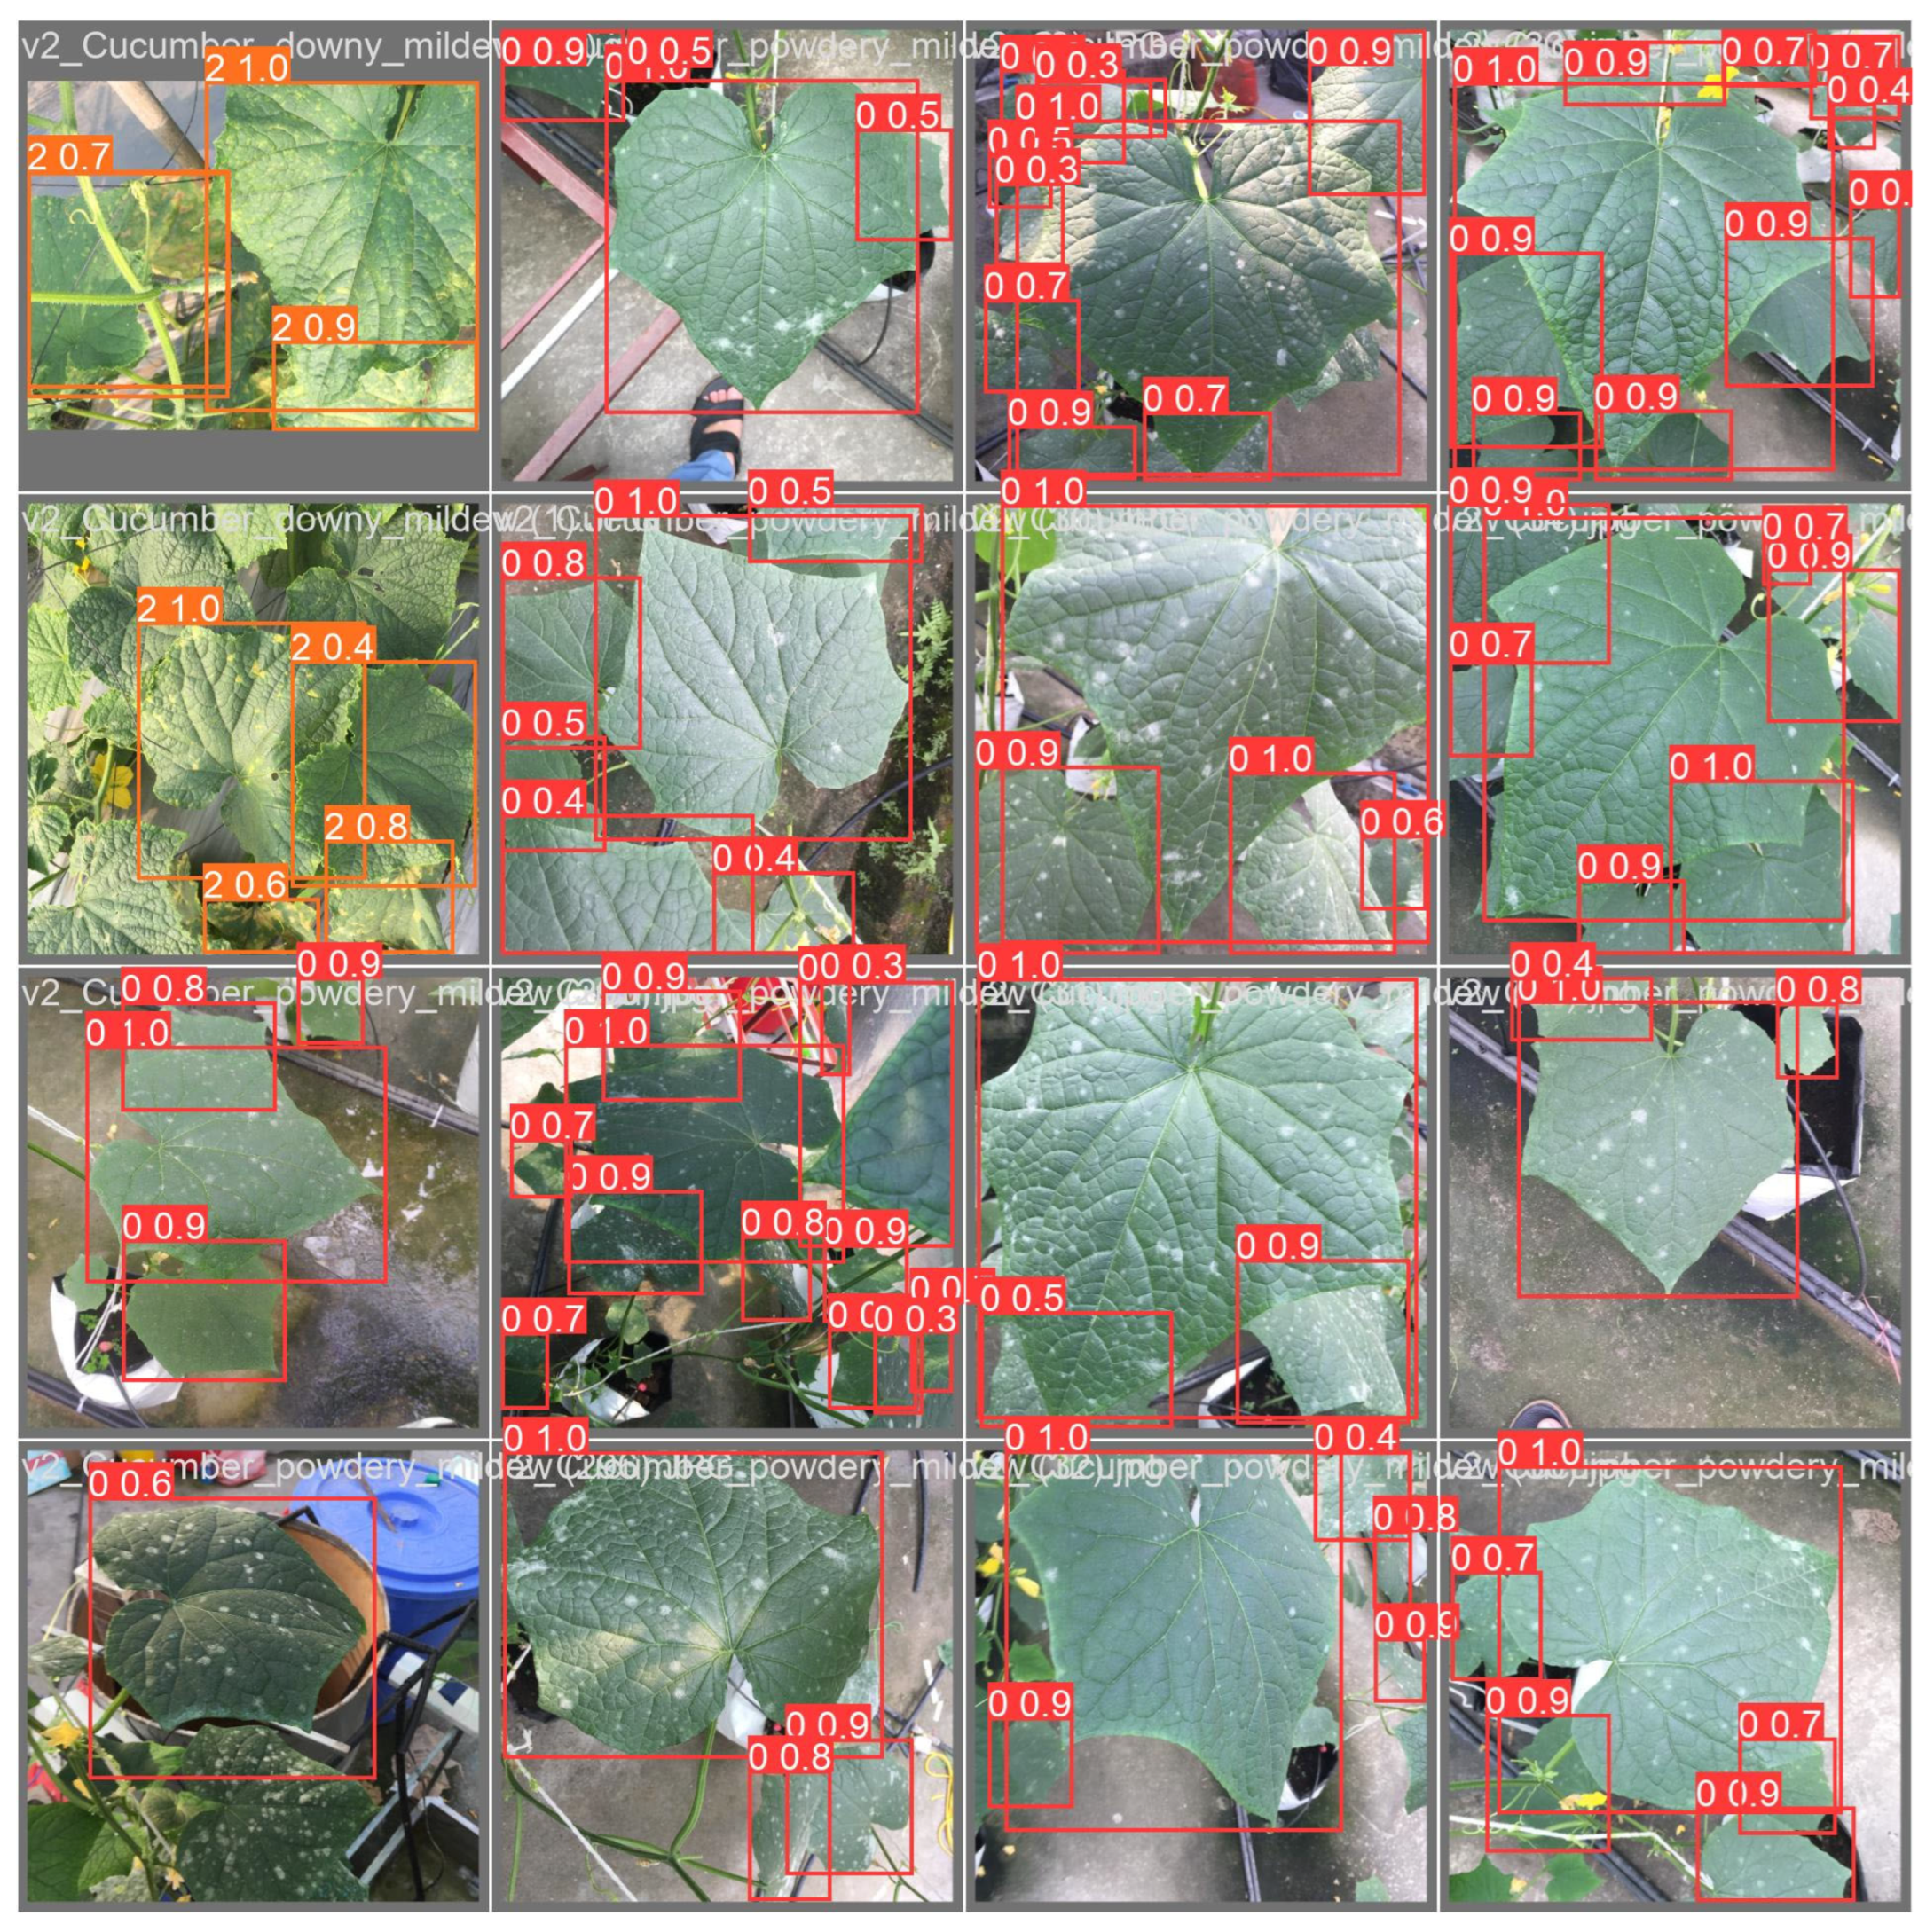
Figure 7, Figure 8, Figure 9 and Figure 10 present the outcomes of disease detection on cucumber and tomato plants, obtained using YOLOv10 and YOLOv11 models with a scaling factor of α = 1 (SiLU) and α = 1.05. The visualized results clearly demonstrate the improvement in accuracy of the YOLO models using alpha-SiLU with α = 1.05 compared to those using the original SiLU (equivalent to α = 1), as mentioned above in Table 6 and Table 7.
Table 8 and Table 9 summarize the disease-detection results obtained using the proposed αSiLU-enhanced YOLO models on the tomato and cucumber datasets, respectively.
In Table 8, the tomato dataset demonstrates strong overall performance, with average scores of 95.7% precision, 84.4% recall, and 92.4% mAP@50. Nevertheless, notable variation in class-wise recall and mAP@50–95 values underscores inherent challenges within the dataset—primarily substantial class imbalance and heterogeneous image quality resulting from the combination of controlled and in-field data sources.
Classes with a high number of training instances and distinctive visual features—such as Tomato_Lateblight, Tomato_Yellow, and Tomato_Healthy—achieved near-optimal results across all metrics. Conversely, performance significantly declined for infrequent or visually ambiguous categories like Tomato_Mosaic, emphasizing the dual influence of class distribution and intra-class visual discriminability on fine-grained detection capabilities (as reflected in mAP@50–95).
Despite these challenges, the model maintains an F1-score above 87% for all classes except Tomato_Mosaic, indicating robust generalization under real-world noise and variability. Precision values remain consistently high across all categories, reflecting the model’s conservative confidence—a valuable trait for applications requiring minimal false positives.
In contrast, Table 9 shows results on the cucumber dataset, which contains fewer classes and a more balanced image distribution. While the model exhibits slightly lower average precision (89.7%) and F1-score (87.2%), it achieves excellent localization, as evidenced by a high mAP@50 of 94.0%. These findings illustrate the αSiLU-based model’s adaptability to datasets with simpler structure and more uniform class representation.
Interestingly, although the cucumber dataset comprises high-resolution images collected under field conditions—introducing greater intra-class variation and environmental noise—the model maintains uniform performance across all classes. This stability suggests that the αSiLU activation function effectively supports robust feature learning in the presence of real-world complexity.
A notable trade-off is observed in the Cucumbers_Healthy class: while precision remains high (92.9%), recall drops to 80.2%. This may stem from confusion between healthy leaves and early-stage disease symptoms, which often lack pronounced visual markers, making them difficult to distinguish.
Across both datasets, the αSiLU activation enables YOLO models to maintain high detection accuracy with minimal degradation across key metrics, regardless of dataset imbalance or visual complexity. The relatively higher mAP@50–95 scores on the tomato dataset, despite its higher degree of variability, suggest that the model can capture deeper semantic features when trained on richer and more diverse class hierarchies.
Overall, these results validate the practicality and robustness of the proposed approach for intelligent plant disease detection, supporting its deployment in diverse agricultural scenarios with variable disease stages, lighting conditions, and imaging environments.

4. Discussion and Future Work

Despite the demonstrated effectiveness of the proposed αSiLU activation function in improving object-detection accuracy across diverse scenarios, several limitations remain that warrant further investigation. Addressing these limitations will not only enhance the generalizability of the model but also broaden its applicability in real-world agricultural intelligence systems.
  • Dataset Diversity, Annotation Granularity, and Multi-Disease Detection
The current study focuses on two specific crops—tomato and cucumber—with single-disease annotations per leaf. Although the datasets incorporate both controlled and in-field conditions with varied resolutions, lighting, and class imbalance (e.g., underrepresentation of some tomato diseases), they still represent a narrow subset of real-world agricultural scenarios. Particularly, the current setup does not account for multi-label conditions, in which a single leaf may exhibit co-occurrence of multiple diseases—a common phenomenon in natural settings.
In addition, collecting high-quality annotated datasets for rare or early-stage disease symptoms remains a significant challenge. Future research should address this limitation by curating more comprehensive datasets that capture diverse leaf morphologies, overlapping visual symptoms across different diseases, and region-specific crop phenotypes. Moreover, the integration of generative AI models to synthetically augment underrepresented classes offers a promising direction to mitigate data imbalance, especially for rare pathological conditions.
Another critical factor that should be addressed in future dataset construction is the inclusion of spatial reference information. Specifically, fulfilling image scale requirements—such as incorporating scale bars or specifying physical dimensions—would enhance the interpretability and reproducibility of lesion measurements. This becomes particularly important for accurate disease quantification, where lesion size relative to leaf area serves as a key diagnostic indicator.
Advanced learning paradigms such as few-shot learning, semi-supervised labeling, and active learning can also be leveraged to improve data efficiency while maintaining strong generalization capabilities across varied agricultural settings.
  • Computational Constraints, Activation Expressiveness, and Model Scalability
Due to hardware limitations (a 6 GB VRAM GPU), this study adopted a fixed grid search strategy for tuning the α parameter within the range [0.5, 2.0], without exploring more advanced optimization-based or adaptive learning methods for dynamic α selection during training. While this approach allows for controlled comparison and practical deployment, it may not fully exploit the potential of αSiLU in more expressive configurations.
Moreover, the current experimental setup primarily focuses on lightweight YOLO variants (e.g., YOLOv11n), which are optimized for real-time performance and low computational cost. Although such models are suitable for edge applications, they offer limited depth and parameter richness, potentially restricting the capacity to capture complex, non-linear patterns where the advantages of αSiLU may be more pronounced.
To gain a deeper understanding of the proposed activation function’s scalability and stability, future work should incorporate its integration into more advanced or hybrid object-detection architectures—such as YOLOv11x, YOLOv12 [25], or Transformer-enhanced CNN backbones. These deeper and more expressive networks can better leverage the non-linear representational power of αSiLU, facilitating a comprehensive evaluation of its performance in large-scale, high-resolution, and computationally demanding detection pipelines.
  • Statistical Robustness and Experimental Reproducibility
Although the reported performance gains with α = 1.05 were consistent across various YOLO versions (YOLOv5n, YOLOv8n, YOLOv10n, and YOLOv11n) and datasets (tomato and cucumber), we acknowledge that the current experimental results are based on single-run evaluations, lacking repeated trials or formal statistical validation. To strengthen the credibility and reproducibility of the findings, future research should incorporate multiple runs with different random seeds, and report statistical measures such as standard deviations, confidence intervals, and paired hypothesis testing (e.g., t-tests or Wilcoxon signed-rank tests). This will allow for a more rigorous assessment of model stability and the statistical significance of observed performance differences.
  • Practical Deployment, System Cost, and Edge-AI Profiling
From a deployment standpoint, although αSiLU introduces minimal computational overhead on conventional GPUs (e.g., 6.6–7.0 ms inference time), its behavior under resource-constrained environments such as Jetson Nano, Raspberry Pi, or Google Coral TPU remains unexamined. These platforms are highly relevant for scalable smart agriculture applications where power efficiency and real-time responsiveness are critical. We plan to rigorously benchmark αSiLU under edge-AI settings, evaluating metrics such as latency, memory footprint, thermal stability, and energy consumption, to ensure compatibility with embedded systems.
In terms of deployment cost, a fully functional detection system—including a lightweight AI device, power module, camera, and enclosures—can be assembled for approximately 300–350 USD, making it accessible for small-to-medium-scale farms. We also envision integrating the model into autonomous monitoring platforms such as greenhouse robots or UAVs for dynamic crop surveillance.
  • Multimodal Sensing and Hardware-Level Enhancement
Currently, the system operates using conventional RGB cameras. However, integrating advanced sensing modalities—such as visible-light photodetectors, multispectral cameras, or low-light imaging sensors—could substantially improve robustness under varying illumination conditions or during early stages of plant disease development, when symptoms are often subtle or not yet visually pronounced [51,52]. This integration would enable the adoption of multimodal learning frameworks, wherein spectral and spatial information are fused to enhance both model interpretability and sensitivity.
In this direction, future research may explore the incorporation of hardware-augmented vision systems as a promising avenue for system-level advancement. The addition of advanced sensors would extend the model’s capability to detect plant diseases under harsh field conditions and support more resilient smart agriculture-monitoring systems operating in environments with unstable lighting or limited visual data. These enhancements hold the potential to significantly improve real-world readiness and broaden the applicability of αSiLU-based detection models in practical agricultural diagnostics.

5. Conclusions

This study introduces αSiLU, a generalized activation function that extends the conventional SiLU by incorporating a tunable scaling parameter α. Designed with adaptability in mind, αSiLU aims to improve the learning dynamics and detection accuracy of deep learning models, particularly within the constraints of real-time object detection. When integrated into compact architectures such as YOLOv10n and YOLOv11n, αSiLU consistently demonstrated enhanced performance across a comprehensive set of evaluation metrics, including precision, recall, F1-score, mAP@50, and mAP@50–95, evaluated on two benchmark plant disease datasets—tomato and cucumber.
Among the tested configurations, α = 1.05 emerged as the optimal setting, yielding the most favorable trade-off between gradient propagation efficiency and training stability. This parameter configuration not only improved detection performance by up to 1.1% in mAP@50 over the standard SiLU, but also outperformed several competitive baselines, including YOLOv5n and YOLOv8n, thereby affirming the general efficacy of αSiLU as a drop-in replacement for widely adopted activation functions.
Significantly, the empirical enhancements are achieved with minimal computational expense. While αSiLU does result in a slight increase in inference latency (approximately +0.5 ms/image when compared to SiLU), this additional delay is minor and generally acceptable in scenarios where accuracy is paramount, particularly in precision agriculture, where timely and precise disease detection is crucial. Moreover, with the swift advancement of hardware acceleration technologies, such as AI edge processors, low-power GPUs, and specialized neural inference engines, this trade-off becomes increasingly insignificant, rendering αSiLU a feasible and scalable option for implementation in practical intelligent systems like UAVs, field robots, and IoT-enabled agricultural platforms.

Author Contributions

Conceptualization, methodology, software, writing—original draft preparation, funding acquisition, project administration, D.T.N.; visualization, investigation, software, validation, T.D.B.; supervision, writing—review and editing, T.M.N.; conceptualization, methodology, software, formal analysis, resources, supervision, data curation, U.Q.N. All authors have read and agreed to the published version of the manuscript.

Funding

This work was partially supported by Vietnam National University of Agriculture under project code T2024-04-18TĐ.

Data Availability Statement

The raw/processed data relevant to this work can be shared upon request.

Conflicts of Interest

The authors declare that there are no conflicts of interest regarding the publication of this paper.

References

  1. Oerke, E.C. Crop losses to pests. J. Agric. Sci. 2006, 144, 31–43. [Google Scholar] [CrossRef]
  2. Savary, S.; Ficke, A.; Aubertot, J.N.; Hollier, C. Crop losses due to diseases and their implications for global food production losses and food security. Food Secur. 2012, 4, 519–537. [Google Scholar] [CrossRef]
  3. Bock, C.H.; Chiang, K.S.; Del Ponte, E.M. Plant disease severity estimated visually: A century of research, best practices, and opportunities for improving methods and practices to maximize accuracy. Trop. Plant Pathol. 2022, 47, 25–42. [Google Scholar] [CrossRef]
  4. Savary, S.; Teng, P.S.; Willocquet, L.; Nutter, F.W., Jr. Quantification and modeling of crop losses: A review of purposes. Annu. Rev. Phytopathol. 2006, 44, 89–112. [Google Scholar] [CrossRef]
  5. Bouhouch, Y.; Esmaeel, Q.; Richet, N.; Barka, E.A.; Backes, A.; Steffenel, L.A.; Hafidi, M.; Jacquard, C.; Sanchez, L. Deep Learning-Based Barley Disease Quantification for Sustainable Crop Production. Phytopathology® 2024, 114, 2045–2054. [Google Scholar] [CrossRef]
  6. Fang, Y.; Ramasamy, R.P. Current and prospective methods for plant disease detection. Biosensors 2015, 5, 537–561. [Google Scholar] [CrossRef]
  7. Ngongoma, M.S.; Kabeya, M.; Moloi, K. A review of plant disease detection systems for farming applications. Appl. Sci. 2023, 13, 5982. [Google Scholar] [CrossRef]
  8. Singla, A.; Nehra, A.; Joshi, K.; Kumar, A.; Tuteja, N.; Varshney, R.K.; Gill, S.S.; Gill, R. Exploration of machine learning approaches for automated crop disease detection. Curr. Plant Biol. 2024, 40, 100382. [Google Scholar] [CrossRef]
  9. Jafar, A.; Bibi, N.; Naqvi, R.A.; Sadeghi-Niaraki, A.; Jeong, D. Revolutionizing agriculture with artificial intelligence: Plant disease detection methods, applications, and their limitations. Front. Plant Sci. 2024, 15, 1356260. [Google Scholar] [CrossRef]
  10. El Sakka, M.; Ivanovici, M.; Chaari, L.; Mothe, J. A Review of CNN Applications in Smart Agriculture Using Multimodal Data. Sensors 2025, 25, 472. [Google Scholar] [CrossRef] [PubMed]
  11. Mao, M.; Hong, M. YOLO Object Detection for Real-Time Fabric Defect Inspection in the Textile Industry: A Review of YOLOv1 to YOLOv11. Sensors 2025, 25, 2270. [Google Scholar] [CrossRef]
  12. Lee, Y.S.; Patil, M.P.; Kim, J.G.; Seo, Y.B.; Ahn, D.H.; Kim, G.D. Hyperparameter Optimization for Tomato Leaf Disease Recognition Based on YOLOv11m. Plants 2025, 14, 653. [Google Scholar] [CrossRef]
  13. Sangaiah, A.K.; Yu, F.N.; Lin, Y.B.; Shen, W.C.; Sharma, A. UAV T-YOLO-rice: An enhanced tiny YOLO networks for rice leaves diseases detection in paddy agronomy. IEEE Trans. Netw. Sci. Eng. 2024, 11, 5201–5216. [Google Scholar] [CrossRef]
  14. Kumar, D.; Malhotra, A. Fast and Precise: YOLO-based Wheat Spot Blotch Recognition. In Proceedings of the 2024 5th IEEE Global Conference for Advancement in Technology (GCAT), Bangalore, India, 4–6 October 2024; pp. 1–5. [Google Scholar]
  15. Xie, J.; Xie, X.; Xie, W.; Xie, Q. An Improved YOLOv8-Based Method for Detecting Pests and Diseases on Cucumber Leaves in Natural Backgrounds. Sensors 2025, 25, 1551. [Google Scholar] [CrossRef]
  16. Mamun, S.B.; Payel, I.J.; Ahad, M.T.; Atkins, A.S.; Song, B.; Li, Y. Grape Guard: A YOLO-based mobile application for detecting grape leaf diseases. J. Electron. Sci. Technol. 2025, 23, 100300. [Google Scholar] [CrossRef]
  17. Singh, Y.; Shukla, S.; Mohan, N.; Parameswaran, S.E.; Trivedi, G. Real-time plant disease detection: A comparative study. In Proceedings of the International Conference on Agriculture-Centric Computation, Chandigarh, India, 11–13 May 2023; Springer Nature: Cham, Switzerland, 2023; pp. 210–224. [Google Scholar]
  18. Lou, Y.; Hu, Z.; Li, M.; Li, H.; Yang, X.; Liu, X.; Liu, F. Real-time detection of cucumber leaf diseases based on convolution neural network. In Proceedings of the 2021 IEEE 5th Information Technology, Networking, Electronic and Automation Control Conference (ITNEC), Xi’an, China, 15–17 October 2021; Volume 5, pp. 1040–1046. [Google Scholar]
  19. Wang, Y.; Zhang, P.; Tian, S. Tomato leaf disease detection based on attention mechanism and multi-scale feature fusion. Front. Plant Sci. 2024, 15, 1382802. [Google Scholar] [CrossRef]
  20. Ding, J.; Jeon, W.; Rhee, S. DM-YOLOv8: Cucumber disease and insect detection using detailed multi-intensity features. In Proceedings of the 2024 International Conference on Artificial Intelligence in Information and Communication (ICAIIC), Osaka, Japan, 19–22 February 2024; IEEE: New York, NY, USA, 2024; pp. 199–204. [Google Scholar]
  21. Abulizi, A.; Ye, J.; Abudukelimu, H.; Guo, W. DM-YOLO: Improved YOLOv9 model for tomato leaf disease detection. Front. Plant Sci. 2025, 15, 1473928. [Google Scholar] [CrossRef] [PubMed]
  22. He, Z.; Tong, M. LT-YOLO: A Lightweight Network for Detecting Tomato Leaf Diseases. Comput. Mater. Contin. 2025, 82, 3. [Google Scholar] [CrossRef]
  23. Rajamohanan, R.; Latha, B.C. An optimized YOLO v5 model for tomato leaf disease classification with field dataset. Eng. Technol. Appl. Sci. Res. 2023, 13, 12033–12038. [Google Scholar] [CrossRef]
  24. Liu, Z.; Guo, X.; Zhao, T.; Liang, S. YOLO-BSMamba: A YOLOv8s-Based Model for Tomato Leaf Disease Detection in Complex Backgrounds. Agronomy 2025, 15, 870. [Google Scholar] [CrossRef]
  25. Tian, Y.; Ye, Q.; Doermann, D. Yolov12: Attention-centric real-time object detectors. arXiv 2025, arXiv:2502.12524. [Google Scholar]
  26. Li, Y.; Yan, H.; Li, D.; Wang, H. Robust Miner Detection in Challenging Underground Environments: An Improved YOLOv11 Approach. Appl. Sci. 2024, 14, 11700. [Google Scholar] [CrossRef]
  27. Cheng, S.; Han, Y.; Wang, Z.; Liu, S.; Yang, B.; Li, J. An Underwater Object Recognition System Based on Improved YOLOv11. Electronics 2025, 14, 201. [Google Scholar] [CrossRef]
  28. Ye, T.; Huang, S.; Qin, W.; Tu, H.; Zhang, P.; Wang, Y.; Gao, C.; Gong, Y. YOLO-FIX: Improved YOLOv11 with Attention and Multi-Scale Feature Fusion for Detecting Glue Line Defects on Mobile Phone Frames. Electronics 2025, 14, 927. [Google Scholar] [CrossRef]
  29. Gao, Y.; Xin, Y.; Yang, H.; Wang, Y. A Lightweight Anti-Unmanned Aerial Vehicle Detection Method Based on Improved YOLOv11. Drones 2024, 9, 11. [Google Scholar] [CrossRef]
  30. Li, Y.; Guo, Z.; Sun, Y.; Chen, X.; Cao, Y. Weed Detection Algorithms in Rice Fields Based on Improved YOLOv10n. Agriculture 2024, 14, 2066. [Google Scholar] [CrossRef]
  31. Wang, D.; Tan, J.; Wang, H.; Kong, L.; Zhang, C.; Pan, D.; Li, T.; Liu, J. SDS-YOLO: An improved vibratory position detection algorithm based on YOLOv11. Measurement 2025, 244, 116518. [Google Scholar] [CrossRef]
  32. Liao, Y.; Li, L.; Xiao, H.; Xu, F.; Shan, B.; Yin, H. YOLO-MECD: Citrus Detection Algorithm Based on YOLOv11. Agronomy 2025, 15, 687. [Google Scholar] [CrossRef]
  33. Shah, V.; Youngblood, N. Leveraging continuously differentiable activation functions for learning in quantized noisy environments. arXiv 2024, arXiv:2402.02593. [Google Scholar] [CrossRef]
  34. Kaseb, Z.; Xiang, Y.; Palensky, P.; Vergara, P.P. Adaptive Activation Functions for Deep Learning-based Power Flow Analysis. In Proceedings of the 2023 IEEE PES Innovative Smart Grid Technologies Europe (ISGT EUROPE), Grenoble, France, 23–26 October 2023; pp. 1–5. [Google Scholar]
  35. Rajanand, A.; Singh, P. ErfReLU: Adaptive activation function for deep neural network. Pattern Anal. Appl. 2024, 27, 68. [Google Scholar] [CrossRef]
  36. Chen, J.; Pan, Z. Competition-based Adaptive ReLU for Deep Neural Networks. arXiv 2024, arXiv:2407.19441. [Google Scholar]
  37. Lee, M. Gelu activation function in deep learning: A comprehensive mathematical analysis and performance. arXiv 2023, arXiv:2305.12073. [Google Scholar] [CrossRef]
  38. Chen, Z.; Yang, J.; Li, F.; Feng, Z.; Chen, L.; Jia, L.; Li, P. Foreign Object Detection Method for Railway Catenary Based on a Scarce Image Generation Model and Lightweight Perception Architecture. IEEE Trans. Circuits Syst. Video Technol. 2025. Available online: https://ieeexplore.ieee.org/document/10988810 (accessed on 12 August 2025). [CrossRef]
  39. Zhao, Z.; Qin, Y.; Qian, Y.; Wu, Y.; Qin, W.; Zhang, H.; Wu, X. Automatic potential safety hazard evaluation system for environment around high-speed railroad using hybrid U-shape learning architecture. IEEE Trans. Intell. Transp. Syst. 2024, 26, 1071–1087. [Google Scholar] [CrossRef]
  40. Khanam, R.; Hussain, M. Yolov11: An overview of the key architectural enhancements. arXiv 2024, arXiv:2410.17725. [Google Scholar] [CrossRef]
  41. He, K.; Zhang, X.; Ren, S.; Sun, J. Delving Deep into Rectifiers: Surpassing Human-Level Performance on ImageNet Classification. In Proceedings of the IEEE International Conference on Computer Vision (ICCV), Santiago, Chile, 7–13 December 2015; pp. 1026–1034. [Google Scholar]
  42. He, K.; Zhang, X.; Ren, S.; Sun, J. Deep Residual Learning for Image Recognition. In Proceedings of the IEEE Conference on Computer Vision and Pattern Recognition (CVPR), Las Vegas, NV, USA, 27–30 June 2016; pp. 770–778. [Google Scholar]
  43. Ramachandran, P.; Zoph, B.; Le, Q.V. Searching for Activation Functions. arXiv 2017, arXiv:1710.05941v2. [Google Scholar] [CrossRef]
  44. Misra, D. Mish: A self-regularized non-monotonic activation function. arXiv 2019, arXiv:1908.08681. [Google Scholar]
  45. Ramachandran, P.; Zoph, B.; Le, Q.V. Swish: A self-gated activation function. arXiv 2017, arXiv:1710.05941v1. [Google Scholar]
  46. Hussain, M. Yolov5, yolov8 and yolov10: The go-to detectors for real-time vision. arXiv 2024, arXiv:2407.02988. [Google Scholar]
  47. Elfwing, S.; Uchibe, E.; Doya, K. Sigmoid-weighted linear units for neural network function approximation in reinforcement learning. Neural Netw. 2018, 107, 3–11. [Google Scholar] [CrossRef]
  48. Mohanty, S.P.; Hughes, D.P.; Salathé, M. Using deep learning for image-based plant disease detection. Front. Plant Sci. 2016, 7, 1419. [Google Scholar] [CrossRef] [PubMed]
  49. Singh, D.; Jain, N.; Jain, P.; Kayal, P.; Kumawat, S.; Batra, N. PlantDoc: A dataset for visual plant disease detection. In Proceedings of the 7th ACM IKDD CoDS and 25th COMAD, Hyderabad, India, 5–7 January 2020; pp. 249–253. [Google Scholar]
  50. Uoc, N.Q.; Duong, N.T.; Son, L.A.; Thanh, B.D. A novel automatic detecting system for cucumber disease based on the convolution neural network algorithm. GMSARN Int. J. 2022, 16, 295–301. [Google Scholar]
  51. Silva, J.P.; Vieira, E.M.F.; Gwozdz, K.; Silva, N.E.; Kaim, A.; Istrate, M.C.; Ghica, C.; Correia, J.H.; Pereira, M.; Marques, L.; et al. High-performance and self-powered visible light photodetector using multiple coupled synergetic effects. Mater. Horiz. 2024, 11, 803–812. [Google Scholar] [CrossRef]
  52. Su, L. Room temperature growth of CsPbBr3 single crystal for asymmetric MSM structure photodetector. J. Mater. Sci. Technol. 2024, 187, 113–122. [Google Scholar] [CrossRef]
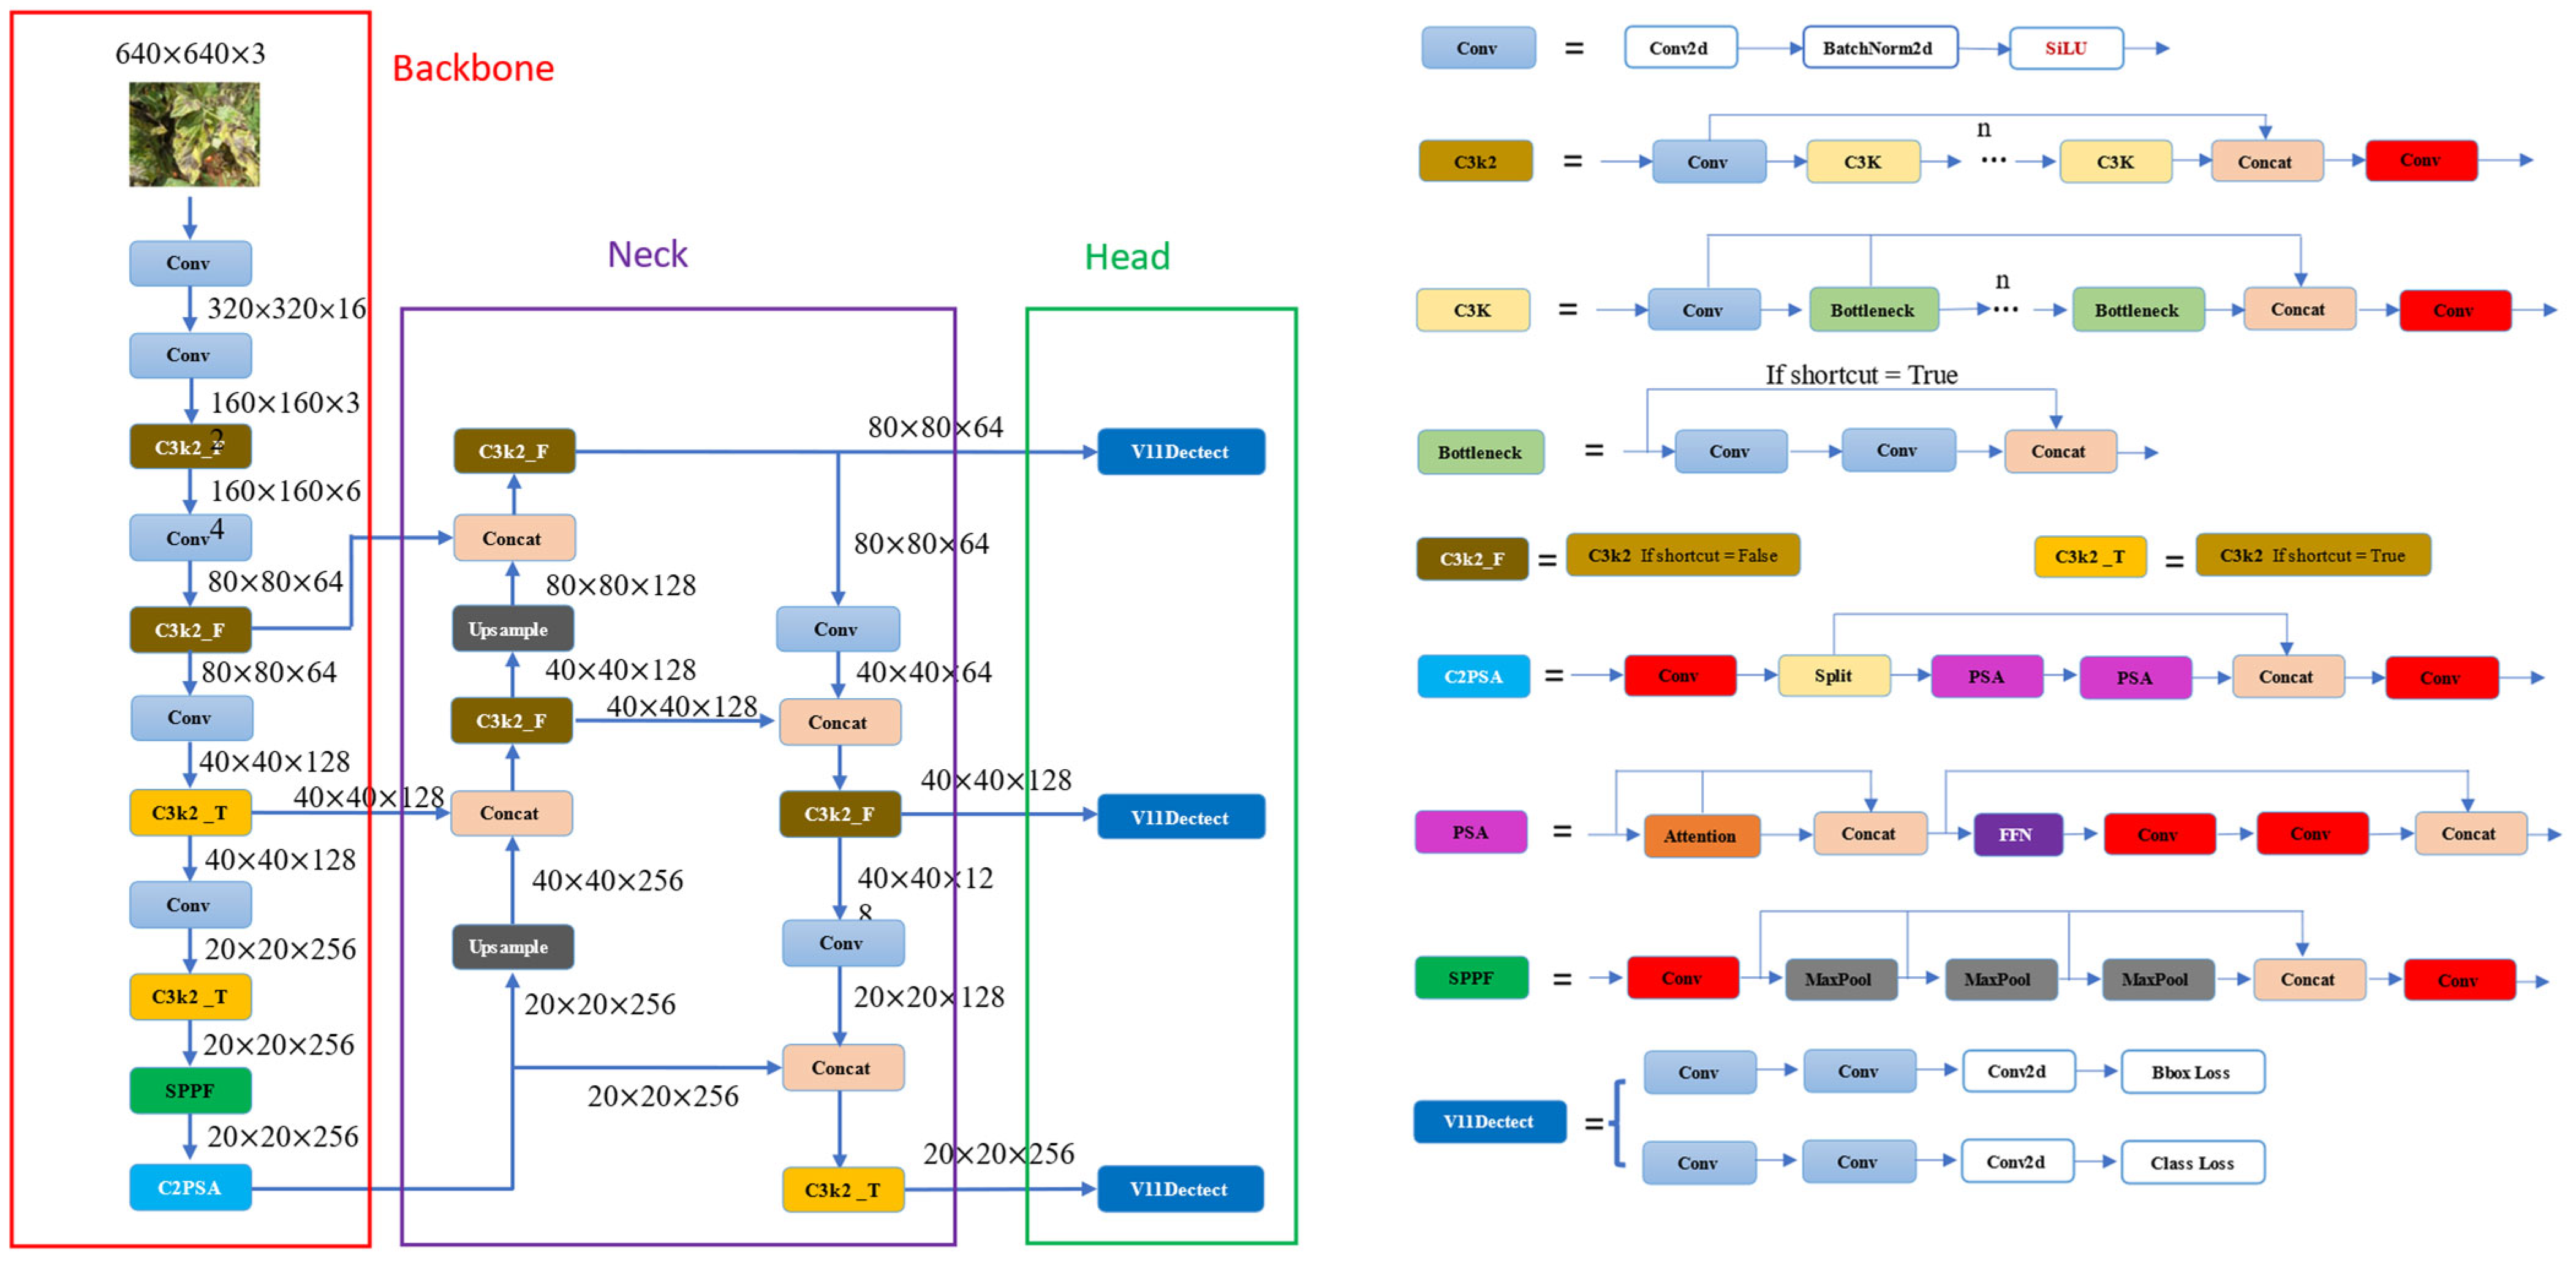
Figure 1. Overall architecture of the YOLOv11n model.
Agriengineering 07 00271 g001
Figure 2. The relationship of α with the αSiLU function (a) and its derivative (b).
Agriengineering 07 00271 g002
Figure 3. Some sample images of tomato plant diseases [48,49].
Agriengineering 07 00271 g003
Figure 4. Summary of image quantity and annotation distribution per tomato disease class in the training, validation, and test subsets. The x-axis lists the disease classes; the y-axis shows image and instance counts. Each class includes six colored bars indicating: training images (dark blue), training annotations (orange), validation images (gray), validation annotations (yellow), test images (light blue), and test annotations (green). This figure highlights data balance and annotation density for model training and evaluation.
Agriengineering 07 00271 g004
Figure 5. (ac) Some sample images of cucumber plant disease data [50].
Agriengineering 07 00271 g005
Figure 6. Class-wise composition of cucumber disease dataset: number of images and corresponding object instances across dataset splits. The x-axis represents training, validation, and test sets; the y-axis shows the number of images and annotated instances. Bars are color-coded by class: Cucumber_Powdery (blue), Cucumbers_Healthy (orange), and Cucumber_Downy (gray). This figure supports assessment of class distribution and dataset suitability for deep learning tasks.
Agriengineering 07 00271 g006
Figure 7. Disease-detection results on tomato plants using YOLOv11n with activation function α = 1 (SiLU). Each bounding box label begins with a Class ID, which numerically encodes the predicted disease category (e.g., ID = 2 denotes Tomato_Lateblight, ID = 1 for Tomato_Healthy, ID = 3 for Tomato_Leaf_Mold, etc., as defined in Table 8). In this baseline configuration, notable misclassifications are observed. For instance, the leaf in the 11th image from the top—correctly belonging to Tomato_Lateblight (ID = 2)—is incorrectly labeled as Tomato_Healthy (ID = 1). Similarly, in the 9th image, Tomato_Leaf_Mold (ID = 3) is misidentified as both Tomato_Mosaic (ID = 7) and Tomato_Yellow (ID = 5). These errors suggest that the SiLU-based model struggles to disambiguate visually similar disease symptoms under certain conditions.
Agriengineering 07 00271 g007
Figure 8. Tomato disease-identification results employing YOLOv11n with α = 1.05. This figure employs the same visualization format as Figure 7, where the leading Class ID in each prediction denotes the disease class assigned by the model. Compared to the baseline, the αSiLU-enhanced model demonstrates improved diagnostic accuracy. In the 11th image, the previously misclassified Tomato_Lateblight (ID = 2) is now correctly detected. Likewise, the confusion involving Tomato_Leaf_Mold (ID = 3) in the 9th image is notably reduced, with fewer incorrect detections of Tomato_Mosaic (ID = 7) and Tomato_Yellow (ID = 5). These results highlight αSiLU’s ability to better preserve fine-grained visual features, contributing to enhanced inter-class separability under real-world image variability.
Agriengineering 07 00271 g008
Figure 9. Detection results on cucumber plants using YOLOv10n with Activation Parameter α = 1 (SiLU).
Agriengineering 07 00271 g009
Figure 10. The detection results of cucumber plant diseases using the YOLOv10n model with a modified activation parameter (α = 1.05). Compared to the baseline model in Figure 9, the αSiLU-enhanced variant demonstrates improved detection performance, particularly evident in test images 3 and 5, where a higher number of symptomatic regions are accurately identified. Although visual differences in other samples are less pronounced, the observed improvements align well with the quantitative results in Table 5, thereby validating the practical effectiveness of the αSiLU activation function in real-world plant disease-detection scenarios.
Agriengineering 07 00271 g010
Table 1. Summary of key characteristics comparing basic activation functions.
Activation
Funtion
FormulaDerivativeNon-
Linearity
Gradient Stability
ReLU m a x   ( 0 , x ) 1   i f   x > 0 ,
0   i f   x 0
Yes No   ( vanishing   gradient   when   x < 0 )
LeakyReLU m a x   ( α x , x ) 1   o r   α YesYes
Mish x . t a n h   ( ln 1 + e x ) tanh ln 1 + e x + x . σ x .
( 1 t a n h 2 ln 1 + e x )
YesYes, smooth grandient flow
GELU x · Φ x ( w h e r e   Φ x
i s   t h e   G a u s s i a n   C D F )
Φ x   + x · ϕ x
( w h e r e   ϕ x   i s   t h e   G a u s s i a n   P D F )
YesYes, smooth and adaptive
ELU x   i f   x > 0 ,
α e x 1   i f   x 0
1   i f   x   > 0 ,
α e x   i f x 0
YesYes, avoids vanishing gradients
SiLU x · σ ( x ) σ x + x σ ( x ) ( 1 σ x ) YesYes
CAReLU R e L U ( g ( p ) · z )
( where   g p = K · tanh α p + β )
g ( p ) · 1 z > 0 YesYes (tanh ensures smooth transition and adaptive stability)
αSiLU α x · σ ( α x ) α σ α x + α 2 x σ ( α x ) ( 1 σ α x ) YesYes, adjustable by α
Table 2. Performance analysis of YOLOv11n with varying α values on the tomato disease dataset.
ModelActivationαP (%)R (%)F1-Score (%)mAP@50 (%)mAP@50–95 (%)
YOLOv11nαSiLU0.595.7083.4089.1391.8082.00
αSiLU0.795.2083.8089.1491.8081.70
αSiLU0.896.1082.8089.1492.2082.10
αSiLU0.994.8084.1089.1392.0082.20
αSiLU0.9595.3084.6089.6391.9081.90
SiLU195.2083.4088.9191.3081.30
αSiLU1.02596.7083.6089.6791.7081.60
αSiLU1.0595.7084.4089.7092.4082.00
αSiLU1.05595.3083.5089.0191.7081.70
αSiLU1.195.2083.3088.8591.6081.80
αSiLU1.594.4084.6089.2391.3081.30
αSiLU1.895.6083.8089.3191.5081.40
αSiLU296.3083.4089.3991.6081.50
Table 3. Impact assessment of the α parameter in YOLOv11n on the cucumber disease dataset.
ModelActivationαP (%)R (%)F1-Score (%)mAP@50 (%)mAP@50–95 (%)
YOLOv11nαSiLU0.587.4087.5087.4594.2080.70
αSiLU0.787.4087.1087.2594.3080.90
αSiLU0.8587.1087.3087.2094.1080.60
αSiLU0.987.6086.3086.9594.0080.50
αSiLU0.9589.1085.9087.4794.2080.70
SiLU187.8087.0087.4094.1080.80
αSiLU1.02588.0086.0086.9994.1080.60
αSiLU1.0587.8087.6087.7094.3081.00
αSiLU1.0688.0087.3087.6594.2080.80
αSiLU1.0889.6085.6087.5594.3080.70
αSiLU1.188.4086.3087.3494.2080.70
αSiLU1.588.1087.9088.0094.2080.90
αSiLU1.886.6088.1087.3493.9080.80
αSiLU287.8086.7087.2594.1080.80
Table 4. Cross-model evaluation on tomato disease detection using different YOLO variants.
ModelPrecisionRecallF1-ScoremAP@50mAP@50–95
YOLOv5n (SiLU)96.90%83.10%89.47%91.60%80.80%
YOLOv5n (α = 1.05)95.60%83.50%89.14%92.20%80.80%
YOLOv8n (SiLU)97.10%82.80%89.38%91.90%81.40%
YOLOv8n (α = 1.05)95.80%82.60%88.71%92.00%81.20%
YOLOv10n (SiLU)94.70%83.60%88.80%91.00%80.90%
YOLOv10n (α = 1.05)96.60%82.80%89.17%91.60%80.90%
YOLOv11n(SiLU)95.20%83.40%88.91%91.30%81.30%
YOLOv11n (α = 1.05)95.70%84.40%89.70%92.40%82.00%
Table 5. Performance benchmarking of YOLO architectures on the cucumber disease dataset.
ModelPrecisionRecallF1-ScoremAP@50mAP@50–95
YOLOv5n (SiLU)88.10%84.50%86.26%93.50%79.30%
YOLOv5n (α = 1.05)88.40%85.00%86.67%93.60%79.30%
YOLOv8n (SiLU)85.70%87.00%86.35%93.40%79.70%
YOLOv8n (α = 1.05)86.50%87.20%86.85%93.50%79.80%
YOLOv10n (SiLU)88.80%84.60%86.65%93.50%79.40%
YOLOv10n (α = 1.05)89.70%84.90%87.23%94.00%79.80%
YOLOv11n(SiLU)87.80%87.00%87.40%94.10%80.80%
YOLOv11n (α = 1.05)87.80%87.60%87.70%94.30%81.00%
Table 6. Evaluation of alternative activation functions for tomato disease detection.
ModelActivation FunctionsmAP@50
(%)
mAP@50–95
(%)
Inference
(ms)
YOLOv11nLeakyReLU91.0080.605.9
YOLOv11nReLU91.2 080.805.8
YOLOv11nMish91.2081.305.9
YOLOv11nGELU91.4081.305.9
YOLOv11nELU91.7081.605.9
YOLOv11nSiLU91.3081.306.1
YOLOv11nCAReLU91.5080.9012.1
YOLOv11n (α = 1.05)αSiLU92.4082.006.6
Table 7. Comparative analysis of activation functions on the cucumber disease-recognition task.
ModelActivation FunctionsmAP@50
(%)
mAP@50–95
(%)
Inference
(ms)
YOLOv11nLeakyReLU94.0080.106.4
YOLOv11nReLU94.2080.206.3
YOLOv11nMish94.1080.806.2
YOLOv11nGELU94.2080.706.4
YOLOv11nELU94.1080.606.3
YOLOv11nSiLU94.1080.806.6
YOLOv11nCAReLU93.8080.1012.4
YOLOv11n (α = 1.05)αSiLU94.3081.007.0
Table 8. The disease-detection results on tomato plants using YOLOv11n with α = 1.05.
Class IDObject ClassPRF1-ScoremAP@50mAP@50–95
0Tomato_Septoria91.1%83.8%87.3%92.3%79.8%
1Tomato_Healthy95.7%84.2%89.6%95.5%81.0%
2Tomato_Lateblight96.3%94.9%95.6%97.8%84.5%
3Tomato_Leaf_Mold94.2%87.8%90.9%94.2%86.6%
4Tomato_Bacterial96.6%86.3%91.2%91.3%88.6%
5Tomato_Yellow96.1%88.4%92.1%96.8%83.1%
6Tomato_Earlyblight98.1%85.5%91.4%93.1%81.6%
7Tomato_Mosaic97.6%64.5%77.7%78.5%70.9%
Average95.7%84.4%89.7%92.4%82.0%
Table 9. The disease-detection results on cucumber plants using YOLOv10n with α = 1.05.
Class IDObject ClassPRF1-ScoremAP@50Class ID
0Cucumber_Powdery88.1%88.3%88.2%95.4%81.2%
1Cucumbers_Healthy92.9%80.2%86.1%93.8%80.9%
2Cucumber_Downy88.2%86.1%87.1%92.7%77.2%
Average89.7%84.9%87.2%94.0%79.8%
Disclaimer/Publisher’s Note: The statements, opinions and data contained in all publications are solely those of the individual author(s) and contributor(s) and not of MDPI and/or the editor(s). MDPI and/or the editor(s) disclaim responsibility for any injury to people or property resulting from any ideas, methods, instructions or products referred to in the content.