Article

Study on the Influence of Hole Shape and Grain Orientation on the Adsorption Characteristics of Maize Seeds and CFD Analysis

1
Chinese Academy of Agricultural Mechanization Sciences Group Co., Ltd., Beijing 100083, China
2
National Key Laboratory of Agricultural Equipment Technology, Beijing 100083, China
*
Author to whom correspondence should be addressed.
AgriEngineering 2025, 7(7), 218; https://doi.org/10.3390/agriengineering7070218
Submission received: 28 April 2025 / Revised: 17 June 2025 / Accepted: 19 June 2025 / Published: 4 July 2025

Abstract

The adsorption performance of maize seeds in air-suction seed metering devices directly affects the operational quality of maize seeders. The suction holes on the seed metering disc play a crucial role in determining the device’s ability to adsorb maize seeds and serve as a key design parameter for air-suction seed metering systems. Existing research has primarily focused on seed posture control and suction force models for standard particles, while experimental studies on the actual adsorption performance of maize seeds remain scarce. To further investigate the adsorption characteristics of maize seeds under different suction hole geometries, this study employed a self-developed adsorption force measurement platform to conduct experiments on maize seeds in various adsorption postures. The resulting force–displacement curves reveal the variation of adsorption force as seeds detach from the suction holes. To assess the applicability of conventional suction force calculation models, computational fluid dynamics (CFD) simulations were performed to analyze the adsorption mechanism of standard particles. The simulation results indicate significant limitations in commonly used suction force estimation methods. For instance, in experiments evaluating the effect of equivalent adsorption area, the relative error between the suction force estimated by the traditional pressure-based method for triangular holes and the actual measured force reached 40.82%. Similarly, the relative error between the force estimated by the airflow drag method for square suction holes and the actual measured force under the same conditions was 17.14%. Therefore, when evaluating actual seed adsorption, it is essential to comprehensively consider factors such as suction hole geometry, blocked suction area, seed shape, vacuum pressure, and the overlap depth between the seed boundary and the suction hole, all of which significantly influence the adsorption effect.

1. Introduction

Vacuum adsorption devices are widely used in various production and processing sectors of agriculture and industry, such as handling and transporting electronic components, directional conveying of granular materials, fruit and vegetable picking, and vacuum seed metering applications [1,2,3]. A vacuum system generates a pressure difference between the vacuum adsorption device and the atmospheric environment via a vacuum pump [4]. The gas from the environment flows through the suction holes of the device into the low-pressure vacuum system, creating an adsorption effect through the suction flow (vacuum pressure field) near the suction holes [5]. The adsorption effect at the suction holes provides clear advantages for handling and gripping small, discrete materials [6]. Compared to traditional material handling methods, vacuum adsorption devices can more easily achieve sequential conveying, low-damage gripping, and fast operations.
To date, the principle of vacuum adsorption has been increasingly applied, and many researchers worldwide have studied the factors affecting suction force. Li et al. [7] developed an improved suction force empirical model for high-sphericity seeds using a suction force measurement device, with a relative prediction error of nearly 10%. In another study, Li et al. [8] proposed a novel experimental device for measuring suction force, using dimensional analysis to construct an empirical function for spherical particles in gas–solid fluids, suggesting that suction force may result from the combination of multiple forces. Wang et al. [9] used the π theorem and a modified Murphy’s law to develop a preliminary suction force model for ellipsoidal particles, with an error range of ±10%. However, in actual production and nature, regular-shaped materials are rare, and the demand for applying vacuum adsorption to irregular materials is growing.
Precision maize seeding has become a hot topic in seeding technology, and vacuum seed metering has become one of the primary working methods for maize seed metering devices. However, the large variation in maize seed shapes requires accurately determining the suction force applied to the seeds to ensure stable adsorption and high-quality seeding [10]. Yousry et al. [11] designed a vacuum seed disc based on the physical properties of maize seeds and determined the structural and operational parameters of the seed disc, whose sowing quality index reached 95%. Hussain et al. [12] discovered that the suction holes play a key role in the rapid formation of pressure differences, affecting the adsorption and picking of seeds. Tang et al. [13] performed a statistical analysis on how suction holes that mimic seed shapes affect the adsorption posture of maize seeds. At 15 km/h, compared to the standard round-hole plates, the horizontal-profiled plates (suction holes that mimic seed shapes) show superior performance, with 81.20% of seeds being adsorbed in the horizontal adsorption posture. Sun et al. [14] categorized maize seeds, established models, and designed a seed disc with horseshoe-shaped suction holes, followed by a coupled simulation analysis of the seeding process. Zhao et al. [15] designed a directional adsorption and placement mechanism for flat maize seeds, which enables the seeds to be oriented correctly during adsorption, and developed a surface-conforming adsorption model.
However, past theoretical studies have mainly focused on regular-shaped materials or have only analyzed a single shape of seeds. Furthermore, traditional suction force calculation methods, such as the pressure calculation method (Equation (1)) or the aerodynamic drag force method (Equation (2)), have not analyzed the influencing factors of suction force in detail. The pressure calculation method is suitable for ideal scenarios where the material completely covers the suction hole. However, in actual cases, the adsorption of irregular materials often leaves parts of the suction hole unblocked. Additionally, factors such as fluid viscosity and airflow velocity can also influence the adsorption performance of particles. Moreover, since the flow characteristics of the suction flow differ from those of pipe flow, the method for calculating suction force cannot be simply equated to air resistance. Ding et al. [16] found that the adsorption posture of seeds significantly affects the stability of the seeding process. Meanwhile, the suction effects produced by different vacuum nozzles vary [17].
This study investigates the adsorption characteristics of maize kernels using a vacuum maize seed metering device’s suction force measurement platform. The objective is to examine the adsorption characteristics of various maize kernel types and their different adsorption postures under the influence of different suction hole shapes. Standard-shaped particles are used as a control group, and simulation analysis is combined with experimental data to explore the discrepancies between actual adsorption results and commonly used calculation methods. The findings of this study provide valuable data to support the design of seed discs in maize seed metering devices.

2. Analysis Methods and Research Principles

2.1. Theoretical Model and Analysis

In the study of vacuum maize seed metering devices, suction force is often represented by pressure (Equation (1)). However, pressure refers to the perpendicular force acting on the contact surface between two objects. In fluid–solid interactions, it is typically used to calculate the static pressure at a given point in an ideal fluid. When a particle is adsorbed, it is assumed that the particle is fully attached to the suction hole surface, completely blocking the suction hole. In this case, the vacuum pressure of the air acts entirely on the adsorbed particle, as illustrated in Figure 1. However, in practical operations, it is difficult for the particles to perfectly conform to the suction hole. The airflow at the suction hole exhibits a complex turbulent flow pattern. Therefore, Experiment 1 was designed to verify the representativeness of vacuum pressure in relation to the actual suction force exerted on particles, as described in Section 3 of this paper.
F S = P n S n
where Pn is the vacuum degree of the suction hole, pa; Sn is the equivalent blocking area, m2.
Some researchers have introduced the drag force calculation equation for airflow in a uniform flow field into the calculation of suction force at the suction hole [15], as shown in Equations (2) and (3). This method is used to approximately calculate the suction force acting on maize kernels within the flow field region around the suction hole. However, the flow patterns in the suction region are complex, and the suction force is the combined effect of the flow field inside the seed metering device acting on the surface of the particles (the integral of force per unit area). Therefore, the difficulty in quantifying the flow field state limits the accuracy of the airflow drag force calculation method.
F D = 1 2 S a ρ g C D v g v a v g v a
C D = 24 R e p , R e p 1 24 R e p 1 + 0.15 R e p 0.687 , 1 < R e p 1000 0.44 , 1000 < R e p 2 × 10 5
where FD is the airflow drag force, N; vg is the fluid velocity, m/s2; va is the particle velocity, m/s2; ρg is the fluid density, kg/m3; Sa is the projected area of the particle, m2; CD is the drag coefficient; Rep is the Reynolds number.
Liang-Shih Fan [18] discussed the forces acting between moving particles and the conveying flow field in gas–solid two-phase flow, including buoyancy (FW), drag force (FD), pressure gradient force (FP), virtual mass force (Fm), Basset force (FB), Saffman lift force (Fsa), and Magnus lift force (FM). Under actual working conditions, the suction flow forms a flow field around the particles. Assuming that the forces acting on the particles during adsorption are similar to those in gas–solid two-phase flow, it is necessary to consider the combined effects of drag force and other forces. Among these, the relative acceleration between the particles and the airflow is small, so the virtual mass force can be neglected. Both the Basset force and buoyancy are of smaller magnitudes and can also be ignored. Additionally, since the particles do not exhibit significant rotation, the Magnus force can be disregarded.
In contrast, when the particle is at a certain distance from the suction hole (Figure 2), air flows through the gap between the particle and the suction hole. As the distance increases, the air velocity in the gap decreases. This differs from the flow field effects in pneumatic conveying, as the airflow in the suction flow does not fully circulate around the particle, and a distinct velocity boundary layer exists in the flow field. Thus, the Saffman lift force has a certain impact on the suction force at the suction hole. Due to the negative pressure at the suction hole, the pressure on the side of the particle facing the suction hole is lower than on the opposite side, resulting in a pressure gradient force that also influences the adsorption of the particle [19].
At the same time, a drag correction coefficient (ξg) should be introduced to correct the distortion in drag force calculation, which is caused by the reduction in the angle of airflow around the particle. To make the adsorption analysis of maize kernels more accurate, a drag coefficient (Cd) for non-spherical particles should be introduced [20]. Based on the above analysis, this study proposes that the suction force acting on maize particles during the suction and adsorption process should be expressed by Equations (4) to (8).
F S C = F D + F P + F s a
F P = V a P
F s a = 1.61 μ ρ g d a 2 v g v a d v g d y
C d = 24 R e p 0.843 l g ψ w 0.065 1 , R e p 1 f R e p , ψ w , 1 < R e p 4000 5.31 ~ 4.884 , 4000 < R e p
F D = 1 2 ξ g S a ρ g C d v g v a v g v a
where FSC is the adsorption force on the particle, N; F’D is the corrected airflow drag force, N; Fp is the pressure gradient force on the particle, N; Fsa is the Saffman lift force, N; Va is the volume of the particle, m3; ▽P is the pressure gradient differential operator; μ is the dynamic viscosity; da is the particle diameter, m; Cd is the drag coefficient for non-spherical particles; ψw is the sphericity of the particle; ξg is the resistance correction coefficient.

2.2. Maize Kernel Classification

To better reflect the performance of maize during seeding, harvesting, and other operations, researchers have grouped maize kernels with similar physical characteristics for study [21,22]. However, the complex and diverse shapes of maize kernels make it difficult to establish precise classification rules. For example, Wang Jinwu and his team [23] classified kernels into large, medium, and small categories based on seed size, while Shi et al. [24] divided seeds into wide-flat, round-flat, and near-round shapes.
The shape of maize kernels significantly affects the performance of seed metering devices [25]. Wadell sphericity is often used to quantitatively describe the shape of particles. As illustrated in Figure 3, maize kernels commonly used in existing studies can be classified based on Wadell sphericity. It was found that kernels with similar edge and ridge characteristics also exhibit close distributions in sphericity.
  • Dent-like kernels: Wadell sphericity ranges from 0.78 to 0.82. These kernels feature two relatively flat lateral surfaces and prominent edges.
  • Conical-like kernels: Sphericity ranges from 0.86 to 0.92. They possess smooth top surfaces and lateral faces with similar curvature and area.
  • Spherical-like kernels: Sphericity ranges from 0.95 to 0.99. Except for the tip, their overall shape exhibits high symmetry across multiple surfaces.
Kernels lacking distinct morphological features are collectively referred to as transitional types, while irregularly shaped ones are categorized as irregular types.
Wadell sphericity Φw:
Φ w = S E B S A
where SEB is the surface area of a sphere of the same volume as the particle, mm2; SA is the surface area of particles, mm2.
Thus, maize kernels can be classified according to their sphericity into the following categories: dent-like, conical-like, spherical-like, transitional, and irregular. A total of 200 randomly selected maize seeds (Tianyu 168) were classified by shape, and their characteristic dimensions were measured. The results showed that dent-like kernels accounted for 28.5%, conical-like for 25.5%, spherical-like for 13.5%, transitional for 18%, and irregular for 14.5%. Given the biological variability of maize seeds and the challenges in strictly defining their external morphology, representative kernel samples were selected (as shown in Table 1) for theoretical analysis and experimental testing. These samples were chosen to represent typical morphologies corresponding to the endpoints and central values of the overall sphericity distribution. Additionally, spherical and tetragonal prism particles were chosen as control groups, and the experimental results were used to compare theoretical predictions with actual measurements.
Statistical analysis of maize kernel dimensions revealed an average kernel width of 7.6 mm. Referring to the design principles for seed disc suction hole diameters described in the Agricultural Machinery Design Handbook [26] (Equation (10)), we selected a suction hole with a diameter of 5 mm. To meet the experimental requirements, the types of seed discs used are shown in Table 2. The suction holes in discs P-R, P-T(a), P-S(a), and P-N have the same area, while the inscribed circle diameters of the P-T(b) and P-S(b) holes are the same as the P-R hole, measuring 5 mm.
d k = ( 0.64 ~ 0.66 ) w e
where dk is the diameter of the seed disc suction hole, mm; we is the average width of the seed, mm.

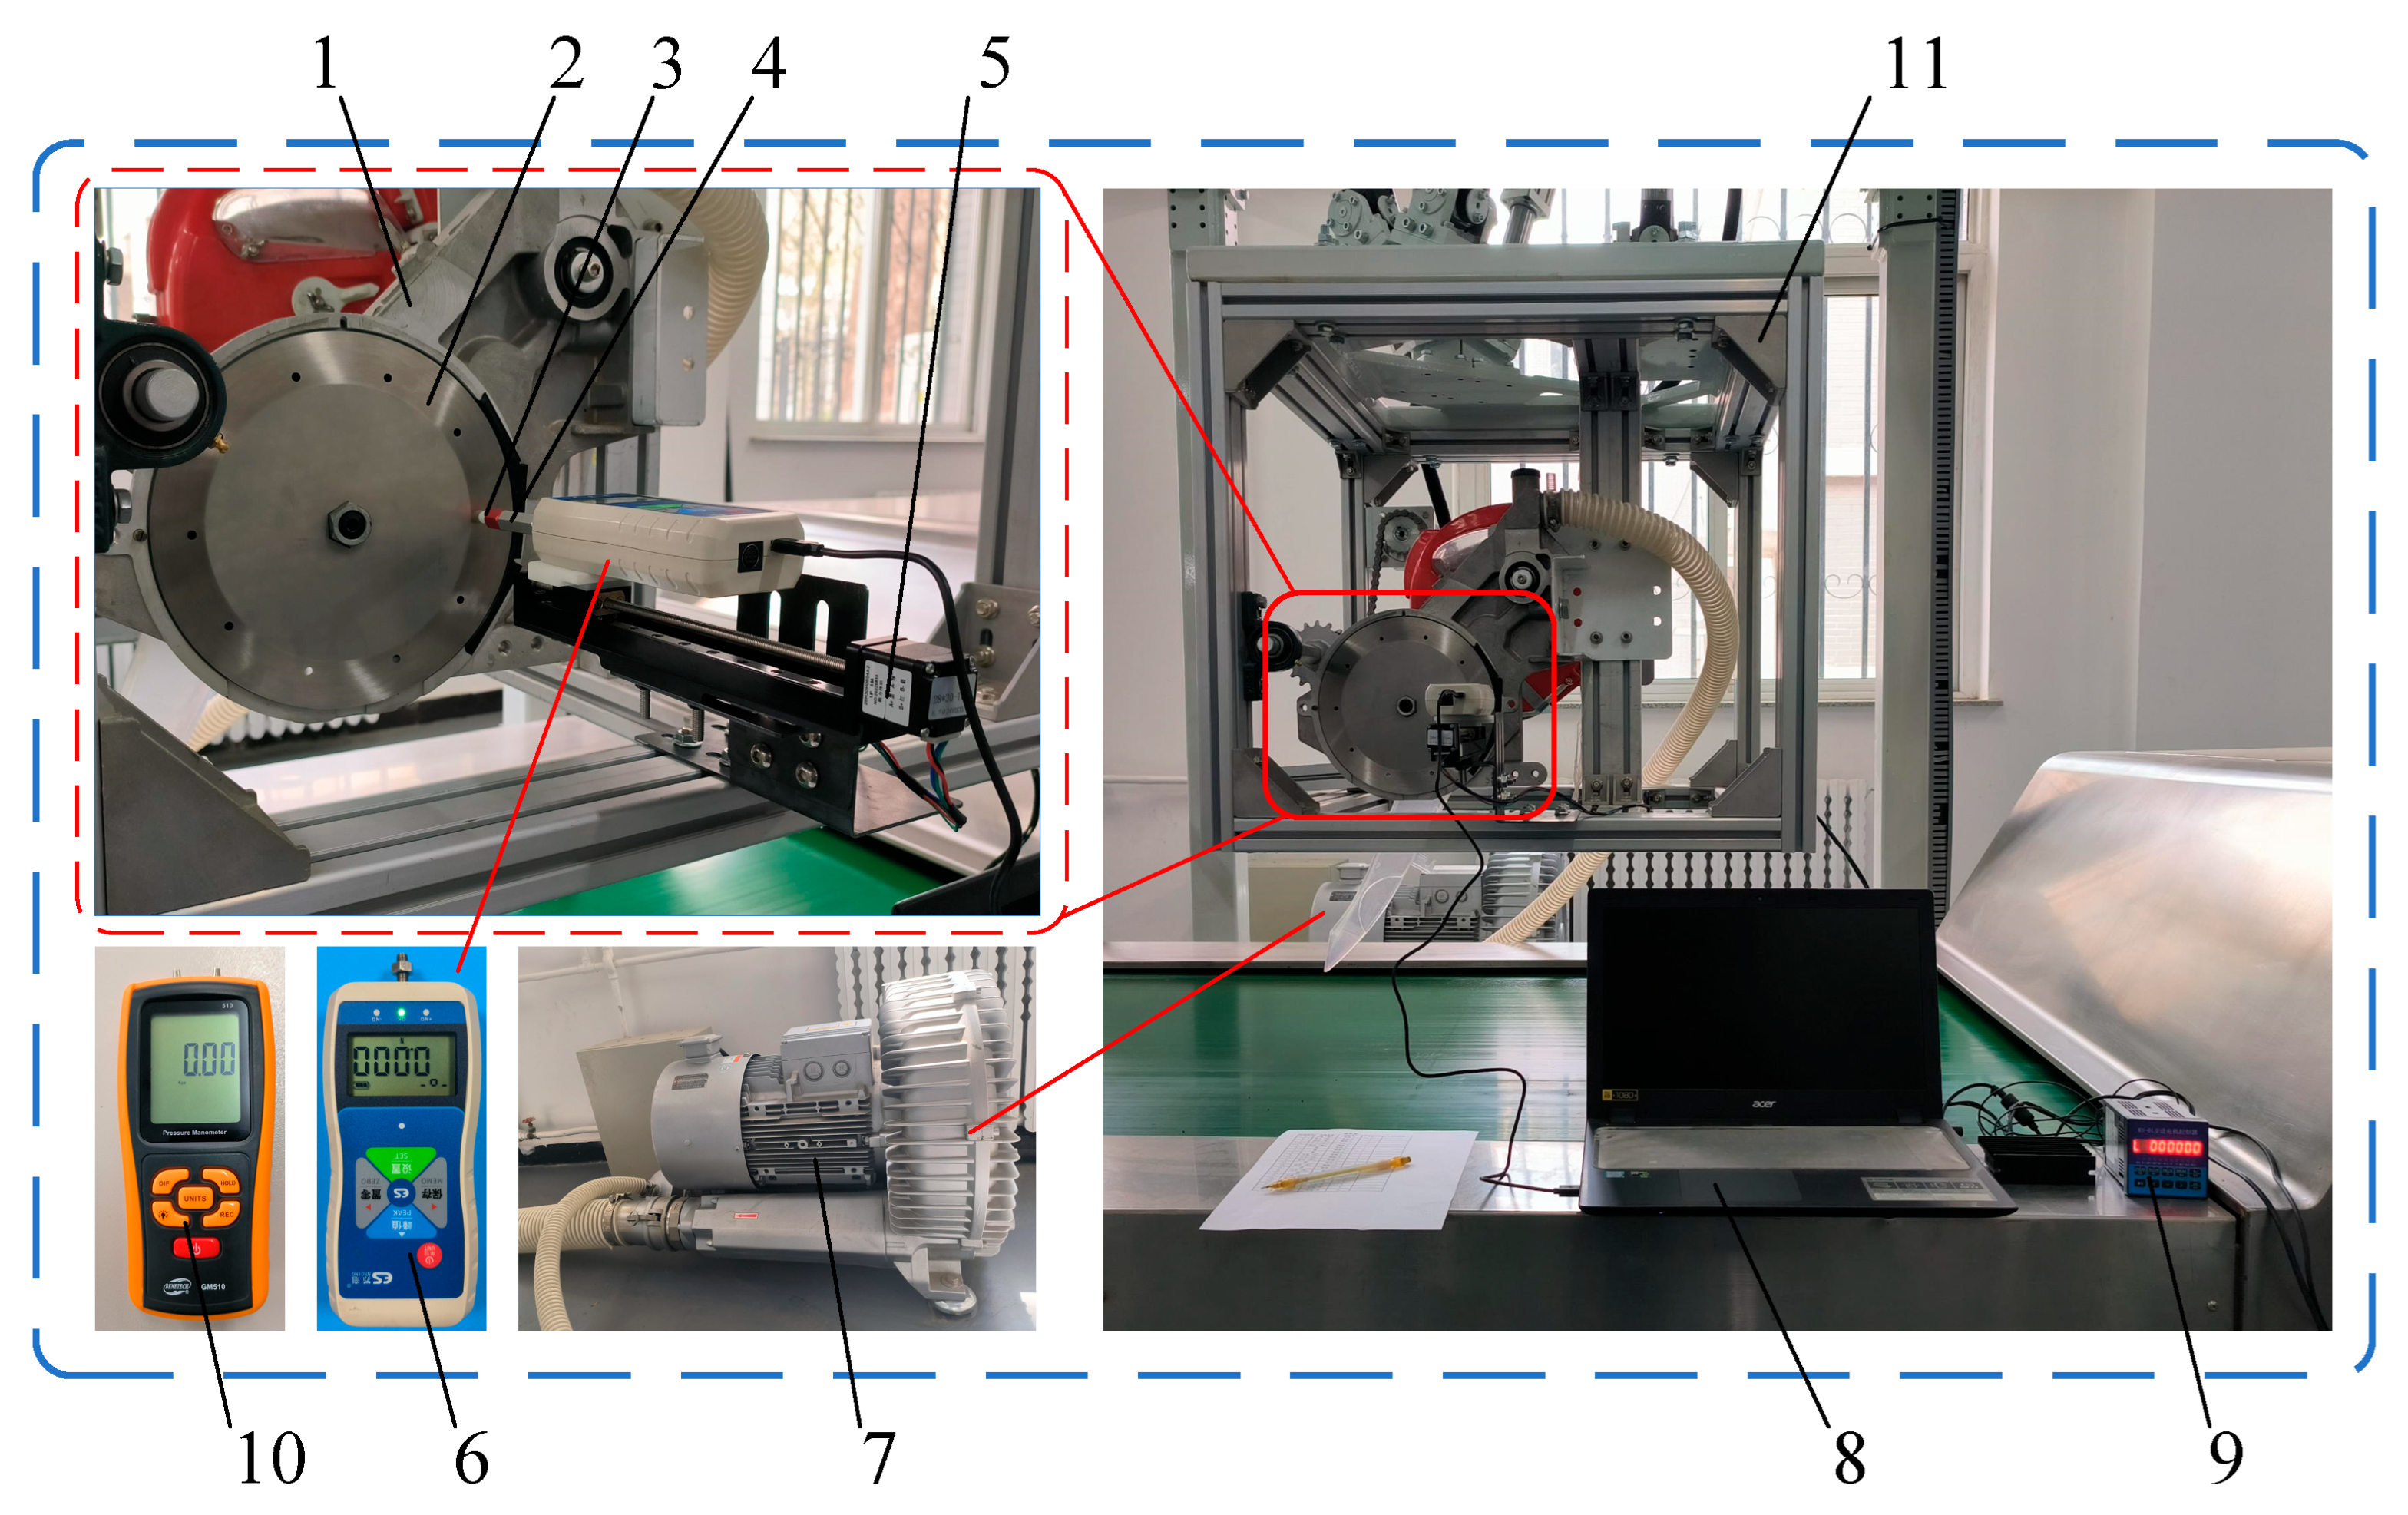
2.3. Experimental Setup

Based on theoretical analysis and actual seeding conditions, this study designed a suction force measurement test bench, used to measure the suction force acting on kernels along the direction of the suction hole [27]. Figure 4 shows the structure of the test bench, which includes a vacuum precision seed metering device, replaceable seed discs, an electric screw rod, a push–pull dynamometer, an electric screw rod controller, a laptop, and a vacuum fan.
The experiment was conducted at the National Key Laboratory of Agricultural Equipment Technology (Beijing, China), with no external airflow or vibration affecting the test (room temperature 23 °C, relative humidity 49%). Prior to the experiment, the pressure gauge and push–pull dynamometer were calibrated. The open design of the test bench allowed for free replacement of seed discs to be tested. The vacuum fan speed was controlled steplessly to adjust the vacuum degree of the seed metering device. One end of the particle connection rod was bonded to the test kernels, while the other was connected to a push–pull dynamometer. The push–pull dynamometer was mounted on the electric screw rod, which was perpendicular to the plane of the seed disc to ensure that the test kernel faced directly above the suction hole. During the experiment, the test kernels were gradually moved away from the suction hole at a uniform speed using the electric screw rod, and the suction force (i.e., the force perpendicular to the seed disc) was recorded by the force collection system on the laptop. Multiple groups of bonded kernels and connection rods were prepared for easy replacement of test objects.

3. Experimental Design

The suction force test bench was used to study the effect of different suction hole shapes on the suction characteristics of regular particles and maize kernels. During the experiment, the vacuum fan was first activated and adjusted to achieve the required vacuum level, as determined by the pressure gauge. Then, the electric screw rod was adjusted to place the test kernels onto the suction hole. The electric screw rod was set to move the kernels away from the suction hole at a uniform speed of 0.3 mm/s. Finally, the suction force collection system recorded the change in force sensor values during the detachment process at a sampling frequency of 10 Hz. The relationship between adsorption force and particle displacement was established and analyzed. Each experiment was repeated three times, and only the curves without outliers and closest to the average value were selected for comparison.

3.1. Standard Particle Experiment Plan

To compare the difference between actual suction test results and theoretical estimation models, particles SQ and SS were selected as test subjects and set into three experimental groups, as shown in Table 3.

3.1.1. Study of the Effect of Suction Hole Shape

In Experiment 1, the suction holes of the tested seed discs had the same area, and the trapezoidal surface of SQ particles completely covered all types of suction holes. This allowed us to measure the maximum suction force and suction force decay curve of SQ under different suction hole shapes. The measured maximum suction force was then compared with the theoretical maximum pressure value calculated using the traditional pressure calculation method (Equation (1)), verifying the model’s reliability when the suction hole was fully covered.

3.1.2. Study of the Effect of Equivalent Suction Area

In Experiment 2, the suction holes of the tested seed discs had the same inscribed circle. A standard spherical particle with a diameter of 8 mm (SS-8) was used as the test object, and the tested suction holes had the same contact area when paired with SS-8. The same cross-section ensured that different hole shapes had the same blocking effect during suction. By comparing the measured suction force with the airflow drag force calculated using the airflow drag resistance method (Equation (2)), the accuracy of using equivalent windward area to calculate drag forces for particle suction was validated.

3.1.3. Study of the Effect of Particle Diameter

In Experiment 3, P-R and P-N seed discs were used, and SS particles with diameters of 6 mm, 8 mm, and 10 mm were tested (designated SS-6, SS-8, and SS-10, respectively). The experiment aimed to verify the effect of particle curvature on suction hole suction performance.

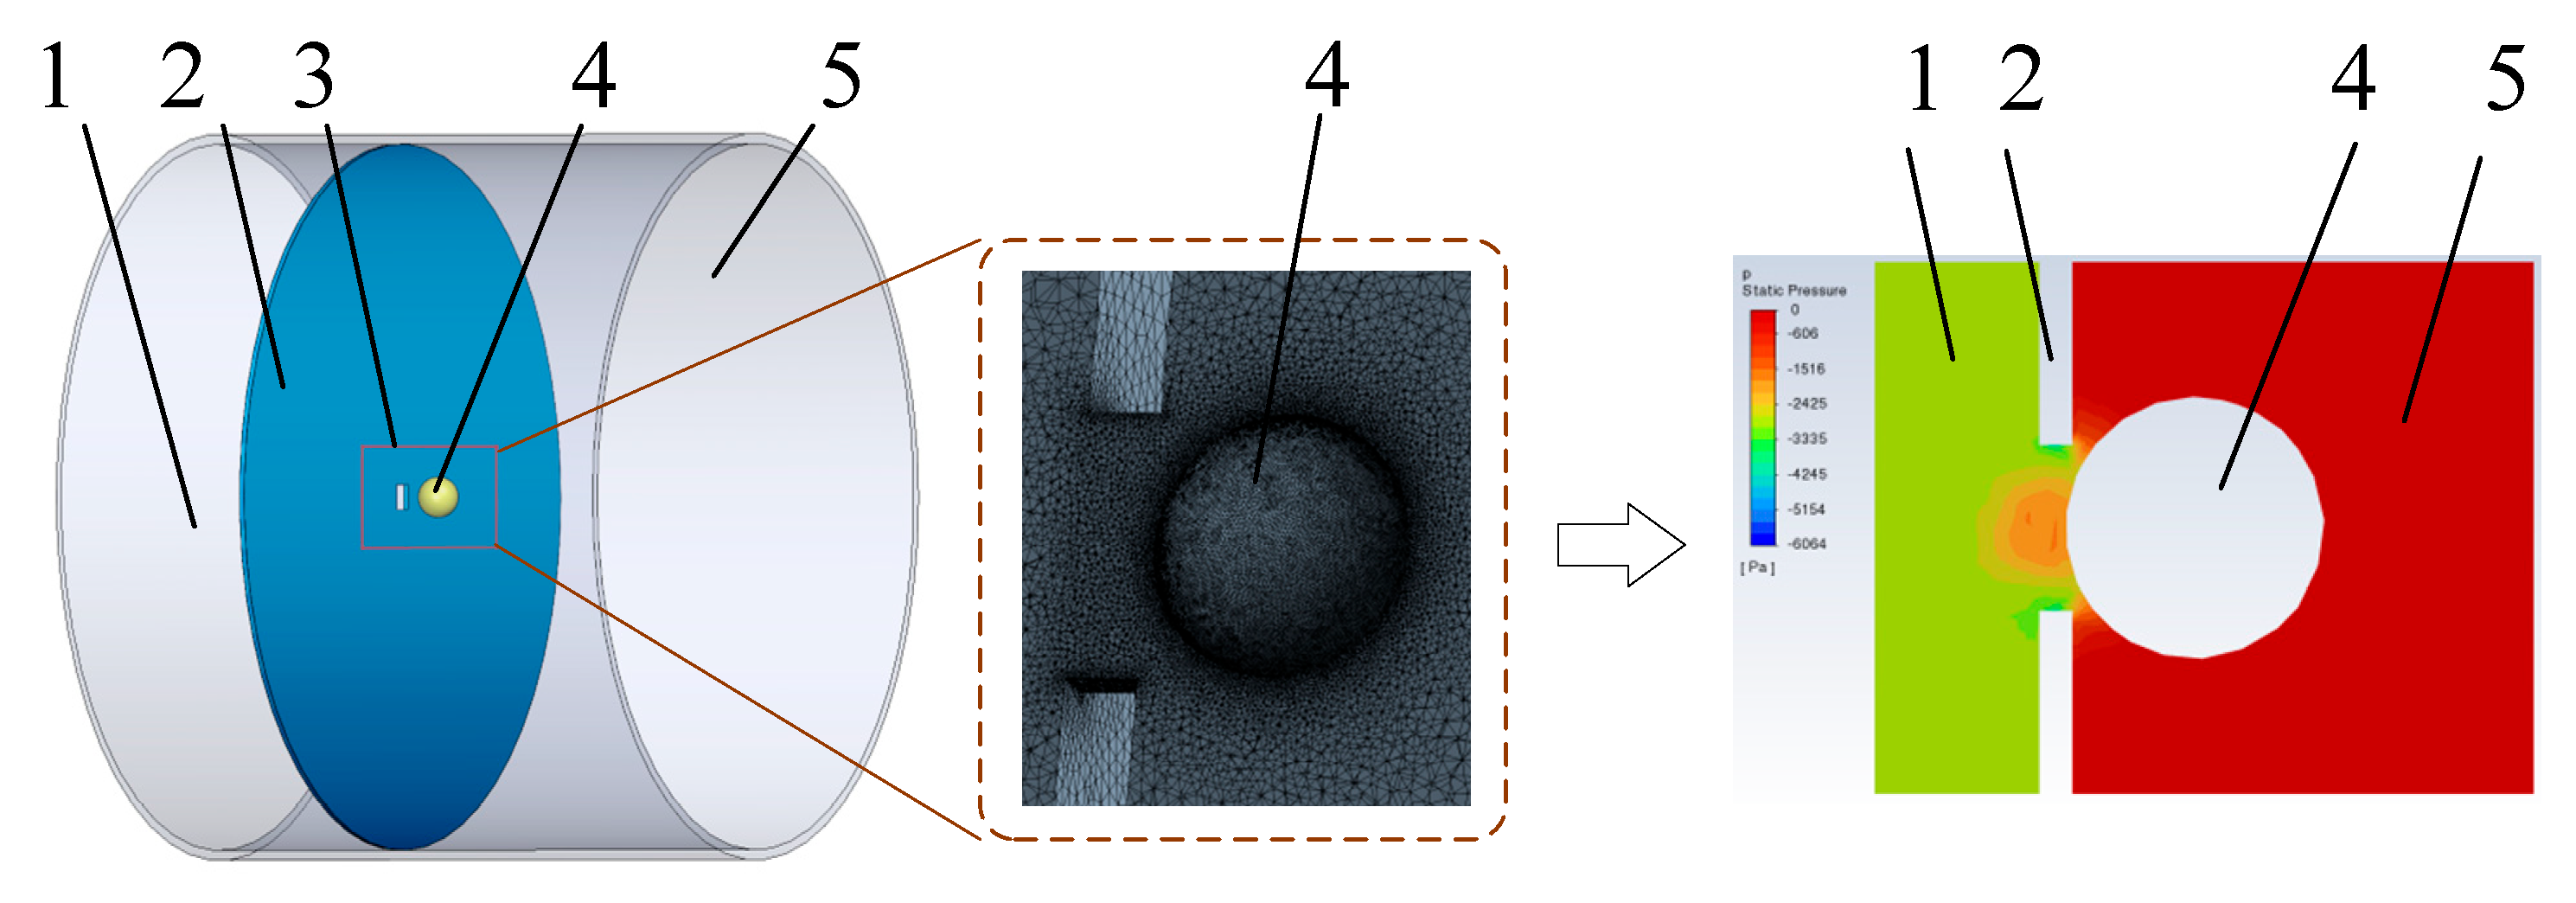
3.2. CFD Simulation Experiment Design

Computational fluid dynamics (CFD) simulations were used to obtain detailed changes in the flow field during the suction process of particles. The aim was to further analyze the interaction between particles and airflow during the initial detachment phase, providing data support for the theoretical calculations of the standard particle test group [28]. A simulation model was developed (Figure 5) in which the adsorbed particle was treated as a rigid and immobile body. The separation distance between the particle and suction hole was set to 0.1 mm to ensure mesh quality. The model adopted a tetrahedral mesh, with an overall size of 1 mm, and a refined mesh of 0.02 mm was applied at the suction hole and particle surface. To avoid errors caused by mesh density, a mesh independence test was conducted using an overall mesh of 0.01 mm, 0.05 mm, and the current mesh. The results showed that the maximum deviation between the current mesh and the 0.01 mm mesh was 0.51%, while the maximum deviation between the 0.01 mm and 0.05 mm meshes was 0.75%, indicating that the current mesh was reasonable. The simulation setup (Table 4) was based on the experimental plan in Section 2.1. Key simulation parameters are listed in Table 5.

3.3. Maize Kernel Suction Force Measurement Plan

The shape of the seed disc suction hole has a significant impact on the suction posture of maize kernels [12,29]. Tang et al. [11] designed suction holes proportional to seed characteristic shapes and found that the seeding qualification index was significantly related to seed posture after testing. To analyze the suction performance of different kernel shapes in different suction hole shapes, maize kernels were tested with suction holes P-R, P-T(a), P-S(a), and P-N.
Based on a geometric analysis, a spatial coordinate system is established using the characteristic dimensional orientations of the corn kernel. Each kernel type can be regarded as possessing six orthographic views. Symmetrical surfaces of kernels aligned with the coordinate axes, as well as morphologically similar surfaces across different kernel types, exhibit comparable contour characteristics. Taking a corn kernel CT model as an example, the adsorption posture for study is selected (as shown in Figure 6) by considering the similarity of symmetrical surfaces (the same principle applies to other kernel types). During contact with the suction hole, it is ensured that the coordinate axes are aligned with the axial direction of the suction hole. During the measurement of kernel characteristic dimensions, it was found that the horizontal suction posture (HA) of CC and CB was approximately equivalent to their own lateral suction posture (LA). Therefore, the suction postures of maize kernels used in the full-factorial suction characteristic experiment are listed in Table 6.

4. Results

4.1. Impact of Suction Hole Shape on Adsorption Performance

From Experiment 1, we can observe the differences in how different suction hole shapes function during the complete adsorption process. The force exerted on SQ during its detachment from the suction zone under three different vacuum conditions was recorded, with the resulting force curves shown in Figure 7.
When the vacuum level was set to 3 kPa, the maximum adsorption force of SQ under the influence of the four suction hole shapes ranged between 0.0795 N and 0.0855 N (with a standard deviation of only 0.002), indicating that the values were very close. The adsorption force acting distance ranged between 2.07 mm and 2.25 mm (with a standard deviation of 0.075), also showing a high degree of similarity. At 6 kPa, the maximum adsorption force provided by the four hole shapes ranged between 0.1702 N and 0.1825 N (with a standard deviation of 0.004), with slight differences. The adsorption force acting distance was between 2.61 mm and 3.15 mm (with a standard deviation of 0.195). At 9 kPa, the maximum adsorption force varied between 0.2517 N and 0.2614 N (with a standard deviation of 0.004), showing greater variation. The adsorption force acting distance also differed, ranging from 3.24 mm to 3.87 mm (with a standard deviation of 0.259).
From the above measurements, at 3 kPa, the difference in adsorption effectiveness among various suction hole shapes was minimal. As the vacuum level increased, the difference in adsorption capacity among the hole shapes also increased. However, under all three conditions, the four hole types exhibited similar adsorption performance. Additionally, the trend of adsorption force at low vacuum levels was quite similar to that at high vacuum levels. The change in slope of the force curves indicated that as the distance between the seed and the suction hole increased, the rate of decrease in adsorption force gradually slowed down.
For the experiment, the suction holes were fully covered by the particles. The cross-sectional area of each suction hole was 19.63 mm2, which was used as Sa in the pressure calculation model (Equation (1)). The result showed that at a vacuum level of Pn = 6 kPa, the suction force FS was 0.1177 N. The actual measured adsorption force exceeded the standard pressure value calculated by Equation (1), suggesting that the force acting on the particle during detachment was not solely due to pressure, and that the complex airflow around the particle also played a role.
Using CFD simulation, we analyzed the flow field characteristics when the SQ particle was 0.1 mm away from the suction hole at a vacuum level of 6 kPa. Figure 8 shows the data contour of the observation plane. In the initial adsorption stage, the SQ particle completely covered the suction hole. As the particle moved away, a low-pressure zone perpendicular to the movement direction formed between the surface of SQ and the seed disc. Due to the blocking effect of the particle, the pressure difference inside and outside the suction hole remained high. A small amount of airflow entered the suction hole through the gap, causing a high flow speed near the edge of the hole. The influx of airflow led to a gradual extension of the low-pressure region, as shown in Figure 8a. The velocity and pressure distribution of the airflow near the suction hole was not uniform, and the area affected by the airflow could not be precisely integrated. Therefore, we estimated FD using the stretched surface area of a prism as Sa and the maximum bypass flow velocity as vg, yielding an estimated maximum value for FD. By exporting the airflow velocity and particle surface pressure data near the particle, we obtained a fluid velocity vg of 97 m/s. The cross-sectional area of SQ was used as Sa, and substituting into Equation (2), we calculated FD to be 0.1395 N. Although this was an overestimation, the result was still lower than the actual measured adsorption force. This FD estimation was close to the actual measured adsorption force at this distance, and thus further analysis of its reliability is needed.

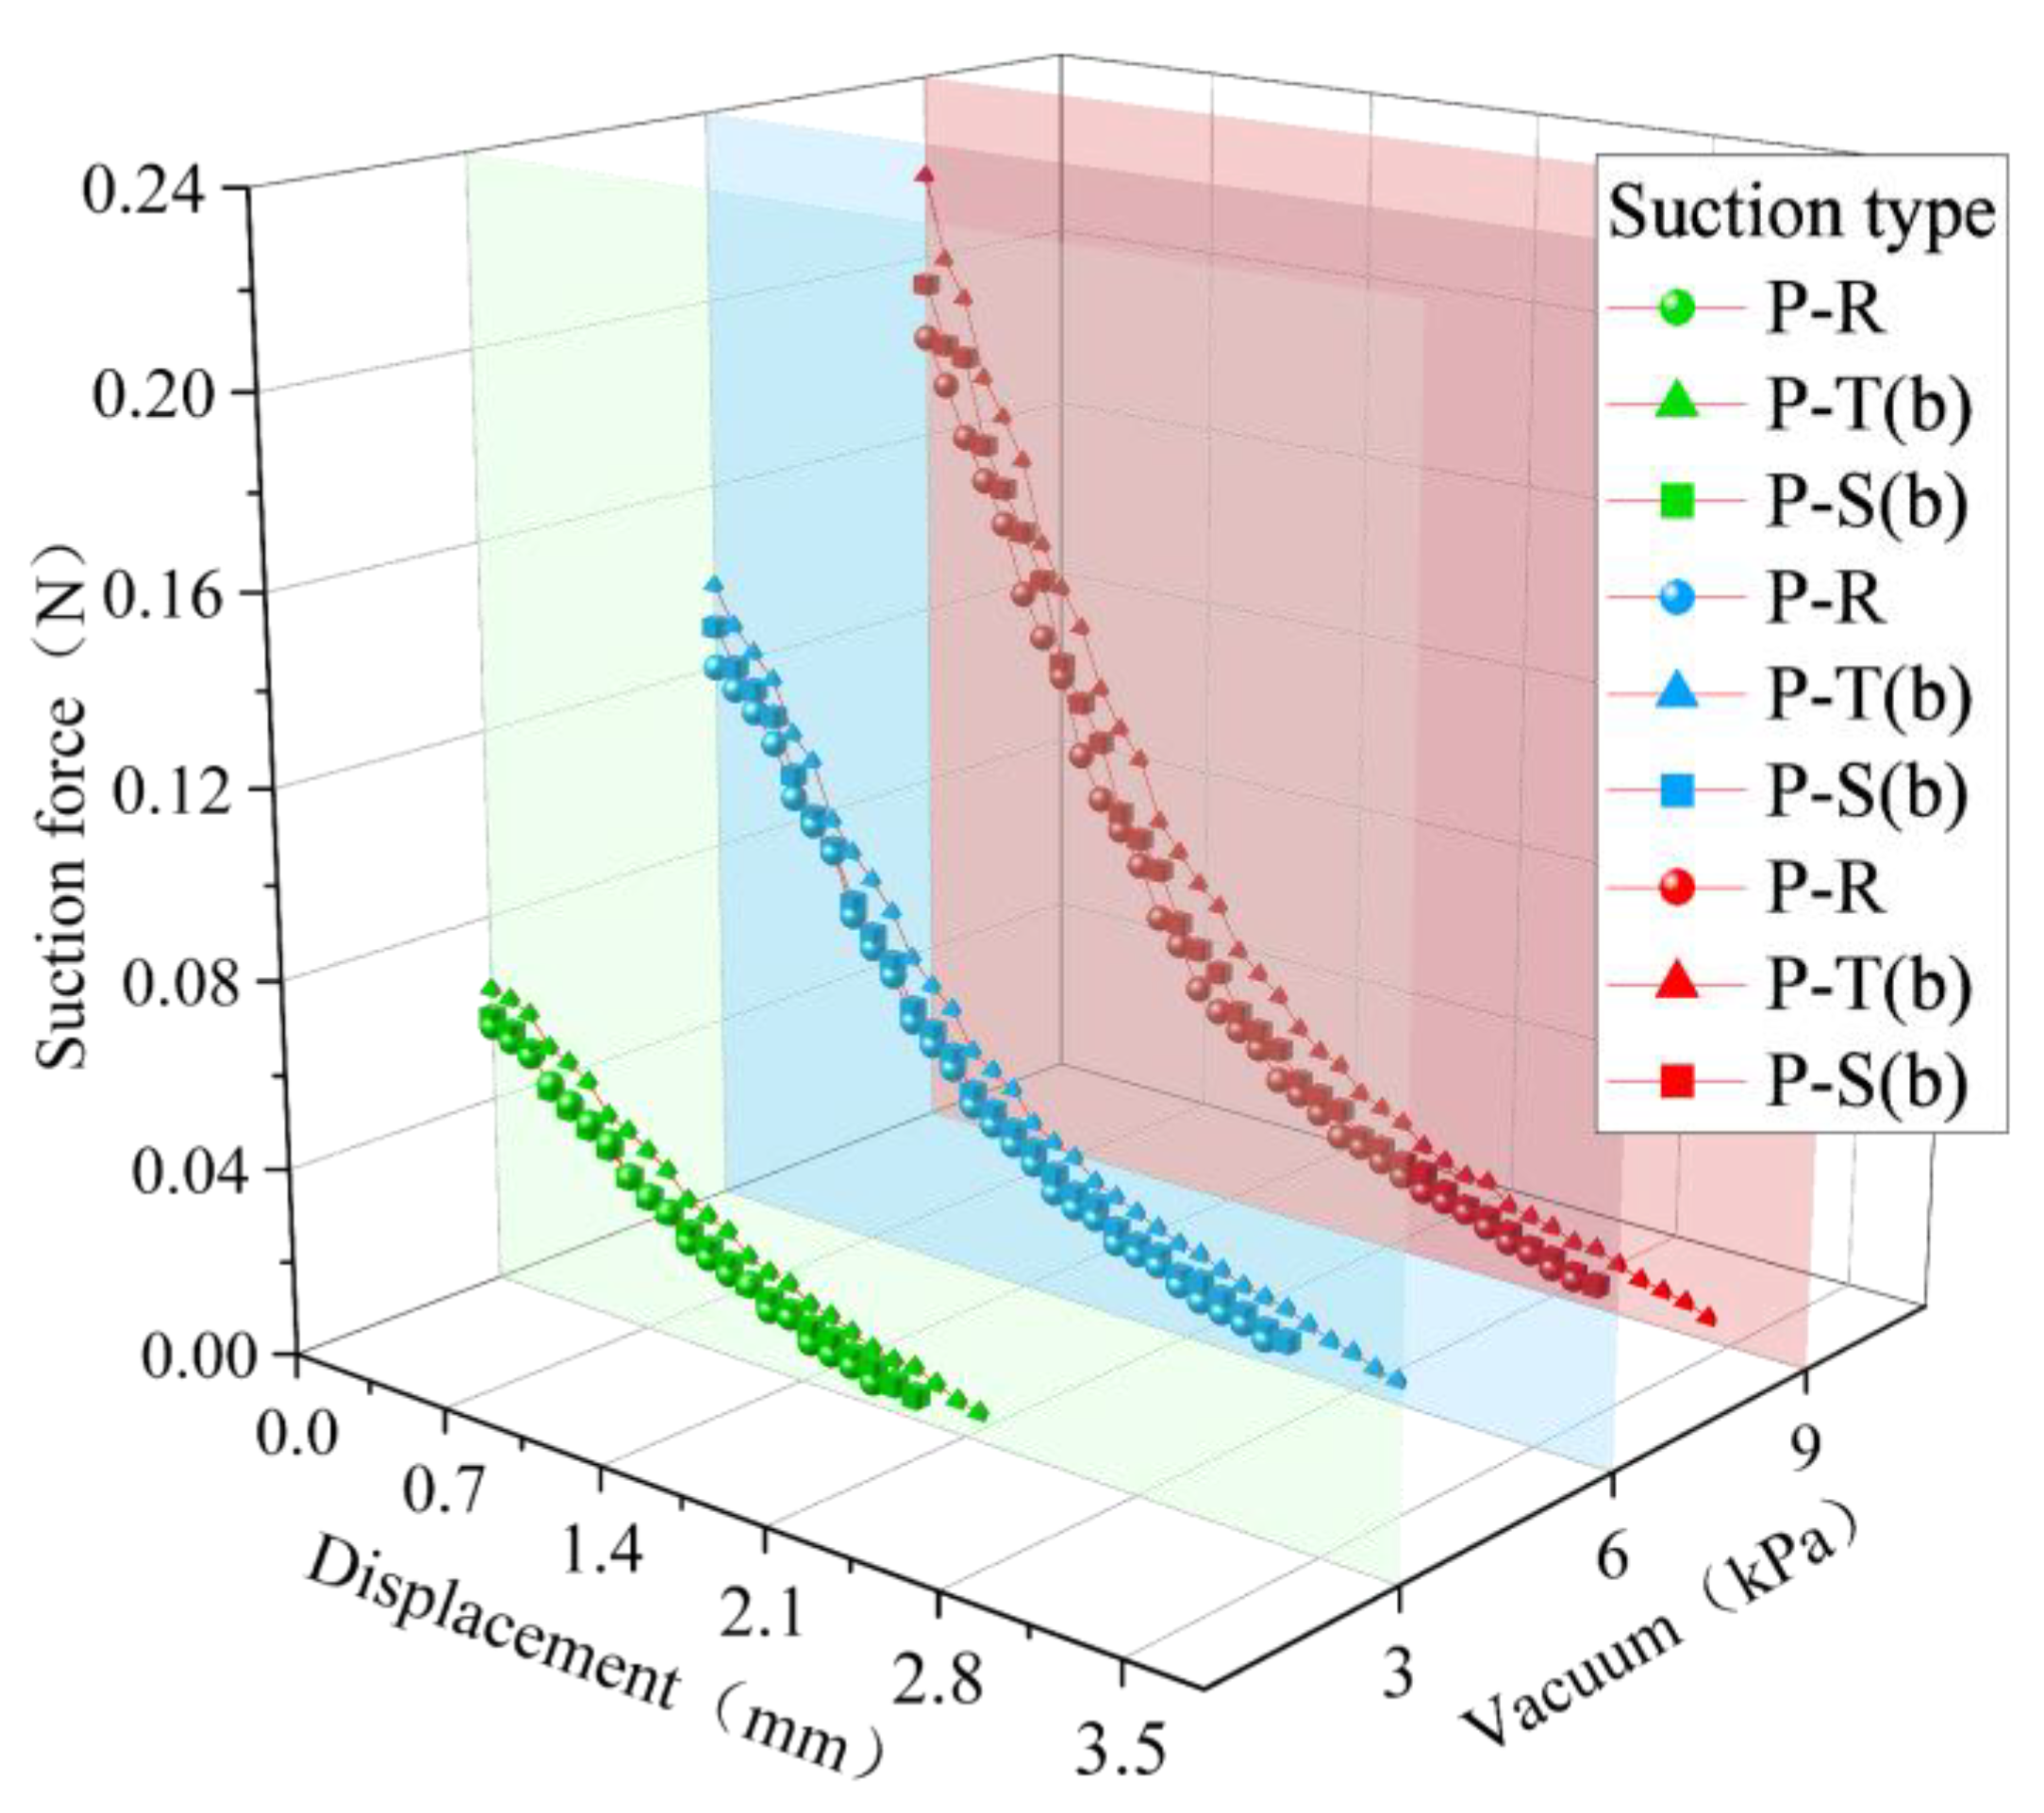
4.2. Impact of Effective Adsorption Area on Adsorption Performance

Experiment 2 aimed to explore the effect of effective adsorption area on material adsorption. The SS-8 particle was subjected to adsorption tests with P-R, P-T(b), and P-S(b) suction holes under three vacuum conditions.
Figure 9 shows that, in all three vacuum conditions, the maximum adsorption force and acting distance for SS-8, ranked from largest to smallest, were as follows: P-T(b), P-S(b), and P-R. This order also matches the suction hole area ranking. Both P-T(b) and P-S(b) had uncovered areas, although the size of these areas differed. The adsorption curves for SS-8 under the two types of suction holes were relatively close. By comparison, airflow flowed along the suction face of SQ (Figure 8), perpendicular to the direction of the suction hole. For SS particles, however, the suction face was hemispherical, and the directions of FP and Fsa on its surface were along the normal of each unit area and evenly distributed in a divergent manner. Due to the symmetry of the particle and the flow field, the integrated force ultimately aligned with the direction of the suction hole. The uncovered area of the P-T(b) hole was 12.84 mm2, 139% larger than that of P-S(b), yet the maximum adsorption force difference between the two was less than 0.036 N under all vacuum conditions. Therefore, after the bypass flow field was established, the increase in airflow in the surrounding area had a limited effect on enhancing the adsorption effect of particles at the same location. In summary, the bypass airflow significantly contributed to particle adsorption, and the particle shielding the same suction hole area can make it subject to similar adsorption force.
For P-R, P-T(b), and P-S(b) suction holes, the inscribed circles were the same, meaning SS-8 had the same overlap line (or equal tx) when adsorbed. Using the pressure estimation method, the suction hole area is regarded as Sa and substituted into Equation (1) to obtain the FS when vacuum degree Pn = 6 kPa, as shown in Table 7. The relative error between the suction force estimated by the traditional pressure-based method for triangular holes and the actual measured force reached 40.82%. Obviously, the difference in the area of the suction holes causes a large difference in the estimated values between the suction holes and cannot represent the actual measurement results with similar performance. Simulating the flow field characteristics when SS-8 was 0.1 mm away from the suction hole, the data contour of the observation plane is shown in Figure 10. The airflow flow rate and velocity for P-R were significantly lower than for the other two groups due to the blocking effect of the particle, resulting in a faster pressure drop inside the suction hole. For P-T(b), which had a larger unblocked area, the airflow velocity was higher near the sharp edges of the suction hole, lowering the vacuum degree in front of the particle. The maximum estimated FD values for the particles were 0.1002 N for P-R, 0.1223 N for P-T(b), and 0.1073 N for P-S(b). The relative error between the estimated resistance value of the square suction hole obtained by the calculation method of airflow traction resistance and the actual adsorption force under the same conditions is as high as 17.14%. The differing blocking effects caused variations in airflow speed, showing a large gap between the estimated FD and the actual measured adsorption force.
t x = d a 2 h m

4.3. Effect of Particle Diameter on Adsorption Efficiency

The objective of Experiment 3 was to study the impact of particle diameter on the stability of material adsorption. A comparative analysis was conducted on the adsorption differences between P-R and P-N suction holes for SS particles with varying diameters under a vacuum pressure of 6 kPa.
As shown in Figure 11, during the initial detachment phase from the suction hole, P-R suction holes exhibited similar adsorption behavior for SS particles of different diameters. However, when the particles moved within the adsorption force acting distance of 0.3–1.2 mm, the rate of adsorption force decay varied among the particles. The order of the decay rate from highest to lowest was as follows: SS-10 particles, SS-8 particles, and SS-6 particles. The reason for this is that the smaller the particle diameter, the closer its center of mass is to the intersection plane of the suction hole (i.e., the larger the tx value). SS-10 had the smallest curvature, causing the flow-around airflow encapsulation effect to decay more rapidly (as shown in Figure 12). Therefore, the decay rate of adsorption force was positively correlated with the decay rate of airflow velocity. Under a vacuum pressure of 6 kPa, the effect of particle diameter on the adsorption force generated by P-R suction holes was minimal. The velocity cloud chart displayed the distribution range of the velocity.
The width of the P-N suction hole was only 2 mm, effectively preventing overlap between the SS particles of all three diameters and the suction hole. Since the length of the suction hole was greater than the particle diameter, a flow field formed around the sides of the particles during adsorption. Larger particles covered more of the suction hole’s long edge, thereby generating a larger adsorption force. As a result, the values of the adsorption force and the acting distance of the adsorption force were positively correlated with the particle diameter. Under a vacuum pressure of 6 kPa, the maximum adsorption force and the acting distance of the adsorption force for the tested particles in the P-N suction hole followed the order: SS-10, SS-8, SS-6. Therefore, the P-N suction hole demonstrated better discriminative capability for different particle sizes.
Under a fixed vacuum pressure, the P-R suction hole was fully covered by the SS particles. In the pressure calculation model, all three particles should theoretically generate the same adsorption force. However, compared to the actual measured adsorption force values, it was evident that this calculation model failed to reflect their differences (under complete blocking conditions, the estimated pressure value was approximately equal to the actual measured adsorption force). As shown in Figure 1, the surface curvature of the particles directly influenced the tx value, and when tx was larger, the particles occupied a larger space inside the suction hole, resulting in a wider coverage angle θk. From the velocity field cloud diagrams obtained from Simulation Experiment 3 (Figure 12 and Figure 13), it was observed that the airflow velocity for SS-6 particles at 0.1 mm was relatively low, and the pressure difference between the front and back of the particles remained high. The local airflow around the particle at the entrance could be regarded as a wall jet, and its curvature and width significantly influenced the flow-around encapsulation angle of the airflow [30]. Therefore, the curvature of the SS adsorption surface affected the distribution and magnitude of FP and Fsa acting on the surface. Using the same calculation method as before, the simulation data for the three particles at 0.1 mm were substituted into Equations (1) and (2), and the calculation results are shown in Table 8. It was clear that the pressure calculation method and the airflow drag calculation method could not accurately predict the adsorption effect for particles of different curvatures.

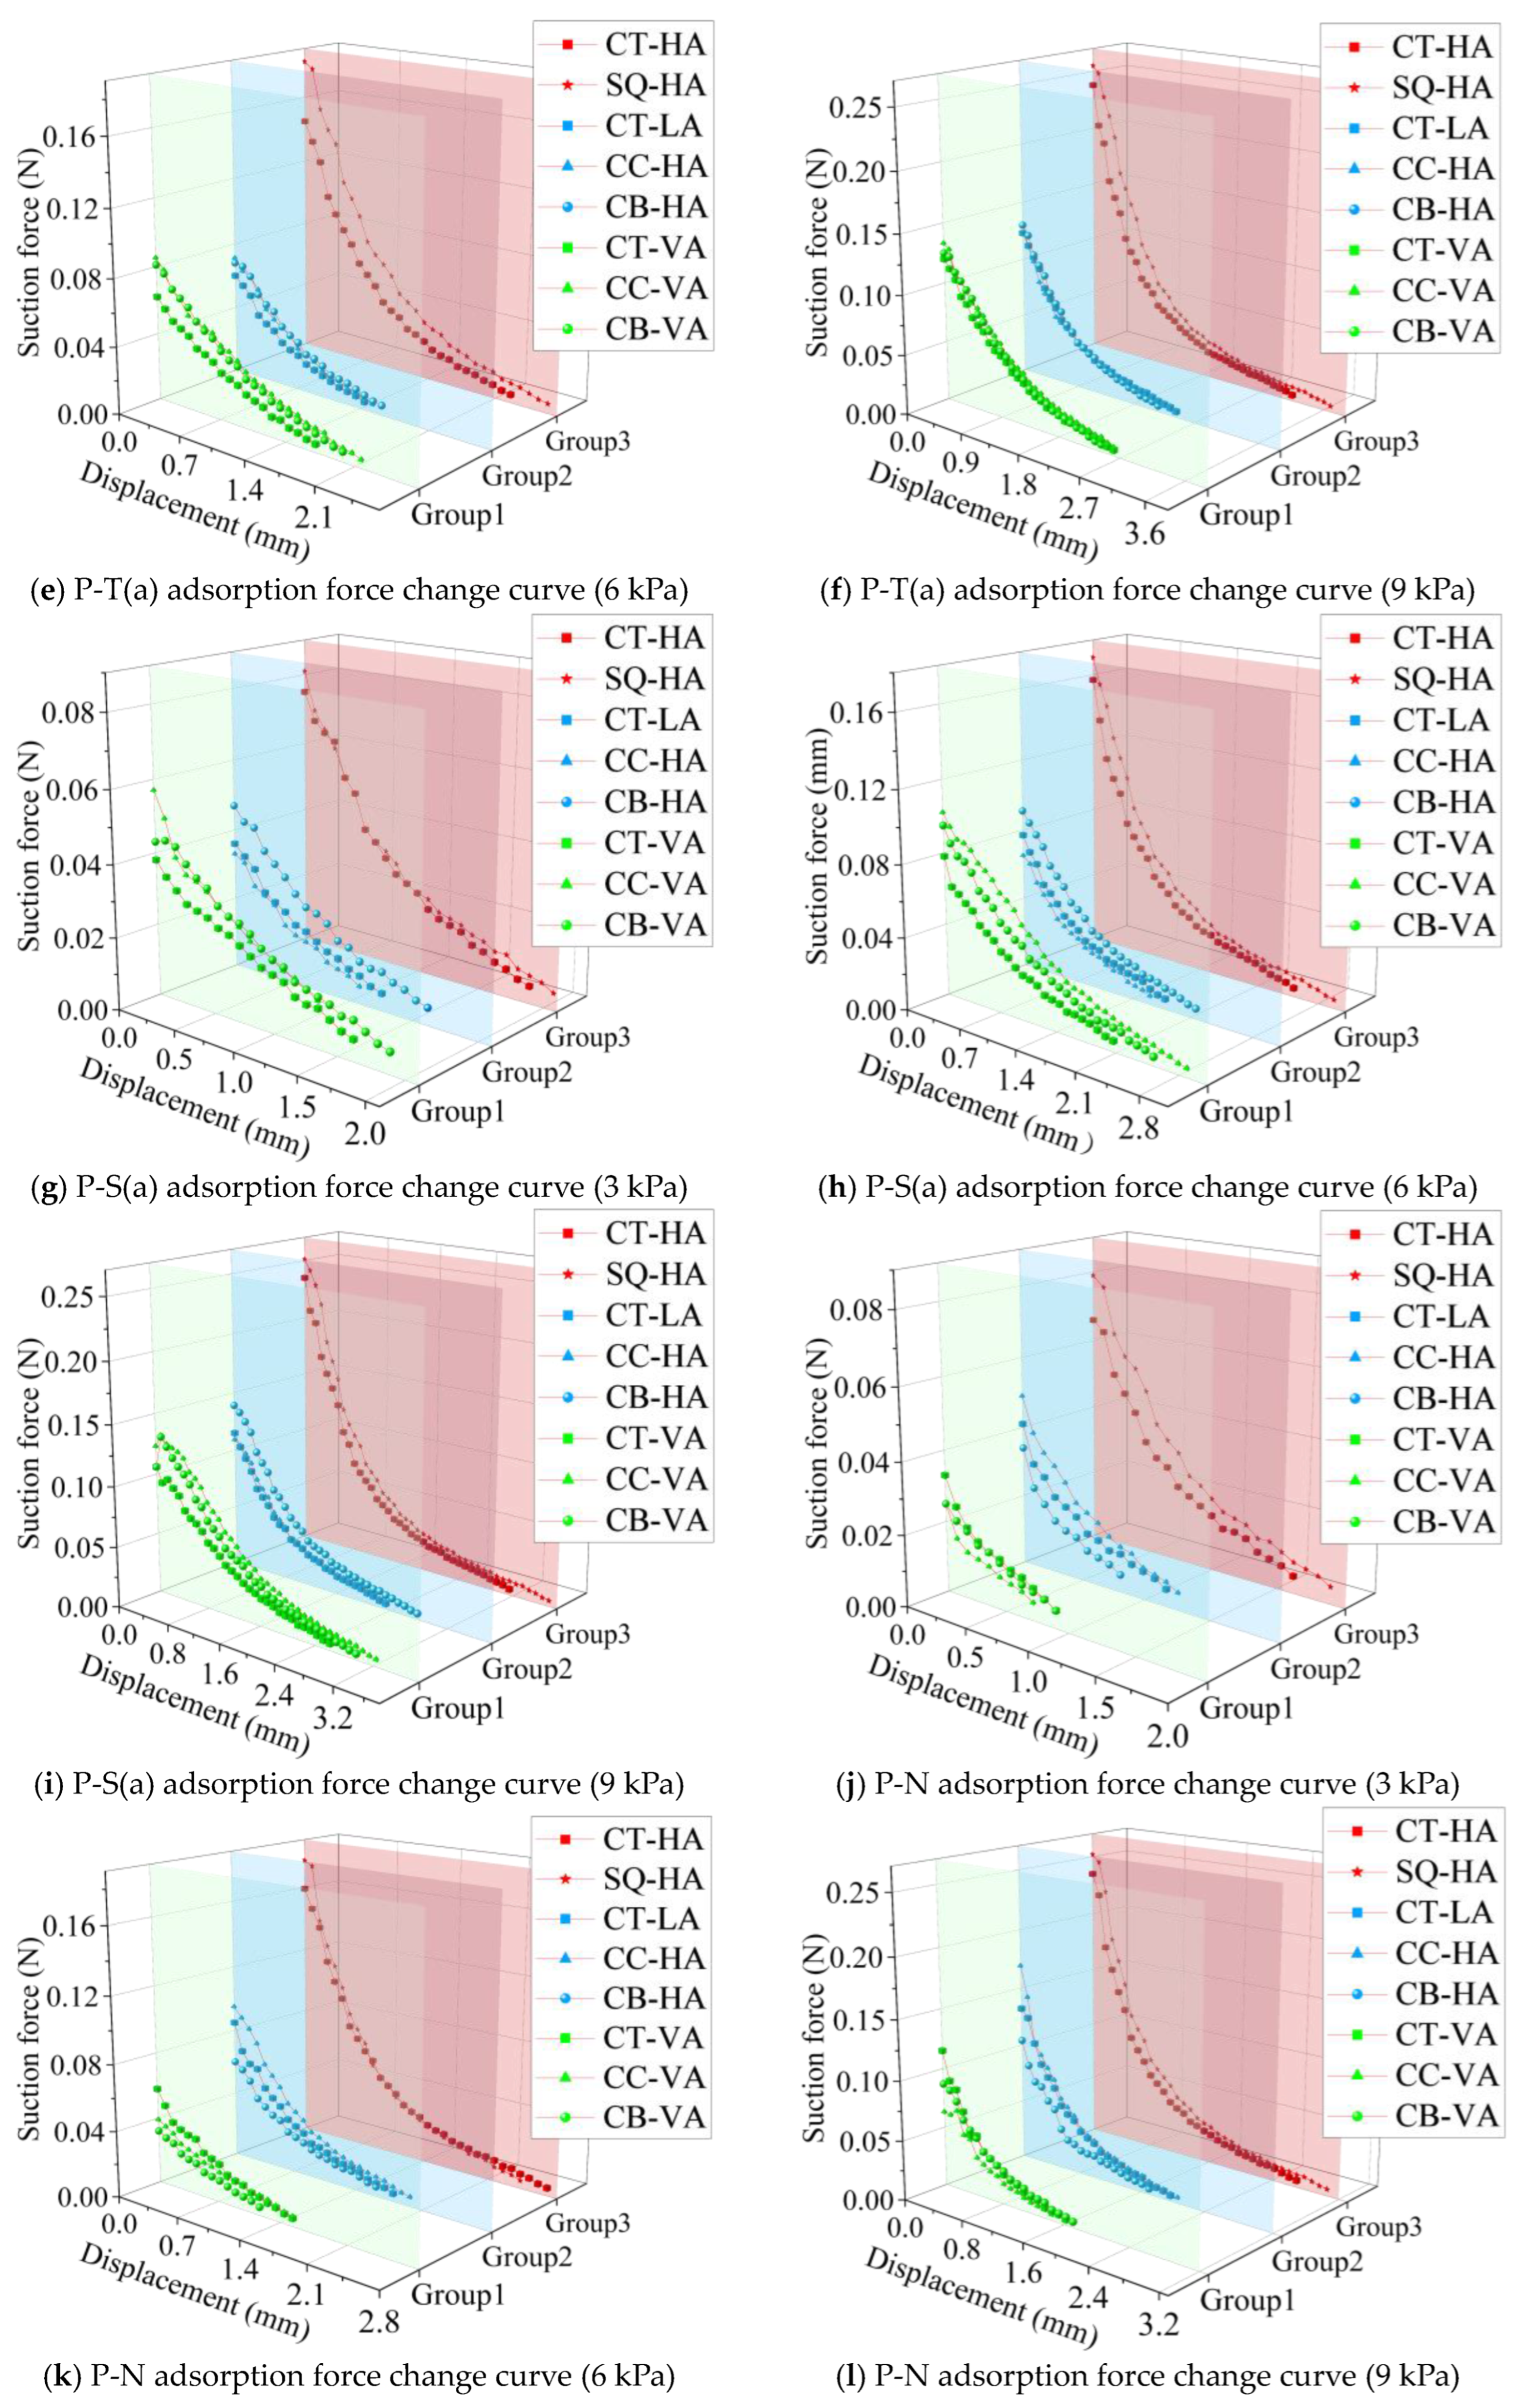
4.4. Maize Seed Adsorption Test Results

Traditional computational models commonly used for estimating maize seed adsorption are often inaccurate. Therefore, an adsorption test was designed to study the actual adsorption performance of maize seeds with different shapes. A full factorial experiment was conducted with suction hole shape, seed shape, and vacuum pressure as the test factors. The adsorption data of maize seeds classified in Table 1 were statistically compared. For easier observation, the force curves of the maize seeds under the same experimental conditions were grouped based on similar adsorption postures (Table 9). Figure 14a–l shows the adsorption force variation curves for different maize seed adsorption postures. By comparing the different figures, the differences in adsorption force and the acting distance of the adsorption force for maize seeds under different suction holes could be observed.
In all suction hole tests, the adsorption performance of CT-HA was very similar to that of SQ-HA under the same vacuum pressure. Combining the conclusions from Standard Particle Test Group 1, CT-HA had a large and relatively flat adsorption surface, providing a similar covering effect on different types of suction holes (with minimal impact of suction hole shape on adsorption performance). Therefore, CT-HA exhibited the highest adsorption force and the farthest adsorption force acting distance in all test combinations. The VA posture showed the largest fluctuation in adsorption force. Based on the conclusions from Standard Particle Test Group 3, this was due to significant differences in tx during adsorption (especially the tip of CC could penetrate deeper into the suction hole), causing complex changes in the flow field near the suction hole. Moreover, the fit between the hole shape and the seed grain varied, resulting in certain suction holes having better adsorption performance for specific types of maize grains (for example, the P-R suction hole had better covering efficiency with CB, and the P-T suction hole had better covering efficiency with CC). This explains why some researchers have focused on studying suction hole shapes to achieve controllable seeding postures [31,32,33]. At the same time, as the pressure increased, the maximum adsorption force for each posture significantly increased. At the end of the adsorption area, the decay rate of adsorption force slowed down noticeably.
In the P-R suction hole adsorption test, the adsorption force for all maize seed postures increased significantly with the increase in vacuum pressure, with CT-HA having the highest adsorption force. The adsorption forces of CT-LA and CT-VA were similar and smaller than the adsorption force of CB in all postures. CB had a higher sphericity, resulting in better fitting with the P-R suction hole. Therefore, under various vacuum pressure conditions, the adsorption force of CB was slightly higher than that of other seed types. Additionally, CB exhibited small differences between its HA and VA postures. The change patterns of adsorption force and acting distance for CC-HA were similar to those of CT-LA. Combining the conclusions from Standard Particle Test Group 2, it could be explained that the similar adsorption areas of CC-HA and CT-LA led to minimal impact of the uncovered area on adsorption. However, the adsorption force of CC-VA fluctuated greatly, and it had the farthest adsorption force acting distance among all postures. This was because the sharp tip of CC could penetrate deeper into the P-R suction hole, increasing the detachment distance of the seed grain from the suction hole, and the irregular shape of the tip caused unclear flow field effects on CC.
In the P-T(a) suction hole adsorption test, the sharp contour of the suction hole made it difficult for maize seeds to completely cover the hole. CT-HA had the best covering effect, with its maximum adsorption force being about twice that of other seed postures. Within the same group, CB experienced a slightly higher adsorption force than other postures, while CT experienced a slightly lower adsorption force. The VA shape of CC, compared to other seed shapes, had an advantage in matching the P-T(a) hole, resulting in large fluctuations in adsorption force during the adsorption process and the farthest acting distance of the adsorption force. Combining the conclusions from Standard Particle Test Group 2, the P-T(a) suction hole imposed geometric restrictions, leading to similar adsorption behavior for the seeds in most cases. This similarity became more apparent with the increase in vacuum pressure.
In the P-S(a) suction hole adsorption test, CT-HA still had the highest maximum adsorption force, while CC-VA continued to show irregularities in adsorption. In Group 2, CB-HA was able to cover a larger area of the suction hole, resulting in a slightly higher maximum adsorption force. CT-LA and CC-HA had similar covering effects on the suction hole, leading to little difference in their maximum adsorption force and acting distance. In Group 3, the order of maximum adsorption force from highest to lowest was as follows: CC-VA, CB-VA, and CT-VA. Under different vacuum pressure conditions, there was no significant trend in adsorption differences between the seed types. CT-LA and CT-VA had similar geometric characteristics and positional relationships with the P-S(a) hole during adsorption, resulting in small differences in their adsorption force and acting distance. The same applied to CB-HA and CB-VA.
The P-N suction hole adsorption test results showed that CT-HA had significantly higher adsorption force than other seed postures but was lower than the maximum adsorption force for SQ particles in the Standard Particle Test Group. Under all three vacuum pressure conditions, the VA posture of maize seeds had significantly lower adsorption force and acting distance compared to other postures, indicating that the P-N suction hole had poor adsorption performance for the VA posture. This was due to the elongated flow field characteristics of the P-N suction hole, making it difficult for seeds to block a large area of the hole during vertical adsorption, leading to lower adsorption force. The pattern followed the conclusions from Test 2. In Group 2, the order of maximum adsorption force and acting distance from highest to lowest was as follows: CC-HA, CT-LA, and CB-HA. In Group 3, the order was as follows: CT-LA, CB-HA, and CC-HA. This pattern indicated that the P-N hole shape effectively limited the vertical adsorption posture of CC seeds. Although the P-N hole shape did not show outstanding performance in standard maize seed postures, based on the comprehensive test results and the conclusion of Test 3, the elongated flow field generated by this suction hole had an advantage in adsorbing elongated postures, especially at the seed edges.

5. Discussion

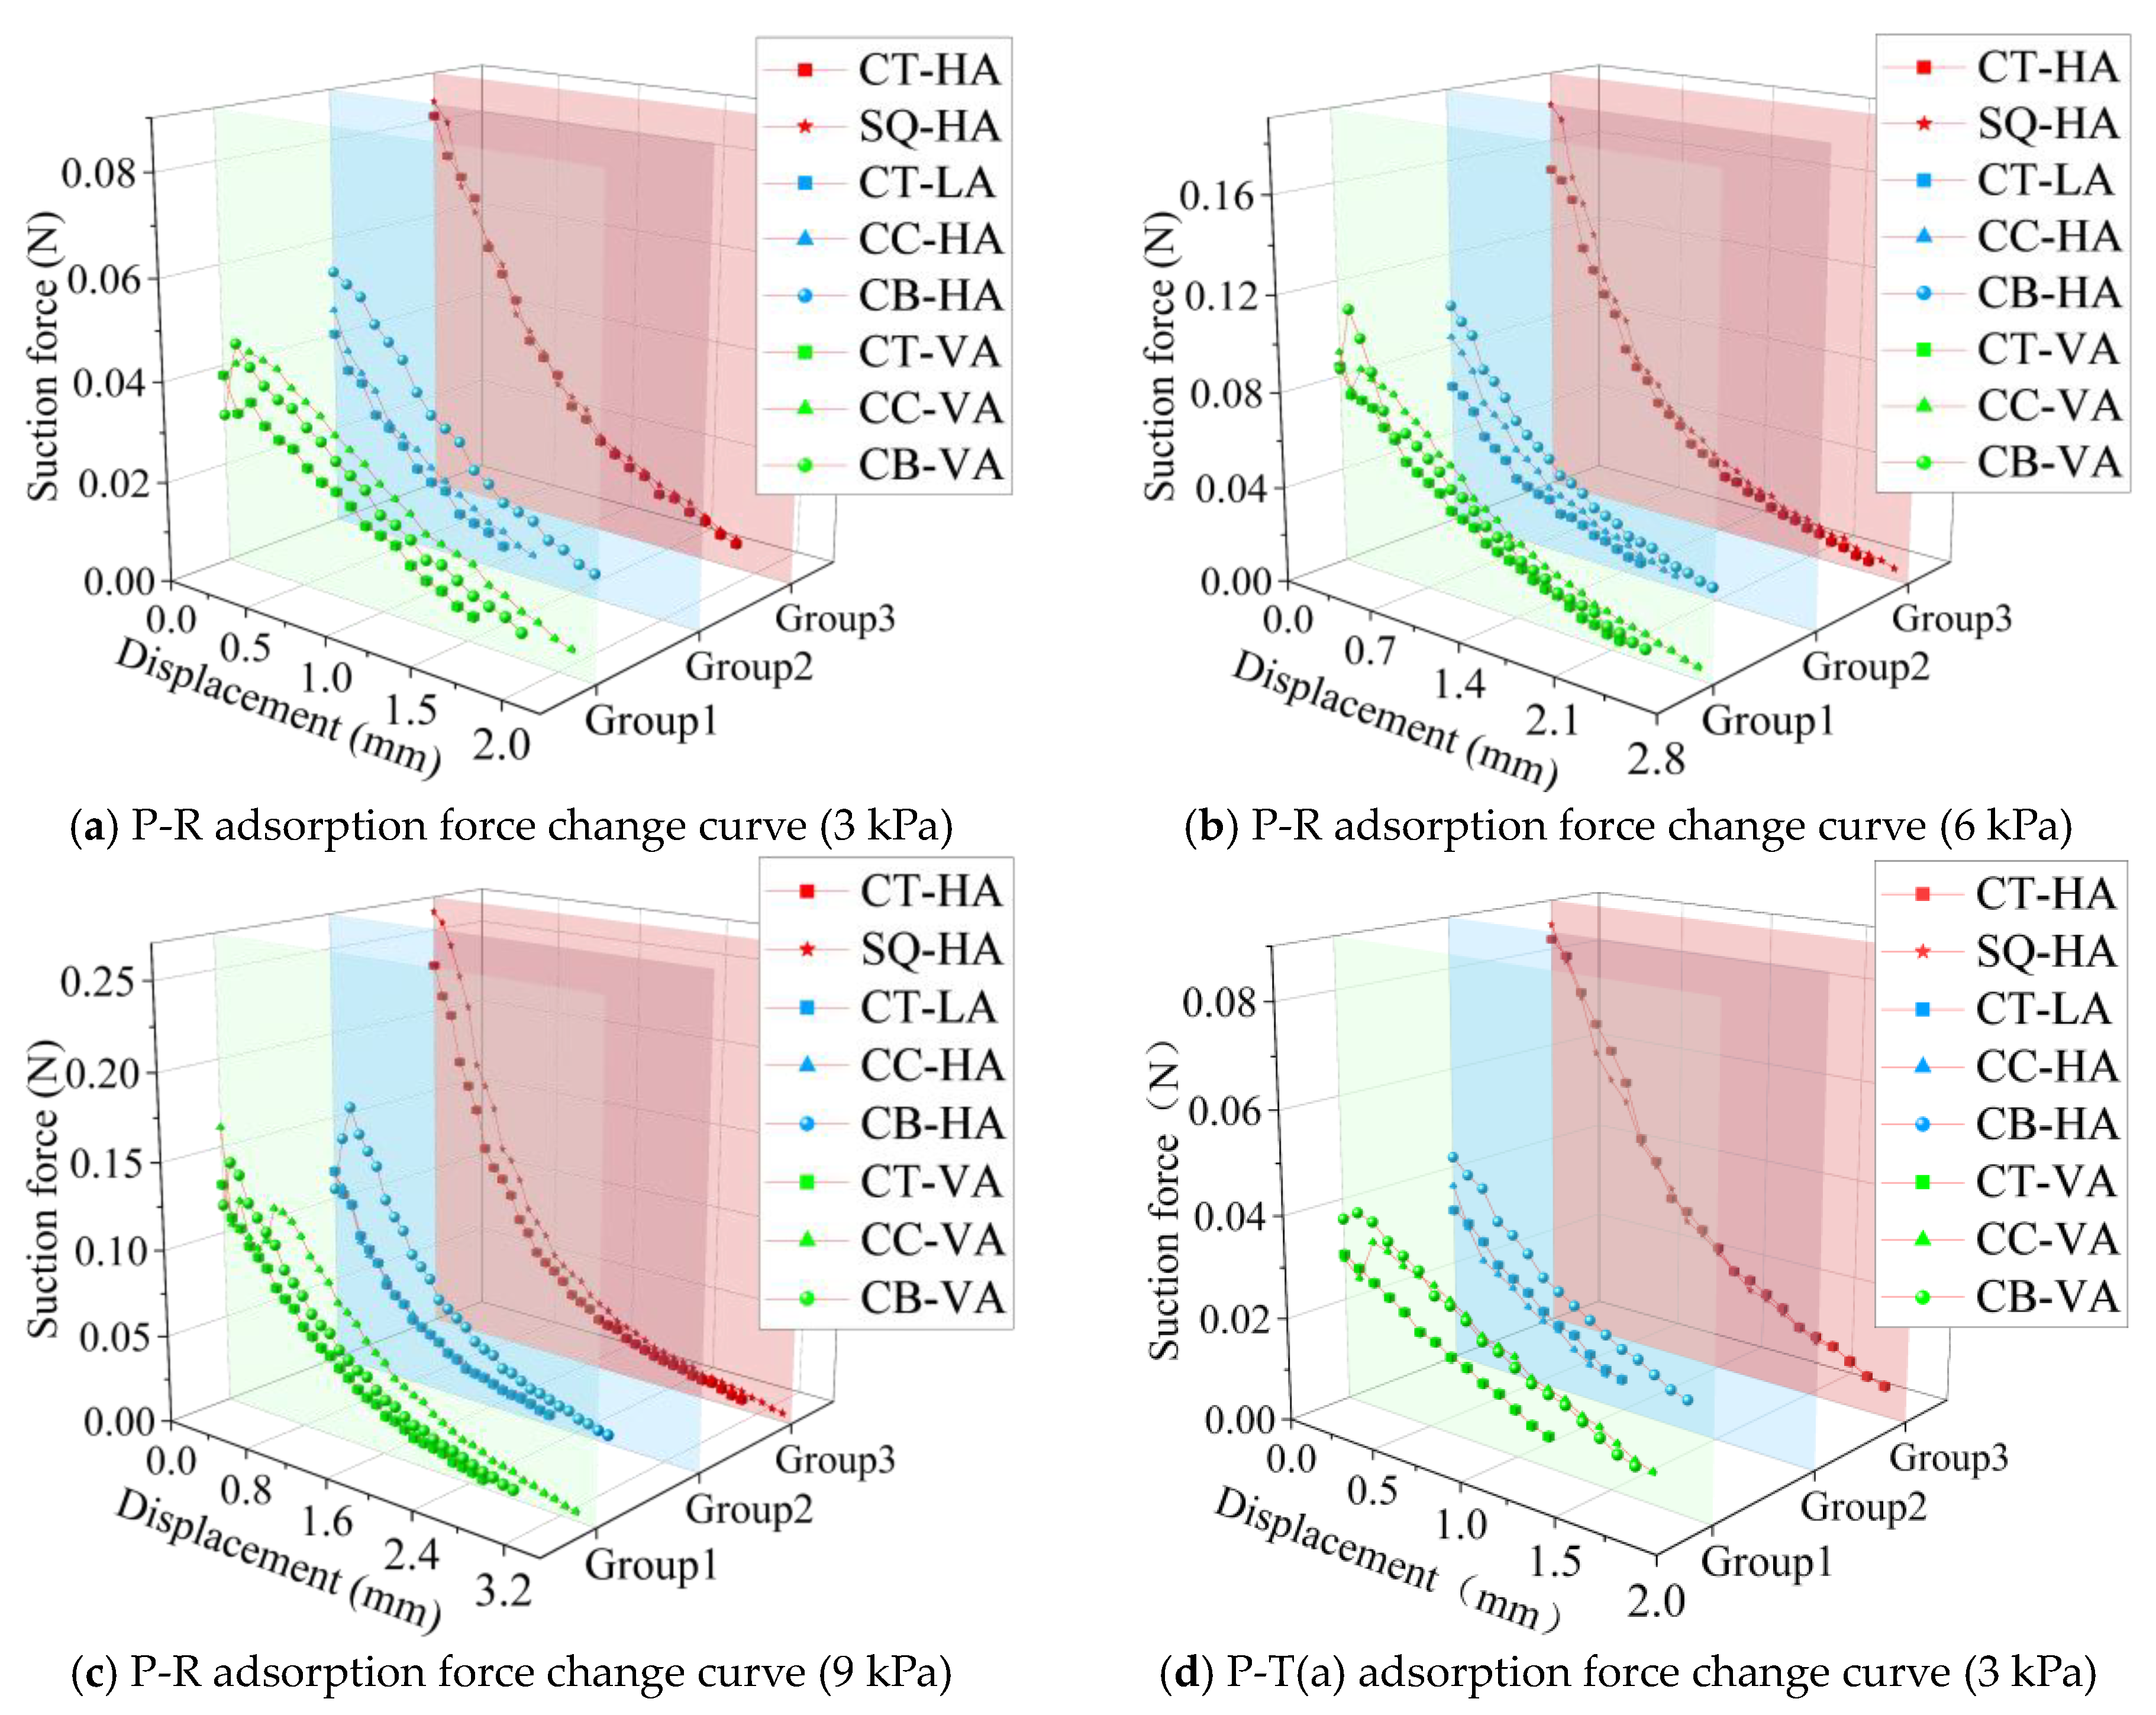
  • Based on the force analysis, maize seeds experience the effects of gravity, suction force from the seeding hole, and support from the seed plate during the adsorption process. The closer the seed’s center of mass is to the seed plate, the more stable the adsorption. When the seed is positioned flat against the seeding hole, it covers a larger area, resulting in greater suction force. In this orientation, the seed’s center of mass is also closest to the seed plate, making it the most stable posture for adsorption. When the seed is adsorbed by its edge or side, it will rotate due to gravity to adjust its center of mass, ultimately achieving a balanced and stable state with the support force.
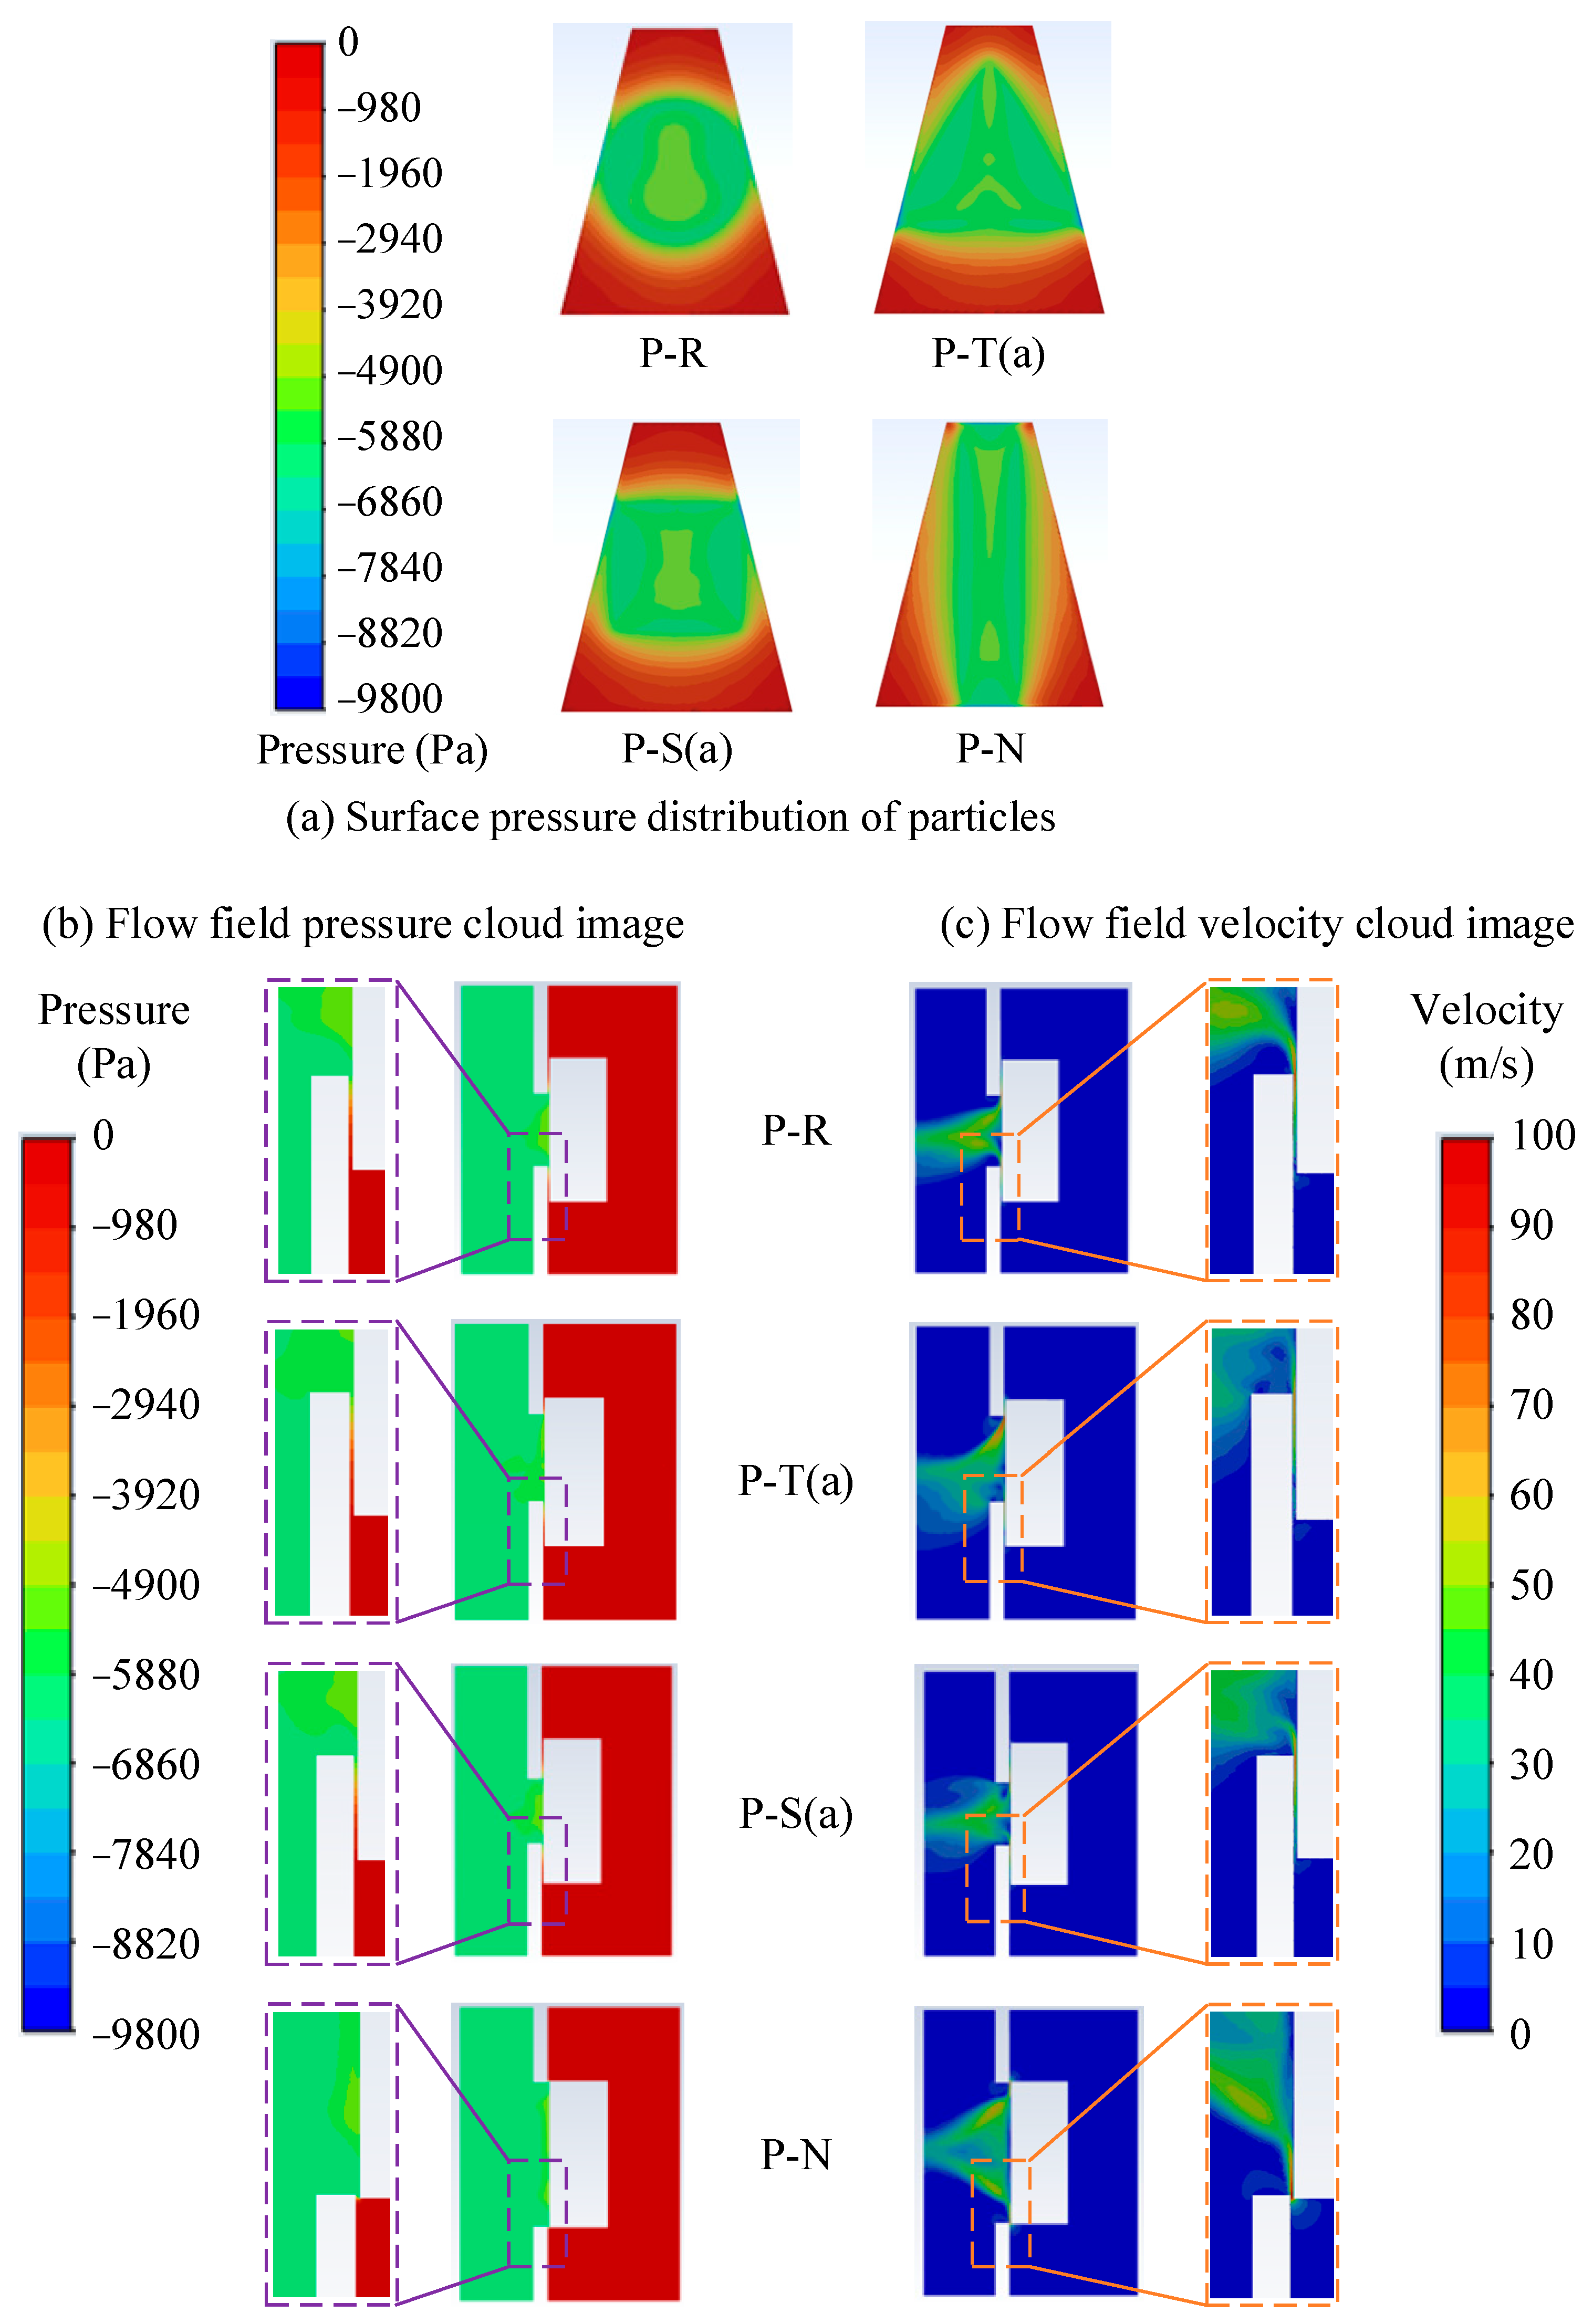
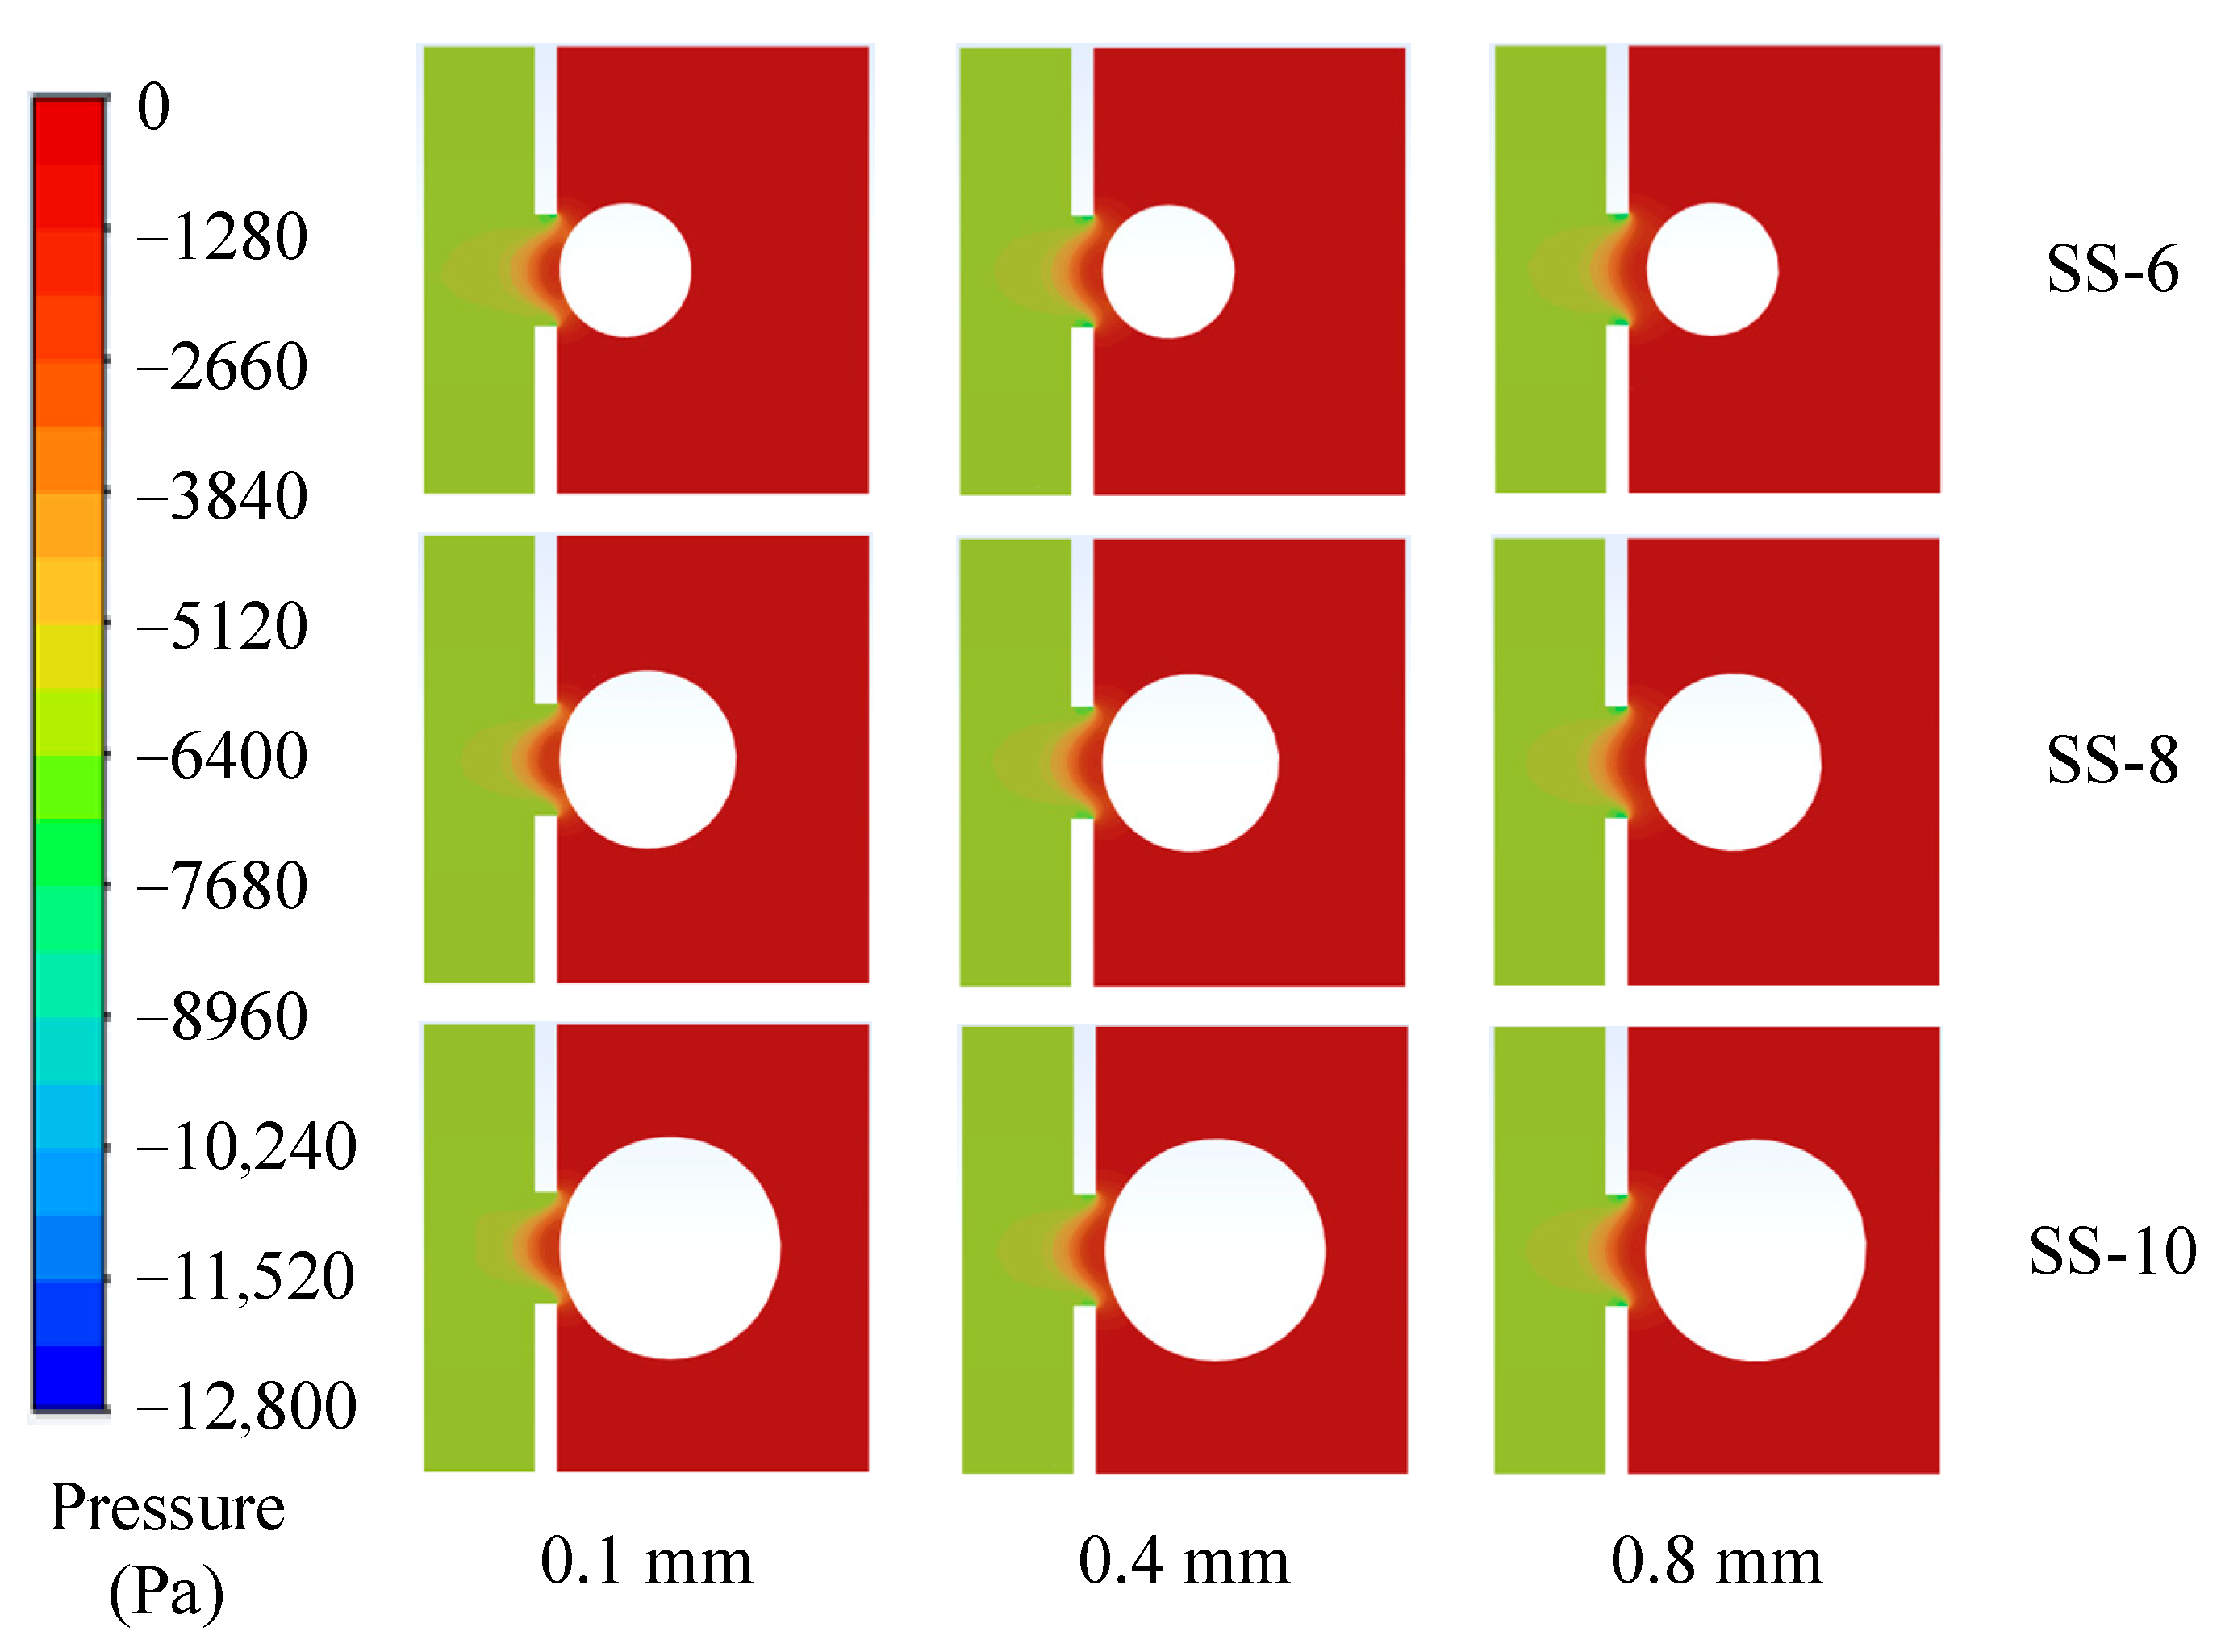
  • When the seeding hole area is the same, under the same vacuum pressure and when the seeding hole is fully covered, the shape of the hole does not significantly affect the adsorption performance of the SQ particle. During the initial phase of detachment from the seeding hole, the hole transitions from being blocked to connecting with the external environment. Air near the particle begins to flow from the high-pressure zone outside to the low-pressure zone inside the hole, with the shape of the hole affecting the distribution of pressure on the particle surface (i.e., the flow field distribution). However, there was no significant difference in the forces acting on the particle. The high-speed airflow in the gap between the particle and the seed plate creates a pressure difference (pressure gradient force) that prevents the particle from detaching from the hole, and this force is influenced by the airflow pattern and speed. This observed regularity aligns with the conclusion drawn by Wang et al. [9] from their experimental analysis of ellipsoidal seed adsorption.
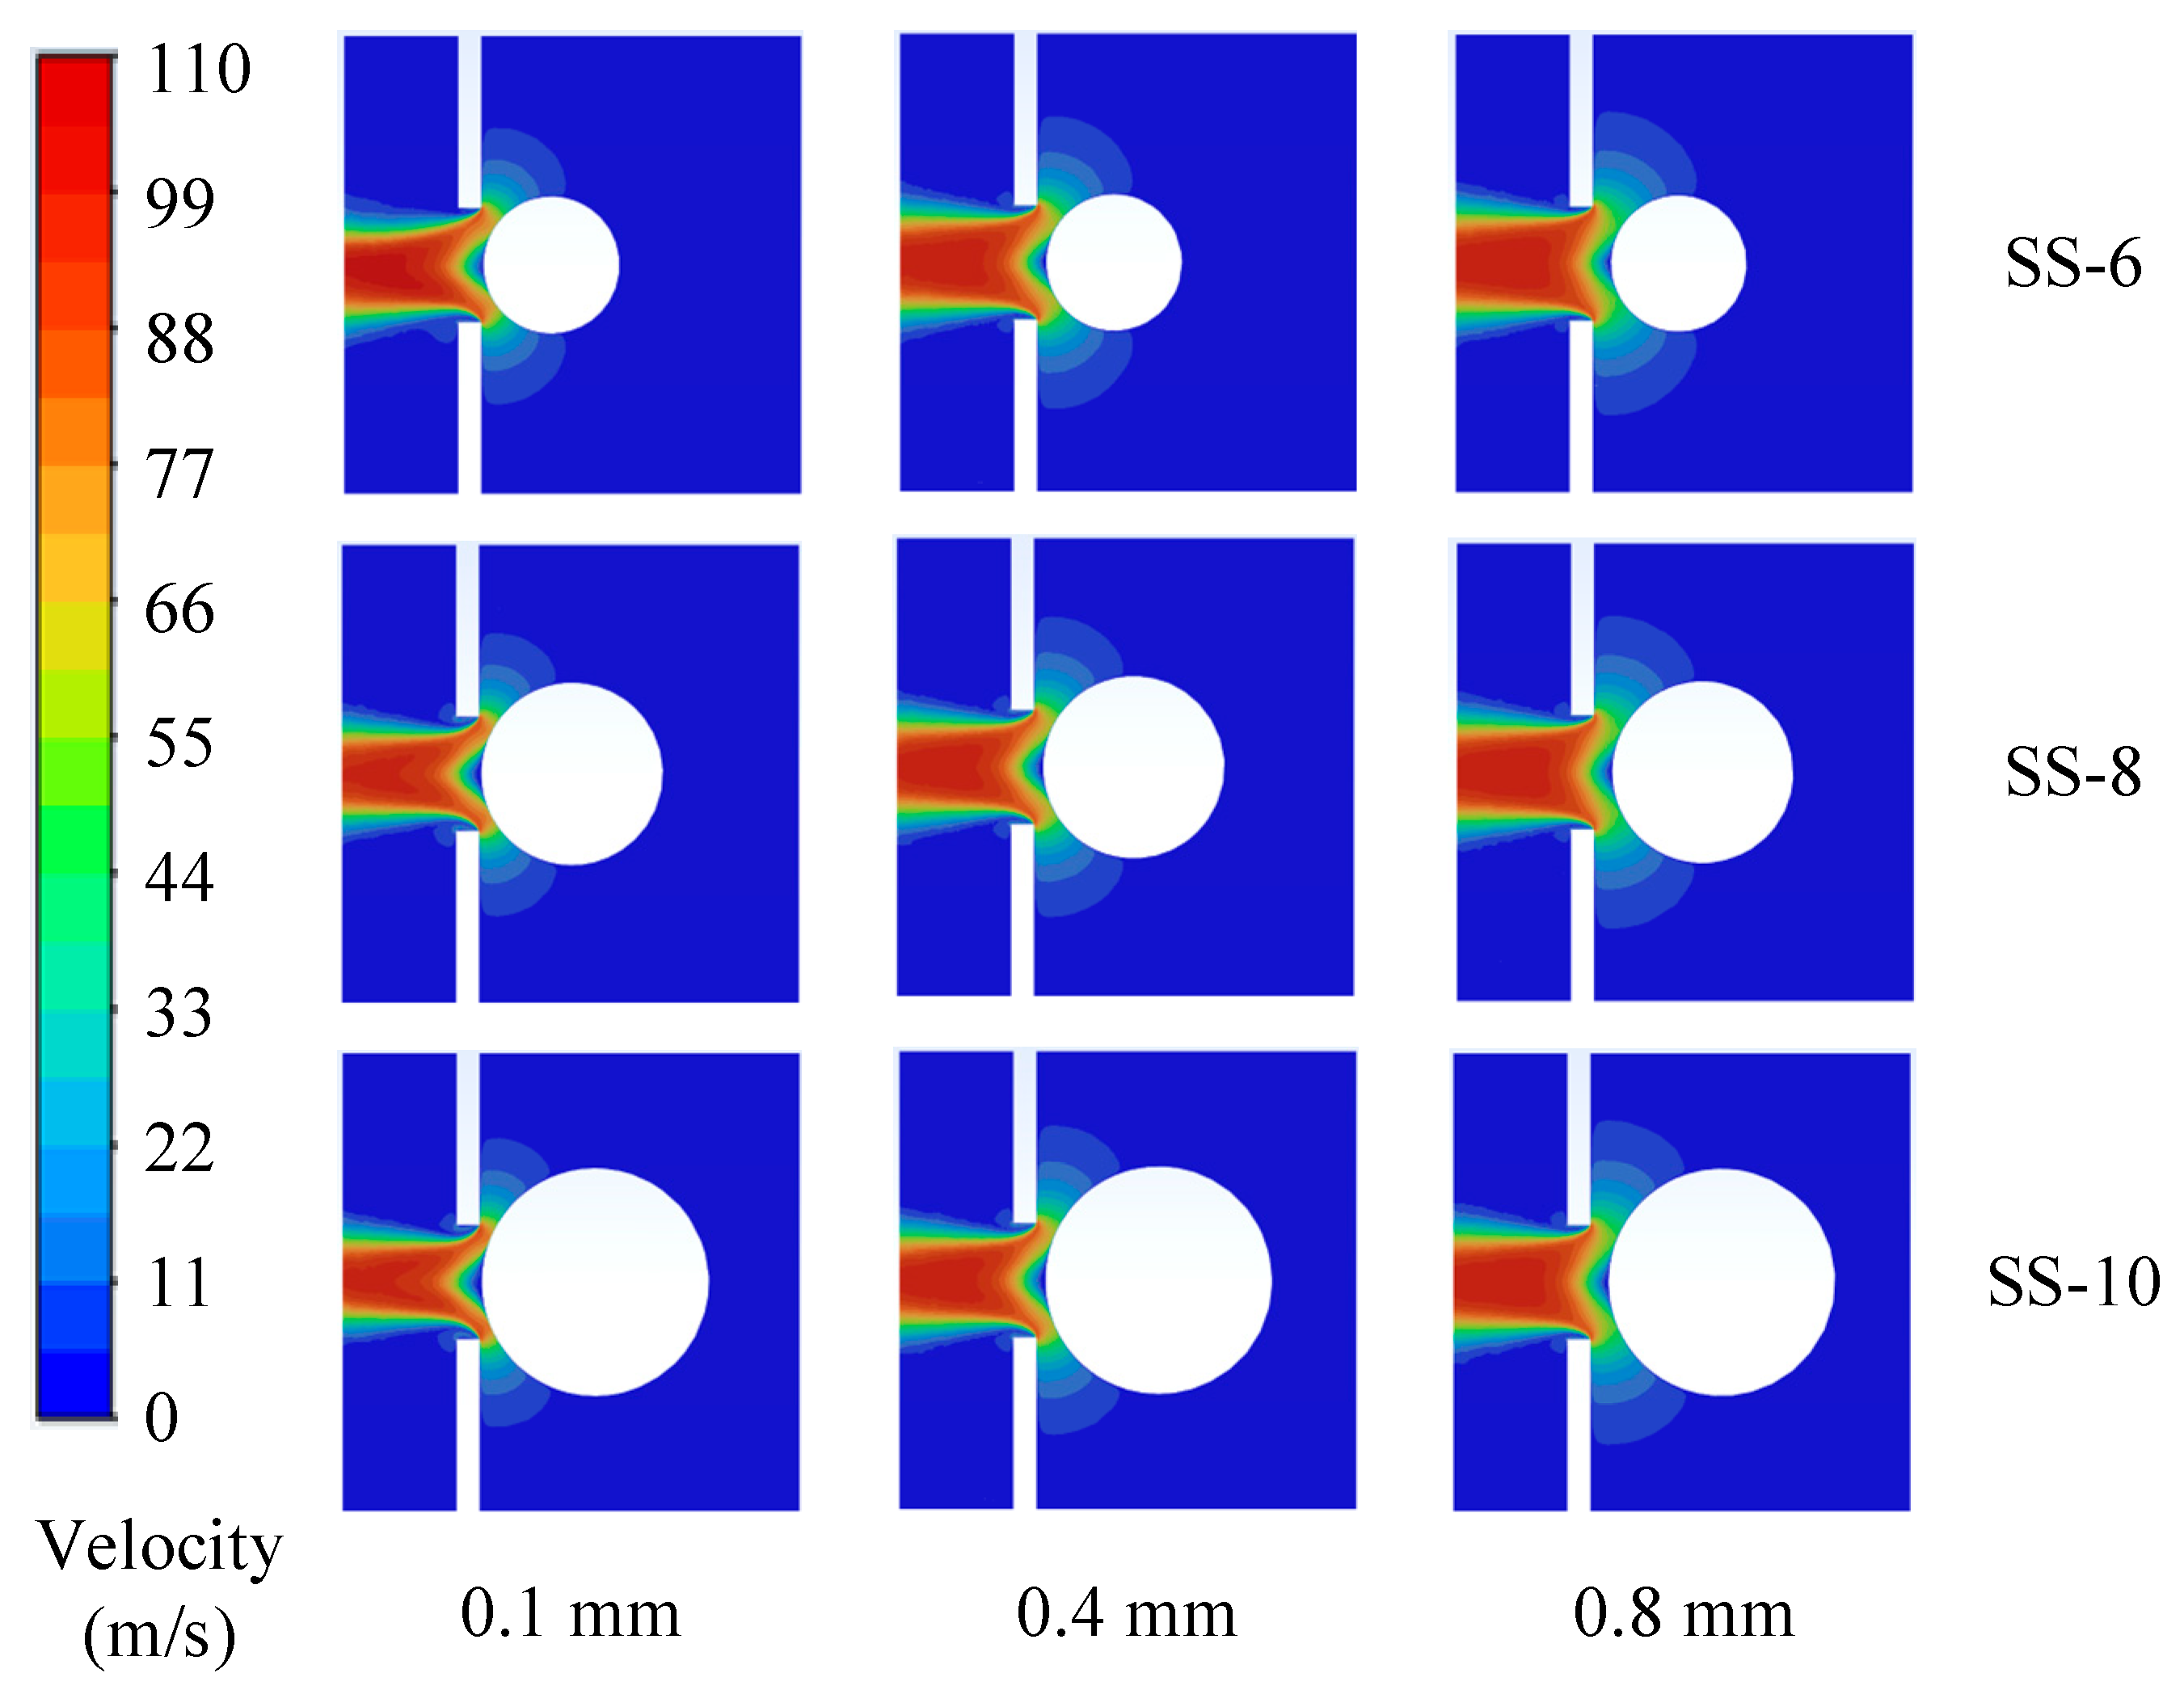
  • When studying the effect of airflow around the particles, the adsorption position of the material was controlled (keeping the relative position between SS-8 material and the seeding hole constant). As the unblocked area increased, the airflow speed in the gap between the particle and the hole increased, causing a slight increase in suction force. However, the rate of increase in suction force was much smaller than the increase in the unblocked area. This is because the airflow through the hole acts on the particle in the same position, and when the particle is 0.1 mm from the hole, a small increase in the seeding hole area has little effect on the vacuum pressure difference around the particle. The symmetry of the flow field and spherical particle causes the components of the forces generated by the increased airflow angle to cancel each other out. Therefore, increasing the unblocked area of the seeding hole has a minimal effect on the suction force acting on a particle in the same position.
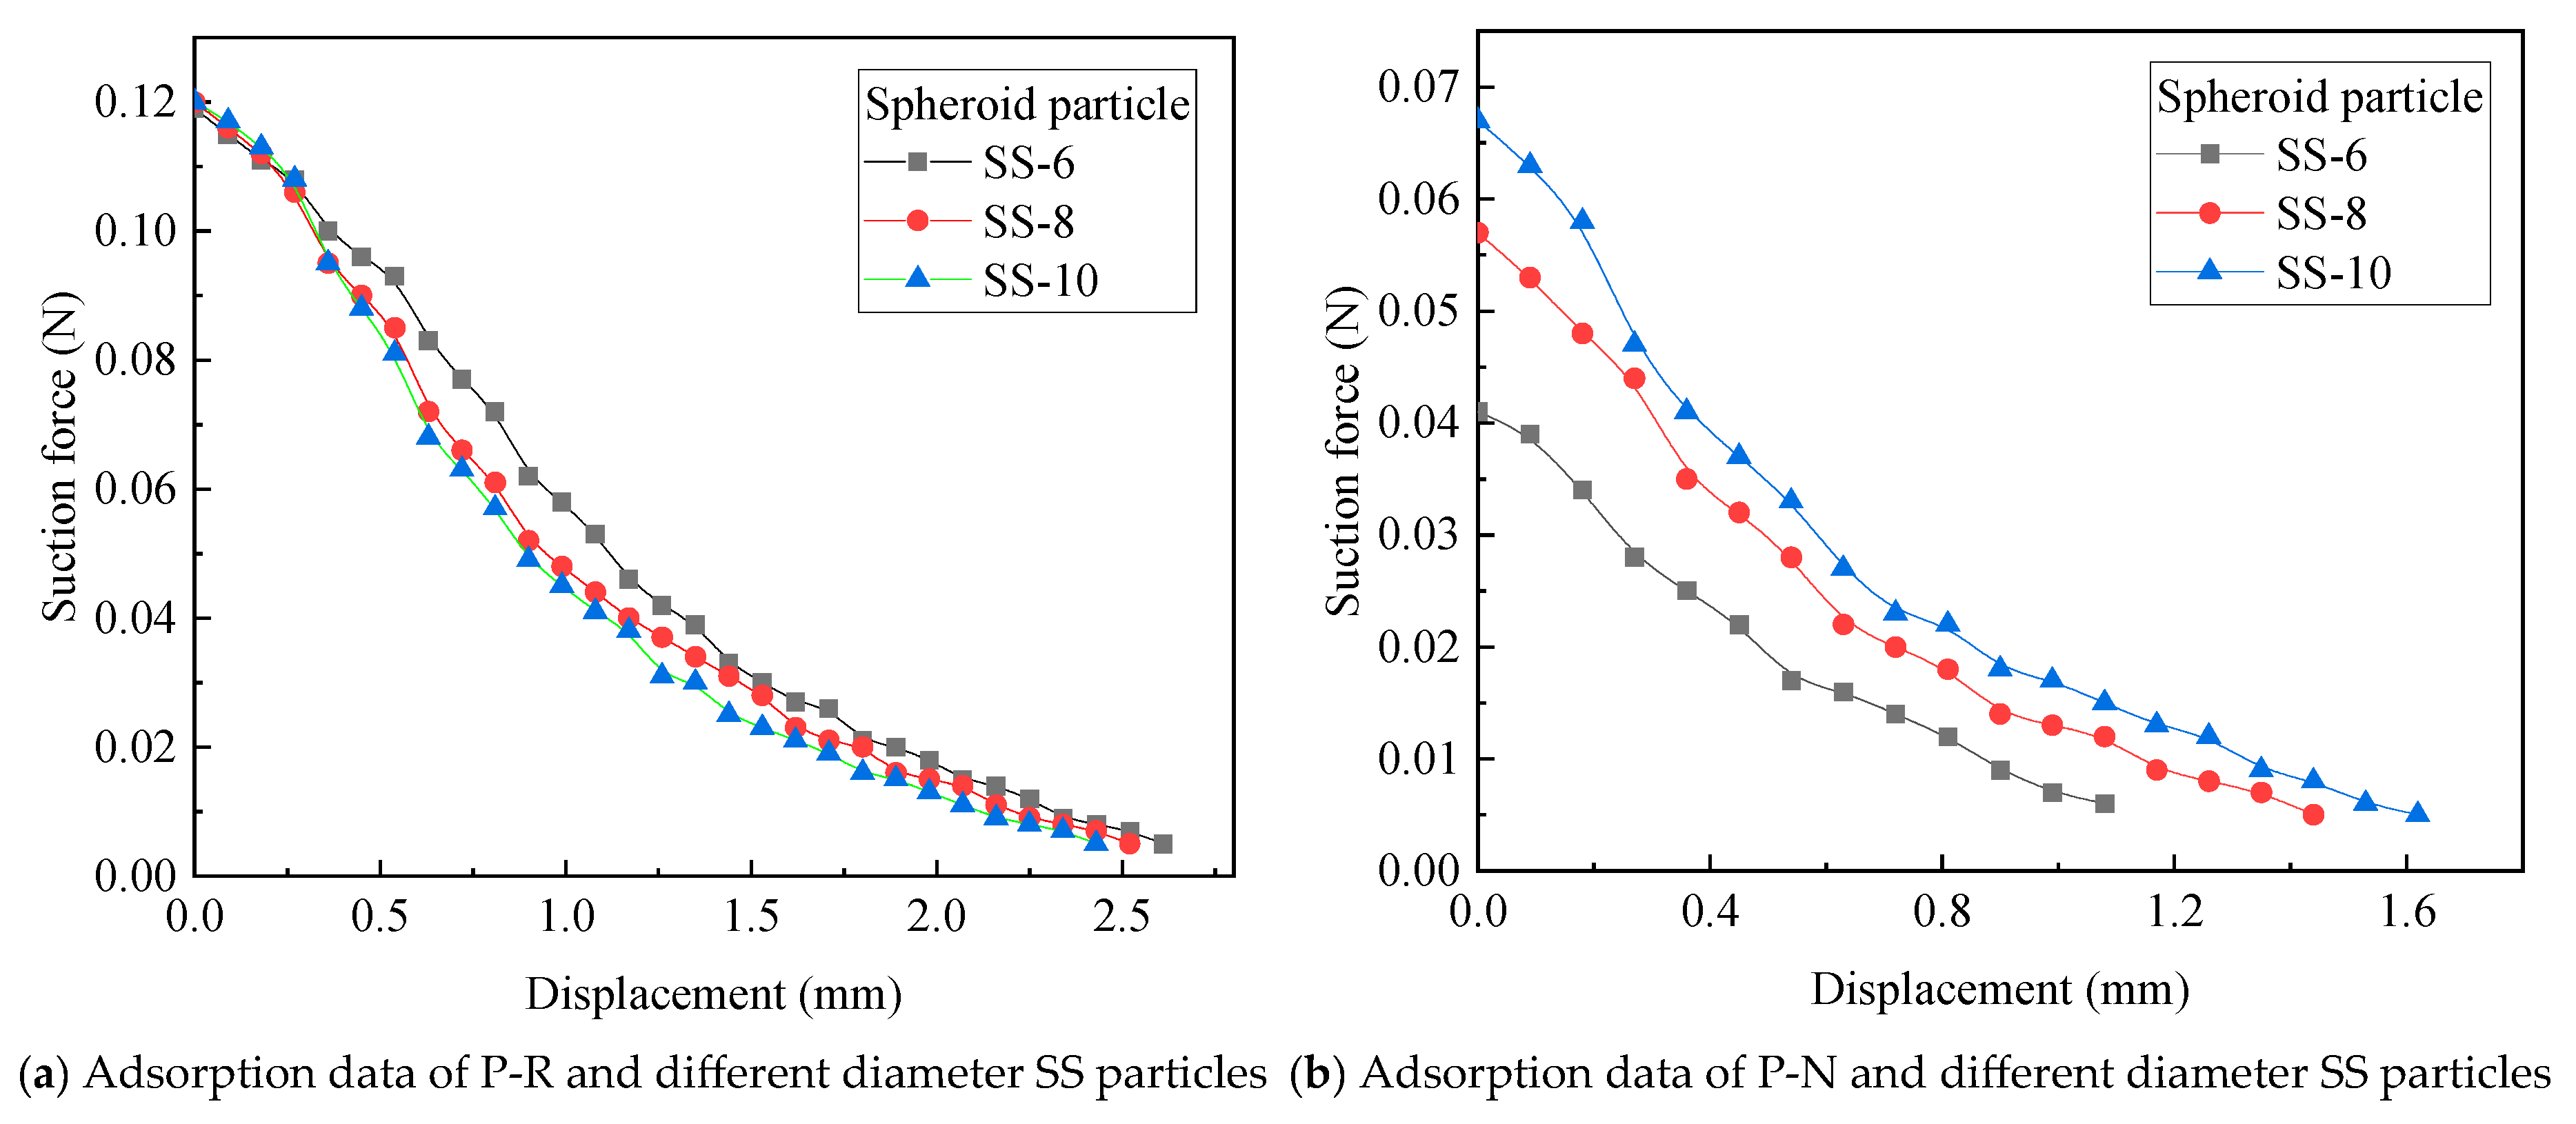
  • The adsorption results of spherical materials with different diameters on the P-R seeding hole under constant pressure show that, since the particles exhibit the same hole-blocking effect during adsorption, the three spherical particles had similar maximum adsorption forces at 6 kPa. As the particles moved further from the hole, the pressure gradient force decreased, and the differences in airflow around the particle surface became more pronounced. The SS-6 particle, having a larger curvature, exhibited a greater airflow wrap-around angle, causing a slower reduction in suction force, while the SS-10 particle experienced a faster reduction in suction force. However, smaller diameter particles are more likely to be captured by the same suction force, which could lead to re-adsorption of smaller particles. The P-N seeding hole’s adsorption results under constant pressure showed that the short edge of the hole limited the particle overlap distance (tx) with the seeding hole, resulting in the suction force being positively correlated with the overlap length along the long edge of the hole. This indicates that the P-N hole has advantages when used for materials with mass-to-characteristic-length ratios. The above analysis indirectly confirms the discovery of Barut et al. [34] that rectangular suction holes are more conducive to the adsorption of corn seeds [35].
  • The actual adsorption tests with maize kernels show that the shape of the seeding hole significantly impacts the adsorption effect on the maize kernels. The seeding hole tends to perform better with seed shapes that match its contours. Research findings by Tang et al. [13] indicate that designing suction holes with irregular shapes can enhance seeding performance. Due to the irregular shape and large individual variation of maize kernels, the suction force depends on kernel morphology, the effective blocking area of the kernel and hole, and the kernel’s posture, making it difficult to precisely categorize kernels and obtain accurate adsorption forces. Because of the geometric characteristics and flow field symmetry of the material, kernels with similar adsorption surfaces exhibit similar adsorption effects. Classifying kernels based on equivalent adsorption characteristics is an effective means of standardizing the adsorption features of irregular materials, but further research is needed to better understand the characteristics and effects of the airflow field from the seeding holes. (Although the data are representative of typical results from multiple repeated tests, the variability still reflects some randomness, and the differences between maize kernel types mean that each data set only represents random outcomes for specific kernel shapes in a particular posture.) Additionally, this experiment did not account for factors such as field vibrations and humidity under complex operating conditions, which may influence seed adsorption efficacy. Therefore, it is of great significance to quantify the movement patterns of individual seeds under suction holes in complex field conditions in future research.
  • Traditional pressure calculation models and airflow drag calculation models have limitations when applied to calculate the suction force of seeding holes. Similarly, Li et al. [7] highlighted the unreliability of traditional suction models in their adsorption studies on highly spherical seeds. According to gas–solid two-phase flow theory, particles should be influenced by FD, FP, and Fsa forces during the adsorption process. However, due to variations in flow fields, theoretical calculations should be adjusted based on the flow field characteristics and the specific particles being adsorbed. This paper proposes a hypothetical suction force calculation model (Equation (4)) for further research and discussion. The vacuum pressure, hole area, particle size, curvature of the particle’s suction surface, and distance between the particle and the hole all affect the magnitude of the suction force. The establishment of a suction model can provide theoretical support for the design and development of seed metering devices, facilitating the advancement of precise and quantitative seeding technology.

6. Conclusions

In this study, a custom-built suction force measurement test platform for maize seed metering devices was used to conduct adsorption experiments on both standard particles and maize kernels. Using a combination of CFD simulation and actual experiments, the key factors influencing the suction force of seeding holes were compared and analyzed, and commonly used models for calculating the suction force of maize kernels were validated. The main conclusions are as follows:
  • The study demonstrated that commonly used methods for calculating the suction force of seeding holes (pressure calculations and airflow drag calculations) have limitations in their application. In experiments evaluating the effect of equivalent adsorption area, the relative error between the suction force estimated by the traditional pressure-based method for triangular holes and the actual measured force reached 40.82%. Similarly, the relative error between the force estimated by the airflow drag method for square suction holes and the actual measured force under the same conditions was 17.14%.
  • Adsorption tests with standard particles showed that vacuum pressure, hole-blocking area, particle diameter, suction surface curvature, particle distance from the seeding hole, and the effective action area of the seeding hole all influence suction force. When fully blocked, the shape of the seeding hole has little effect on flat suction surfaces (the standard deviation of the maximum suction force for the four tested orifice geometries was less than 0.005 N under vacuum levels of 3, 6, and 9 kPa). When the particle adsorption position is the same, differences in the unblocked area of the hole have minimal impact on suction force (the variation in unblocked area among the orifices reached 139%, while the maximum adsorption force difference among the four orifice geometries remained below 0.036 N across all three vacuum levels). The overlap depth between the particle boundary and the hole affects the forces on the particle during the initial phase of detachment.
  • Actual maize kernel adsorption tests showed significant differences in the suction force and suction distance depending on the posture of the seed under the same seeding hole type. Different seeding hole types have specific suitability and guidance effects on seed adsorption. Dent-like maize seeds in a horizontal adsorption posture had the highest stability and maximum suction force, while conical seeds in a vertical posture exhibited significant variations in suction force due to their higher overlap with the seeding hole.
  • This study experimentally measured the adsorption force and effective suction range of tooth-like, cone-like, and spherical maize kernels under various postures and vacuum levels (3, 6, 9 kPa), using four suction hole shapes with equal area: circular, equilateral triangular, square, and narrow elongated. The results provide valuable data to support the design and development of air-suction maize seed metering devices.

Author Contributions

Conceptualization, G.B. and Z.Z.; methodology, G.B. and L.L.; software, G.B.; validation, G.B., W.Y. and J.L.; formal analysis, G.B.; investigation, G.B. and Z.L.; resources, G.B. and W.Y.; data curation, G.B.; writing—original draft preparation, G.B. and L.L.; writing—review and editing, G.B., W.Y. and L.L.; visualization, G.B.; supervision, J.L. and X.C.; project administration, W.Y.; funding acquisition, W.Y. All authors have read and agreed to the published version of the manuscript.

Funding

This research was mainly supported by a grant from the project (2023YFD2000400) of the National Key R&D Program of China. This research was also supported by the Collaborative Innovation Center for Shandong’s Main Crop Production Equipment and Mechanization.

Data Availability Statement

Data are reported within the article.

Acknowledgments

The authors would first like to thank the mentor research team for their support. We would also like to thank everyone for their suggestions in the design of the experiment and the theoretical analysis. It is worth mentioning that special thanks to the editorial team and review experts for their help in the content and logic of the article, so that this article can be enriched and perfected and published smoothly.

Conflicts of Interest

All authors were employed by the company Chinese Academy of Agricultural Mechanization Sciences Group Co., Ltd. The authors declare no conflicts of interest.

References

  1. Zhao, X. Design and Performance Test of Sunflower Seed Directional Adsorption Seed-Metering Device. Master’s Thesis, Inner Mongolia Agricultural University, Hohhot, China, 2023. [Google Scholar] [CrossRef]
  2. Wang, G.D.; Xu, S.C.; Feng, N.N.; Wang, X.Q.; Zhang, Y. Design of sucker arrangement for vacuum sucker plate grabbing device. Manuf. Autom. 2021, 43, 14–16+31. [Google Scholar] [CrossRef]
  3. Deng, X.L.; Luo, Z.Y.; Pang, J.Q.; Zhang, Y.M.; Yang, C.J.; Li, R.Q. Design and experiment of bionic nondestructive handheld suction apple picker. J. China Agric. Univ. 2019, 24, 100–108. [Google Scholar] [CrossRef]
  4. Liu, H.B.; Li, X.R.; Liu, L.D. Research progress of automatic grabbing and transfer methods for garment fabrics. J. Text. Res. 2021, 42, 190–196. [Google Scholar] [CrossRef]
  5. Schulz, A.K.; Ning, W.J.; Ha, S.Y.S.; Kom, G.; Slade, S.B.; Rivera, S.; Reidenberg, J.S.; Hu, D.L. Suction feeding by elephants. J. R. Soc. Interface 2021, 18, 20210215. [Google Scholar] [CrossRef]
  6. Gao, R.; Zhang, W.; Wang, Y. Design and test of the automatic loading and unloading vacuum adsorption device for glue-laminated timber. J. For. Eng. 2021, 6, 126–132. [Google Scholar] [CrossRef]
  7. Li, J.H.; Lai, Q.H.; Zhang, H.; Zhang, Z.G.; Zhao, J.W.; Wang, T.T. Suction force on high-sphericity seeds in an air-suction seed-metering device. Biosyst. Eng. 2021, 211, 125–140. [Google Scholar] [CrossRef]
  8. Li, J.H.; Lai, Q.H.; Su, W.; Xie, Y.R.; Zhang, Z.G. Research on the influence of the suction force on spherical particles in suction flow. Powder Technol. 2021, 393, 824–836. [Google Scholar] [CrossRef]
  9. Wang, Y.J.; Su, W.; Lin, Y.H.; Lai, Q.H.; Li, J.H. Measurement and modeling the suction force on ellipsoidal particles. Vacuum 2024, 219, 112743. [Google Scholar] [CrossRef]
  10. Pareek, C.M.; Tewari, V.K.; Machavaram, R. Multi-objective optimization of seeding performance of a pneumatic precision seed metering device using integrated ANN-MOPSO approach. Eng. Appl. Artif. Intel. 2023, 117, 105559. [Google Scholar] [CrossRef]
  11. Yousry, S.; Youseef, S.; Hossam, E.; Solaf, A.E. Design of a vacuum seed plate based on physical and mechanical properties of maize seeds. Int. J. Adv. Res. 2020, 8, 114–123. [Google Scholar] [CrossRef]
  12. Hussain, S.; Chen, Y.; Yu, X.; Farid, M.U.; Ghafoor, A.; Alshamali, S.J.; Munir, T.; Hu, J. Design Optimization and Aerodynamic Investigations of Air Suction Seed Metering Systems through CFD-DEM Approach. Smart Agric. Technol. 2025, 12, 101082. [Google Scholar] [CrossRef]
  13. Tang, H.; Guan, T.Y.; Xu, F.D.; Xu, C.S.; Wang, J.W. Test on adsorption posture and seeding performance of the high-speed precision dual-chamber maize metering device based on the seed characteristics. Comput. Electron. Agr. 2024, 216, 108471. [Google Scholar] [CrossRef]
  14. Sun, S.C. Simulation Analysis of Working Process of Air Suction Corn Precision Seed-Metering Device Based on DEM-CFD Coupling Method. Master’s Thesis, Jilin University, Changchun, China, 2016. Available online: https://kns.cnki.net/kcms2/article/abstract?v=-Y4qPNLDuvbMD7ab05z_43mQWW9eb8U7Ce3W_hHhjwbU6V7ciWI4Wlh1nKXrTceCMngF840VktCRAHiN05a_1WYsFsqDHb-vUUaX6IwR5IRy8hwUGPn4OJFwrlOOV4CDwxEFnCVraaEtDWDuDfIDC8Cvh14k1qWvIZc25GpdPGQ=&uniplatform=NZKPT (accessed on 28 June 2025).
  15. Zhao, X.G.; Xu, L.M.; Wang, Y.B.; Li, C. Directional adsorption characteristics of corn seed based on fluent and high-speed photography. Trans. Chin. Soc. Agric. Mach. 2014, 45, 103–109+28. [Google Scholar] [CrossRef]
  16. Ding, L.; Yang, L.; Zhang, D.X.; Cui, T.; Zhang, K.L.; Zhong, X.J. Effect of seed adsorption posture of corn air-suction metering device on seed feeding performance. Trans. Chin. Soc. Agric. Mach. 2021, 52, 40–50. [Google Scholar] [CrossRef]
  17. Sial, F.S.; Persson, S.P. Vacuum nozzle design for seed metering. Trans. ASAE 1984, 27, 688–696. [Google Scholar] [CrossRef]
  18. Fan, L.S.; Zhu, C. Principles of Gas-Solid Flows, 2nd ed.; Cambridge University Press: Cambridge, Britain, 1998. [Google Scholar]
  19. Zhao, Z.; Li, Y.M.; Chen, J.; Zhou, H. Dynamic analysis on seeds pick-up process for vacuum-cylinder seeder. Trans. CSAE 2011, 27, 112–116. [Google Scholar] [CrossRef]
  20. Deng, F.H. Experimental Research on the Drag Coefficient of Non-Spherical Particles. Master’s Thesis, China University of Petroleum, Beijing, China, 2018. [Google Scholar] [CrossRef]
  21. Dai, J.G. Study on discrete element parameters of maize kernel based on PFC(3D). Agric. Technol. 2021, 41, 22–26. [Google Scholar]
  22. Zhou, L. DEM-Based Modelling of Maize Seeds and the Simulation Analysis and Experimental Study of the Seed-Sowing. Ph.D. Thesis, Jilin University, Changchun, China, 2021. [Google Scholar] [CrossRef]
  23. Wang, J.W.; Tang, H.; Wang, Q.; Zhou, W.Q.; Yang, W.P.; Shen, H.G. Numerical simulation and experiment on seeding performance of pickup finger precision seed-metering device based on EDEM. Trans. CSAE 2015, 31, 43–50. [Google Scholar] [CrossRef]
  24. Shi, S. Design and Experimental Research of the Pneumatic Maize Precision Seed-Metering Device with Combined Holes. Ph.D. Thesis, China Agricultural University, Beijing, China, 2015. Available online: https://kns.cnki.net/kcms2/article/abstract?v=-Y4qPNLDuvaQNqtCE40L1FJWry6d9th3SB18M9LO-ULzr8pA8bIP6NLtNlIc2CydEcVcbe7-gWJn8EUWF5ie6iYgBTZPc4_W-P7HOe9pXNv2z6oWRjzGWDhHkIEsdQ69oBcz6T2pEKgveLgEmLwlT4nE6cmq7n0aqeIkRbHEHFejgQvTMxaajEGVIpZJrLTg&uniplatform=NZKPT&language=CHS (accessed on 28 June 2025).
  25. Yang, Q.; Yue, L.J.; Chen, Y.; Li, Z.; Liu, Y.H. Effects of maize seed morphology on seeding performance of precise seed metering device of socket-roller. Southwest China J. Agric. Sci. 2021, 34, 1847–1852. [Google Scholar]
  26. Chinese Academy of Agricultural Mechanization Sciences (CAAMS). Agricultural Machinery Design Manual, 2nd ed.; China Agricultural Science and Technology Press: Beijing, China, 2007. [Google Scholar]
  27. Abdolahzare, Z.; Mehdizadeh, S.A. Real time laboratory and field monitoring of the effect of the operational parameters on seed falling speed and trajectory of pneumatic planter. Comput. Electron. Agr. 2018, 145, 187–198. [Google Scholar] [CrossRef]
  28. Ding, L.; Yang, L.; Wu, D.Y.; Zhang, D.X.; Liu, S.R. Simulation and experiment of corn air suction seed metering device based on DEM-CFD coupling method. Trans. Chin. Soc. Agric. Mach. 2018, 49, 48. [Google Scholar] [CrossRef]
  29. Chen, Y.L.; Liu, Z.Q.; Han, J.; Zhao, L.Q.; Sui, X.H.; Zhang, J.W.; Lan, Y.B. Design and experiments of the flat seed-adsorbing posture adjustment mechanism for the air-suction metering device. Trans. Chin. Soc. Agric. Eng. 2022, 38, 1–11. [Google Scholar] [CrossRef]
  30. Djojodihardjo, H. Overview on the influence of coanda blanket curvature on coanda device performance. In Proceedings of the 31st Congress of the International Council of the Aeronautical Sciences, Belo Horizonte, Brazil, 9–14 September 2018. [Google Scholar]
  31. Wang, J.; Li, Y.D.; Song, Z.H.; Tian, F.Y.; Yan, Y.F.; Sun, X.Z. Simulation study on key components of combined air suction seed metering device based on fluent. Agric. Eng. 2023, 13, 90–96. [Google Scholar] [CrossRef]
  32. Dai, W.L. Structural Design and Experimental Study of a New Type of Air-Suction Precision Seed-Metering Device for Maize. Master’s Thesis, Jilin Agricultural University, Changchun, China, 2019. [Google Scholar] [CrossRef]
  33. Shi, L.R.; Sun, B.G.; Zhao, W.Y.; Yang, X.P.; Xin, S.L.; Wang, J.X.; Ackermann, K. Optimization and test of performance parameters of elastic air suction type corn roller seed-metering device. Trans. Chin. Soc. Agric. Mach. 2019, 50, 88–95+207. [Google Scholar]
  34. Barut, Z.B.; Özmerzi, A. Effect of different operating parameters on seed holding in the single seed metering unit of a pneumatic planter. Turk. J. Agric. For. 2004, 28, 435–441. [Google Scholar]
  35. Bao, G.C.; Zhang, Z.D.; Liu, L.J.; Li, J.D.; Tao, C.S.; Yang, W. Study on the Adsorption Mechanism of Spherical Particles near the Seed Metering Disk Surface by Narrow Elongated Suction Holes. Agriculture 2025, 15, 657. [Google Scholar] [CrossRef]
Figure 1. Schematic Diagram of Adsorption Pressure Analysis. Based on the pressure, the force analysis of the particle completely adsorbed in the suction hole is carried out. FS is the pressure of the suction hole, N; G is the gravity, N; Fn is the support force, N; da is the particle diameter, m; dk is the suction diameter, m; hm is the distance between particle center of mass and suction plane, m; tx is the overlap depth between the particle boundary and the surface of the suction hole, m; θk is the suction covers the cone angle, °; XYZ is the spatial coordinate system.
Agriengineering 07 00218 g001
Figure 2. Schematic Diagram of Adsorption Force Analysis. Based on fluid dynamics, the force analysis of particles not fully adsorbed in the suction hole was carried out. G is the gravity, N; FD is the airflow drag force, N; Fp is the pressure gradient force on the particle, N; Fsa is the Saffman lift force, N; da is the particle diameter, m; dk is the suction diameter, m; hm is the distance between particle center of mass and suction plane, m; XYZ is the spatial coordinate system.
Agriengineering 07 00218 g002
Figure 3. Sphericity classification diagram. The commonly used corn grain types in the research were classified based on the sphericity as the criterion. T1: Dent-shaped, T2: Rectangular-shaped, T3: Rounded-flat, T4: Pointed-tooth, T5: Fine-tooth, C1: Sphero-conical, C2: Conical, C3: Ellipsoidal-conical, C4: Short triangular pyramid, C5: Triangular pyramid, B1: Spherical, B2: Near-spherical, B3: Ellipsoidal.
Agriengineering 07 00218 g003
Figure 4. Adsorption force measurement test bench. The actual experiment of the particles was carried out by the test bench, and the data of the measured particle adsorption force were obtained. 1. Air-driven precision seeder, 2. Replaceable seed discs, 3. Test particles, 4. Particle connecting rod, 5. Electric screw jack, 6. Push–Pull force gauge (range of measure 10 N, resolution 0.0001 N), 7. Negative pressure fan, 8. Laptop, 9. Electric screw controller, 10. Differential pressure gauge (range of measure 10 kPa, resolution 10 Pa), 11. Frame.
Agriengineering 07 00218 g004
Figure 5. Simulation device model. The simulation model is shown in the figure, and the observation plane is intercepted for analysis. 1. Vacuum area 2. Single-hole disk 3. Data observation surface 4. Test particles 5. Atmospheric area.
Agriengineering 07 00218 g005
Figure 6. Example of dent-like kernel adsorption posture. The adsorption attitude of dent-like kernels was named as an example, and the force analysis was carried out in the adsorption state: (a) Seed sowing adsorption force analysis; (b) Example of horizontal adsorption (HA); (c) Example of lateral adsorption (LA); (d) Example of vertical adsorption (VA).
Agriengineering 07 00218 g006
Figure 7. The actual adsorption force curve graph of SQ (tetragonal prism particles). The change curve of adsorption force of SQ particles when leaving different shapes of suction holes.
Agriengineering 07 00218 g007
Figure 8. Cloud diagram of pressure and velocity of simulation experiment 1. (a) Surface pressure distribution of particles. (b) Flow field pressure cloud image. (c) Flow field velocity cloud image. The cloud image of the flow field pressure and velocity of SQ and suction hole at 6 kPa in the design of experiment 1 was obtained by simulation analysis.
Agriengineering 07 00218 g008
Figure 9. Actual adsorption results of different suction holes on SS-8. The change curve of adsorption force of SS-8 particles when leaving different shapes of suction holes.
Agriengineering 07 00218 g009
Figure 10. Results of simulation experiment 2.
Agriengineering 07 00218 g010
Figure 11. Experiment 3 results data. A comparative analysis was conducted on the adsorption differences between P-R and P-N suction holes for SS particles with varying diameters under a vacuum pressure of 6 kPa.
Agriengineering 07 00218 g011
Figure 12. Pressure cloud diagram of flow field during P-R suction process.
Agriengineering 07 00218 g012
Figure 13. Velocity cloud diagram of flow field during P-R suction process.
Agriengineering 07 00218 g013
Figure 14. Actual adsorption test results of maize seeds. A full factorial experiment was conducted with suction hole shape, seed shape, and vacuum pressure as the test factors. (al) show the adsorption force variation curves for different maize seed adsorption postures.
Agriengineering 07 00218 g014aAgriengineering 07 00218 g014b
Table 1. Characteristics and code of test objects.
Test ObjectPictureFeature SizeValue/mmDesignation
Dent-like kernelAgriengineering 07 00218 i001h × w × t12.61 × 8.68 × 3.84CT
Conical-like kernelAgriengineering 07 00218 i002h × w × t11.63 × 6.74 × 5.61CC
Spherical-like kernelAgriengineering 07 00218 i003h × w × t9.98 × 8.45 × 8.39CB
Tetragonal prism particles
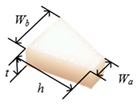
Agriengineering 07 00218 i004wa × wb × h × t3 × 8 × 10 × 4SQ
Spherical particlesAgriengineering 07 00218 i005R6/8/10SS
Note: h is the particle length; w is the seed width; t is the particle thickness; wa and wb are the top width and bottom width of the particles, respectively; R is the particle diameter. In the following text, for the convenience of description, the test subjects are represented by designation.
Table 2. Suction hole shapes and codes.
GraphicalAgriengineering 07 00218 i006Agriengineering 07 00218 i007Agriengineering 07 00218 i008
FeaturesCircular suctionPositive trilateral suction(a)Square suction(a)
DesignationP-RP-T(a)P-S(a)
GraphicalAgriengineering 07 00218 i009Agriengineering 07 00218 i010Agriengineering 07 00218 i011
FeaturesLong narrow suctionPositive trilateral suction(b)Square suction(b)
DesignationP-NP-T(b)P-S(b)
Table 3. Standard particle test design scheme.
Test NumberTest ObjectSuction ShapeVacuum/kPa
Experiment 1SQP-R, P-T(a), P-S(a), P-N3, 6, 9
Experiment 2SS-8P-R, P-T(b), P-S(b)3, 6, 9
Experiment 3SS-6, SS-8, SS-10P-R, P-N6
Note: The test subjects are shown in Table 1; SQ represents tetragonal prism particles and SS represents spherical particles, such as SS-6 indicates a sphere with a particle diameter of 6 mm. The meanings of the suction hole shape codes are shown in Table 2.
Table 4. Simulation test design scheme.
Test NumberTest ObjectSuction ShapeVacuum/kPaDistance/mm
Simulation 1SQP-R, P-T(a), P-S(a), P-N60.1
Simulation 2SS-8P-R, P-T(b), P-S(b)60.1
Simulation 3SS-6, SS-8, SS-10P-R, P-N60.1, 0.4, 0.8
Note: The test subjects are shown in Table 1; SQ represents tetragonal prism particles and SS represents spherical particles, such as SS-6 indicates a sphere with a particle diameter of 6 mm. The meanings of the suction hole shape codes are shown in Table 2.
Table 5. Simulation Test Set Parameters.
ObjectParameters
Fluid density ρg (kg/m3)1.225
Dynamic viscosity μg (kg/m/s)1.789 × 10−5
Atmospheric pressure P0 (Pa)101.325
Pressure inlet (Pa)−6000
Pressure outlet (Pa)0
Table 6. Full factorial design table for maize seed adsorption tests.
FactorsSuction Hole ShapeParticle Shape—Adsorption PostureVacuum
Level
1P-RCT-HA3 kPa
2P-T(a)CT-LA6 kPa
3P-S(a)CT-VA9 kPa
4P-NCC-HA/
5/CC-VA/
6/CB-HA/
7/CB-VA/
Note: The meanings of the suction hole shape codes are shown in Table 2. The meanings of the particle shape—adsorption posture code are shown in Figure 6. For example, CT-HA indicates horizontal adsorption of dent-like kernel, and CC-VA indicates vertical adsorption of conical-like kernel.
Table 7. Theoretical estimates of experiment 2.
Suction Hole ShapeP-RP-T(b)P-S(b)Standard Deviation
Force
Maximum suction force /N0.12020.13840.12950.0091
FS (N)0.11780.19490.150.0387
The relative error of FS /%240.8215.83/
FD (N)0.10020.12230.10730.0113
The relative error of FD /%16.6411.6317.14/
Note: P-R, P-T(b) and P-S(b), respectively, represent circular suction holes, triangular suction holes and square suction holes.
Table 8. P-R theoretical estimates of experiment 3.
Particle TypeSS-6SS-8SS-10
Force
FS (N)0.11780.11780.1178
FD (N)0.04930.10020.1714
Note: SS-6, SS-8 and SS-10, respectively, represent spherical particles with diameters of 6, 8 and 10 mm.
Table 9. Grouping of similar adsorption results.
GroupParticle Shape—Adsorption Posture
Group1CT-HA, SQ-HA
Group2CT-LA, CC-HA, CB-HA
Group3CT-VA, CC-VA, CB-VA
Note: Particle shape code indication Table 1; adsorption posture code indication Figure 6.
Disclaimer/Publisher’s Note: The statements, opinions and data contained in all publications are solely those of the individual author(s) and contributor(s) and not of MDPI and/or the editor(s). MDPI and/or the editor(s) disclaim responsibility for any injury to people or property resulting from any ideas, methods, instructions or products referred to in the content.

