Article

Geometric Characteristics of Dripper Labyrinths and Accumulation of Solid Particles: Simulation and Experimentation

by
Gustavo Lopes Muniz
1,*,
Antonio Pires de Camargo
1,
Nassim Ait-Mouheb
2 and
Nicolás Duarte Cano
3
1
Agricultural Engineering College, Universidade Estadual de Campinas, Campinas 13083-970, SP, Brazil
2
French National Research Institute for Agriculture, Food and Environment—INRAE—UMR G-EAU, University of Montpellier, 361 Rue Jean Francois Breton, 34090 Montpellier, France
3
Facultad de Ciencias Agrarias, Universidad Nacional de Colombia, Bogota 111321, Colombia
*
Author to whom correspondence should be addressed.
AgriEngineering 2025, 7(7), 217; https://doi.org/10.3390/agriengineering7070217
Submission received: 21 May 2025 / Revised: 13 June 2025 / Accepted: 26 June 2025 / Published: 3 July 2025
(This article belongs to the Section Agricultural Irrigation Systems)

Abstract

Emitter clogging in drip irrigation systems is a recurring issue, affecting water application uniformity and system lifespan. This study investigated the anti-clogging performance of emitters and the accumulation patterns of solid particles in dripper labyrinths with varied geometric configurations, combining laboratory experimentation and computational fluid dynamics simulations. Fifteen labyrinth models were tested, divided into two groups: (Model A) emitters with well-defined vortexes and (Model B) emitters with uniform flow. The tests were conducted with solid particle concentrations of 125 and 500 mg L−1 over 200 h of operation. The results showed that none of the emitters became clogged, even under severe particle concentration conditions. However, distinct deposition patterns were observed. Emitters with vortex formation accumulated particles in low-velocity zones, especially in the first baffles of the labyrinth. In contrast, emitters with uniform flow minimized sediment buildup, maintaining high velocities throughout the channel section. Simulations confirmed that the relationship between labyrinth geometry and flow velocity directly influences particle deposition. Dripper design strategies aimed at reducing low-velocity zones in the channel could help mitigate clogging risks. The findings of this study provide valuable guidelines for developing more clogging-resistant emitters, contributing to the improvement of drip irrigation systems.

Graphical Abstract

1. Introduction

Irrigation systems play an important role in agricultural production and are indispensable for food production, particularly in regions with low rainfall and irregular precipitation. Due to the high demand for water resources, pressurized irrigation systems have been increasingly used as a replacement for flood irrigation systems [1,2].
Among the various pressurized irrigation systems, drip irrigation stands out for its efficiency and specific benefits, such as water and nutrient use efficiency, the possibility of fertigation, adaptability to different terrains with varied topographies and crops, and the application of wastewater without it coming into contact with the aerial part of the crop, among others [3,4].
However, in drip irrigation systems, emitter clogging has often been reported as a drawback and one of the main recurring problems in this system, leading to reduced water distribution uniformity, decreased service life of the irrigation system, and negative impacts on crop yield and development [5,6,7].
The clogging of emitters is mainly influenced by irrigation water quality and the flow characteristics within the labyrinth, which result from the channel geometry [8,9]. It can also occur due to a lack of maintenance or inadequate sizing of system components. Regarding water quality, clogging occurs as a result of physical, biological, and chemical agents present in the irrigation water [10,11].
Clogging caused by physical agents is frequently reported in the literature [12,13] and can occur either independently or in combination with chemical and biological agents. This type of clogging is caused by solid particles suspended in the water that are not retained by the filtration systems or the pre-filter of the emitters.
Particles smaller than 125 μm tend to pass through the filtration systems commonly used in localized irrigation systems (120 mesh) [14]. These particles can aggregate and block the water flow within the emitter labyrinth [15,16,17].
Recent research has observed patterns of clogging or sediment accumulation within emitter labyrinths [5,18,19,20]. Such observations serve as diagnostics of how clogging occurs within labyrinths and can be useful for improving the geometric characteristics of emitters.
Understanding how particle deposition patterns in emitter labyrinths are influenced by flow regimes and geometric configurations is essential for the development of clog-resistant designs. Computational Fluid Dynamics (CFD) simulations offer a powerful tool for analyzing internal flow behavior and linking it to the spatial distribution of particle accumulation [21]. In this study, we aim to evaluate the anti-clogging performance of emitters operating with water containing fine solid particles and to investigate how particle deposition patterns vary across labyrinths with different geometric designs. These patterns are then correlated with the simulated velocity fields and streamlines that develop within the flow paths. To achieve this, CFD modeling was integrated with controlled-scale laboratory experiments to validate the simulated flow characteristics and to identify critical regions prone to particle accumulation.

2. Materials and Methods

The experiments were conducted at the Hydraulics and Irrigation Laboratory of the School of Agricultural Engineering, UNICAMP, Campinas-SP, Brazil. The experimental tests were conducted in a laboratory using a bench setup that formed a hydraulically closed circuit.

2.1. Labyrinth Prototypes

Fifteen dripper labyrinth prototypes with various geometric configurations were evaluated simultaneously. These prototypes were designed and constructed in a previous study [22] and were manufactured using acrylic plates, featuring characteristics similar to commercial labyrinths.
To facilitate comparison among emitters with different geometries, all emitters were designed to operate with a flow rate in the range of 1.4 to 1.6 L h−1 under a pressure of 100 kPa. The design flow rate was determined based on an estimate of the number of baffles (N) in each prototype and, consequently, the total labyrinth length (L).
From Equation (1), which expresses the total pressure drop (ΔP) between the inlet and outlet of the labyrinth [23], and considering that φ is the head loss coefficient per baffle (Equation (1))—dependent on the Reynolds number; channel structure; and wall roughness—it can be concluded that higher values of φ indicate flow characteristics associated with greater pressure loss. This, in turn, allows for the design of more compact emitters with reduced labyrinth length [22].
Δ p = N f   l D h + ζ     ρ   Q 2 2   A 2
φ = f   l D h + ζ
where: Δ p is the total pressure loss in the labyrinth (Pa), N is the number of baffles, f is the Darcy–Weisbach friction factor, l is the length of the straight section of a baffle (m), D h is the hydraulic diameter (m), ζ is the local head loss coefficient per baffle, ρ is the fluid density (kg m−3), Q is the channel flow rate (m3 s−1), A is the cross-sectional flow area (m2), and φ is the total pressure loss coefficient per baffle.
By substituting Equation (1) into Equation (2) and rearranging the terms, Equation (3) is obtained [23,24]:
φ =   2   A 2   Δ p N   ρ   Q 2
By rearranging Equation (3), Equation (4) is obtained, which was used to estimate the number of baffles for a given prototype model and, consequently, the length of its labyrinth for a given flow rate, pressure, and flow cross-sectional area [22].
N =   2   A 2   Δ p φ   ρ   Q 2
The number of baffles required for each emitter prototype to achieve the target flow rate (1.4–1.6 L h−1) was determined through numerical simulations using the standard k-ε turbulence model available in the computational fluid dynamics software COMSOL Multiphysics version 5.6.
The labyrinths were made from transparent material, enabling filming and observation of the processes of sediment deposition, transport, and accumulation inside the labyrinth. All prototypes evaluated were flat, non-compensated, and had rectangular or square flow cross-sections, with trapezoidal-shaped labyrinths designed to operate at flow rates ranging from 1.4 to 1.6 L h−1 under a pressure of 100 kPa.
The dripper labyrinths were designed following two design strategies. In the first strategy, the aim was to design labyrinths that promote the formation of well-defined vortex zones, with varying intensities, during water flow through the channel. These emitters were classified as Model A prototypes, and nine labyrinth models of this category were studied.
In the second design strategy, the objective was to develop emitters that minimize the formation of vortex zones during flow, thereby reducing the extent of low-velocity regions that are more susceptible to clogging. These prototypes feature labyrinths that provide uniform flow throughout the channel section, with six labyrinth geometries exhibiting this characteristic. These emitters were classified as model B prototypes.
Table 1 shows the geometric characteristics of the labyrinth prototypes. The criteria applied to calculate the number of baffles and the length of each labyrinth were defined based on the head loss coefficient of each emitter in order to obtain the design flow rate. Details of the labyrinth design and construction stage can be obtained in Lavanholi et al. (2020) [22].

2.2. Experimental Setup

Polypropylene supports (Figure 1) were designed to couple the labyrinth prototypes and simulate real operating conditions of a dripper, as well as to allow image capture of the labyrinth’s interior. Each support had a central cavity of 2 mm to fit the labyrinth prototype and a main channel with a diameter of 10 mm, inclined at a 2% slope to direct the water flow to the outlet, where the flow rate was measured. To prevent leakage between the support and the acrylic plate, a 2 mm thick rubberized silicone piece was placed, and an aluminum foil sheet was added between the support and the acrylic plate to enhance image contrast and facilitate visualization of the labyrinth. The channel was covered with a translucent glass plate. The supports were interconnected using brass fittings sealed with O-rings, simulating a lateral line.

2.3. Test Conditions

In an aluminum reservoir with a capacity of 140 L, deionized water from a reverse osmosis system and solid particles were added at concentrations of 125 mg L−1 and 500 mg L−1. The lower concentration already represents a severe risk of clogging [26], while the 500 mg L−1 concentration aimed to subject the dripper to extreme operating conditions [16,27]. The solid particles used in the experiments consisted of a mixture of fine sand, silt, and clay, obtained from a natural soil sample collected from a trench at a depth of approximately three meters to avoid the presence of roots in the sample. Particles with a grain size smaller than 125 μm were used. This granulometric range normally corresponds to the fraction of solid particles that is not retained in the mesh of filters commonly used in microirrigation systems (120 mesh or 125 µm) [14,28].
X-ray diffraction (XRD) was employed to identify the mineral fractions constituting the solid particles. For this, an X’Pert-MPD X-ray diffractometer (Malvern Panalytical Ltd., Malvern, UK) was used with the following settings: KαCu radiation = 1.54 Å (40 kV, 40 mA), θ ranging from 0 to 50°, angular step size of 0.020°, and a counting time of 1 s per step. XRD analysis revealed the following mineral fractions: kaolinite (35.6%), quartz (22.5%), hematite (22.2%), gypsum (19.8%), and goethite (0.5%). Nearly 80% of the particles used were 1:1 type clays, whose surface charges under the pH conditions of the test were predominantly negative, as indicated by the zero-point charge (ZPC) of 6.51 [29].
To characterize the particle size distribution of the soil particles used, seven sieves with mesh openings ranging from 0 to 125 μm were employed. The amount of material retained on each sieve was measured and adjusted to obtain a mixture with a uniform distribution in terms of particle size. The resulting particle size distribution curve is presented in Figure 2.
A mechanical agitator with a stainless-steel shaft and propeller was used to keep the solid particles suspended in the water, preventing oxidation and contamination of the mixture. A stainless-steel rotor and casing pump were used to pump the mixture to a polyethylene tube connected to the main flow line. The flow velocity in the line was approximately 1 m s−1, controlled by a nozzle with an appropriate diameter installed at the end of the line. The pressure at the inlet of the lateral line was maintained at 100 kPa.
The water temperature was kept at 23 °C, and sodium hypochlorite (10%) was added daily to prevent biological interference and maintain a free chlorine residual concentration of 3 mg L−1 in the water [28]. After adding sodium hypochlorite, the water pH was adjusted to 6.0–6.5 using 1 M hydrochloric acid to prevent chemical precipitation and enhance the efficiency of sodium hypochlorite.
To maintain a homogeneous suspension of particles in the reservoir, a mechanical agitator with a stainless-steel shaft and propeller was used. The rotation speed of the propeller was controlled via a frequency inverter and was adjusted to a level sufficient to prevent particle settling while avoiding the formation of surface vortices in the reservoir. The optimal speed was determined based on preliminary tests and confirmed by periodic measurements of total suspended solids (TSS) in the reservoir. Every two days, the total suspended solids (TSS) concentration in the reservoir was controlled and adjusted according to the volume of water replenished in the reservoir when necessary. The analysis was performed following the procedure described in the Standard Methods for the Examination of Water and Wastewater [30].
The tests were conducted in 12 h cycles, with 10 h of operation and 2 h of rest. Each test condition lasted for 20 cycles, totaling 200 h of operation (10 days). Every four cycles, the flow rate of the emitters was measured by determining the mass of water.

2.4. Dripper Performance Assessment

The performance of the dripper prototypes was assessed by evaluating the ratio between the current flow rate and the initial flow rate of each dripper (relative flow rate) and analyzing sediment deposition patterns and accumulation zones within the labyrinth. The behavior of the particles in the labyrinths and the locations of accumulation were analyzed using images of the channels captured with a magnifying glass equipped with a high-resolution camera (XCAM1080PHA Series HDMI) and full HD screen (Suzhou Jingtong Instrument Co., Ltd., Suzhou, China). Images were taken at various points of the labyrinth every 40 h of system operation, on the same days the flow rate was determined.
The relative flow rate was calculated according to Equation (5) [31]:
q r = 100   q i q 0
where: qr is the ratio between the current flow rate and the initial flow rate of the emitter (%), qi is the current flow rate of the emitter (L h−1), and q0 is the initial flow rate of the emitter (L h−1), operating with clean water.

2.5. CFD Simulations

The flow velocity fields and the distribution of streamlines in the emitter labyrinth were determined using CFD (COMSOL Multiphysics V.5.6). The flow simulations were carried out under steady-state conditions, considering an incompressible Newtonian fluid. The standard k–ε turbulence model was selected due to its well-documented performance in internal flow simulations involving narrow channels with repeated obstacles, such as labyrinth-type emitters. This model is widely used in irrigation engineering for evaluating mean flow structures and identifying zones prone to particle deposition. Steady-state modeling was chosen to enable the comparison of hydrodynamic behavior across a large number of geometries, ensuring computational feasibility while capturing key velocity features associated with emitter performance. This approach has also been successfully applied in similar studies reported in the literature [22,32].
The standard k–ε model was applied to solve the turbulent flow, while log-law wall functions were used to estimate the velocity profile of the flow in the boundary layer [9,33]. As boundary conditions, an inlet pressure equivalent to the flow pressure in the line, set at 100 kPa, was adopted, while the outlet velocity was determined from the continuity equation, which relates the flow rate and the flow area of each model. The mesh quality was evaluated based on the minimum and average element quality (asymmetry). Mesh sizes available in the software were compared (i.e., Coarse, Normal, Fine, and Finer). A mesh independence analysis was performed to validate the simulations. Velocity profiles were plotted at the first and fifth baffles of the labyrinth to demonstrate that the results were mesh independent (Figure 3).
Velocity profiles for prototypes B1 and A7 at the regions corresponding to the first and fifth baffles are shown in Figure 2, based on simulations performed with four different mesh refinement levels. At the first baffle, where hydrodynamic conditions are less stabilized, only minor variations were observed between the results obtained using the “Fine” and “Finer” meshes. Therefore, the “Finer” mesh was selected as representative, as it provided a suitable balance between accuracy and computational cost for the objectives of this study.

3. Results and Discussion

3.1. Dripper Performance

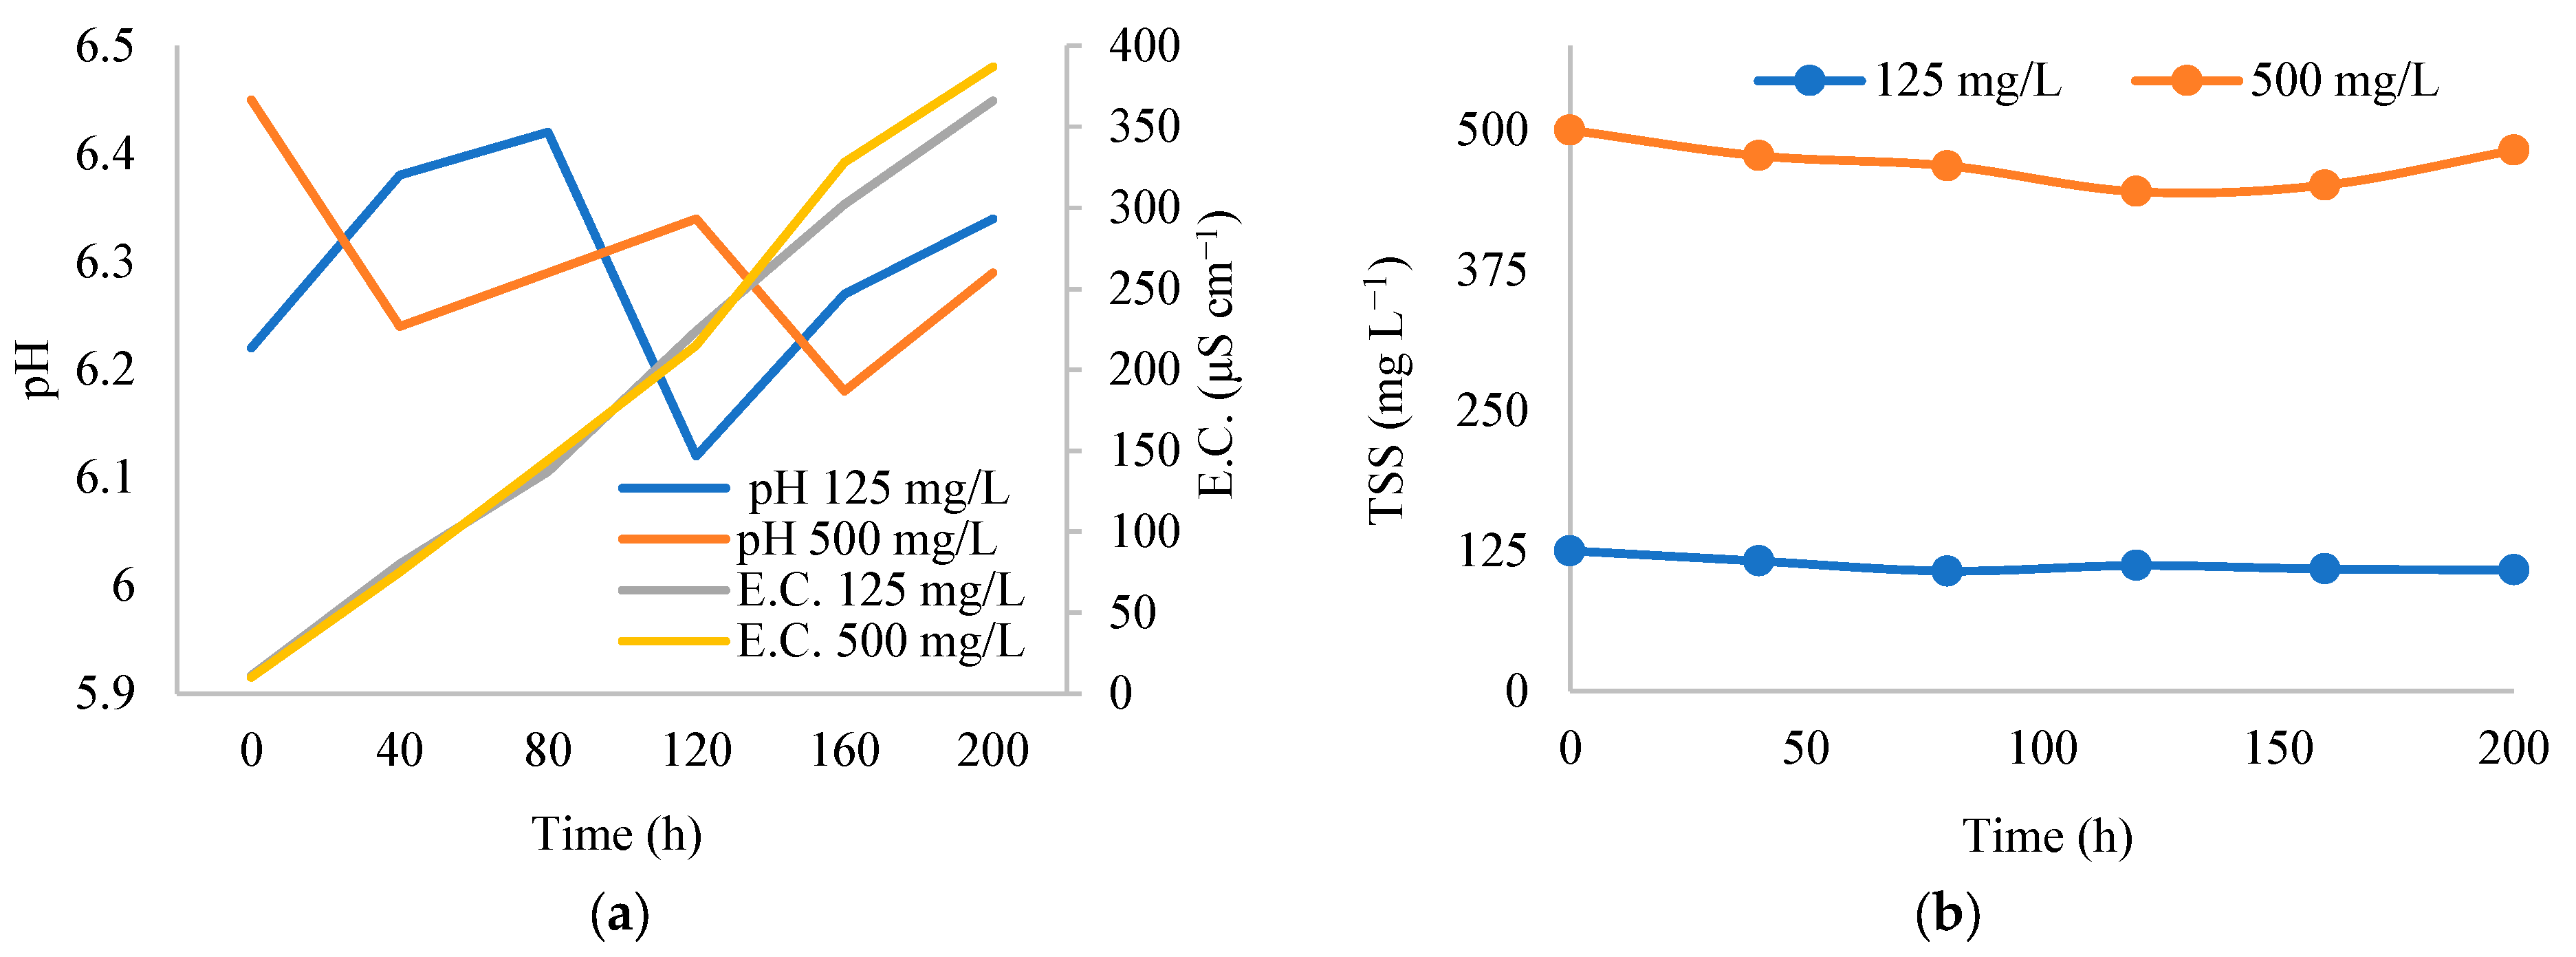
The chemical parameters of the water that most influence the physical clogging processes of drippers were monitored during the tests. Figure 4 illustrates the variation in pH, electrical conductivity (EC), and total suspended solids (TSS) concentration in the water during the tests conducted to evaluate the sensitivity of the emitters to clogging. In Figure 3a, it can be observed that the maximum and minimum pH values were 6.45 and 6.12, respectively, remaining within the expected range. pH values within this range are desirable in clogging tests involving only solid particles, as they not only inhibit the formation of potential chemical scales but also enhance the efficiency of sodium hypochlorite as a sanitizing agent. This prevents interference from chemical and biological agents that could contribute to emitter clogging. Additionally, Figure 4a shows a gradual increase in water EC over time. This increase can be attributed to the chlorination routines used in the system. The application of chlorine in the form of sodium hypochlorite (NaClO) contributes to the formation of additional ions in the water, such as chloride (Cl) and sodium (Na+). Moreover, potential reactions between chlorine and organic matter or other compounds in the water may generate by-products that further increase the total dissolved solids concentration. The increase in total dissolved solids leads to a corresponding rise in EC, given that EC is directly proportional to the concentration of dissolved ions in the solution [35].
Figure 4b presents the variation in TSS concentration in the water. In the tests with 125 mg L−1, the minimum observed solid particle concentration was 107 mg L−1, indicating that throughout the experiments, TSS values remained above 100 mg L−1, representing a severe clogging risk condition, according to the classification proposed by Nakayama & Bucks (1981) [36]. In the tests with 500 mg L−1 of solid particles, the minimum observed TSS value was 452 mg L−1, reflecting that the emitters were operating under extreme clogging risk conditions. The decrease of about 11% in TSS concentration in the water compared to the beginning of the tests can be explained by particle accumulation within the labyrinth flow cell and other components of the hydraulic system. Solid particle replenishment in the water was performed whenever necessary to maintain the targeted particle concentrations.
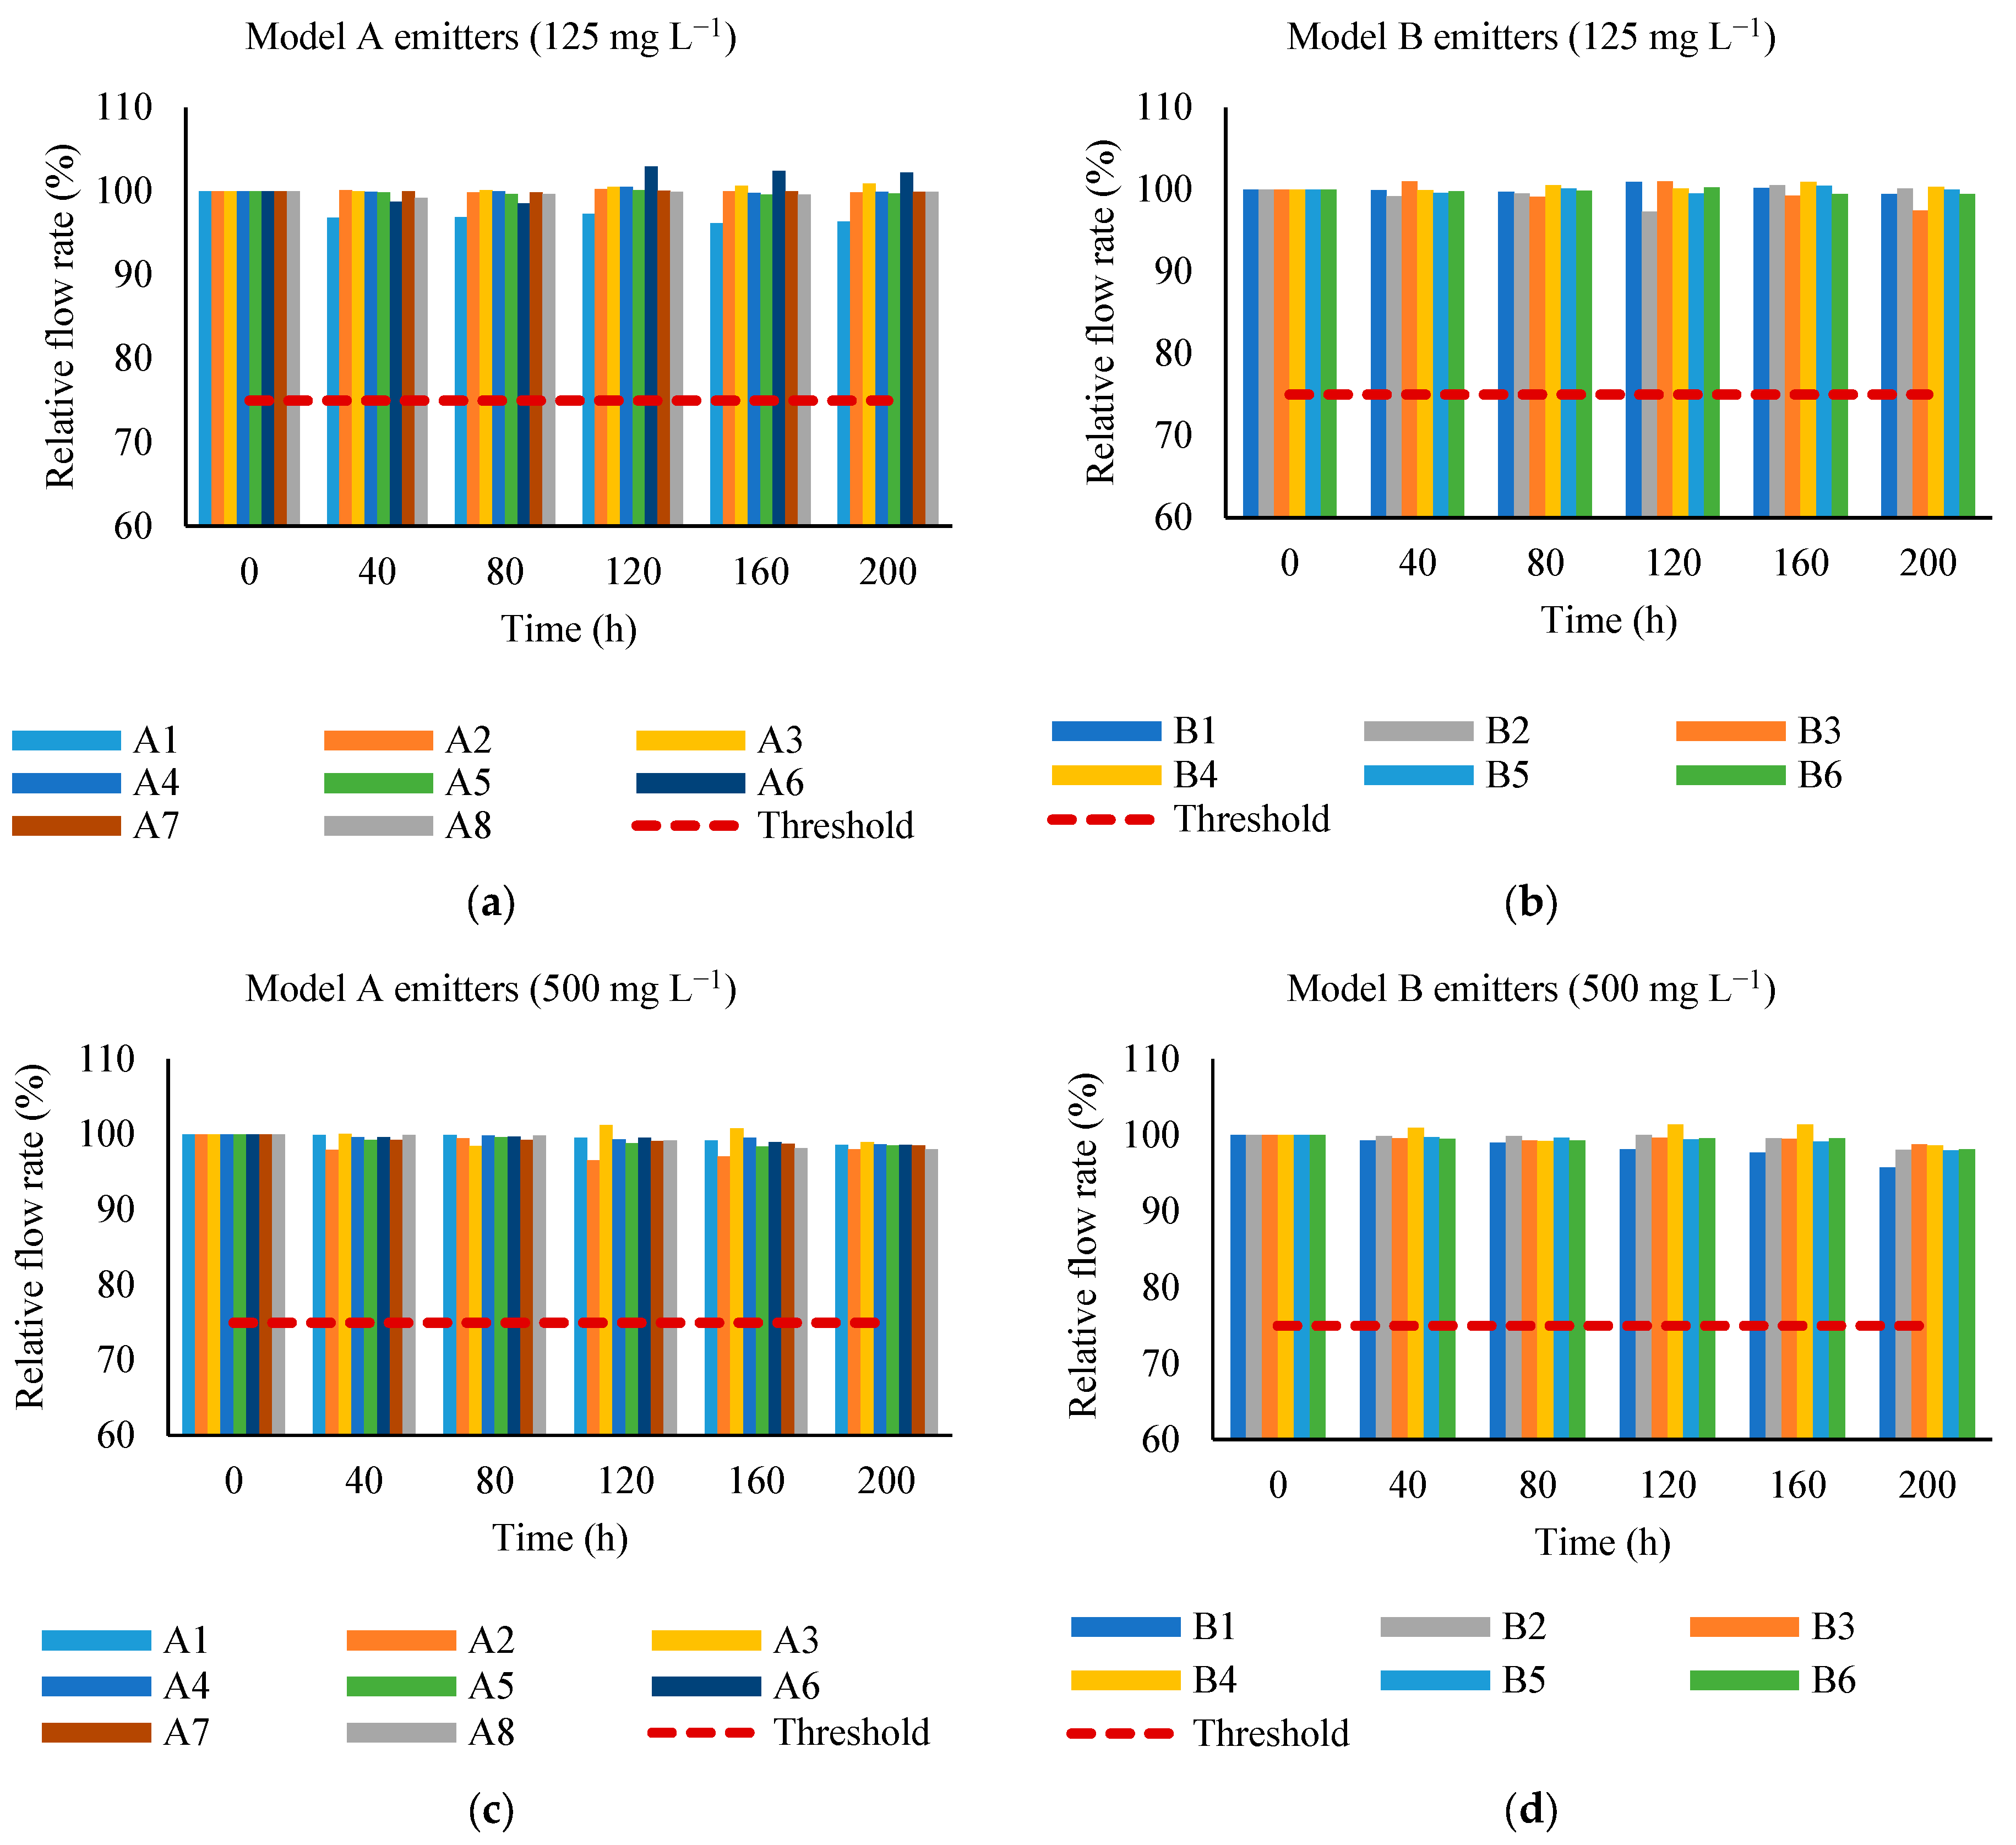
The relative flow rate of the emitters throughout the experiments is shown in Figure 5. As a clogging criterion, different studies on the anti-clogging performance of emitters have considered a model to be clogged when it exhibits a ±25% variation in flow rate compared to the initial flow rate [25,37,38].
The relative flow rate was minimally affected, and consequently, none of the prototypes became clogged by the end of the 200 h test, regardless of the concentration of solid particles in the water (Figure 5). Model A1 showed greater sensitivity compared to the others at a concentration of 125 mg L−1 of solid particles, exhibiting a relative flow rate of 96% after 200 h of testing. Model A1 has the smallest flow section area and the lowest H/W ratio, which may have favored the accumulation of sediments. Similar results were observed by Muniz et al. (2022) [25] when evaluating the performance of this same prototype operating with calcareous water.
Some emitter models, such as model A3 (Figure 5c) and model A6 (Figure 5a), exhibited a relative flow rate greater than 100% in some measurements. This behavior is not indicative of measurement error or leakage but rather a consequence of the internal hydrodynamics of these geometries. As particles accumulated within vortex regions, the size and intensity of the vortices were progressively reduced. Since vortices act as mechanisms for pressure energy dissipation, their attenuation led to a decrease in local head losses across the baffles. As a result, the overall pressure drop in the emitter decreased, and the flow rate increased accordingly. This effect was especially notable in emitter models that initially presented strong vortex structures [39,40]. The maximum flow rate reduction observed was 4.3% for emitter model B1 under the condition of 500 mg L−1 of solid particles. However, the final relative flow rate remained well above the critical threshold that characterizes clogging, according to the adopted criterion (relative flow rate < 75%). Therefore, this flow rate reduction was not sufficient to classify this emitter as clogged.
The results indicate that particles smaller than 125 µm, acting alone, do not present a significant clogging risk for the emitters, regardless of their concentration. Although the literature [26] suggests that water with suspended solids concentrations above 100 mg L−1 poses a severe clogging risk for emitters, the results observed here demonstrate that the risk of clogging may be more associated with particle size than with concentration. However, it is important to highlight that in field conditions, where emitters are exposed to different clogging agents, particle concentration could be a critical factor due to potential interactions with other clogging agents.
Similar results have also been reported in the literature [16,27,41]. Wang et al. (2022) [27] also observed that emitters with larger internal channels (e.g., model E1) showed low sensitivity to clogging by fine particles (<75 µm), especially under lower sediment concentrations. The clogging process was slower and more uniform when small particles were used, with a lower likelihood of complete clogging. Oliveira et al. (2017) [41], studying clogging processes caused by clay particles smaller than 3 µm at concentrations up to 2000 mg L−1, found that isolated clay particles did not present a significant potential for clogging emitters. Similarly, Ait-Mouheb et al. (2019) [42] observed that Na-bentonite particles smaller than <2 µm did not settle along the channel, being transported by the high-speed main flow. These findings reinforce the conclusions of this study regarding the role of particle concentration and size in clogging mechanisms.
As a practical reference, the filtration mesh opening in drip irrigation systems should be 1/10 of the smallest flow section dimension in the labyrinth [14,43]. Larger particles may bypass the filtration system due to their irregular shapes and reach the emitters, leading to water flow interruption. When evaluating the influence of labyrinth geometric parameters on clogging resistance, Li et al. (2006) [44] observed that most particles causing emitter clogging could have been prevented from entering the irrigation system if a filtration mesh with an opening of 1/10 of the channel width had been used.
Although the technical standard recommends that the filter mesh opening should be, at most, equivalent to 1/10 of the smallest dimension of the labyrinth flow section, in this study, filtration was intentionally not applied to the test water. This methodological choice aimed to expose the emitters to severe clogging risk conditions, with the presence of fine particles (<125 μm) that typically pass through 120 mesh filters. This approach allowed for a more critical assessment of the anti-clogging performance of the different labyrinth prototypes, even under more adverse scenarios than those typically encountered in standard operating conditions.
Regarding the labyrinth’s geometric parameters, no definitive conclusions could be drawn about their influence on the anti-clogging performance of the emitters, since none of the studied models became clogged or experienced a significant reduction in relative flow rate. However, trends in deposition patterns were observed, as will be discussed.

3.2. CFD Results and Deposition Patterns

In order to evaluate the flow characteristics inside the labyrinths, simulations using CFD were performed, where the streamlines and velocity fields in the labyrinths were obtained. Figure 6 presents the flow simulation results for Model A emitters.
The analysis of the velocity fields and streamlines presented in Figure 6 enabled a more comprehensive evaluation of the geometric effects on the flow regime across different prototypes. It was observed that emitters with a higher H/W ratio (tooth height to channel width) favored the formation of intense recirculation zones, i.e., vortices of varying magnitudes. These zones correspond to low-velocity regions when compared to the main flow region, which forms at the center of the labyrinth. Conversely, geometries with a lower H/W ratio (Figure 6a,d,g) tend to induce a flow in which the primary flow zone occupies most of the channel, minimizing low-velocity lateral regions. These results support the hypothesis that controlling the geometric profile of the labyrinth can be an effective strategy to minimize low-velocity zones and, consequently, reduce the risk of solid particle deposition.
To assess the relationship between flow characteristics and particle deposition patterns, the simulation results were compared with experimental images showing the deposition patterns of solid particles within the labyrinths. Although nine Model A emitters were evaluated throughout the experiments, the experimental images presented in this section correspond only to a few selected prototypes. The selection was based on the relevance of the observed deposition patterns, which exhibited distinct or particularly illustrative behaviors of particle accumulation mechanisms. This approach aims to make the presentation of results more concise and didactic by avoiding repetition of similar patterns. The experimental images presented correspond to the tenth day, i.e., at the end of the tests, after 200 h of emitter operation.
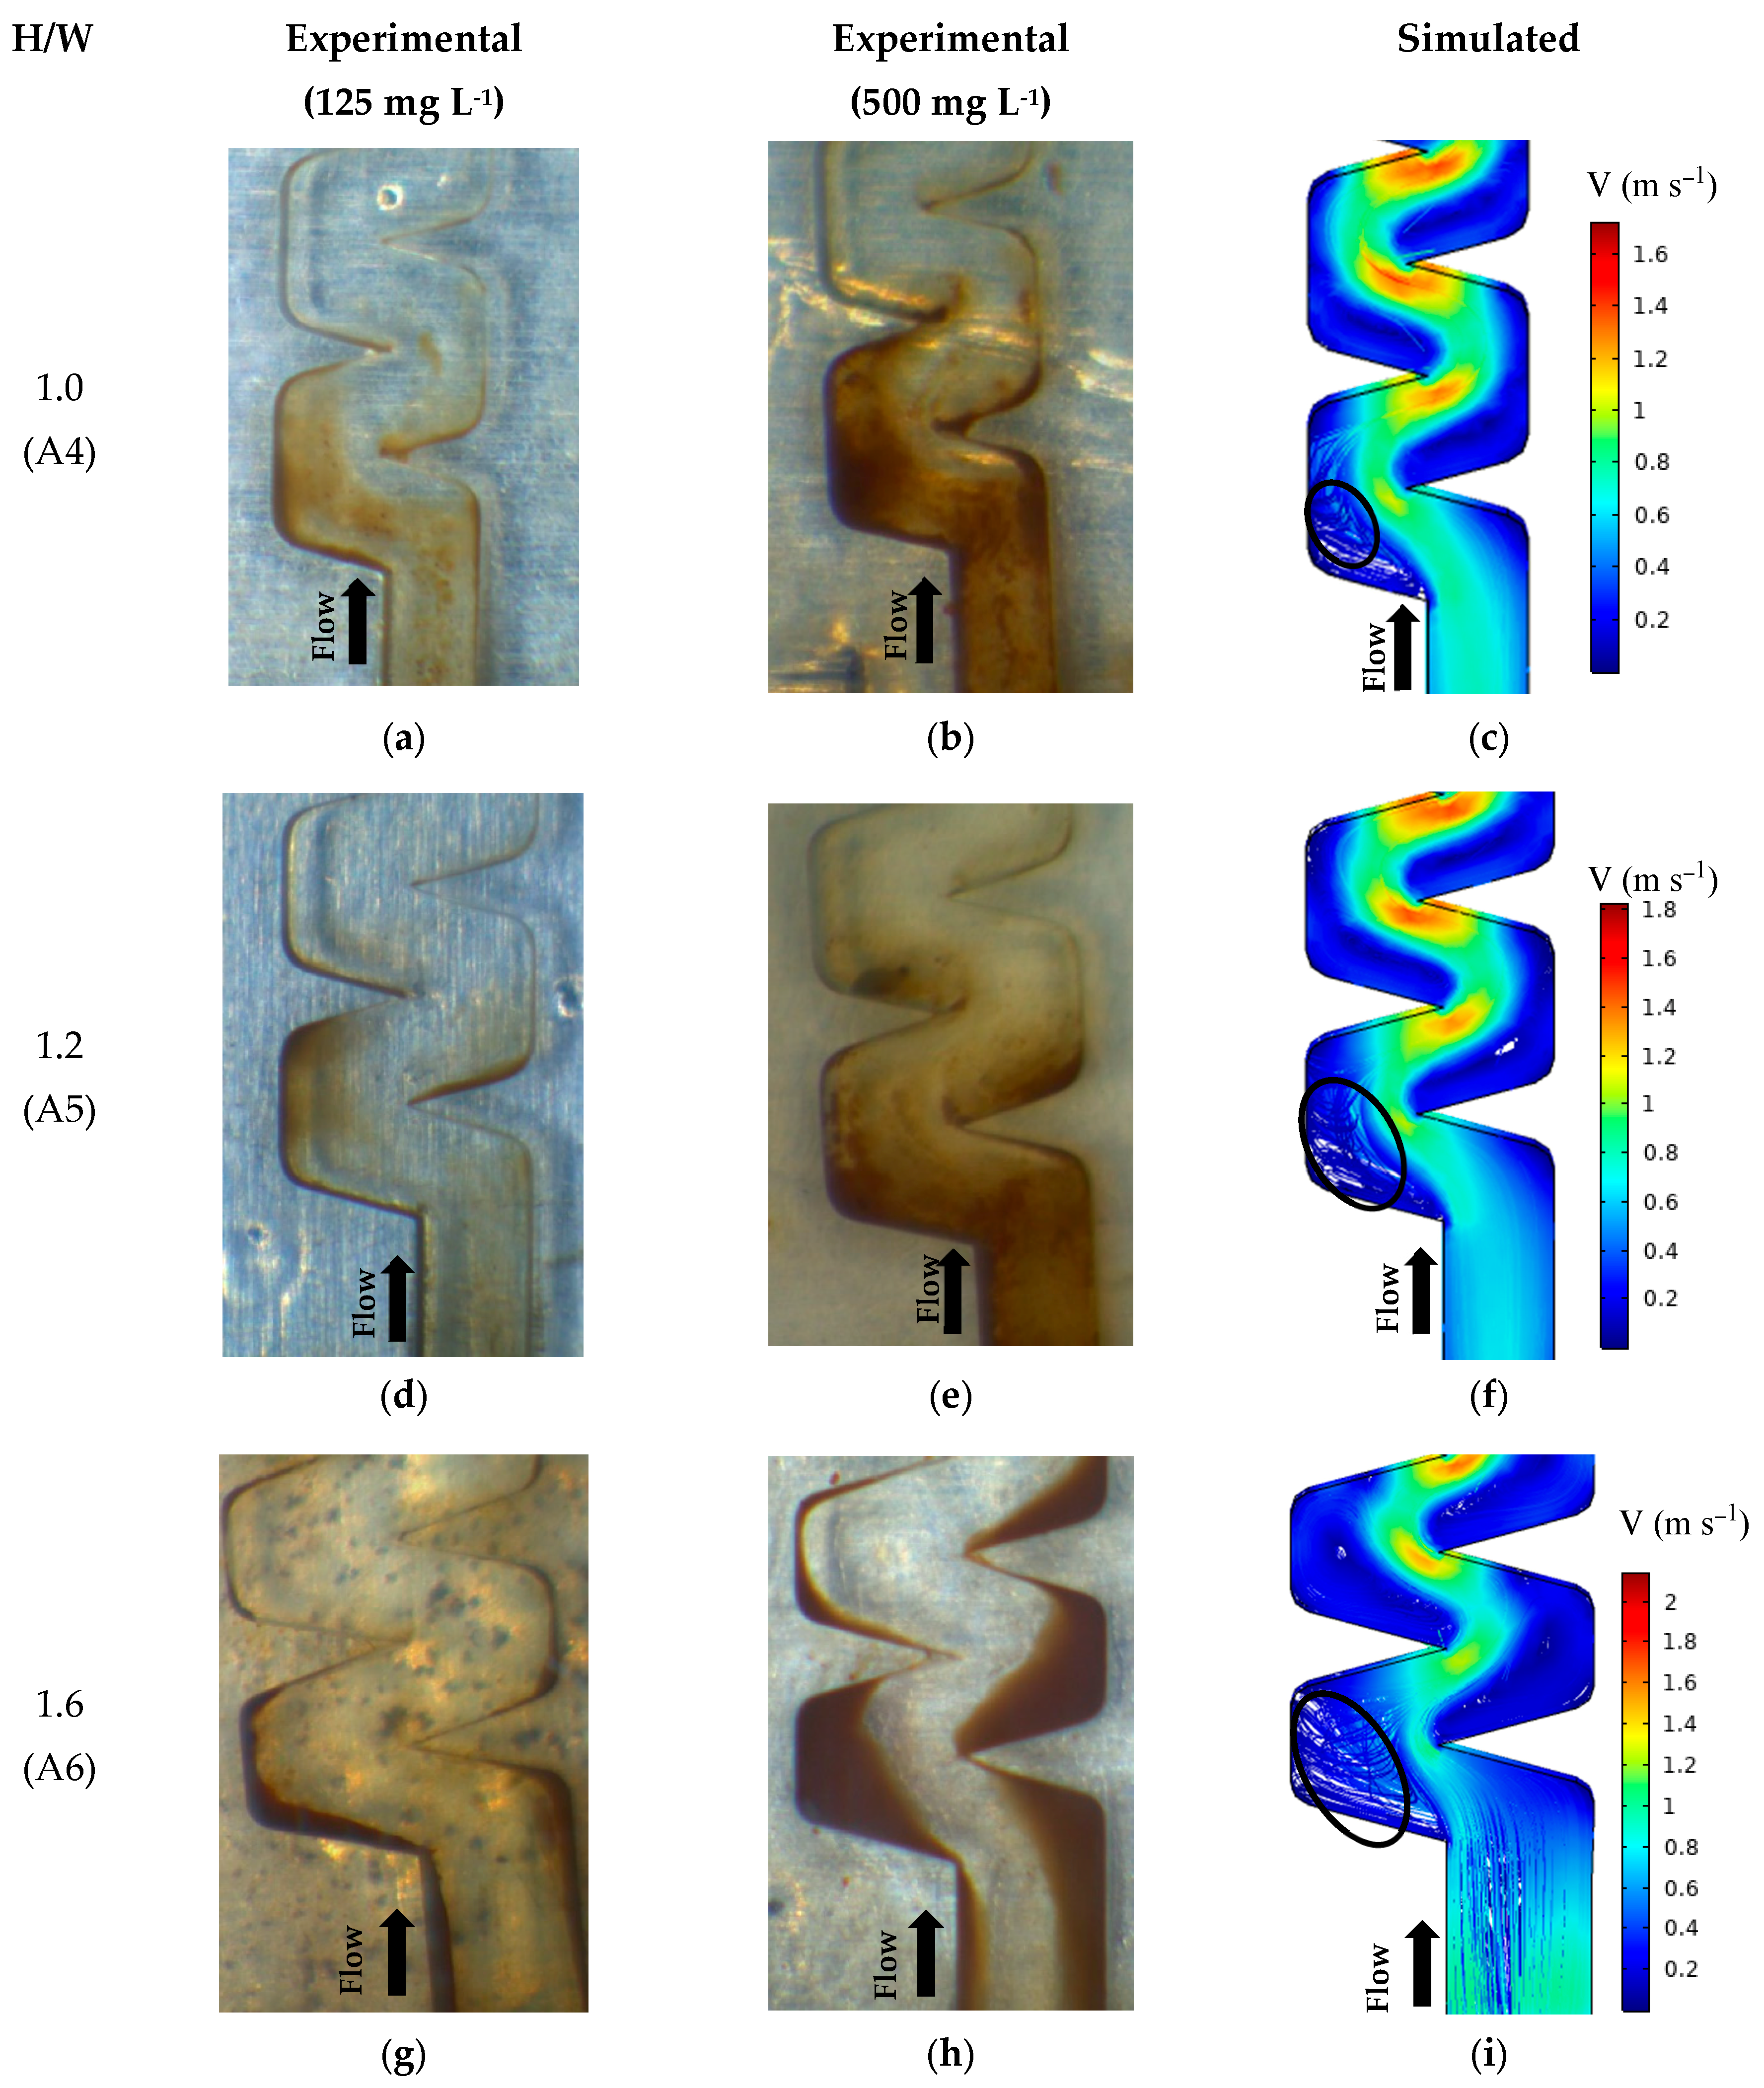
Figure 7 shows the deposition of solid particles in the emitters of model A (A4, A5, and A6). It is noted that deposition mainly occurred on the first baffles, regardless of the geometric parameters of labyrinth, indicating the presence of preferential deposition sites. The increase in particle concentration in the water did not change the deposition sites; however, an increase in the amount of deposited material was observed. Nevertheless, the amount of deposited material was not sufficient to cause a significant change in the relative flow rate of the emitters to classify them as clogged.
Comparing the experimental images with the simulated streamlines (Figure 7c,f,i), it is possible to verify that different areas with distinct flow characteristics form within the same deflector; zones of high and low velocity develop in specific regions of the deflector. Deposition sites coincide with regions where lower flow velocities are recorded. These regions correspond to vortex zones and stagnation zones, which are the peripheral areas near the channel wall. In these zones, the observed flow velocity is lower than 0.8 m s−1 and was not sufficient to carry the particles out of the emitter.
Additionally, a central flow region developed along the emitter, following an S-shaped path typical of labyrinthine geometries. For example, this main flow zone exhibited velocities above 0.8 m s−1 and reached up to 2.0 m s−1 in emitter A6. The observed differences in velocity are directly linked to geometric variations among the labyrinths, particularly the height and angle of the teeth, which influence vortex formation and channel constriction. Higher velocities were consistently found near the upper edge of the channel teeth, where the flow accelerates due to geometric narrowing, and no signs of particle deposition were observed in these regions.
The observed results are in close agreement with studies reported in the literature regarding particle deposition zones. Ait-Mouheb et al. (2019) [42] observed that kaolinite deposition mainly occurred on the first labyrinth deflector, which was associated with low flow velocity and low turbulent kinetic energy due to the change in flow direction at the channel entrance. Zhang et al. (2010) [45] also reported that low turbulence in the first deflector is responsible for particle retention, leading to sedimentation and water flow blockage. Qin et al. (2022) [46] observed that larger sand particles, when entering the vortex region, can be the primary cause of dripper clogging, identifying this region as a critical area in the emitter that should be optimized.
Increasing the H/W ratio—i.e.; increasing the tooth height (H) relative to the channel width (W)—modifies the flow pattern; resulting in larger vortices. This geometric change enhances flow separation and promotes the formation of larger vortex zones downstream of each tooth, as the fluid encounters more abrupt changes in direction and flow area. Consequently, the main flow region becomes narrower and more confined, as a larger portion of the channel is occupied by recirculating areas. This effect can be clearly seen in the velocity fields shown in Figure 7c,f,i.
Apparently, increasing the H/W ratio from 1.0 (Figure 7a,b) to 1.2 (Figure 7d,e) did not significantly impact the deposition of solid particles; however, deposition was considerably more pronounced in the emitter with an H/W ratio of 1.6 (Figure 7g,h). This result can be explained by the enlargement of the vortex formed, as the increase in the H/W ratio resulted in a larger vortex and, consequently, a greater proportion of low-velocity zones compared to emitters with smaller vortices. These low-velocity zones allowed for increased deposition of solid particles, suggesting that increasing the H/W ratio beyond 1.2 may not be advantageous for emitters.
On the other hand, the results suggest that well-developed vortex areas may serve as beneficial structural features in emitter design. These zones function not only as pressure dissipation areas but also as preferential sites for particle deposition, without significantly affecting the emitter’s discharge rate. However, due to the limited duration of the tests (200 h), these findings should be considered preliminary. Over longer operational periods, the continuous accumulation of particles in these zones may impair emitter performance. Ideally, the hydraulic design should ensure that particles deposited in vortex regions are eventually transported out by the flow.
In this context, the role of the main flow zone becomes even more critical. Despite the intense particle deposition observed in the vortex regions of model A6 (Figure 7g,h), a well-defined central flow path—corresponding to the highest velocity region (Figure 7i)—remained free of deposits. This high-velocity core was crucial in preserving the emitter’s discharge rate throughout the test period.
Some labyrinth optimization studies suggest eliminating low-velocity regions and rounding corner areas so that the flow itself can wash the walls and remove any deposited particles [40,47,48]. In another study optimizing the labyrinth channel [46], the authors proposed eliminating labyrinth corner zones by smoothing them and expanding the main flow zone. Simulated and experimental results showed a 60% increase in the emitter’s anti-clogging performance when operating with sand particles, as the expansion of the main flow zone allowed the flow velocity to increase to 5 m s−1 [46].
The flow simulation results in the labyrinths of Model B emitters are shown in Figure 8. In the Model B emitters, the simulation results indicated a predominantly uniform flow throughout the entire channel, with no recirculation regions or well-defined vortices observed (Figure 8). This behavior was favored by the more linear geometries and smoother tooth angles, which reduced abrupt changes in flow direction and minimized boundary layer separation. As a result, a central flow zone was formed with velocities generally exceeding 1.2 m s−1, without interruptions or significant low-velocity zones along the sidewalls. The results also show that increasing the tooth angle led to a flow with more heterogeneous characteristics over the baffle, resulting in the formation of mild low-velocity areas on the baffle surface, although not sufficient to be classified as a recirculation region. In contrast, emitters with smaller angles (45°) produced a more uniform and high-velocity flow occupying the entire cross-section, which may be advantageous for particle transport.
In order to identify flow characteristics that could be correlated with the particle deposition patterns in Model B emitters, the simulation results were compared with experimental images of the labyrinths showing solid particle deposition. Similar to what was carried out for Model A emitters, although six geometries of Model B were studied, images of only three representative geometries are presented. This selection was made based on the observed variation in deflector angle and flow cross-sectional area, which were the most influential parameters affecting the internal hydrodynamics. The selected prototypes adequately represent the range of behaviors found in the simulations, including variations in velocity distribution and potential zones of particle accumulation. This approach was adopted to maintain a clear and didactic presentation of the results, avoiding redundancy and allowing for a more focused discussion on the relevant hydrodynamic mechanisms associated with clogging risk.
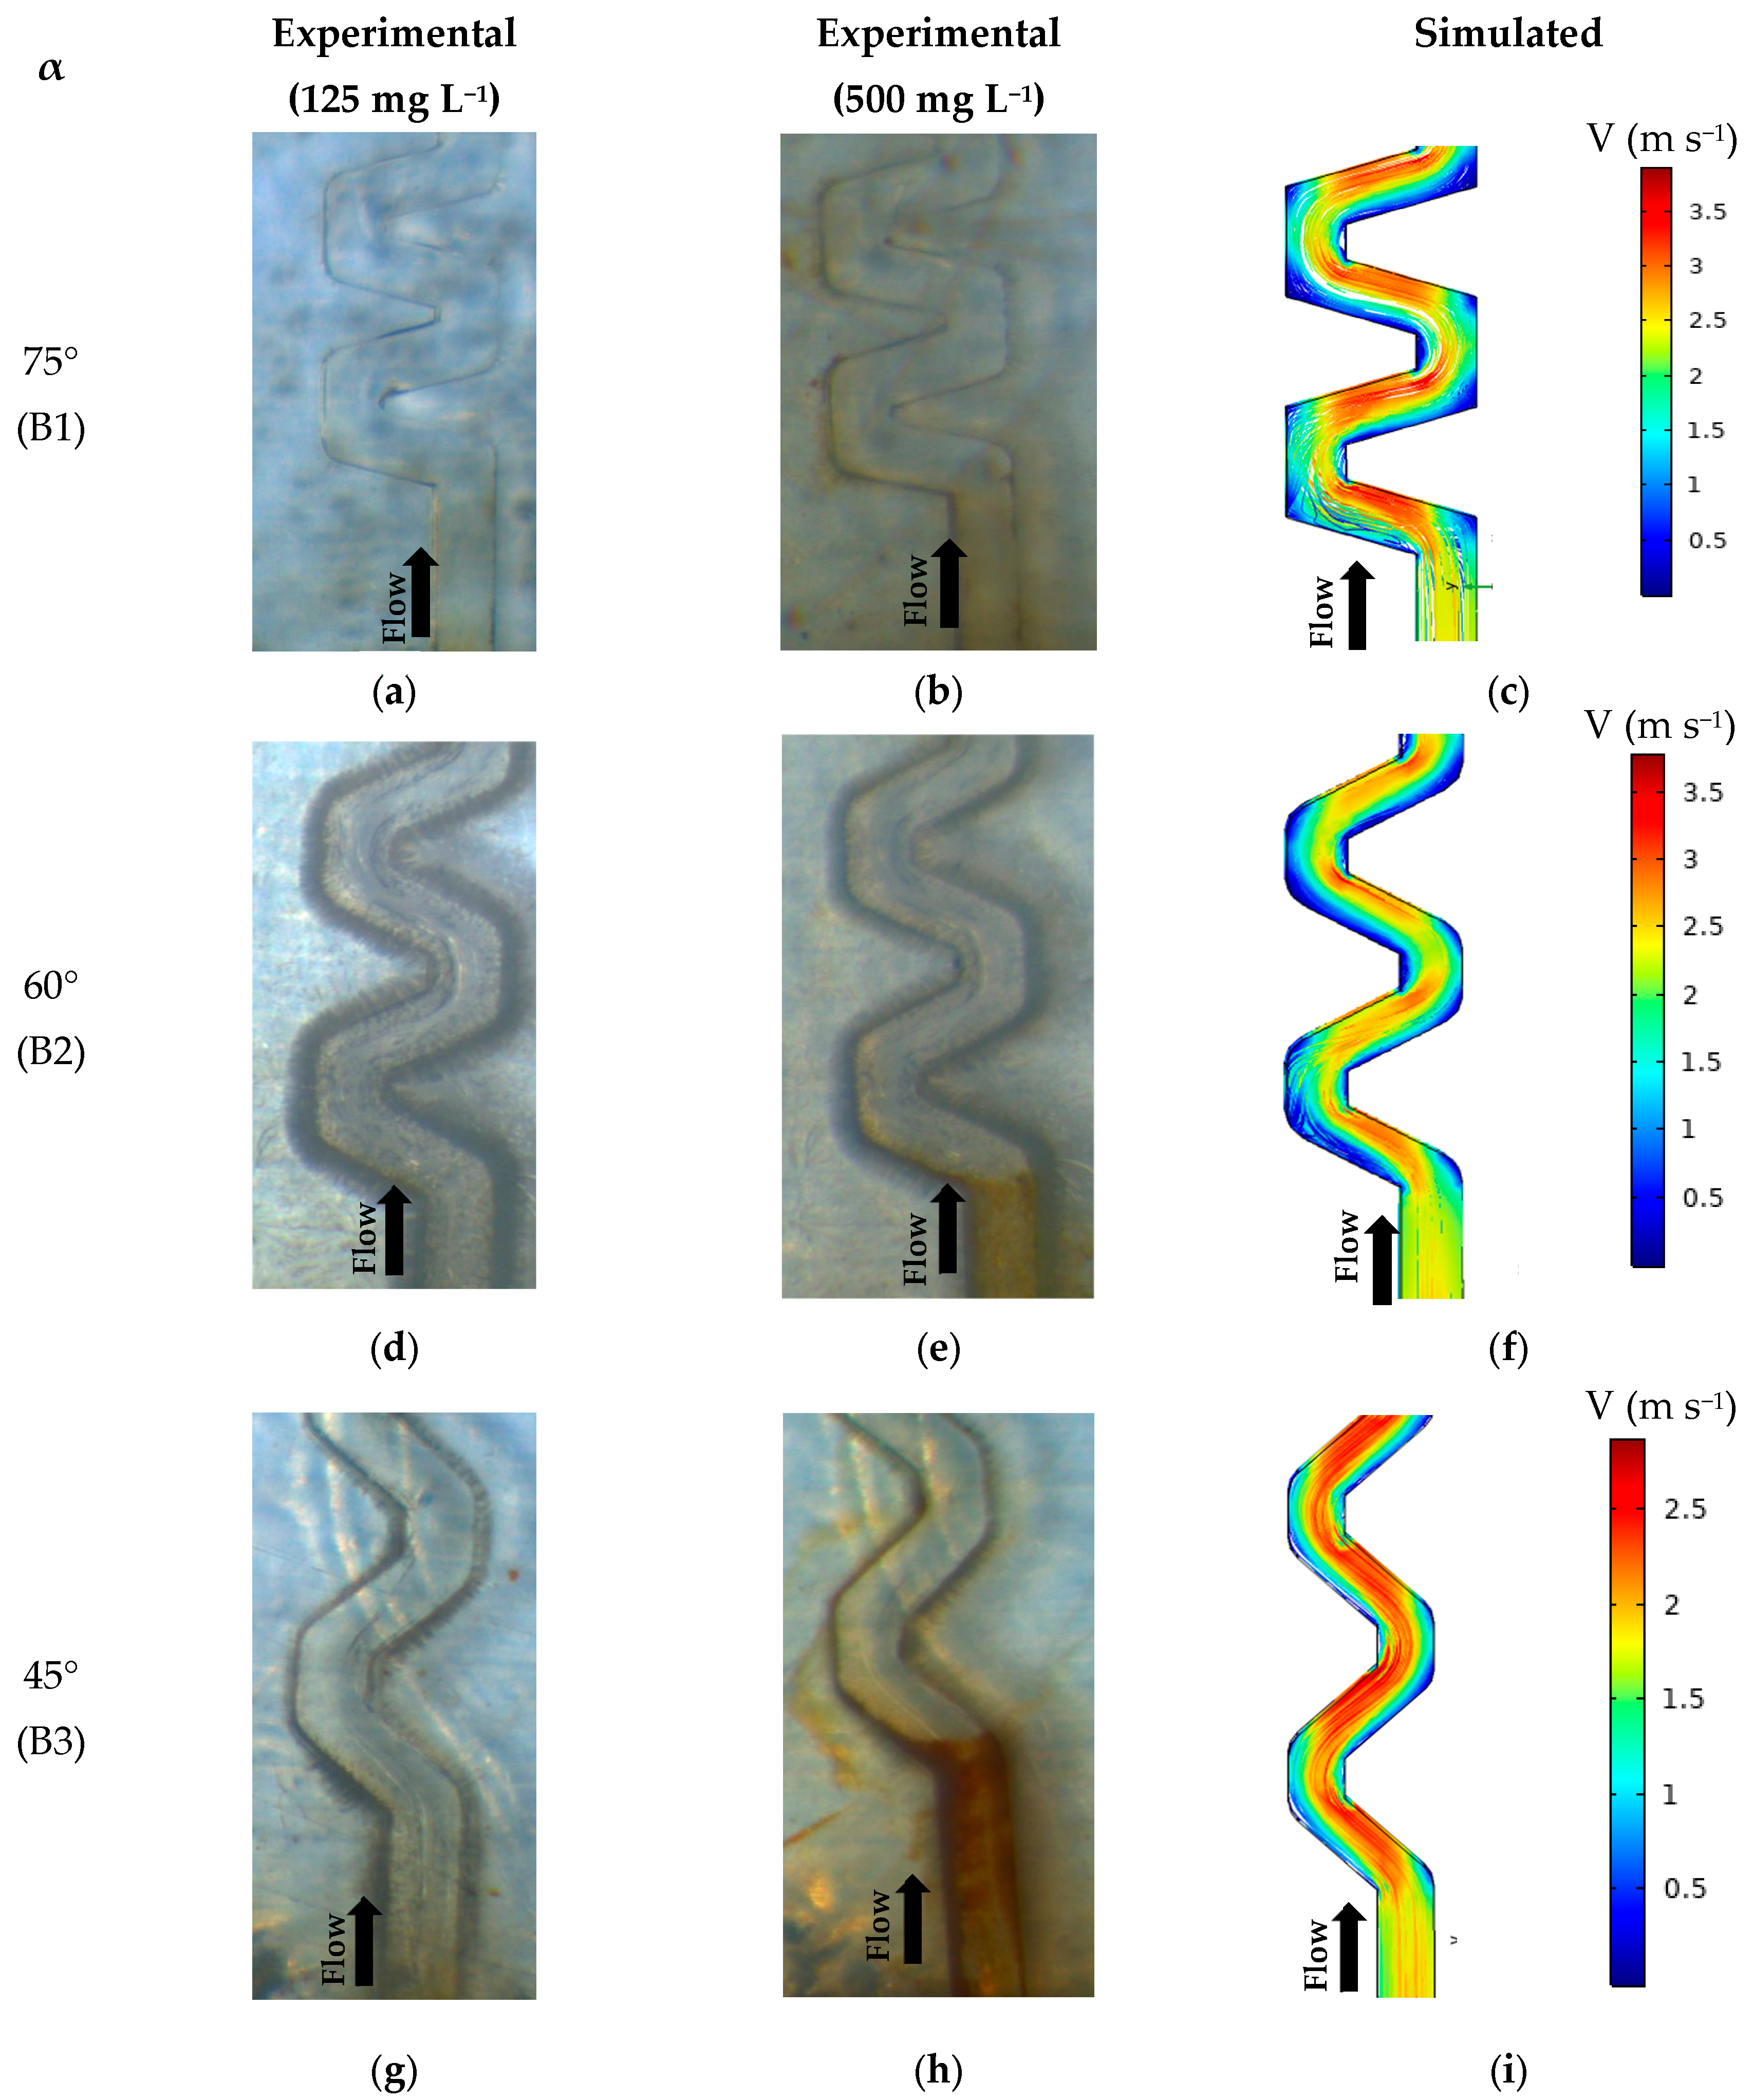
The deposition of solid particles in the emitters of Model B is shown in Figure 9, along with the flow velocity profiles in the channel section.
Unlike vortex-flow emitters, the emitters of Model B, where the flow tends to be more uniform within the labyrinth, did not exhibit solid particle deposition on the baffles (Figure 9a,d,g), with deposition occurring only at the inlet region when the particle concentration in the water reached 500 mg L−1 (Figure 9b,e,h).
Simulated velocity fields indicate that the flow stabilizes quickly in these labyrinths and maintains high velocities throughout the entire channel (Figure 9c,f,i). It is observed that increasing the tooth angle (α) from 45° to 75° enhances the flow velocity and results in the formation of minimal vortex zones. However, in these emitters, the vortex structures are underdeveloped and do not form significant recirculation zones within the channel. As a result, they exert minimal influence on the emitter’s hydraulic performance, particularly with regard to energy dissipation and pressure loss. In uniform-flow emitters, the discharge rate is primarily governed by the total labyrinth length, rather than by local head losses caused by vortex formation. For this reason, such models generally feature longer labyrinth paths to achieve the desired flow regulation (Table 1).
Although the emitters did not become clogged, Yu et al. (2018) [49] observed that labyrinths with more inclined deflectors were more susceptible to clogging, as labyrinths with 45° angles clogged more quickly than those with 75° angles.
Regarding the differences in the geometric characteristics of the Model B emitters, it was not possible to determine which labyrinth parameters most influenced deposition, as no sediment accumulation was observed in these emitters. To analyze the sensitivity of these models to clogging, further tests with longer durations are recommended. This would allow for the identification of the geometric characteristics that most influence particle deposition and emitter clogging for particles smaller than 125 μm.
Comparing the results observed in Figure 8 and Figure 9, it can be concluded that flow velocity is closely related to particle deposition in the channels, regardless of the channel geometry. CFD simulations showed that emitters with more uniform flow (Model B) exhibit high flow velocities throughout nearly the entire channel, preventing particle deposition. Similarly, CFD revealed that emitters with vortex zones (Model A) present varying flow velocities within the channel, and in areas where the velocity is low, solid particle deposition occurs.
Figure 10 shows deposition patterns in labyrinths with curves of approximately 180°, which correspond to extended labyrinth paths engraved in a zigzag shape, a common design in commercial emitters to allow for more compact dripper units. In these regions, a clear trend of particle accumulation was observed, particularly downstream of the curved sections. This is attributed to abrupt changes in flow direction, which cause a localized reduction in flow velocity, creating favorable conditions for sedimentation on the subsequent deflectors. Although no significant impact on emitter discharge was detected during the 200 h tests, the persistent deposition observed in these zones indicates a potential long-term fouling risk.
Therefore, despite the manufacturing and space-efficiency benefits of curved labyrinth designs, they may constitute a hydraulic trade-off, introducing structurally inherent zones of low velocity that are more susceptible to clogging. These findings underscore the importance of balancing geometric compactness with internal hydraulic performance when optimizing emitter design.
From an engineering perspective, the findings of this study suggest that emitter designs promoting uniform flow with high-velocity zones throughout the labyrinth are more resistant to clogging by fine particles. Avoiding geometric configurations that favor the development of low-velocity zones, such as excessive H/W ratios, can reduce the likelihood of sediment deposition in critical regions. Moreover, for systems using water with suspended solids below 125 µm, standard filtration combined with well-designed emitter geometries may be sufficient to prevent clogging. These insights can guide emitter manufacturers in optimizing channel geometries and can assist engineers in selecting appropriate emitter models based on water quality conditions.

4. Conclusions

This study demonstrated that the geometric configuration of dripper labyrinths and the resulting flow patterns play a fundamental role in determining the accumulation of fine solid particles within the labyrinth. Emitters with more uniform flow (Model B) exhibited superior resistance to deposition due to the absence of low-velocity zones, while those with geometries prone to well-developed vortex formation during flow (Model A) promoted sediment buildup in recirculation regions, particularly near the first baffles. CFD simulations proved to be a powerful tool for identifying low-velocity zones and correlating them with observed deposition patterns, reinforcing their potential to guide emitter design. The insights gained from this integrated experimental and numerical analysis contribute to a deeper understanding of clogging mechanisms and provide a foundation for optimizing dripper designs. By minimizing low-velocity regions and enhancing main flow paths, future emitters can be engineered to maintain higher hydraulic performance and reliability, particularly under challenging water quality conditions.

Author Contributions

G.L.M. was responsible for conceptualization, writing—original drafting and writing, data curation, and investigation. A.P.d.C. was responsible for the data analysis, interpretation, supervision, software, writing—review and editing, project administration, and funding acquisition. N.A.-M. was responsible for writing—review and editing, software, and data analysis. N.D.C. was responsible for conceptualization, writing—review and editing, and data curation. All authors have read and agreed to the published version of the manuscript.

Funding

This research was funded by São Paulo Research Foundation (FAPESP), grant number 2018/20099-5, and Coordenação de Aperfeiçoamento de Pessoal de Nível Superior—Brasil (CAPES)—granting the scholarship to the first author (88882.434695/2019-01).

Data Availability Statement

The original contributions presented in this study are included in the article. Further inquiries can be directed to the corresponding author.

Conflicts of Interest

The authors declare no conflicts of interest.

Abbreviations

The following abbreviations are used in this manuscript:
CFDComputational Fluid Dynamic
ECElectrical Conductivity
NaClOSodium Hypochlorite
TSSTotal Suspended Solids
XRDX-ray Diffraction
ZPCZero-point Charge

References

  1. Jahangirpour, D.; Zibaei, M. Farmers’ Decision to Adoption of Modern Irrigation Systems Under Risk Condition: Application of Stochastic Efficiency with Respect to a Function Approach. Front. Water 2022, 4, 931694. [Google Scholar] [CrossRef]
  2. Eekhout, J.P.C.; Delsman, I.; Baartman, J.E.M.; van Eupen, M.; van Haren, C.; Contreras, S.; Martínez-López, J.; de Vente, J. How future changes in irrigation water supply and demand affect water security in a Mediterranean catchment. Agric. Water Manag. 2024, 297, 108818. [Google Scholar] [CrossRef]
  3. Qi, Z.; Gao, Y.; Sun, C.; Ramos, T.B.; Mu, D.; Xun, Y.; Huang, G.; Xu, X. Assessing water-nitrogen use, crop growth and economic benefits for maize in upper Yellow River basin: Feasibility analysis for border and drip irrigation. Agric. Water Manag. 2024, 295, 108771. [Google Scholar] [CrossRef]
  4. Ma, C.; Li, M.; Hou, P.; Wang, X.; Sun, Z.; Li, Y.; Xiao, Y.; Li, Y. Biofilm dynamic changes in drip irrigation emitter flow channels using reclaimed water. Agric. Water Manag. 2024, 291, 108624. [Google Scholar] [CrossRef]
  5. Lv, C.; Niu, W.; Du, Y.; Sun, J.; Dong, A.; Wu, M.; Mu, F.; Zhu, J.; Siddique, K.H.M. A meta-analysis of labyrinth channel emitter clogging characteristics under Yellow River water drip tape irrigation. Agric. Water Manag. 2024, 291, 108634. [Google Scholar] [CrossRef]
  6. Ma, C.; Jiang, C.; Li, Y.; Shi, N.; Liu, S.; Hu, X.; Liu, Z.; Sun, Z.; Muhammad, T. Effect of lateral flushing on emitter clogging in drip irrigation using high-sediment water. Agric. Water Manag. 2024, 293, 108702. [Google Scholar] [CrossRef]
  7. Xiao, Y.; Liu, Y.; Ma, C.; Muhammad, T.; Zhou, B.; Zhou, Y.; Song, P.; Li, Y. Using electromagnetic fields to inhibit biofouling and scaling in biogas slurry drip irrigation emitters. J. Hazard. Mater. 2021, 401, 123265. [Google Scholar] [CrossRef]
  8. Han, S.; Li, Y.; Zhou, B.; Liu, Z.; Feng, J.; Xiao, Y. An in-situ accelerated experimental testing method for drip irrigation emitter clogging with inferior water. Agric. Water Manag. 2019, 212, 136–154. [Google Scholar] [CrossRef]
  9. Feng, J.; Liu, H.; Liu, Y.; Sun, H.; Ma, C.; Shi, P.; Wang, W.; Xue, S.; Wen, J. Optimal structure selection of emitter flow path in drip irrigation system with inferior water resources. Rev. Bras. Eng. Agrícola Ambient. 2025, 29, e281773. [Google Scholar] [CrossRef]
  10. Moulia, V.; Heran, M.; Lesage, G.; Hamelin, J.; Pinta, J.; Gazon, A.; Penlae, M.; Bru-Adan, V.; Wéry, N.; Ait-Mouheb, N. Biofilm growth dynamics in a micro-irrigation with reclaimed wastewater in the field scale. J. Environ. Manag. 2024, 370, 122976. [Google Scholar] [CrossRef]
  11. Paiva, L.A.L.; Batista, R.O.; Silva, R.R.; Moniz, T.D.C.; Augusto, F.I.S.; Cunha, W.A.; Filho, R.A.R.; de Melo, S.B.; Costa, L.R.; de Medeiros, J.F.; et al. Canonical correlation between clogging agents and performance of drippers operating with aquaculture effluents. Rev. Bras. Eng. Agrícola Ambient. 2024, 28, e274127. [Google Scholar] [CrossRef]
  12. Shen, Y.; Puig-Bargués, J.; Li, M.; Xiao, Y.; Li, Q.; Li, Y. Physical, chemical and biological emitter clogging behaviors in drip irrigation systems using high-sediment loaded water. Agric. Water Manag. 2022, 270, 107738. [Google Scholar] [CrossRef]
  13. Bounajra, A.; Guemmat, K.E.L.; Mansouri, K.; Akef, F. Towards efficient irrigation management at field scale using new technologies: A systematic literature review. Agric. Water Manag. 2024, 295, 108758. [Google Scholar] [CrossRef]
  14. Lamm, F.R.; Ayars, J.E.; Nakayama, F.S. Microirrigation for Crop Production: Design, Operation and Management; Elsevier: Amsterdam, The Netherlands, 2006; ISBN 9780444506078. [Google Scholar]
  15. Bounoua, S.; Tomas, S.; Labille, J.; Molle, B.; Granier, J.; Haldenwang, P.; Izzati, S.N. Understanding physical clogging in drip irrigation: In situ, in-lab and numerical approaches. Irrig. Sci. 2016, 34, 327–342. [Google Scholar] [CrossRef]
  16. Niu, W.; Liu, L.; Chen, X. Influence of fine particle size and concentration on the clogging of labyrinth emitters. Irrig. Sci. 2013, 31, 545–555. [Google Scholar] [CrossRef]
  17. Feng, J.; Li, Y.; Liu, Z.; Muhammad, T.; Wu, R. Composite clogging characteristics of emitters in drip irrigation systems. Irrig. Sci. 2019, 37, 105–122. [Google Scholar] [CrossRef]
  18. Wang, M.; Xue, M.; Sun, H.; Li, H.; Li, R.; Han, Q. Investigating Sedimentation Patterns and Fluid Movement in Drip Irrigation Emitters in the Yellow River Basin. Water 2025, 17, 910. [Google Scholar] [CrossRef]
  19. Wang, H.; Wang, S.; Wang, W.; Hu, X. Evaluation of the Influence of Labyrinth Channels on Sand Particles from the Perspective of Emitter Clogging. Irrig. Drain. 2025, 74, 1–11. [Google Scholar] [CrossRef]
  20. He, X.; Wu, P.; Zhang, L.; Wei, Y.; Liu, X.; Yang, F.; Zhou, W. Microporous ceramic emitter: A drip irrigation emitter suitable for high-sediment water. J. Water Process Eng. 2024, 67, 106169. [Google Scholar] [CrossRef]
  21. Patil, S.S.; Nimbalkar, P.T.; Joshi, A. Hydraulic Study, Design & Analysis of Different Geometries of Drip Irrigation Emitter Labyrinth. Int. J. Eng. Adv. Technol. (IJEAT) 2013, 2, 455–462. [Google Scholar]
  22. Lavanholi, R.; de Camargo, A.P.; Bombardelli, W.W.Á.; Frizzone, J.A.; Ait-Mouheb, N.; da Silva Eric, A.; de Oliveira, F.C. Prediction of pressure-discharge curves of trapezoidal labyrinth channels from nonlinear regression and artificial neural networks. J. Irrig. Drain. Eng. 2020, 146, 04020018. [Google Scholar] [CrossRef]
  23. Zhang, J.; Zhao, W.; Tang, Y.; Lu, B. Structural optimization of labyrinth-channel emitters based on hydraulic and anti-clogging performances. Irrig. Sci. 2011, 29, 351–357. [Google Scholar] [CrossRef]
  24. Zhang, J.; Zhao, W.; Lu, B. Rapid prediction of hydraulic performance for emitters with labyrinth channels. J. Irrig. Drain. Eng. 2013, 139, 414–418. [Google Scholar] [CrossRef]
  25. Muniz, G.L.; Camargo, A.P.; Signorelli, F.; Bertran, C.A.; Pereira, D.J.S.; Frizzone, J.A. Influence of suspended solid particles on calcium carbonate fouling in dripper labyrinths. Agric. Water Manag. 2022, 273, 107890. [Google Scholar] [CrossRef]
  26. Nakayama, F.S.; Bucks, D.A. Emitter clogging effects on trickle irrigation uniformity. Trans. ASAE 1981, 24, 77–80. [Google Scholar] [CrossRef]
  27. Wang, H.; Ling, G.; Hu, M.; Wang, W.; Hu, X. Physical Clogging Characteristics of Labyrinth Emitters under Low-Quality (Sand-Laden Water) Irrigation. Agronomy 2022, 12, 1615. [Google Scholar] [CrossRef]
  28. Ravina, I.; Paz, E.; Sofer, Z.; Marcu, A.; Shisha, A.; Sagi, G. Control of emitter clogging in drip irrigation with reclaimed wastewater. Irrig. Sci. 1992, 13, 129–139. [Google Scholar] [CrossRef]
  29. Ribeiro, B.T.; De Lima, J.M.; Curi, N.; De Oliveira, G.C.; Lima, P.L.T. Cargas superficiais da fração argila de solos influenciadas pela vinhaça e fósforo. Química Nova 2011, 34, 5–10. [Google Scholar] [CrossRef]
  30. APHA. Standard Methods for the Examination of Water and Wastewater, 23rd ed.; American Public Health Association: New York, NY, USA, 2017. [Google Scholar]
  31. Li, H.; Li, H.; Han, Q.; Huang, X.; Jiang, Y.; Sun, H.; Li, H. Influence of micro/nanobubbles on clogging in drip irrigation systems. RSC Adv. 2020, 10, 38912–38922. [Google Scholar] [CrossRef]
  32. Yang, J. Computational fluid dynamics studies on the induction period of crude oil fouling in a heat exchanger tube. Int. J. Heat Mass Transf. 2020, 159, 120129. [Google Scholar] [CrossRef]
  33. Zhou, B.; Xiao, Y.; Han, Z.; Hou, P.; Jia, T.; Zhang, J.; Li, Y. Characterization of emitter clogging substances boundary in subsurface drip irrigation with biogas slurry using porous media model. Agric. Water Manag. 2024, 305, 109133. [Google Scholar] [CrossRef]
  34. Muniz, G.L.; Benitez, J.S.; de Camargo, A.P.; Lavanholi, R.; Ait-mouheb, N.; Cano, N.D.; Frizzone, J.A. Hydrodynamic flow conditions and calcium carbonate scale in dripper labyrinth with varied geometric configurations. Biosyst. Eng. 2025, 257, 104199. [Google Scholar] [CrossRef]
  35. Millar, G.J.; Couperthwaite, S.J.; Moodliar, C.D. Strategies for the management and treatment of coal seam gas associated water. Renew. Sustain. Energy Rev. 2016, 57, 669–691. [Google Scholar] [CrossRef]
  36. Gilbert, R.G.; Nakayama, F.S.; Bucks, D.A.; French, O.F.; Adamson, K.C. Trickle irrigation: Emitter clogging and other flow problems. Agric. Water Manag. 1981, 3, 159–178. [Google Scholar] [CrossRef]
  37. Coelho, R.D.; de Almeida, A.N.; de Oliveira Costa, J.; de Sousa Pereira, D.J. Mobile drip irrigation (MDI): Clogging of high flow emitters caused by dragging of driplines on the ground and by solid particles in the irrigation water. Agric. Water Manag. 2022, 263, 107454. [Google Scholar] [CrossRef]
  38. Zhang, L.; Wu, P.; Zhu, D.; Zheng, C. Effect of pulsating pressure on labyrinth emitter clogging. Irrig. Sci. 2017, 35, 267–274. [Google Scholar] [CrossRef]
  39. Yu, L.; Li, N.; Liu, X.; Yang, Q.; Li, Z.; Long, J. Influence of Dentation Angle of Labyrinth Channel of Drip Emitters on Hydraulic and Anti-Clogging Performance. Irrig. Drain. 2019, 68, 256–267. [Google Scholar] [CrossRef]
  40. Zhang, J.; Zhao, W.; Wei, Z.; Tang, Y.; Lu, B. Numerical and experimental study on hydraulic performance of emitters with arc labyrinth channels. Comput. Electron. Agric. 2007, 56, 120–129. [Google Scholar] [CrossRef]
  41. Oliveira, F.C.; Lavanholi, R.; Camargo, A.P.; Frizzone, J.A.; Mouheb, N.A.; Tomas, S.; Molle, B. Influence of Concentration and Type of Clay Particles on Dripper Clogging. Irrig. Drain. Syst. Eng. 2017, 6, 1000184. [Google Scholar] [CrossRef]
  42. Ait-Mouheb, N.; Schillings, J.; Al-Muhammad, J.; Bendoula, R.; Tomas, S.; Amielh, M.; Anselmet, F. Impact of hydrodynamics on clay particle deposition and biofilm development in a labyrinth-channel dripper. Irrig. Sci. 2019, 37, 1–10. [Google Scholar] [CrossRef]
  43. United States Department of Agriculture, Natural Resources Conservation Service. National Engineering Handbook, Part 623: Irrigation; USDA NRCS: Washington, DC, USA, 2013.
  44. Li, G.; Wang, J.; Alam, M.; Zhao, Y. Influence of geometrical parameters of labyrinth flow path of drip emitters on hydraulic and anti-clogging performance. Trans. ASABE 2006, 49, 637–643. [Google Scholar] [CrossRef]
  45. Zhang, J.; Zhao, W.; Tang, Y.; Lu, B. Anti-clogging performance evaluation and parameterized design of emitters with labyrinth channels. Comput. Electron. Agric. 2010, 74, 59–65. [Google Scholar] [CrossRef]
  46. Qin, C.; Zhang, J.; Wang, Z.; Lyu, D.; Liu, N.; Xing, S.; Wang, F. Anti-Clogging Performance Optimization for Shunt-Hedging Drip Irrigation Emitters Based on Water–Sand Motion Characteristics. Water 2022, 14, 3901. [Google Scholar] [CrossRef]
  47. Yang, B.; Wang, J.; Zhang, Y.; Wang, H.; Ma, X.; Mo, Y. Anti-clogging performance optimization for dentiform labyrinth emitters. Irrig. Sci. 2020, 38, 275–285. [Google Scholar] [CrossRef]
  48. Qingsong, W.; Gang, L.; Jie, L.; Yusheng, S.; Wenchu, D.; Shuhuai, H. Evaluations of emitter clogging in drip irrigation by two-phase flow simulations and laboratory experiments. Comput. Electron. Agric. 2008, 63, 294–303. [Google Scholar] [CrossRef]
  49. Yu, L.; Li, N.; Yang, Q.; Liu, X. Influence of flushing pressure before irrigation on the anti-clogging performance of labyrinth channel emitters. Irrig. Drain. 2018, 67, 191–198. [Google Scholar] [CrossRef]
Figure 1. Components of the accessory for coupling the labyrinth prototypes [25]. 1. Acrylic plate with machined labyrinth; 2. Silicone rubber; 3. Sealing ring (O-ring); 4. Brass fitting; 5. Screw and nut for securing the accessory to the test bench; 6. Polypropylene accessory; 7. Screw and nut for securing the glass plate; 8. Glass plate.
Agriengineering 07 00217 g001
Figure 2. Particle size distribution curve of the particles used in the experiments.
Agriengineering 07 00217 g002
Figure 3. Mesh independence test. Images (a,b) correspond to prototype B1, showing the velocity profiles at the first and fifth baffles, respectively. Images (c,d) refer to prototype A7, also displaying the velocity profiles at the first and fifth baffles, respectively [34].
Agriengineering 07 00217 g003
Figure 4. pH and electrical conductivity (EC) values of water (a) and concentration of total suspended solids (b) during the tests.
Agriengineering 07 00217 g004
Figure 5. Relative flow rate over time of dripper prototypes: Model A with 125 mg L−1 of particles (a), Model B with 125 mg L−1 of particles (b), Model A with 500 mg L−1 of particles (c), and Model B with 500 mg L−1 of particles (d).
Agriengineering 07 00217 g005
Figure 6. Streamlines and velocity fields on the deflectors of Model A prototypes. (a) A1; (b) A2; (c) A3; (d) A4; (e) A5; (f) A6; (g) A7; (h) A8; and (i) A9.
Agriengineering 07 00217 g006
Figure 7. Particle deposition sites on the baffle, streamlines, and velocity fields in prototypes A4 (ac), A5 (df), and A6 (gi).
Agriengineering 07 00217 g007
Figure 8. Streamlines and velocity fields on the deflectors of Model B prototypes. (a) B1; (b) B2; (c) B3; (d) B4; (e) B5; and (f) B6.
Agriengineering 07 00217 g008
Figure 9. Particle deposition sites on the baffle, streamlines, and velocity fields in prototypes B1 (ac), B2 (df)), and B3 (gi).
Agriengineering 07 00217 g009
Figure 10. Particle deposition pattern, streamlines, and flow velocity fields in models A9 (a,b) and B6 (c,d).
Agriengineering 07 00217 g010
Table 1. Geometric characteristics of prototypes with Model A and Model B labyrinths.
ModelPrototypesW (mm)D (mm)A (mm2)H (mm)α (°) φ (-)N (-)L (mm)
A10.70.80.490.707517.712333.33
20.70.80.490.847521.211927.54
30.70.80.491.127525.321623.19
41.00.81.001.007518.824491.10
51.00.81.001.207524.583470.40
61.00.81.001.607530.092858.00
71.30.81.691.307520.9767177.65
81.30.81.691.567528.8449131.89
91.30.81.692.087531.8445118.43
B10.50.50.250.71452.233789.32
20.50.50.250.87604.421836.00
30.50.50.250.71758.041015.18
40.80.80.641.13452.31230888.42
50.80.80.641.39603.99133425.60
60.80.80.641.55757.2873177.26
Note: (W) channel width; (D) channel depth; (A) flow section area; (H) tooth height; (α) tooth angle; (φ) head loss coefficient caused by each baffle; (N) baffles number; and (L) labyrinth length. [25]
Disclaimer/Publisher’s Note: The statements, opinions and data contained in all publications are solely those of the individual author(s) and contributor(s) and not of MDPI and/or the editor(s). MDPI and/or the editor(s) disclaim responsibility for any injury to people or property resulting from any ideas, methods, instructions or products referred to in the content.