Article

Machine Learning Performance Analysis for Bagging System Improvement: Key Factors, Model Optimization, and Loss Reduction in the Fertilizer Industry

by
Ari Primantara
1,*,
Udisubakti Ciptomulyono
2 and
Berlian Al Kindhi
3
1
School of Interdisciplinary Management and Technology, Institut Teknologi Sepuluh Nopember, Surabaya 60111, Indonesia
2
Department of Industrial and Systems Engineering, Institut Teknologi Sepuluh Nopember, Surabaya 60111, Indonesia
3
Department of Electrical Automation Engineering, Institut Teknologi Sepuluh Nopember, Surabaya 60111, Indonesia
*
Author to whom correspondence should be addressed.
AgriEngineering 2025, 7(6), 187; https://doi.org/10.3390/agriengineering7060187
Submission received: 14 April 2025 / Revised: 28 May 2025 / Accepted: 4 June 2025 / Published: 11 June 2025

Abstract

:
Inconsistencies in product weight during fertilizer bagging can lead to material losses and reduced operational efficiency. This study investigates the use of machine learning to predict weight deviations in the Urea Bagging Unit at PT Petrokimia Gresik. Four algorithms were used: an Artificial Neural Network (ANN), Random Forest Regression (RFR), Linear Regression (LR), and Support Vector Regression (SVR). The dataset used consisted of nine numeric sensor variables. Among the models, RFR achieved the highest predictive accuracy (R2 = 0.9638, RMSE = 0.0496, MAE = 0.0338). Feature importance analysis identified the clamping time and air pressure as the most influential variables. A Smart Bagging System was developed using the RFR model, integrating real-time monitoring and automated parameter adjustment. The simulation results show that the system can reduce overweight losses by up to 95%, with potential annual savings of approximately IDR 29 billion. While promising, these results are based on controlled conditions and a limited dataset; further field validation is recommended. The proposed system demonstrates the potential of machine learning to support cost-efficient, real-time process control in industrial bagging operations. This work aligns with SDG 9 and SDG 12 by promoting industrial innovation and reducing resource waste.

1. Introduction

1.1. Motivation

Agriculture plays a vital role in ensuring food security and contributes significantly to the economic development of many countries [1], especially in agrarian countries like Indonesia. Fertilizers play a vital role in enhancing agricultural productivity, and maintaining their consistent quality is critical for achieving optimal outcomes in agriculture [2]. One of the most critical stages in fertilizer production and distribution is the bagging process, which directly influences the final product’s accuracy, quality, and consistency. PT Petrokimia Gresik, the most comprehensive fertilizer producer in Indonesia, is responsible for ensuring product quality, including the precision of the bagging system. Despite its large production capacity, the company has faced recurring issues with inconsistencies in product weight during bagging.
The inconsistencies in product weight resemble various issues that affect the management of bagging facilities, impacting efficiency and product quality. Previous studies have identified problems related to underweight or overweight products, such as in the research conducted by Beach et al. (2004) where excess product weight was found in the food industry [3], significant variations in product weight in the cement industry [4], and the overfilling and underfilling of food packaging in Serbia [5]. To quantify the extent of this issue at PT Petrokimia Gresik, sampling was conducted on the bagging results in the Urea I Bagging Unit during January 2023. The findings revealed an average nonconformance rate of 37%, with an average excess weight of 0.3 kg per bag beyond the maximum product weight limit of 50.4 kg. The plant’s production capacity of 1,030,000 tons or 20,600,000 bags per year translates to an estimated loss of 6180 tons annually. A global urea price of USD 330 per ton as of November 2024 [6] leads to a total financial loss of approximately IDR 30.6 billion annually. These losses demonstrate the need for a data-driven predictive control system. While Industry 4.0 emphasizes the integration of ML in industrial operations, its application in fertilizer bagging remains underexplored. This study addresses this gap by applying ML to improve bagging accuracy and reduce waste.

1.2. Literature Review and Gap

Previous studies have examined various factors that influence the bagging process, including temperature, humidity, water content, air pressure, granule size, dust content, clamping time, and vibration. These factors have been studied individually in various industrial contexts: Machine temperature affects magnet performance [7]. Air pressure influences the filling accuracy in cement packaging [4]. Humidity impacts polypropylene-based packaging [8]. Moisture content affects processing efficiency in peeling machines [9]. Granule size influences flowability on conveyors [10]. A high dust content can accelerate machine wear [11]. Valve timing is critical to stable flow control [12]. Research on the effect of product temperature on molding machine performance indicates that unstable product temperature can reduce machine performance, as it disrupts flow, pressure, and control stability [13]. Both product temperatures [13] and machine vibration can disrupt flow and consistency during packaging [14].
In the context of fertilizer bagging, machine and product temperatures significantly impact work stability and material flow rate; high temperatures can either accelerate or disrupt the filling process [15]. Humidity affects the elasticity of the bagging material and the mechanical performance of the machine, while the water content of the product influences its physical form [15]. Dehydrated products become dusty, while overly wet ones can clump, both of which trigger weight variations [15]. The air pressure of the machine determines the speed and volume of flow; inappropriate pressure can cause underfill or overfill [15]. Product particle sizes that are too small are easily lost due to dust, while those that are too large can clog the channel, thereby affecting the fertilizer flow rate and ultimately the final weight [15]. Dust content has the potential to disrupt machine performance and accelerate wear, which affects filling precision [15]. The clamping time determines the volume of material entering the bag; if it is too fast or too slow, the weight will not be as targeted [15]. Machine vibration can cause instability in the material flow to the bag, resulting in inaccurate weight measurements [15]. All these variables are interrelated and contribute to weight fluctuations, making them very relevant as inputs in ML models to predict and minimize product weight deviations.
Additionally, the current literature places more emphasis on automation and robotic advancements than on the application of ML to predict and enhance outcomes in bagging. Research in the field of packaging automation in the food industry utilizes robots to automate food packaging while also combining technologies that can perform tasks such as separating, dosing, filling, sealing, and labeling [15]. Research has used two robotic arms, focusing on precise packaging. This utilizes cameras and adaptive motion planning but does not yet incorporate ML [15]. Another study conducted at the Military University of Technology, Poland, also optimized the packaging process using industrial robots but did not use ML for decision-making [16]. While such rule-based approaches offer automation, they lack the capability to learn from historical data or adapt to nonlinear, multivariate sensor conditions. Parametric models also require manual tuning and struggle with complex process variability. In contrast, machine learning enables data-driven decision-making, offering higher predictive accuracy and adaptability. Recent studies have demonstrated that ML-based predictive quality systems outperform conventional methods in handling complex sensor inputs and enhancing manufacturing outcomes [17].
Research in packaging at a metal cutting tool company has applied semi-automatic systems, barcodes, and RFID [17]. Although several previous studies have developed automation and robotic systems for the packaging process, there has been no research that specifically applies ML algorithms to predict and improve packaging results in the fertilizer industry. The existing literature primarily focuses on the development of automation systems and the use of robotic arms, barcodes, and RFID technology. Still, it has not explored the application of data-based prediction models to enhance weight accuracy and improve the efficiency of the bagging system. Therefore, this study fills this gap by applying an ML model to real sensor data from a urea fertilizer bagging line to evaluate the performance and contribution of features to the weight prediction results.
Recent developments in Industry 4.0 have introduced transformative opportunities for integrating advanced digital technologies into industrial processes. These include automation, the Internet of Things (IoT), cloud computing, big data, and artificial intelligence (AI) [18], all designed to enhance operational efficiency and productivity across various sectors. Among these, ML has emerged as a powerful tool for processing large-scale industrial data, generating accurate predictions, and supporting real-time decision-making [19]. ML enables systems to automatically identify patterns from historical data and make informed predictions without explicit programming. In the context of Industry 4.0, ML facilitates seamless connectivity between devices, sensors, and software platforms, allowing for dynamic monitoring, predictive maintenance, and process optimization [20]. While ML has been widely adopted in the manufacturing, logistics, and food processing industries, its application in the fertilizer industry, particularly in bagging system performance, remains limited.
This study employs four ML models, an ANN, SVR, LR, and RFR, based on their diverse modeling capabilities and established relevance in industrial quality prediction. In the context of bagging, an ANN is capable of modeling highly nonlinear and complex relationships between sensor input variables and the final weight results, making it suitable for systems with non-explicit variable interactions [16]. RFR has the advantage of overcoming outliers and noise, which are commonly found in industrial data due to operational or sensor interference [21]. SVR is adequate for small- to medium-sized datasets and has good generalization capabilities under noisy data conditions [21]. Meanwhile, LR is used as a simple and directly interpretable baseline model to measure the extent to which other models provide performance improvements [22]. These four methods are complementary because they reflect different modeling approaches: from simple linear models (LR) to robust tree-based models (RFR), kernel-based models (SVR), and flexible and robust neural network models that handle nonlinear relationships (ANN). By employing a range of these approaches, this study can assess the prediction performance from multiple perspectives, accuracy, robustness to noise, model complexity, and implementation feasibility, to gain a comprehensive understanding of the optimal solution for a fertilizer bagging system. The integration of ML in this context is expected to enhance process quality, operational efficiency, and system reliability, providing a data-driven solution to longstanding challenges in fertilizer packaging operations [21]. This study addresses the existing gap in the literature by evaluating four ML algorithms to identify the most effective predictive model for weight inconsistencies in fertilizer bagging systems. In addition to comparing model performance, this study conducts an attribute importance analysis to determine the key variables that most significantly influence bagging performance.

1.3. Hypotheses

Based on the characteristics of the fertilizer bagging process data, which contain noise, outliers, and nonlinear relationships between variables, this study hypothesizes that the RFR model will provide the best prediction performance in modeling product weight deviation compared to other methods, including an ANN, SVR, and LR. The advantages of RFR in handling complex industrial data, along with its ability to provide an interpretation of feature importance, are expected to make this model the most accurate and reliable in the context of a sensor-based fertilizer bagging system [23].

1.4. Contributions

This study contributes the following:
  • A comparative evaluation of four ML algorithms (ANN, RFR, LR, SVR) using real-time sensor data from the Urea I Bagging Unit.
  • A proposed design for an IoT-based Smart Bagging System for predictive control in fertilizer packaging.
  • The identification of key variables affecting the fertilizer bagging process using machine learning technology.
  • A demonstration of ML’s potential to automate setup, detect errors, and optimize process efficiency.
  • An exploration of ML’s role in enabling auto-adjustment mechanisms in bagging systems for real-time operational optimization.
  • The provision of novel insights and predictive approaches previously unaddressed in the domain of fertilizer packaging.

1.5. Previous Study and Research Positioning

Previously, the author also conducted a preliminary study published in the IEEE ISCT 2024 forum [24], which evaluated the performance of four ML algorithms (ANN, RFR, LR, and SVR) using a small dataset of 42 data points. This study will review the feasibility of implementing a predictive model in a fertilizer bagging system. However, the study did not include the hyperparameter tuning process, attribute importance analysis, or integration with the actual control system in the field. Therefore, the current study is structured as a comprehensive follow-up study, utilizing a larger dataset, a model optimization approach, and an IoT-based Smart Bagging System design that supports real-time predictive control.

2. Methodology

This section outlines the methodology adopted to analyze the performance of the fertilizer bagging system. This study was conducted at the Urea I Bagging Unit, which operates under the Department of Warehousing and Bagging at PT Petrokimia Gresik. The methodology encompasses identifying critical influencing factors, acquiring data through sensor-based monitoring, systematic sampling, and particle size analysis, as well as applying ML algorithms to model and evaluate system performance.

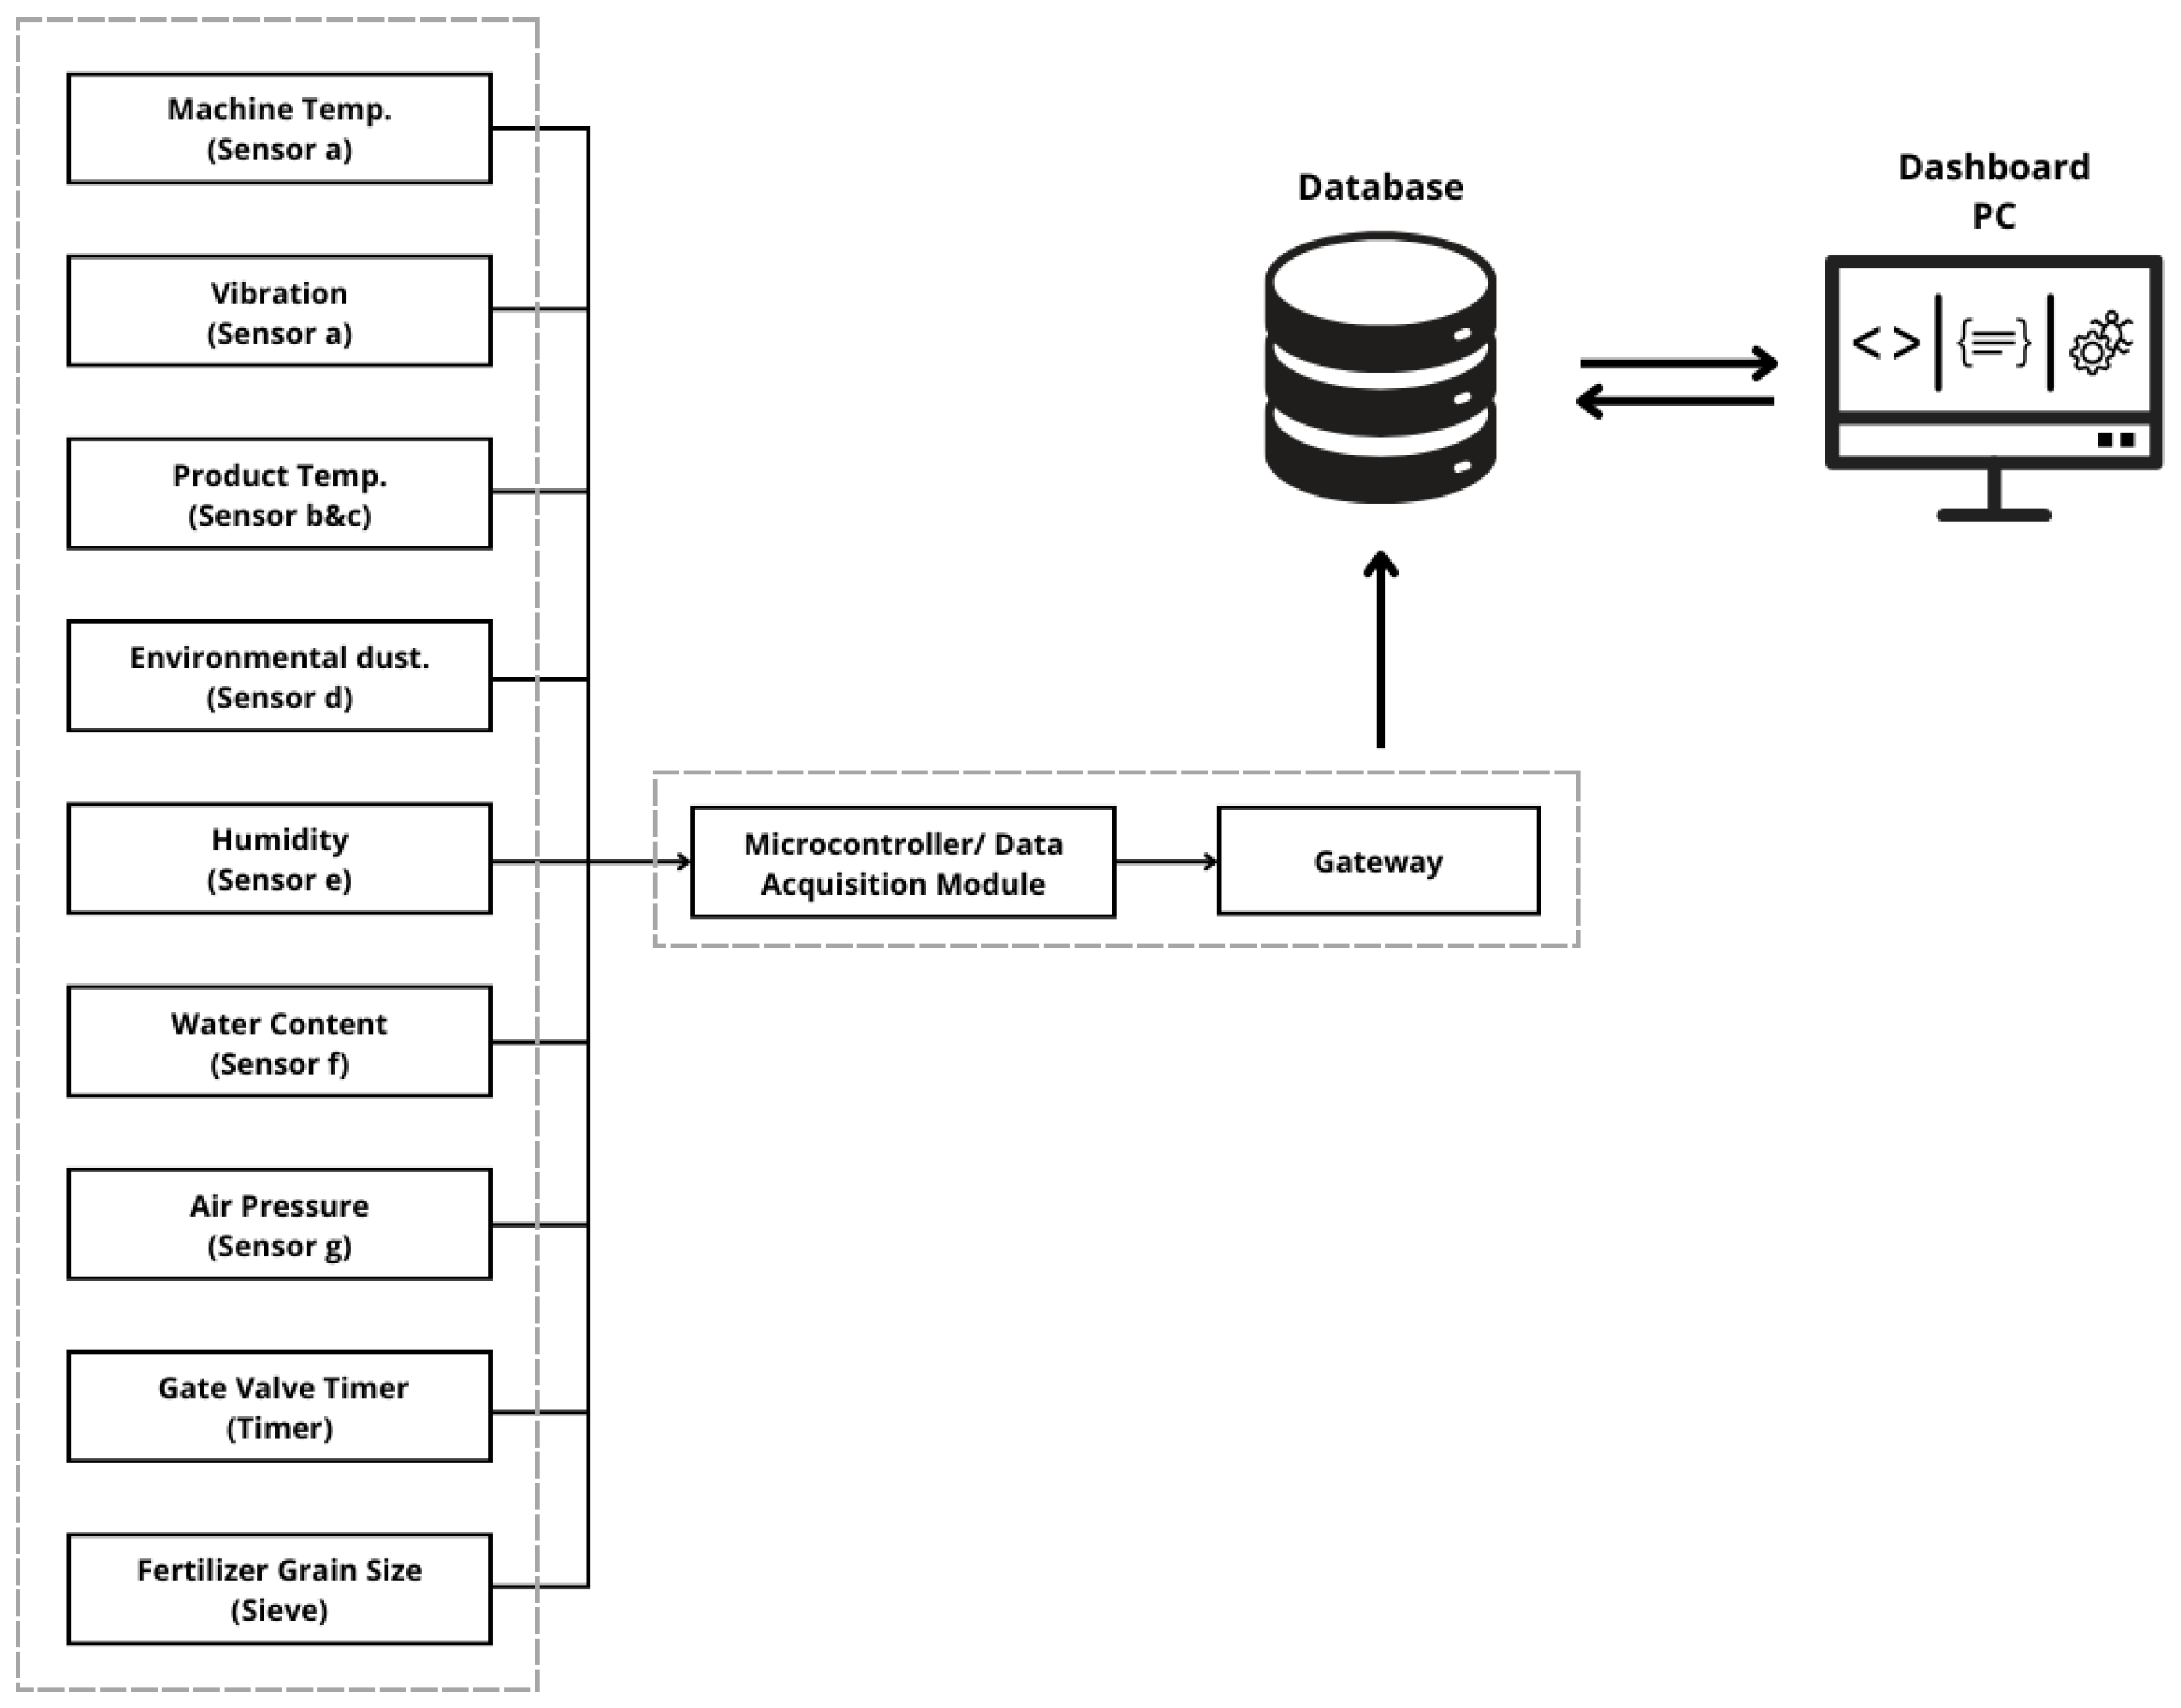
2.1. Data Acquisition Devices

The performance analysis of the fertilizer bagging system was conducted using a set of data acquisition devices installed in the Urea I Bagging Unit at PT Petrokimia Gresik. The system monitored nine critical variables that potentially influence bagging outcomes. Figure 1 shows the data acquisition architecture, factors influencing bagging, and devices used.
In this system, properly placed devices according to the target factors needed can provide real-time data to support ML decision-making. Proper sensor placement on the bagging machine ensures accurate and relevant data. It can minimize potential errors while increasing the accuracy of monitoring and analysis results. The placement of the nine devices on the Urea I Bagging Unit can be seen in Figure 2. The devices installed on the bagging machine are as follows:
  • RS-485 Vibration and Temperature Sensor (Sensor A)—combines MEMS-based vibration and temperature sensing with high stability and anti-interference performance.
  • RTD Controller (Sensor B)—regulates system temperature by interpreting resistance changes in the RTD input and adjusting thermal output accordingly.
  • Thermocouple (Sensor C)—measures temperature based on thermoelectric voltage, allowing digital signal conversion.
  • ZH03A Dust Sensor (Sensor D)—detects airborne dust particles using laser scattering with low power consumption and real-time response.
  • THD Sensor (Sensor E)—monitors ambient temperature and humidity within operational limits of −19.9 °C to 60.0 °C and 0–99.9% RH.
  • RS-485 Product Temp and Moisture Sensor (Sensor F)—captures product temperature and humidity with a wide input voltage range and RS-485 communication.
  • WPT-70G Pressure Sensor (Sensor G)—measures pressure using piezoresistive technology, offering corrosion resistance and high accuracy.
  • Granule Size Control—ensures urea fertilizer consistency using sieves that match standardized particle size for optimal flow and packing.
  • Gate Valve Timing System—controls valve opening/closing via relay and timer to ensure precise bagging weight. Each sensor was selected for industrial-grade reliability, a fast response time, and integration capabilities for digital data collection.
All sensors were sourced from Autonics (Jakarta, Indonesia), an Indonesian vendor. Each sensor was selected for industrial-grade reliability, a fast response time, and integration capabilities for digital data collection. The selection of the clamping time and air pressure as independent variables is based on the basic mechanical principles of pneumatic actuators. In systems with fixed actuator geometry, the clamping time represents the duration of piston movement, while the air pressure determines the applied force. According to the mechanical power equation (Power = Force × Distance/Time), a theoretical relationship may exist if power is constant [21]. However, in industrial practice, both parameters are adjusted separately and operate independently. Therefore, both were measured to represent two key aspects of pneumatic behavior, timing and pressure, which are essential for capturing system dynamics. This approach is supported by previous studies that treat time- and pressure-based variables as distinct control elements in pneumatic systems [25].

2.2. Sensor Placement

Proper sensor placement was critical for collecting accurate, real-time data. Sensors were installed at specific locations on the bagging machine based on their respective targets, as shown in Figure 2. This layout ensured that the sensors captured representative data on the environmental and operational conditions during fertilizer bagging. Strategic positioning helped minimize measurement error and prolonged the sensor’s operational lifespan, particularly in the highly corrosive environment of fertilizer production.
Proper sensor placement supports real-time ML decision-making by minimizing errors and ensuring accurate data collection. The placement considers the system and condition of the fertilizer bagging unit, which can affect the accuracy of the data collected by the devices. The correct and strategic location for placing the devices ensures that the data taken is accurate and increases the sensor lifetime, considering that the conditions of the bagging unit are very corrosive due to the nature of the fertilizer.

2.3. Sampling Techniques

This study employed systematic random sampling to collect data from 1000 bags of urea fertilizer packed during multiple production shifts in May 2025. Sampling was performed every 30 s, which is equivalent to about every five bags of fertilizer and weighed to assess compliance with the target weight range (50.2–50.4 kg). This method was chosen for its balance between randomness and operational feasibility in high-speed production environments. It minimizes selection bias, captures real-time weight variation, and reduces disruption to ongoing operations. For model training and evaluation, the dataset was partitioned using 10-fold cross-validation, which involves splitting the data into ten equal parts and iteratively using 90% for training and 10% for testing. This method ensures that each data point is used for both training and validation, thereby enhancing the statistical validity of model performance metrics [26].

2.4. Particle Size Measurement

In this study, the particle size of the urea fertilizer was measured using a sieve shaker, a widely used laboratory device for particle size analysis. The sieve shaker facilitates the precise and efficient separation of granular materials based on size. It operates by mechanically vibrating a stack of sieves arranged in descending order of mesh size. This vibration ensures that the urea particles pass through the sieve apertures corresponding to their sizes, while larger particles are retained on the upper sieves. This process enhances consistency in particle size distribution and minimizes human error compared to manual sieving methods [26]. Mesh sizes 6 and 8, which meet the standard specifications for urea fertilizer, were used.

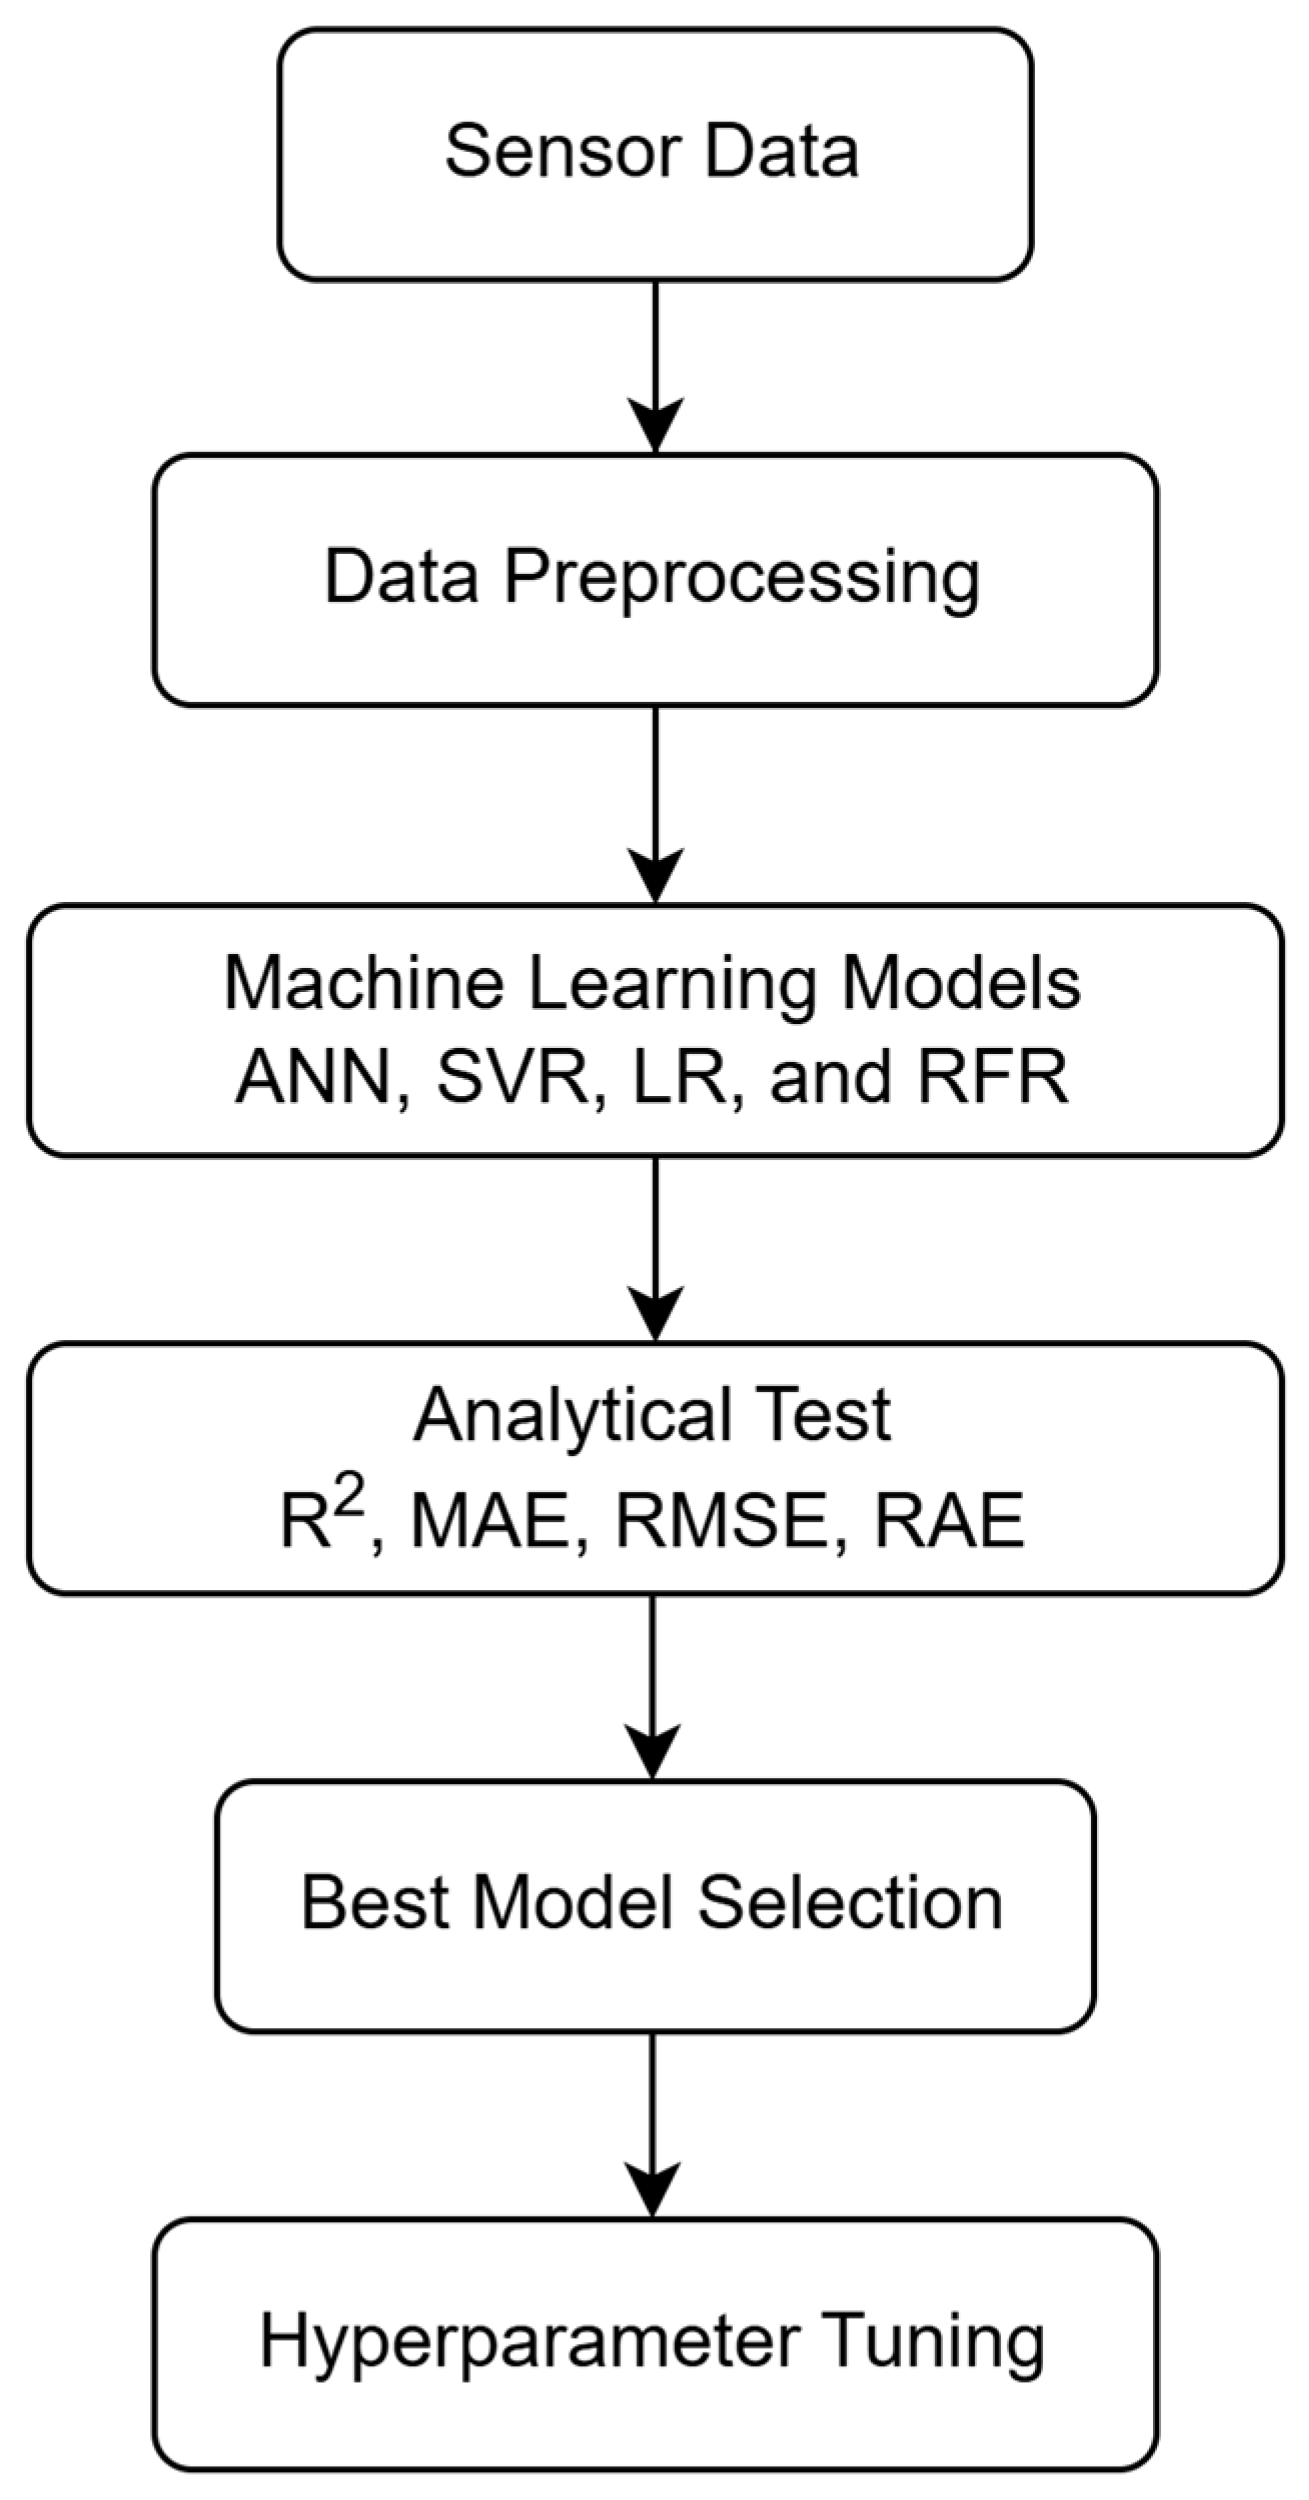
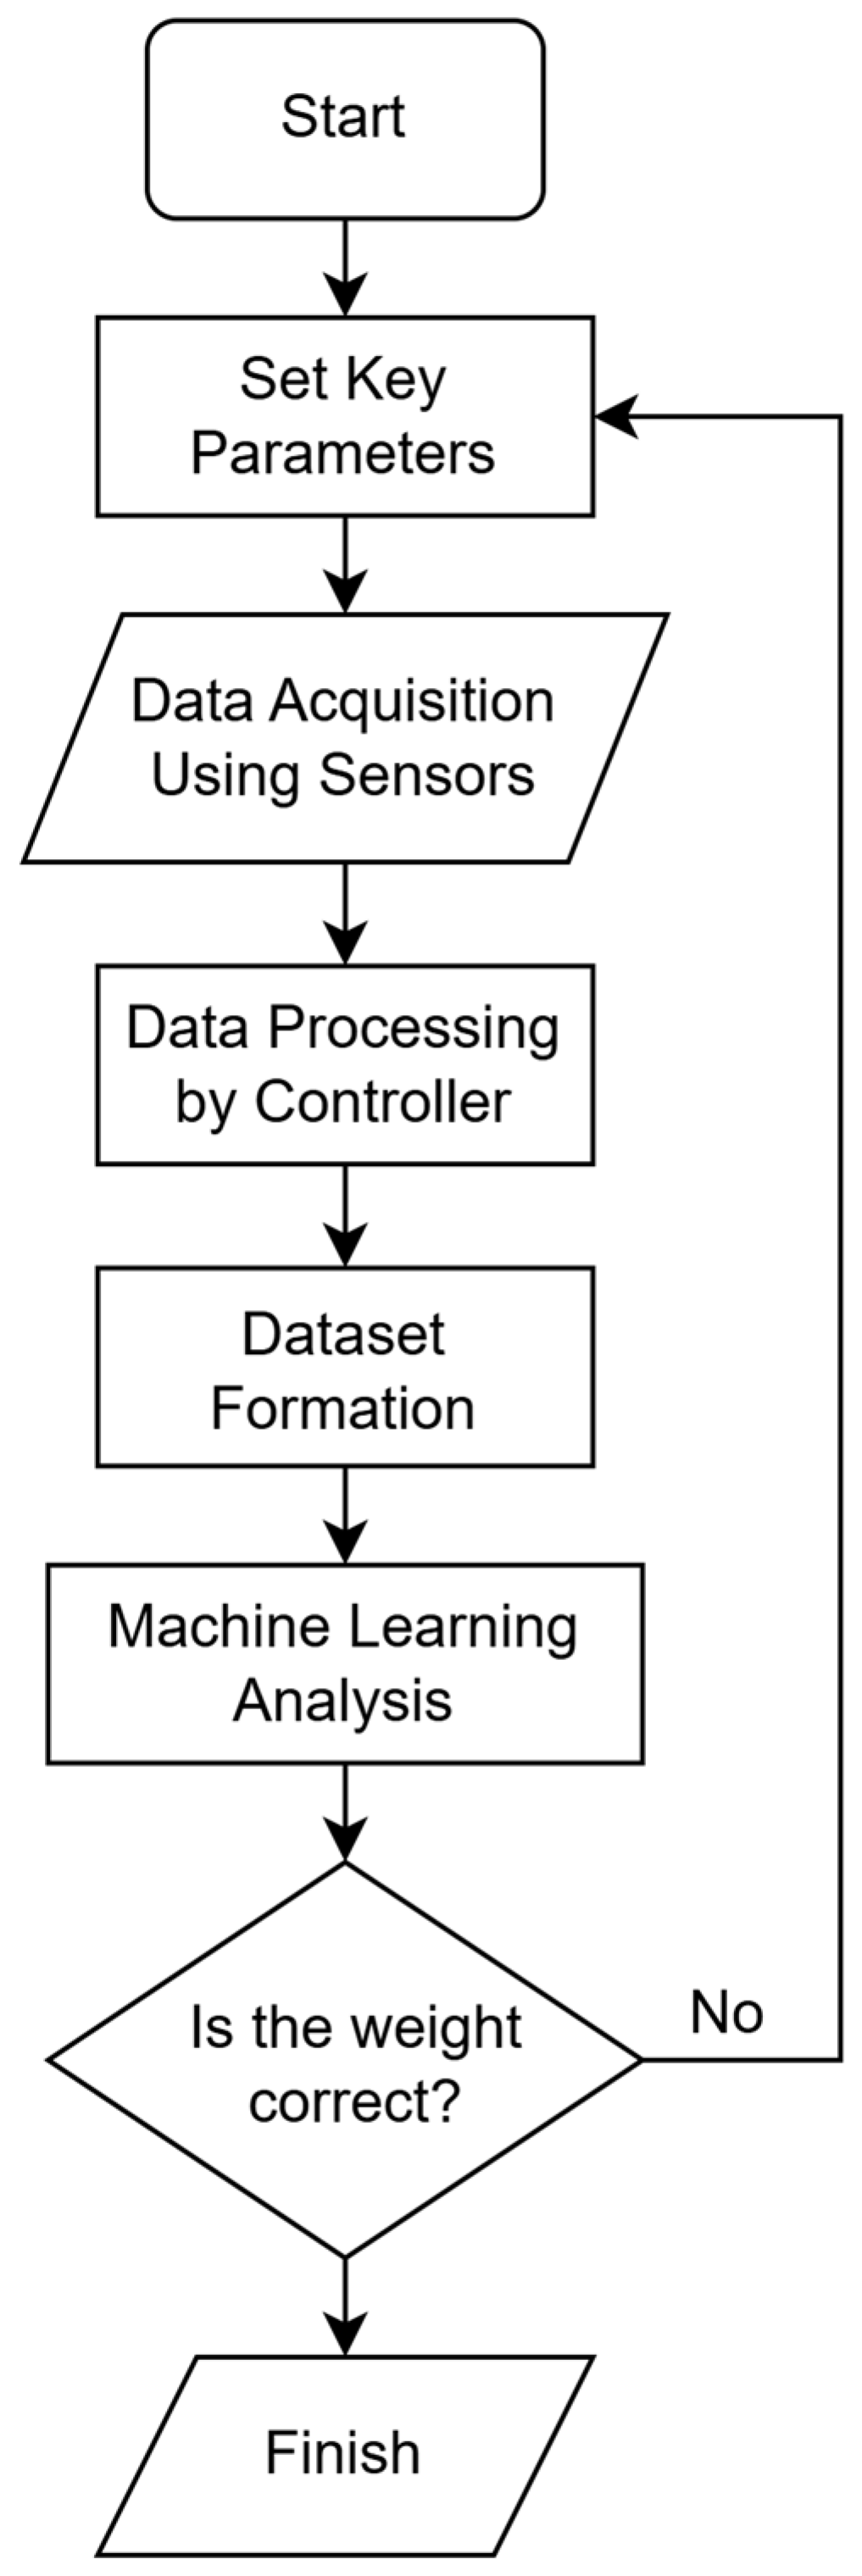
2.5. Data Processing Flow

Figure 3 illustrates the data processing flow employed in this study, comprising six sequential stages. The process begins with the acquisition of sensor data from the fertilizer bagging unit, followed by a data preprocessing phase to ensure accuracy, completeness, and consistency. The refined dataset is then used to train four ML models. These models are evaluated using performance metrics, including the coefficient of determination (R2), Mean Absolute Error (MAE), Root Mean Squared Error (RMSE), and Relative Absolute Error (RAE). The model demonstrating the highest predictive accuracy is selected for further enhancement through hyperparameter tuning.

2.6. Model Configuration for ML

Table 1 presents the key configuration parameters of each ML model used in this study, ensuring the reproducibility of the results and clarifying the experimental setup. These specifications were selected based on theoretical guidelines, empirical evidence, or standard default values available in the WEKA software version 3.9.6. Where applicable, values were tuned through preliminary trials to enhance model performance for the fertilizer bagging prediction task, particularly for hyperparameter optimization.

3. Results and Discussion

3.1. Data Preparation and Sampling

Before developing the predictive model, a thorough review of the dataset was conducted to ensure data quality. The dataset was confirmed to be devoid of missing values and outliers, facilitating the modeling process without additional data cleaning. Data collection took place in May 2025, utilizing a systematic random sampling method. One thousand samples were collected during multiple production shifts at the Urea I Bagging Unit of PT Petrokimia Gresik. Sampling was performed every 30 s, which is equivalent to about every five bags of fertilizer. Systematic random sampling was chosen to strike a balance between randomness and operational simplicity, making it particularly suitable for high-speed production environments. Due to the destructive nature of the sampling, the sample size was intentionally constrained to minimize disruption to the operational flow. Before modeling, a data preprocessing step was undertaken to examine completeness, consistency, and potential outliers.
The dataset was verified to be free from missing values or anomalies, facilitating efficient and accurate model training. Furthermore, the dataset, which comprises nine sensor-based features, was verified as suitable for subsequent ML modeling. The completeness and consistency of the dataset were evaluated using WEKA’s built-in preprocessing tools. Missing value checks were performed using the “Remove with Missing Values” filter, and consistency was verified by analyzing attribute statistics and ranges. Outliers were inspected using the Interquartile Range (IQR) visualization in WEKA’s Explorer. The dataset was confirmed to be clean and ready for modeling, requiring no further correction.
This study provides insight into the collected data. Descriptive statistics were calculated for each sensor variable. Table 2 summarizes the mean, standard deviation, minimum, and maximum values across the dataset. For instance, the air pressure ranged from 7.35 to 11.39 bar (mean = 8.75 bar), the gate valve timing varied from 3.225 to 4.965 s, and the product weight ranged from 49.98 to 50.98 kg (mean = 50.44 kg). These variations, while relatively narrow, reflect multivariate interactions and nonlinear dependencies that justify the use of machine learning for accurate prediction. The summarized statistics confirm that the dataset is both consistent and sufficiently varied for modeling.

3.2. Modeling Framework and Evaluation

This study employed four ML algorithms to predict product weight deviations. Figure 3 illustrates the modeling flow, including stages from sensor data acquisition to evaluation and optimization. All models were evaluated using standard regression evaluation metrics, including the coefficient of determination (R2), MAE, RMSE, RAE, and Root Relative Squared Error (RRSE). The five evaluation metrics were selected to assess the performance of the ML models. The R2 provides a measure of explained variance, giving insight into how well a model captures the underlying data structure [27]. The MAE is less sensitive to significant outliers and represents an intuitive average of the model prediction error [28]. The RMSE penalizes more significant deviations more heavily, which is particularly relevant in industrial settings where such deviations may result in quality defects or financial loss [29]. The RAE and RRSE are normalized metrics, offering standardized error comparisons between models independent of scale [30]. Employing these five complementary metrics enhances the credibility of the model evaluation by providing a robust view of predictive precision, stability, and practical relevance to real-world fertilizer bagging operations.

3.3. Benchmark Comparison with Existing Manufacturing Models

While the fertilizer industry has seen limited applications of predictive modeling, similar approaches have been explored in other manufacturing sectors. One relevant benchmark comes from a previous study which developed a data-driven predictive maintenance framework for injection molding operations [31]. Although the study’s focus was on anticipating machine failures, the underlying methodology leveraging multivariate sensor data and machine learning models like RF and SVM closely aligns with the approach used in this study. The key difference lies in the outcome variable: the previous study targeted the machine health status [31], while this research predicts the continuous product weight. Moreover, this study expands upon the existing methodology by incorporating feature importance analysis, hyperparameter tuning, and real-time integration into an IoT-enabled Smart Bagging System with automatic parameter adjustment. In contrast, the benchmark model lacked interpretability features and did not propose a feedback-based control architecture. Although a direct experimental comparison is not possible due to differences in the process type and data availability, the previous work offers a conceptual baseline. It highlights how predictive analytics can be adapted across domains, while this study further contributes by applying such models to continuous quality control in fertilizer packaging [31].

3.4. Comparative Model Performance

All models in this study were evaluated using 10-fold cross-validation, as it is effective in producing stable and generalizable performance estimates across various model types. Cross-validation is a statistical method used to evaluate the performance of a model or algorithm, where the data is divided into two subsets: training data and test data. Ten-fold cross-validation is recommended for best model selection because it tends to provide less biased accuracy and reduces the potential for overfitting estimates compared to regular cross-validation, leave-one-out cross-validation, and bootstrapping. In 10-fold cross-validation, the data is divided into 10 equal-sized subsets, allowing for the evaluation of the model’s or algorithm’s performance in 10 separate subsets. In each of the ten subsets of data, cross-validation will use nine folds as training data and one fold as test data [32,33]. It is commonly applied in linear and nonlinear ML frameworks [30].
Table 3 presents the results of model validation using ten--fold time series cross-validation. Cross-validation is a standard statistical method for evaluating model performance by separating data into training and testing subsets. This study selected 10-fold cross-validation due to its lower bias and greater stability in estimating model accuracy compared to the leave-one-out or bootstrapping techniques [34].
The accuracy of the research results is evaluated by measuring the closeness of the measurement results to the target value, as indicated by the RMSE value. A smaller RMSE value suggests that the model is more accurate [35]. The selection of the best model is also based on its correlation coefficient, or R2, which is a statistical measure that describes a linear relationship between variables. The correlation coefficient determines how strong the relationship between the variables is; the correlation coefficient value is in the range of −1 to 1, and a correlation coefficient value that is closer to 1 indicates a stronger relationship between the variables [36]. The formulas for calculating these three evaluation indexes are shown in Equations (1)–(3) [37].
M A E = 1 m 1 m y i y p i
R M S E = 1 m 1 m y i y p i 2
R 2 = 1 1 m ( y i y p i ) 2 1 m y i 1 m 1 m y i 2
where m is the number of samples, y i is the sample observation, and y p i is the predictive value [37].
The RMSE value for each model is ANN, 0.0680; RFR, 0.0492; LR, 0.0775; and SVR, 0.0773. The results show that each model has a different accuracy value. The highest correlation coefficient values are for RFR at 0.9648, ANN at 0.9360, SVR at 0.9154, and LR at 0.9077. The MAE can also measure the prediction model’s accuracy. The more accurate the prediction model, the closer its value will be to zero. The MAE value for each prediction model is 0.0517 for the ANN, 0.0328 for RFR, 0.0545 for LR, and 0.0468 for SVR. The diagnostic model that has the highest accuracy in supporting bagging performance analysis is RFR with the smallest RMSE value of 0.0492, the correlation coefficient closest to 1 of 0.9648, and the smallest MAE value of 0.0328.
In addition to reporting standard performance metrics such as the R2, RMSE, and MAE, future studies will incorporate statistical significance testing and confidence intervals to strengthen the reliability of the model evaluation. In this study, the RFR model achieved a high R2 value of 0.9648. While this indicates strong predictive capability, it also raises the possibility of overfitting. To mitigate this, the RFR model was already trained using cross-validation and hyperparameter tuning using parameters such as the number of estimators and maximum depth. Furthermore, the model was evaluated on unseen test data to confirm generalization performance. Specifically, the unseen data refer to the 10% testing subset in each fold of the 10-fold cross-validation. The unseen data serve to assess the model’s ability to generalize, as they consist of previously unseen samples that were not used during training. However, to further ensure robustness, the integration of additional regularization techniques and statistical validation methods will be considered in future model iterations.

3.4.1. Wilcoxon Test

To strengthen the reliability of the findings that show that RFR is the best model, a Wilcoxon signed-rank test was conducted on the R2 values across 10-fold cross-validation to compare RFR with the other models.
As shown in Table 4, the p-values for comparisons between RFR and the ANN (p = 0.001953), RFR and SVR (p = 0.001953), and RFR and LR (p = 0.027344) are all below the significance threshold of 0.05. These results confirm that the improvements made by RFR are statistically significant. Thus, the selection of RFR as the most accurate and reliable model is not only supported by the evaluation metrics but also validated through inferential statistical analysis.

3.4.2. Real-Time Feasibility

To evaluate the feasibility of deploying ML models in real-time industrial IoT environments, the training time and average inference latency were measured for each model. Experiments were conducted on Google Colaboratory with a standard cloud CPU environment, simulating a lightweight edge computing device. As presented in Table 5, RFR demonstrated the highest training time (0.1461 s) and inference latency (12.0408 ms per bag). In comparison, LR achieved the fastest inference (1.2288 ms) with minimal training time (0.0022 s).
Despite RFR having slightly higher latency, all models achieved per-bag prediction times of well under 20 ms, indicating strong compatibility with real-time industrial applications. These results confirm that the selected model, especially RFR, which offers the best predictive performance, is suitable for practical deployment in bagging systems without introducing delays in operational workflows.

3.5. Attribute Importance and Interpretability

After identifying RFR as the most accurate model, an analysis of attribute importance was conducted to determine which variables had the most significant impact on the model predictions. This step is essential for understanding how the model makes decisions and identifying actionable parameters for process improvement. RFR computes attribute importance based on the mean decrease in impurity across all trees in the ensemble, which reflects how much each attribute contributes to reducing prediction error. As shown in Table 6, the clamping time emerged as the most critical variable, with an essential score of 0.37, followed by air pressure, with a score of 0.34. These two variables alone contributed more than half of the model’s predictive power.
The dominance of the clamping time and air pressure can be attributed to their direct influence on the mechanical aspects of the bagging system. The clamping time regulates how long fertilizer flows into the bag, directly determining the weight of each unit. The air pressure controls the pneumatic mechanisms that operate clamps and gates, ensuring consistent flow and sealing. Their impact aligns with previous findings highlighting time-based and force-based parameters as key contributors to performance variability in automated packaging systems [38]. In contrast, other attributes such as humidity, vibration, temperature, and dust concentration had considerably lower importance scores. While these factors may contribute to variability, their effects appear to be secondary to those of clamping and pneumatic control settings. This insight allows decision-makers to focus control and optimization strategies on the most influential variables, potentially simplifying monitoring systems and reducing computational complexity. Interpreting attribute importance enhances model transparency and supports the development of adaptive control systems in smart manufacturing. With this understanding, the proposed Smart Bagging System can prioritize dynamic adjustments to the clamping time and air pressure in response to real-time process conditions.
In this study, RFR’s built-in feature importance was used to evaluate the contribution of each variable to the predictive model. While more advanced and model-agnostic methods, such as SHAP values or permutation importance, could provide deeper interpretability, these were not applied due to the practical focus of this research [39]. This study prioritized methods that are computationally efficient, easily integrated into real-time industrial systems, and aligned with the operational understanding of the process [6,40]. Additionally, as shown in Table 7, a comparison table of RFR importance, SHAP values, and permutation importance is included to provide theoretical insights into their differences. The use of alternative interpretability techniques will be considered in future studies to enrich feature analysis and validate consistency across methods.

3.5.1. Ablation Analysis

As a further test of the model’s resilience to input variations, ablation analysis was performed on each input variable. This analysis aims to determine the contribution of each feature to the model’s predictive performance. The process is carried out by removing one feature at a time (one factor at a time), then measuring the change in the coefficient of determination (R2) value. The R2 value indicates how well the model explains the variation in the target variable. The difference between the R2 of the full model and the R2 after the feature is removed is referred to as ΔR2. The greater the ΔR2 value, the greater the role of the feature in maintaining model performance.
The results of the analysis are presented in Table 8. Generally, the removal of one feature does not result in a significant decrease in performance, indicating that the model exhibits good stability. Feature X7 exhibits the largest negative ΔR2 (−0.0239), suggesting that it may have the potential to cause overfitting. Other features, such as X2, X3, and X9, have a small ΔR2 but still contribute to accuracy. Meanwhile, features such as X6 and X8 show very minimal or no impact on the model’s prediction performance.
Although the ablation results indicate that the removal of features X4 (air pressure) and X7 (clamping time) does not result in a significant decrease in the R2, both features are retained in the model. This is due to their high contribution to the RFR feature importance results (0.34 and 0.37, respectively), as well as their strong technical relevance in the fertilizer packaging industry process. The air pressure affects the speed and stability of the material flow during packaging filling, while the clamping time is directly related to the sealing process and the potential for product weight imbalance. Therefore, although the model’s sensitivity to these features is not statistically extreme, their importance in process monitoring and control remains high. By retaining these two variables, the model not only maintains good prediction accuracy but also increases its potential for practical application in real operational environments.

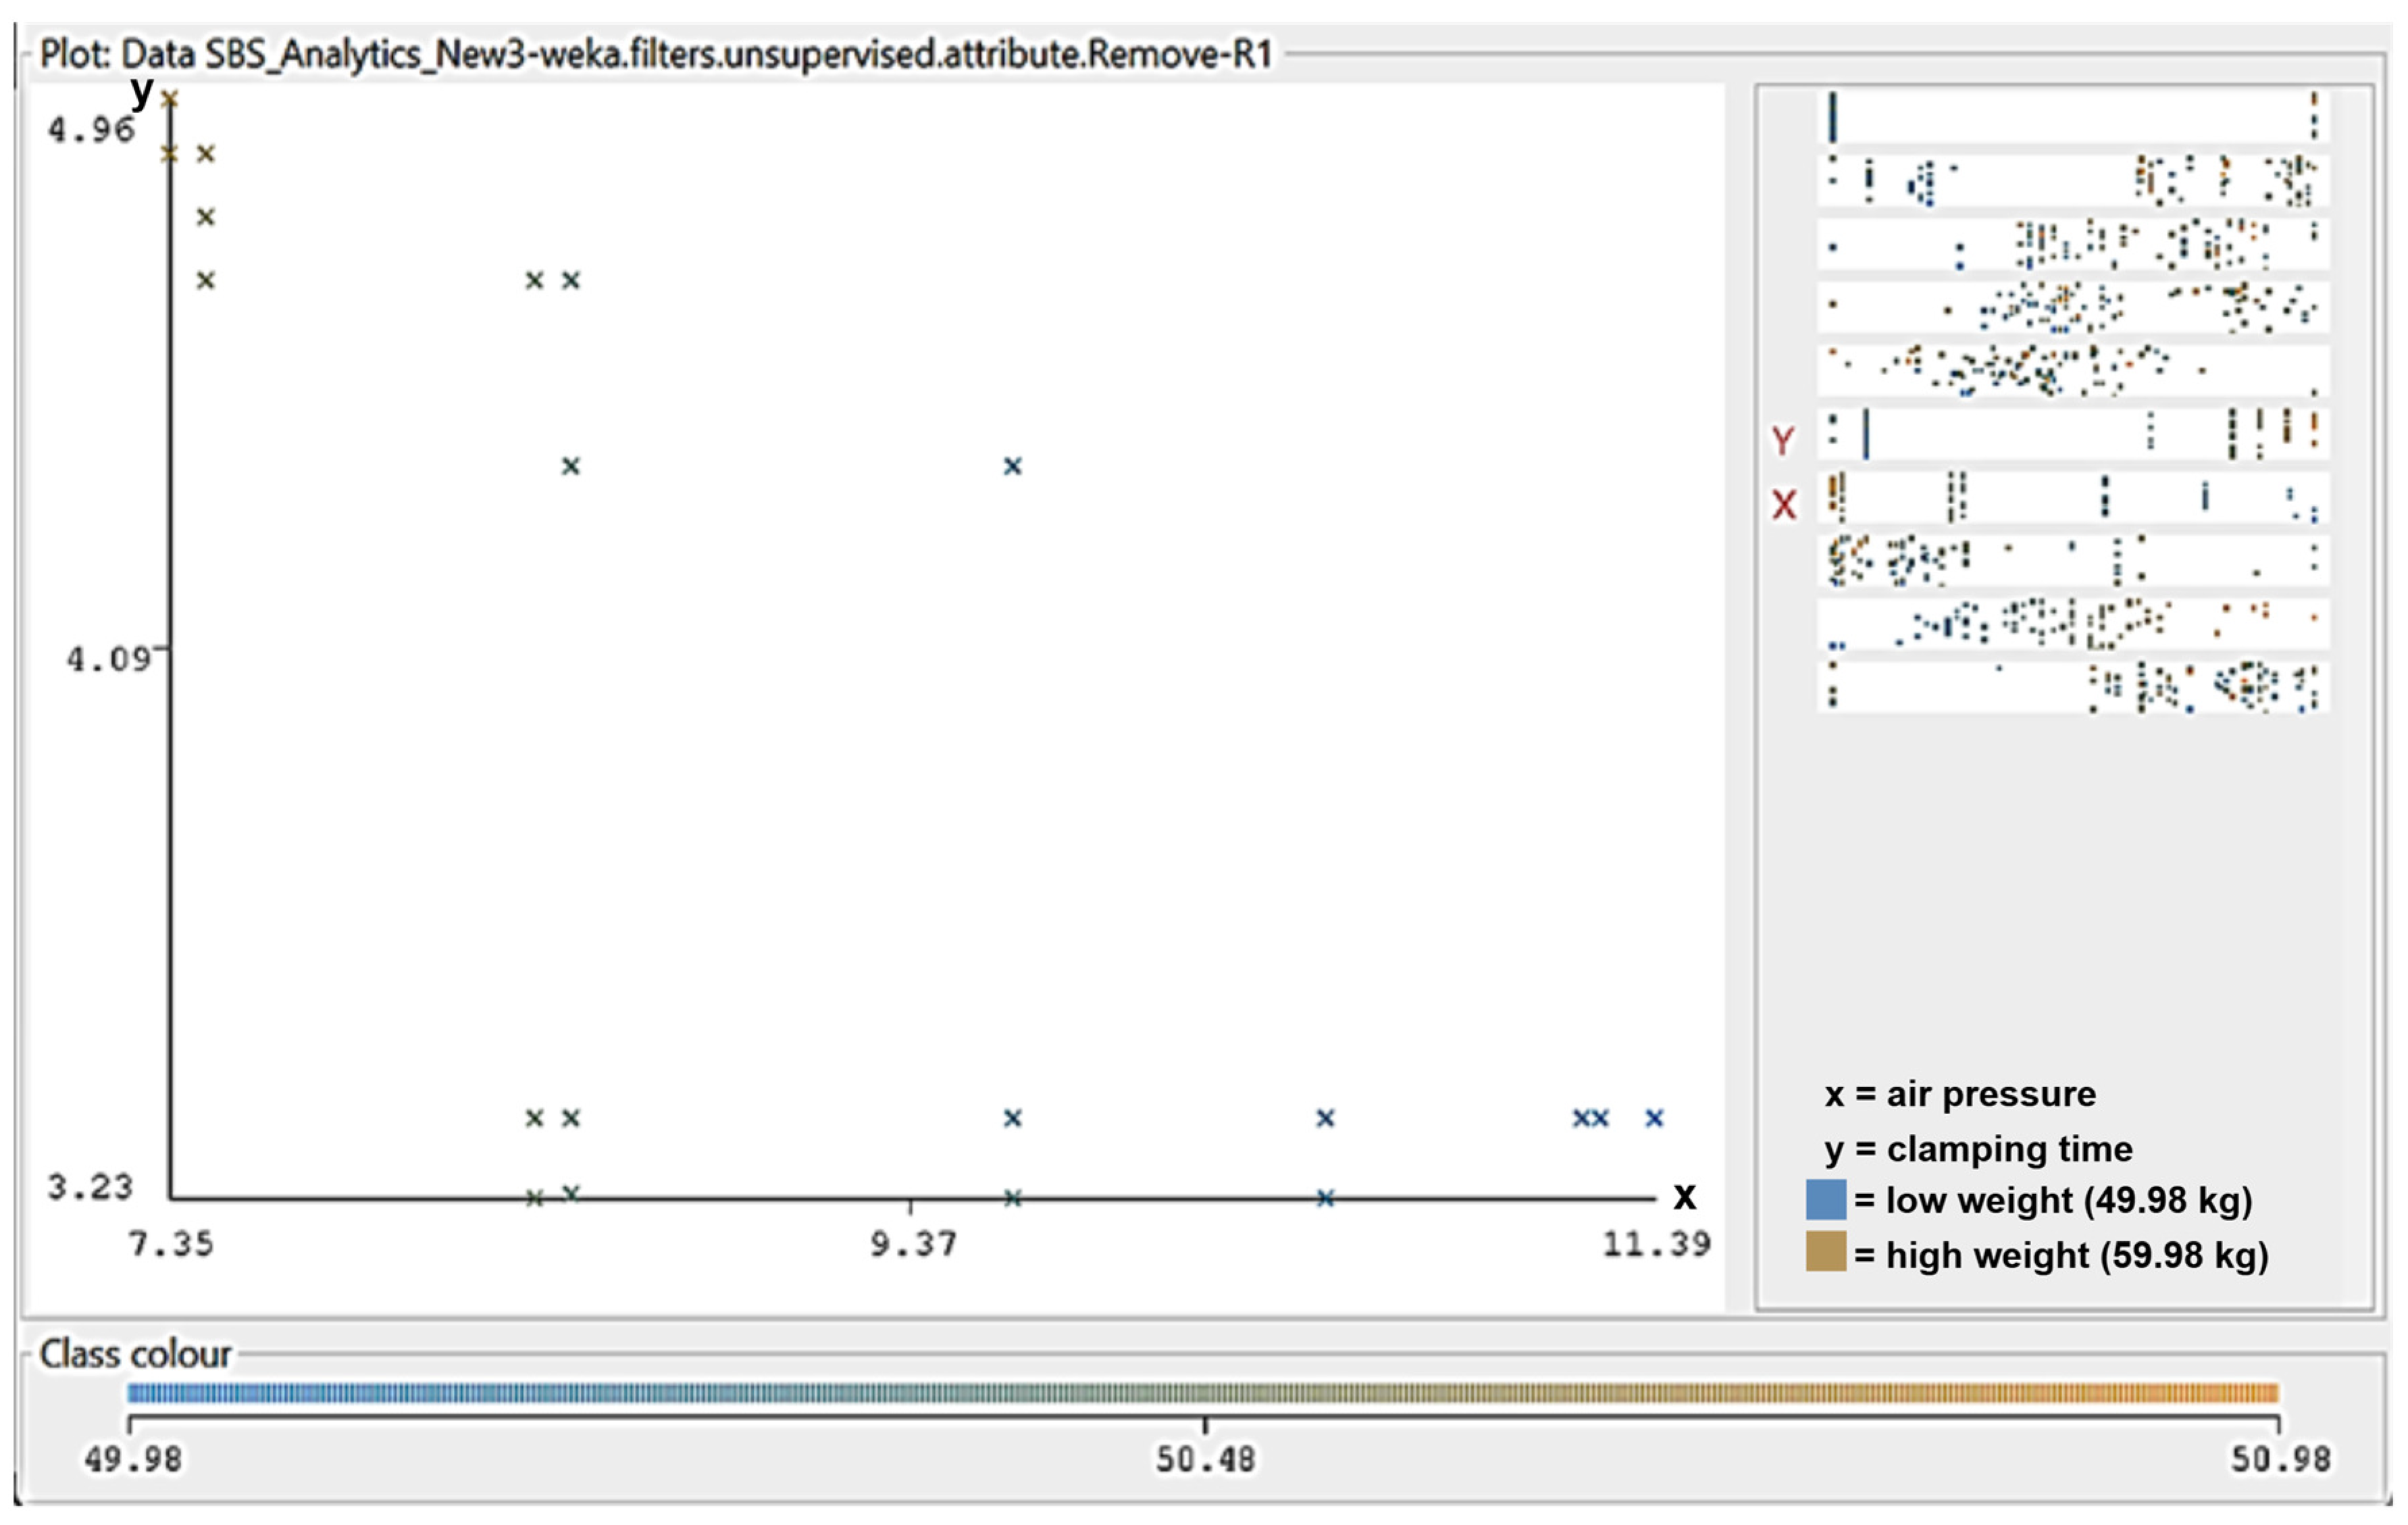
3.5.2. Clamping Time and Air Pressure

Based on the attribute importance results obtained from the RFR algorithm, the clamping time and air pressure have the most significant influence on the fertilizer bagging machine’s performance, with importance values of 0.37 and 0.34, respectively. The clamping system regulates the opening and closing times of the fertilizer flow from the bucket to the bag. The bagging time must be accurate to ensure the bag is filled correctly and to prevent overfilling or underfilling. The clamping system operates with the assistance of an operator. When the operator places an empty bag between the clamp and presses the operation button, the clamp holds the bag, and then the bucket valve opens to allow fertilizer to flow into the bag. After a specified time, the clamp releases the bag, and the bucket valve closes. Similarly, the air pressure governs the pneumatic control system that actuates mechanical components, including the clamp and flow valves. It is managed via solenoid valves and pistons, ensuring smooth and responsive bagging operations.
While the clamping time is predefined in the system settings, this study observed a variation in the actual clamping time, ranging from 3.23 to 4.96 s, due to operational dynamics. The bagging system at PT Petrokimia Gresik operates in a semi-automated configuration, where adjustments may occasionally be made by the operator based on real-time conditions such as product flow, bag positioning, or machine responsiveness. Although the system is equipped with a preset value, the operator may manually reconfigure the clamping time when the check weigher indicates that fertilizer weight has deviated from the 50.2–50.4 kg standard. If the weight remains within range, these parameters are typically left unchanged. Similarly, the variation in air pressure (7.35 to 11.39 bar) is due to a combination of functional system design and machine condition variability. Pressure changes may occur due to intentional adjustments by the operator or fluctuations in pneumatic system performance, such as valve wear or inconsistent actuator responses. As with the clamping time, the pressure is only readjusted when the check weigher data shows a consistent deviation in the product weight; otherwise, it remains untouched. These characteristics highlight a limitation in the existing system, which relies heavily on manual intervention and reactive adjustments.
The relationship between these two variables and fertilizer weight is illustrated in the scatter plot shown in Figure 4. Each point represents a bagging event, where the x-axis denotes air pressure, the y-axis denotes the clamping time, and the color indicates the resulting fertilizer weight ranging from 49.98 to 50.98 kg. No clear linear or monotonic trend is observed, and the color gradient does not align along a specific axis. This suggests that the clamping time and air pressure independently affect the bagging outcome and that their influence on fertilizer weight is complex and nonlinear.
The plot reveals an optimal range, particularly within 4.2 to 4.5 s of clamping time and 9 to 10 bar of air pressure, where the resulting weight is consistently within the target range. Outside this region, the greater dispersion in color indicates increased variability in weight, which may be attributed to operator-induced parameter changes or fluctuating system performance. The findings highlight the suitability of employing an ML methodology, specifically RFR, to model these interactions. RFR can capture nonlinear, multivariate dependencies without assuming parametric relationships [31]. By comprehending the mechanical functions and the independent effects of the clamping time and air pressure, manufacturers can implement specific process enhancements to improve accuracy and minimize variation in bagging performance. These findings further justify the use of ML, particularly RFR, which can model nonlinear, independent relationships between input features and the target variable [31]. Through a comprehensive understanding of the mechanical foundations and empirical behaviors of these attributes, practitioners can implement targeted enhancements to improve bagging consistency and mitigate process variability.

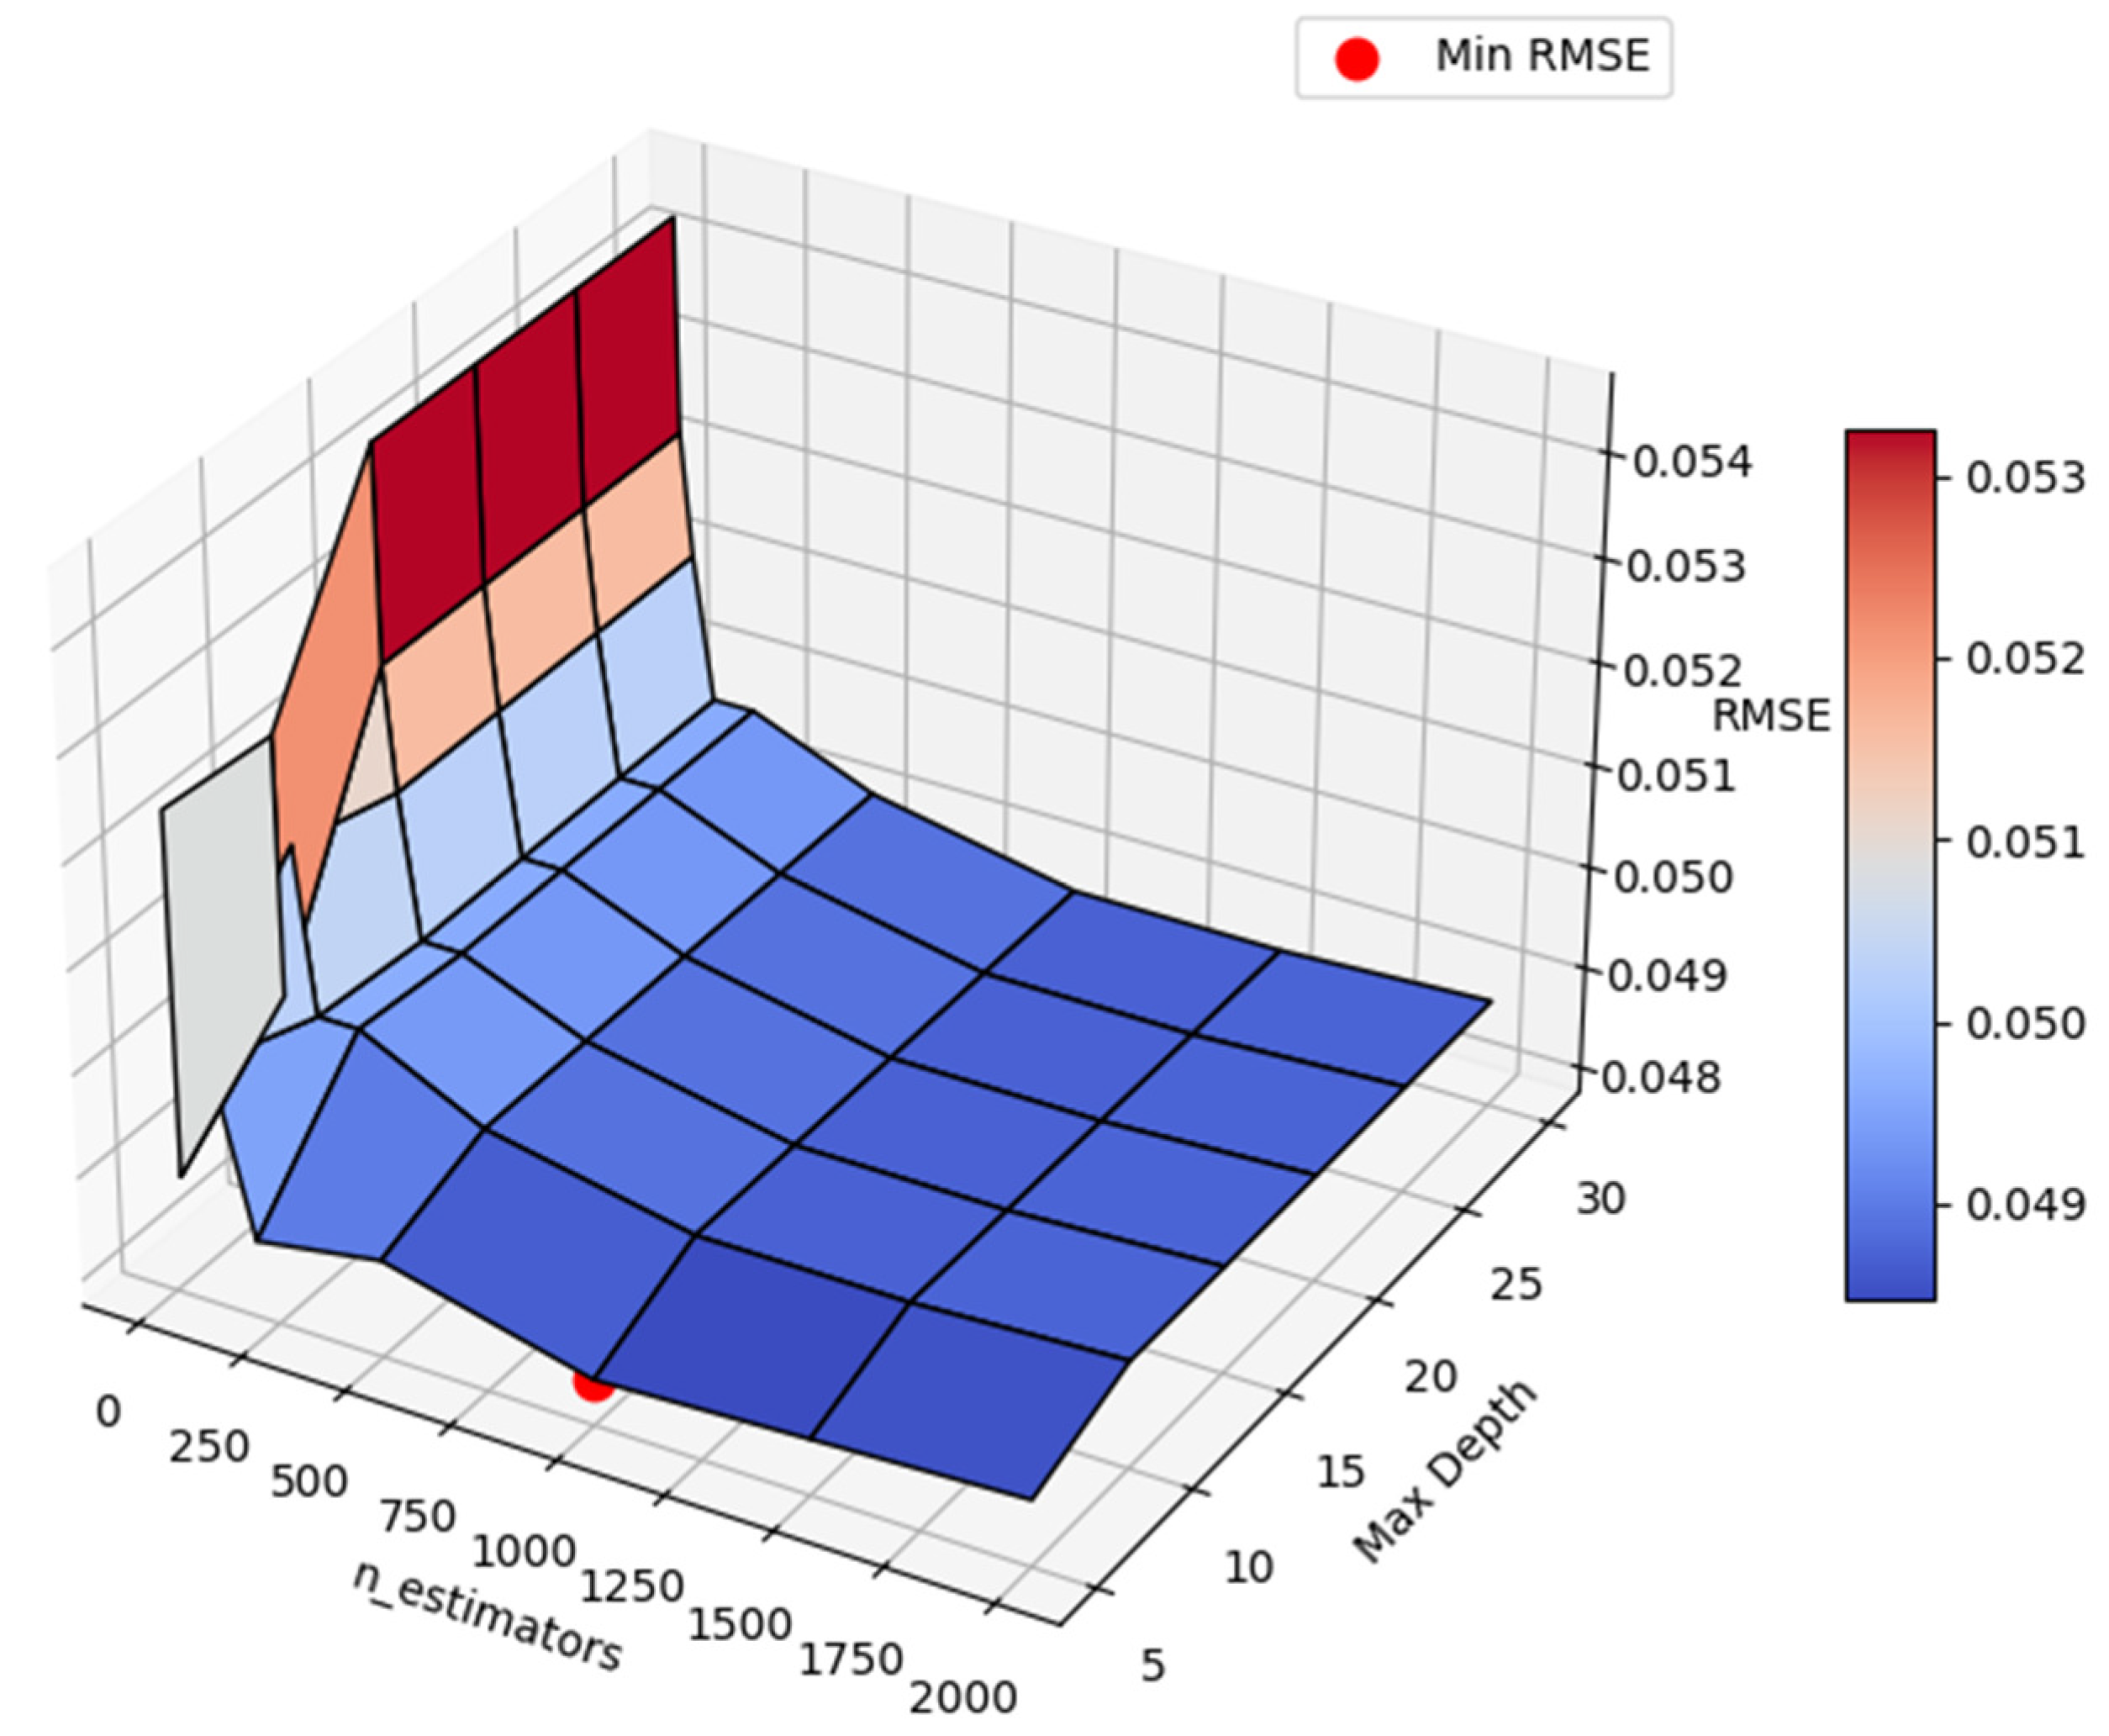
3.6. Hyperparameter Tuning and Optimization

To enhance the predictive accuracy of the model, hyperparameter tuning was conducted on the RFR model by modifying the number of trees (n_estimators) and the maximum tree depth (max_depth). Table 9 presents the RMSE values corresponding to various combinations. Optimal performance was achieved with n_estimators = 1000 and max_depth = 5, resulting in the lowest Root Mean Squared Error (RMSE) of 0.0482. Applying hyperparameter tuning to RFR reduced the RMSE value from 0.0492 (without tuning) to 0.0482, equivalent to a decrease of about 2%. This decrease was calculated using the formula in Equation (4).
% decrease = I n i t i a l   V a l u e F i n a l   v a l u e I n i t i a l   v a l u e × 100
% decrease = 0.0492 0.0482 0.05 × 100
% decrease = 0.0017 0.05 × 100 = 2 %
The results of the hyperparameter tuning process are illustrated in the surface plot presented in Figure 5, where the x-axis represents the number of trees (n_estimators), the y-axis represents the maximum tree depth (max_depth), and the z-axis shows the resulting RMSE values. The color gradient from red (high RMSE) to blue (low RMSE) visually highlights performance variations across different parameter configurations. The plot shows that the lowest RMSE value (0.0482) occurs at n_estimators = 1000 and max_depth = 5, as marked by the red dot labeled Min RMSE. It is evident that increasing the parameters beyond n_estimators = 1000 and max_depth = 5 does not significantly enhance the model’s accuracy. This observation indicates that the model has achieved an optimal bias–variance trade-off at this configuration. Such tuning enhances computational efficiency by reducing the likelihood of overfitting while maintaining high-quality predictions, making the model appropriate for real-time or production-level applications [42].

3.7. IoT and Real-Time Monitoring Implementation in Bagging System

This section outlines the proposed design and ongoing development of a Smart Bagging System that integrates IoT technology and machine learning for real-time monitoring and control. While the title refers to implementation, it is essential to note that the current stage of this research is still in the development phase. The proposed system architecture is designed to support the continuous monitoring of critical bagging parameters, such as the clamping time and air pressure, which have been identified as key variables through attribute importance analysis. Real-time sensor data is collected and processed by a controller, then passed to a predictive model using RFR to estimate the expected fertilizer weight. If a deviation from the target range (50.2–50.4 kg) is detected, the system initiates a feedback loop to adjust the relevant parameters accordingly. Currently, the system primarily operates using a pre-trained offline model. Still, it is now being enhanced with online learning capabilities, where new data is continuously collected and periodically incorporated into model retraining cycles.
The conceptual workflow is illustrated in Figure 6. The process begins with setting up influential process parameters in the system. Sensor devices installed in the Urea I Bagging Unit collect real-time data related to these parameters. A controller unit then processes the raw data to ensure consistency and accuracy before forming a structured dataset. Once the dataset is formed, it is analyzed using the trained machine learning model. RFR is used to predict the expected fertilizer weight in each bag. The predicted result is evaluated against a predefined weight standard of 50.2–50.4 kg. If the prediction indicates a deviation, the system initiates a feedback loop to readjust the process variables. If the predicted weight falls within the acceptable range, the system continues without intervention. At the current stage, the proposed system is developed based on offline-trained models using historical production data. However, in future work, an online learning mechanism will be integrated, allowing the model to adapt to changing conditions by periodically updating itself with new data. To maintain time efficiency and system responsiveness, these updates will be scheduled during low-production periods to avoid delays in the real-time monitoring process.
The implementation of the IoT enhances the transparency, traceability, and flexibility of the bagging system. It supports predictive maintenance by identifying abnormal patterns in mechanical behavior before failures occur, thus reducing downtime and the associated costs [6]. This architecture enhances the feedback loop within the proposed Smart Bagging System by facilitating closed-loop control driven by real-time predictive analytics. Consequently, the system responds and anticipates process variations, transforming conventional fertilizer bagging into an intelligent and adaptive operation.

3.8. Bagging System Improvement

Based on the predictive results and IoT infrastructure, this study proposes an improvement to the bagging system, known as the Smart Bagging System, which integrates ML models with a closed-loop control mechanism. This system aims to autonomously monitor, predict, and adjust operational parameters to minimize inconsistencies in fertilizer weight. This research aims to develop an auto-adjusting system known as the Smart Bagging System. This system’s primary function is to continuously monitor the conditions associated with the bagging process. The system is designed to automatically adjust these parameters if there is a fluctuation in the variables that significantly influence the bagging process, specifically the clamping time and air pressure. This methodology ensures that the fertilizer weight remains within the 50.2 to 50.4 kg target range. As illustrated in Figure 7, the control block diagram of the Smart Bagging System initiates with a predefined set point for the fertilizer weight. The main controller subsequently generates a control signal based on feedback received from the actuator. This control signal effectively regulates the two critical variables identified through the RFR analysis: the clamping time and air pressure. Furthermore, within the actuator, the system incorporates an open-loop control mechanism for the clamping time and a closed-loop control mechanism for the air pressure.
The open-loop control system relies on input from the control signal produced by the main controller, which the clamping controller processes to manage the timing of the clamping device’s opening and closing. In the closed-loop control system, the input from the control signal generated by the main controller is then processed by the gate valve controller to regulate the air pressure. The feedback signal in the closed-loop control system utilizes a pressure sensor that provides information about the actual air pressure conditions within the bagging system. Both actuators regulate the plant in the form of a bag-filling weigher as an under-control system. The weigher will then weigh the fertilizer before it is bagged according to the set point determined by the actuator. The output from the bag-filling weigher is the actual weight of the bagged fertilizer. In a closed-loop system, a measurement system is employed; in this case, the check weigher is used to read the weight of the fertilizer in the bag. The results of the fertilizer weight reading are then used as a feedback signal to the main controller, ensuring that the fertilizer weight follows the set point. This system will operate continuously; if there is a discrepancy, it will adjust until it aligns with the standard. This continuous feedback system supports full automation, reduces human error, and minimizes the risk of weight inconsistency. It allows real-time corrections based on predictive signals and feedback loops, representing a significant advancement in smart manufacturing. This modular and scalable architecture ensures that it can be applied to multiple production lines or adapted to other industries with similar operational demands.

3.9. Economic Impact Analysis

This section estimates the potential economic benefits of implementing the Smart Bagging System. The average excess weight of the product was 0.3 kg per bag. With a production of 20,600,000 bags per year, based on the PT Petrokimia Gresik Annual Report, and a global urea price per 2024 of USD 330/ton [40], there is estimated to be a potential loss of around USD 2 million or IDR 30.6 billion annually. These calculations assume an exchange rate of IDR 15,000 per USD, as recorded in September 2024 by Bank Indonesia [42]. The details of the potential savings are as follows:
  • Total losses per year:
    0.3 kg × 20,600,000 bags = 6,180,000 kg
    6180 tons × USD 330 = USD 2,039,400
    USD 2,039,400 × 15,000 = IDR 30,591,000,000
  • The amount of savings from implementing ML assumes that the excess bag weight is reduced by up to 95%. This is based on the RMSE accuracy value of 4.83% (as the average prediction error per bag), then
0.3   k g ( 0.3   k g × 4.83 % ) 0.3   k g × 100 % = 95.17 %
3.
Thus, the current losses are as follows:
6180 tons × (1–0.95) = 309 tons
309 tons × USD 330 = USD 101,970
USD 101,970 × 15,000 = IDR 1,529,550,000
4.
The estimated cost of implementing ML is around IDR 300,000,000–450,000,000 for cloud data storage, software development teams, sensors, and the IoT. Based on the straight-line depreciation method, the asset value will be divided evenly each year, assuming an economic life of three years.
Thus, annual depreciation is as follows:
450,000,000 3 = 150,000,000   I D R / y e a r
The annual cost of implementing ML is IDR 150,000,000. Additionally, the annual maintenance costs are estimated at IDR 100,000,000. The total savings of ML implementation are shown in Table 10.
Implementing ML can reduce weight loss by up to 95%, saving up to IDR 29 billion in development costs. These results suggest that the system has a rapid return on investment and a substantial long-term economic impact. Furthermore, the IoT, ML, and automation align with national strategies for digital transformation in the fertilizer industry, encouraging broader adoption across other industrial sectors.
A significant limitation of the economic approach employed here is the simplified assumptions used in the cost–benefit calculation. The analysis employs linear depreciation for the asset, disregarding operational risk, variability in system maintenance requirements, and potential downtime costs. This simplification can skew the estimates of economic benefits or be overly optimistic, as unexpected expenses can arise from real factors, such as sudden operational disruptions or fluctuating maintenance frequencies. Previous research has shown that including downtime costs and system reliability factors in the analysis can significantly change the results of the economic evaluation of a maintenance strategy [43]. Thus, the interpretation of the economic findings of this study should be conducted with caution, given the limitations of these assumptions.

3.10. Model Generalization and Transferability

This model has currently only been tested on the Urea 1A bagging process at PT Petrokimia Gresik. However, the input features (X1–X9) used are general and commonly found in similar industrial systems. Process variables, such as temperature, humidity, water content, wind pressure, and dust content, are typically available in various production lines, ensuring that the model input scheme is not dependent on the unique characteristics of a single plant. In the context of sensors, the approach of using measurement variables to predict quality variables (output) has been widely applied in various process industry sectors [39] Therefore, conceptually, this model can be applied to other datasets with similar types of processes.
Additionally, the model has been trained and validated using data from multiple shifts at various times, encompassing a range of daily operating conditions. Training data that covers a variety of conditions helps the model recognize more basic patterns of the process. A general principle of ML states that the more diverse the conditions in the training data, the better the model’s ability to generalize to new data [41]. In other words, exposure to high operational variability during training makes the model more robust and able to provide accurate predictions on new data that has never been seen before. This is in line with the definition of generalization in ML, which is the ability of a model to predict well using data that has never been seen before, as long as it still comes from a distribution similar to the training data [44].
In general, predictive models generated from a dataset tend to be specific to that dataset and may not be directly applicable to other processes without adjustment [45] New model development is usually required if the process characteristics differ significantly. However, since the input features used by these models are relatively universal, differences between similar datasets are unlikely to be fundamental. Transfer learning techniques can be used to adapt a model to a new, related dataset, allowing existing models to be reused with minimal additional training compared to building a model from scratch. Transfer learning itself aims to store the knowledge gained from the source domain and apply it to a similar target domain. This approach is effective in reducing the time and effort required for modeling development in similar industrial processes. Thus, these models have great potential to be applied to other similar datasets with minimal adjustments while still achieving good prediction performance [45].

4. Novelty and Research Contributions

This study offers several novel contributions to the field of industrial process optimization, particularly in fertilizer bagging systems:
  • Integration of Attribute Importance and Predictive Modeling: This study represents one of the initial efforts to incorporate attribute importance analysis with ML regression techniques, specifically RFR, to identify the most significant parameters influencing bagging performance. Through data-driven feature selection, this research highlights the clamping time and air pressure as dominant control variables.
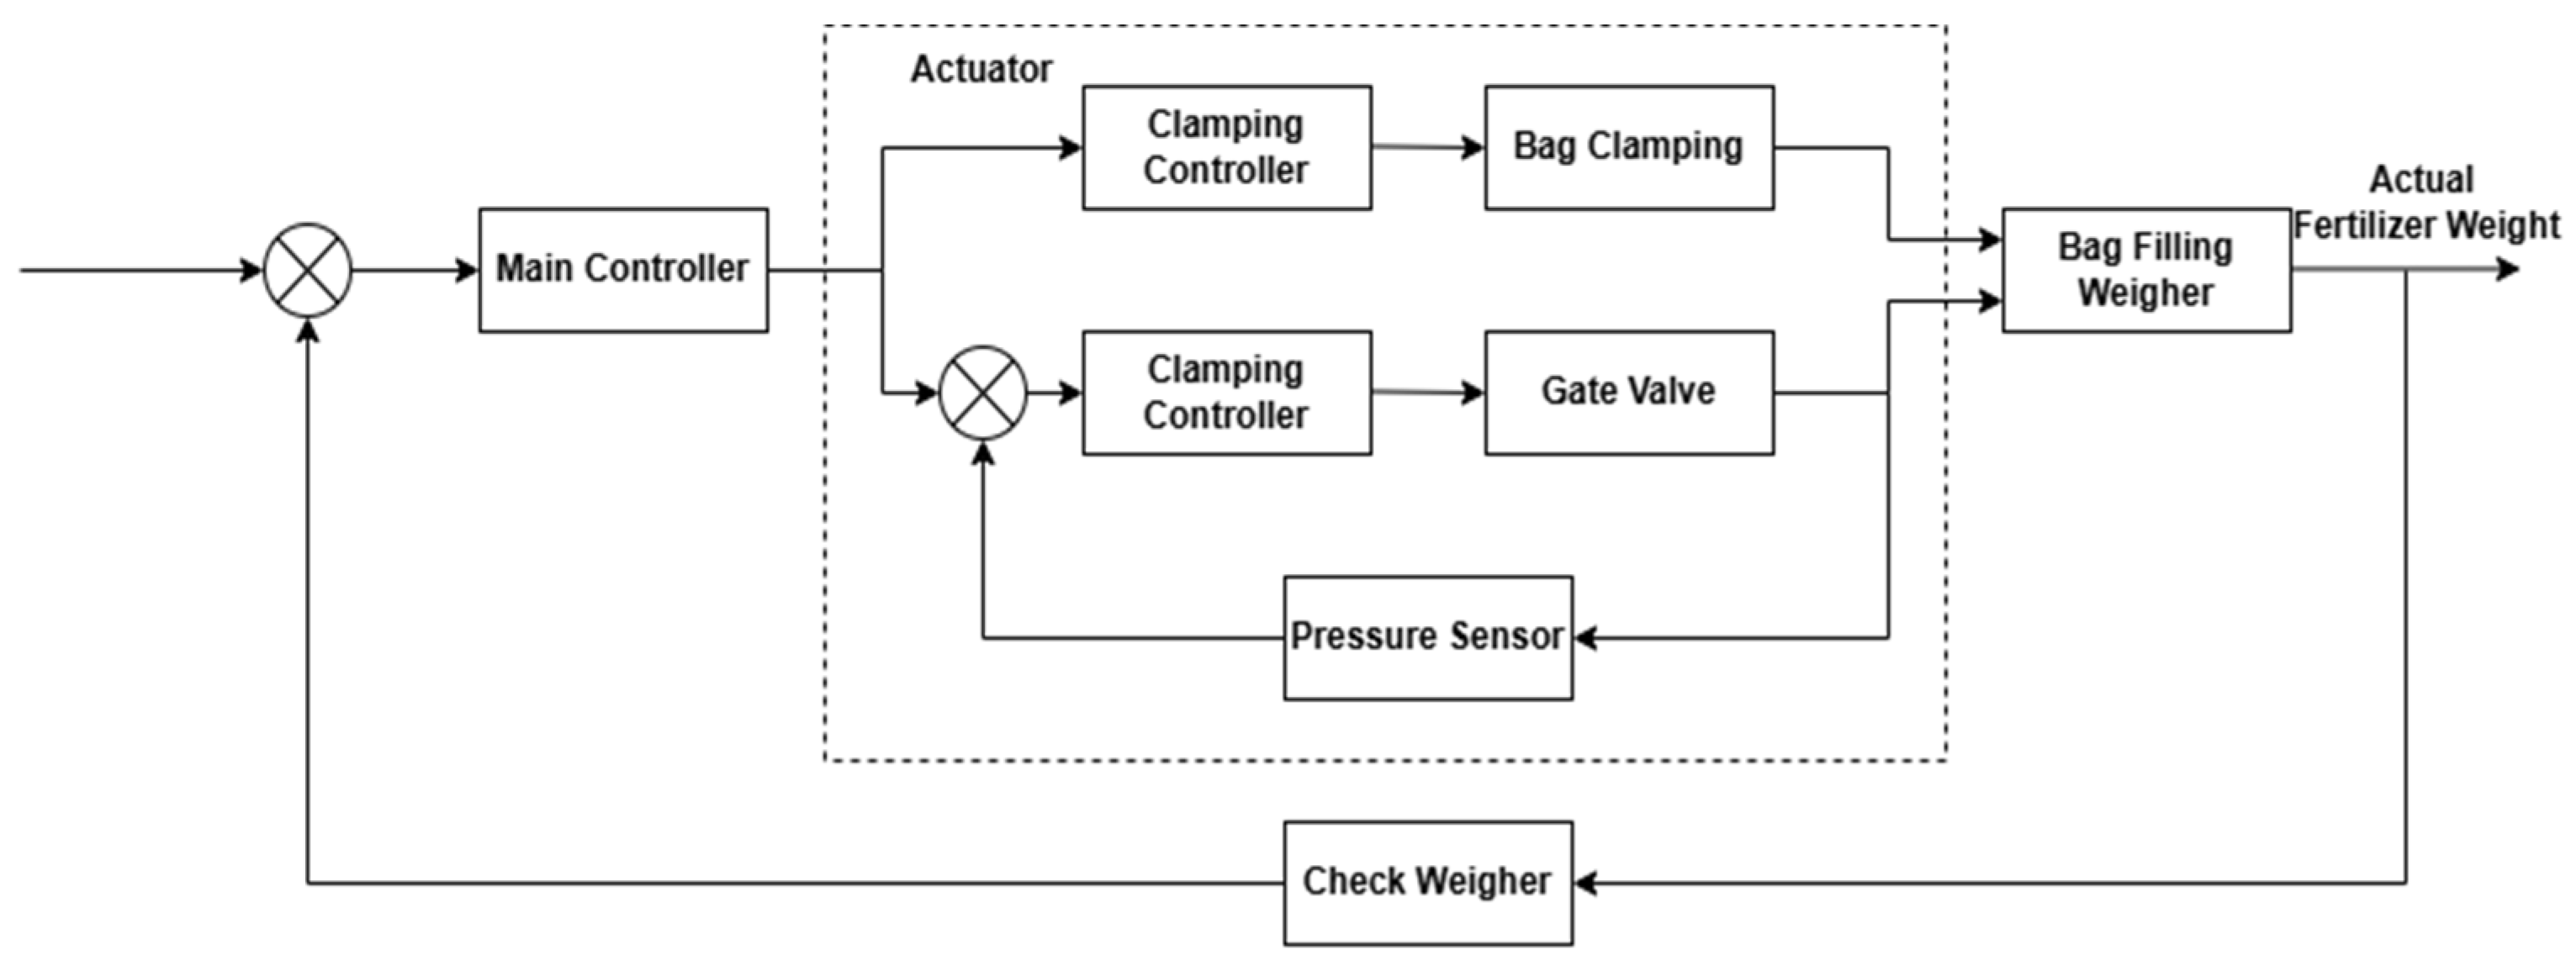
  • Development of an Intelligent Auto-Readjusting System: The proposed Smart Bagging System uniquely combines open-loop and closed-loop control mechanisms to enable the automatic readjustment of real-time bagging parameters. This innovation addresses dynamic variations in production and ensures that product weights remain within the acceptable tolerance range (50.2–50.4 kg).
  • IoT-Based Real-Time Monitoring Architecture: This work integrates IoT architecture with edge computing, enabling low-latency monitoring and predictive adjustment based on live sensor data. Combining the IoT and ML enhances operational agility, traceability, and predictive maintenance.
  • Systematic Evaluation Using Five Performance Metrics: This research employs five different evaluation metrics, the R2, MAE, RMSE, RAE, and RRSE, to ensure a comprehensive assessment of model performance. This multidimensional evaluation enhances the accuracy and reliability of model selection.
  • Substantial Economic Impact for Industrial Implementation: This system could reduce losses by up to 95%, saving around IDR 29 billion annually. This provides direct evidence of the system’s viability for large-scale implementation and highlights its contribution to achieving operational efficiency and sustainability in the fertilizer industry.
  • Supporting SDG 9 and SDG 12: Besides its technical contribution, the Smart Bagging System also aligns with broader industrial development and sustainability goals. The integration of predictive analytics and IoT-based control mechanisms reflects the principle of industrial innovation (SDG 9) by applying intelligent digital solutions in conventional manufacturing environments. The significant loss reduction directly supports sustainable production and consumption (SDG 12) by increasing resource use efficiency in fertilizer packaging. Thus, this research offers technical advances and encourages greener and more responsible industrial practices.
These contributions distinguish this study from prior works by offering a comprehensive, scalable, and intelligent solution supported by predictive modeling, real-time analytics, and economic validation.

5. Conclusions

This study demonstrated the effectiveness of machine learning in predicting fertilizer bagging weight deviations using real-time sensor data. Among the four models evaluated, RFR achieved the best performance, with an R2 of 0.9638 and the lowest RMSE of 0.0482 after tuning. Attribute importance analysis revealed the clamping time and air pressure as the two most influential variables in bagging accuracy. Based on these findings, a Smart Bagging System was proposed, integrating RFR with IoT-based real-time monitoring and hybrid control logic. This system offers predictive capabilities and automated parameter adjustment to minimize weight inconsistency. The model is estimated to reduce fertilizer overfill by up to 95%, potentially saving up to IDR 28.85 billion per year. However, this projection is based on simulation under controlled conditions with a relatively small dataset and assumes consistent sensor accuracy and system stability. Future work should validate these results under actual field conditions and explore operational uncertainties such as environmental disturbances and sensor drift.
The proposed solution has strong managerial relevance. By embedding the system into existing SCADA dashboards, plant managers can monitor key variables, receive real-time alerts, and implement predictive control without requiring significant infrastructure changes. This approach supports informed decision-making, improves production efficiency, and aligns with the industry’s digital transformation goals. In alignment with the United Nations Sustainable Development Goals (SDGs), this research supports Goal 9 (Industry, Innovation, and Infrastructure) by promoting the integration of intelligent systems into industrial manufacturing processes. It also contributes to Goal 12 (Responsible Consumption and Production) by reducing fertilizer overfill and minimizing resource waste, thereby fostering sustainable production practices in the fertilizer industry.

6. Limitations

Although this study demonstrates significant potential in applying machine learning to predict weight deviations in fertilizer bagging systems, several limitations must be considered. First, the amount of data used, as many as 1000 samples, is indeed derived from actual operations, but this amount can still be considered limited in the industrial context because it does not necessarily cover all variations in real conditions, such as environmental changes, different work shifts, or machine interruptions. Second, the system relies heavily on real-time sensor readings, which are susceptible to issues such as sensor drift, calibration inconsistencies, or signal interference that can impact long-term prediction accuracy. Third, the proposed Smart Bagging System has not been tested through long-term field implementation, so its performance stability and resilience to real operational dynamics still need to be further validated. Further research is needed to address these limitations and ensure the feasibility of implementing a widespread and sustainable system in the industry. Regarding sustainability, the system introduces additional sensor devices and requires server-based computation. However, the associated energy consumption is relatively low compared to industrial-scale operations. The substantial reduction in material waste and overfill offsets the environmental cost, aligning the system with the core goals of SDG 12 on responsible consumption and production.

Author Contributions

A.P. conceptualized this research, designed the study framework, collected data, implemented the Smart Bagging System, and drafted the original manuscript. U.C. supervised the research design, validated the methodological framework, contributed to interpreting the results, and provided critical revisions throughout the writing process. B.A.K. contributed to developing and integrating ML algorithms, model tuning, and IoT architecture design and assisted in preparing the analysis scripts. All authors have read and agreed to the published version of the manuscript.

Funding

This research received no external funding.

Data Availability Statement

All data generated or analyzed during this study are included in this published article.

Acknowledgments

The authors would like to express their sincere gratitude to PT Petrokimia Gresik for the technical support, access to operational data, and facilities provided during this research.

Conflicts of Interest

The authors declare no conflicts of interest.

Abbreviations

The following abbreviations are used in this manuscript:
AIArtificial Intelligence
ANNArtificial Neural Network
IDRIndonesian Rupiah
IoTInternet of Things
LRLinear Regression
MAEMean Absolute Error
MLMachine Learning
NPVNet Present Value
PPPayback Period
RAERelative Absolute Error
RFRRandom Forest Regression
RMSERoot Mean Squared Error
RRSERoot Relative Squared Error
SDGsSustainable Development Goals
SVRSupport Vector Regression
USDUnited States Dollar

References

  1. Kumar, I.; Rawat, J.; Mohd, N.; Husain, S. Opportunities of Artificial Intelligence and Machine Learning in the Food Industry. J. Food Qual. 2021, 2021, 4535567. [Google Scholar] [CrossRef]
  2. Expósito, A.; Velasco, F. Exploring environmental efficiency of the European agricultural sector in the use of mineral fertilizers. J. Clean Prod. 2020, 253, 119971. [Google Scholar] [CrossRef]
  3. Beach, N.; Reeve, G.; Marsh, C.; Kilby, P. Optimal Sorting of Product into Fixed Weight Packaging; Compac Sorting Equipment Ltd.: Auckland, New Zealand, 2004. [Google Scholar]
  4. Rahman, C.; Shamsuzzoha, A. Comparative Performance Analysis of Semi-automatic and Automatic cement packing process. In Proceedings of the International Conference on Mechanical Engineering, Orlando, FL, USA, 5–11 November 2005. [Google Scholar]
  5. Ilija, D.; Nada, S.; Nikola, T.; Andreja, R. Statistical process control in serbian food packaging. Int. J. Qual Res. 2014, 8, 323–334. [Google Scholar]
  6. Urea—Price—Chart—Historical Data—News. Available online: https://tradingeconomics.com/commodity/urea (accessed on 15 October 2024).
  7. Li, S.; Sarlioglu, B.; Jurkovic, S.; Patel, N.R.; Savagian, P. Analysis of Temperature Effects on Performance of Interior Permanent Magnet Machines for High Variable Temperature Applications. IEEE Trans. Ind. Appl. 2017, 53, 4923–4933. [Google Scholar] [CrossRef]
  8. Othman, M.H.; Sulaiman, H.; Main, N.M.; Li, L. Strength and Folding Performance of Polypropylene Packaging Samples in Hot Air and High Humidity Condition. Adv. Mater. Res. 2013, 748, 241–246. [Google Scholar] [CrossRef]
  9. Dmitriev, A.; Ziganshin, B.; Khaliullin, D.; Aleshkin, A. Study of Efficiency of Peeling Machine with Variable Deck. 2020. Available online: http://www.tf.llu.lv/conference/proceedings2020/Papers/TF249.pdf (accessed on 11 September 2024).
  10. Ammar, A.R. Effect of dust and sulfur content on the rate of wear of diesel engines working in the Jordanian desert. Alex. Eng. J. 2006, 45, 527–536. [Google Scholar]
  11. McElhaney, K.L. An analysis of check valve performance characteristics based on valve design. Nucl. Eng. Des. 2000, 197, 169–182. [Google Scholar] [CrossRef]
  12. Kelly, A.L.; Woodhead, M.; Coates, P.D. Comparison of Injection Moulding Machine Performance. 2005. Available online: https://bradscholars.brad.ac.uk/handle/10454/3414 (accessed on 10 November 2023).
  13. Llusa, M.; Faulhammer, E.; Biserni, S.; Calzolari, V.; Lawrence, S.; Bresciani, M.; Khinast, J. The effect of capsule-filling machine vibrations on average fill weight. Int. J. Pharm. 2013, 454, 381–387. [Google Scholar] [CrossRef]
  14. Primantara, A.; Ciptomulyono, U.; Al Kindhi, B. Bagging System Performance Analysis Using Artificial Neural Network, Random Forest Regression, Linear Regression, and Support Vector Regression. In Proceedings of the 2024 IEEE International Symposium on Consumer Technology (ISCT), Bali, Indonesia, 13–16 August 2024; pp. 618–622. Available online: https://ieeexplore.ieee.org/abstract/document/10791247 (accessed on 17 January 2025).
  15. Mahalik, N.P. Processing and packaging automation systems: A review. Sens. Instrum. Food Qual. Saf. 2009, 3, 12–25. [Google Scholar] [CrossRef]
  16. Qi, J.; Zhou, P.; Zheng, P.; Wu, H.; Yang, C.; Navarro-Alarcon, D.; Pan, J. Revolutionizing Packaging: A Robotic Bagging Pipeline with Constraint-aware Structure-of-Interest Planning. arXiv 2024, arXiv:2403.10309. [Google Scholar] [CrossRef]
  17. Tercan, H.; Meisen, T. Machine learning and deep learning based predictive quality in manufacturing: A systematic review. J. Intell. Manuf. 2022, 33, 1879–1905. [Google Scholar] [CrossRef]
  18. Kunwar, P.J. Analyzing Sorting and Packaging for Automation and Process Improvement. Available online: https://www.theseus.fi/handle/10024/267106 (accessed on 13 January 2025).
  19. Javaid, M.; Haleem, A.; Pratap Singh, R.; Khan, S.; Suman, R. Sustainability 4.0 and its applications in the field of manufacturing. Internet Things Cyber. Phys. Syst. 2022, 2, 82–90. [Google Scholar] [CrossRef]
  20. Fahle, S.; Prinz, C.; Kuhlenkötter, B. Systematic review on machine learning (ML) methods for manufacturing processes—Identifying artificial intelligence (AI) methods for field application. Procedia CIRP 2020, 93, 413–418. [Google Scholar] [CrossRef]
  21. Qian, P.; Pu, C.; Liu, L.; Luo, H.; Wu, J.; Jia, Y.; Liu, B.; Páez, L.M. Ultra-high-precision pneumatic force servo system based on a novel improved particle swarm optimization algorithm integrating Gaussian mutation and fuzzy theory. ISA Trans. 2024, 152, 453–466. [Google Scholar] [CrossRef]
  22. Zerehsaz, Y.; Sun, W.; Jin, J. Quality prediction using functional linear regression with in-situ image and functional sensor data. J. Qual. Technol. 2024, 56, 195–213. [Google Scholar] [CrossRef]
  23. Legates, D.R.; McCabe, G.J. Evaluating the Use of “Goodness-of-Fit” Measures in Hydrologic and Hydroclimatic Model Validation. Available online: https://agupubs.onlinelibrary.wiley.com/doi/10.1029/1998WR900018 (accessed on 9 April 2025).
  24. Sharma, S.; Shukla, R.; Chauhan, R.; Bhawsar, A. Experimental analysis of particle size distribution using electromagnetic sieves shaker. Int. J. Appl. Res. 2023, 9, 34–39. [Google Scholar] [CrossRef]
  25. Ali, H.I. A Review of Pneumatic Actuators (Modeling and Control). Aust. J. Basic Appl. Sci. 2009, 3, 440–454. [Google Scholar]
  26. Witten, Data Mining. 2016. Available online: https://shop.elsevier.com/books/data-mining/witten/978-0-12-804291-5 (accessed on 9 April 2025).
  27. Refaeilzadeh, P.; Tang, L.; Liu, H. Cross-Validation. In Encyclopedia of Database Systems; Liu, L., Özsu, M.T., Eds.; Springer: Boston, MA, USA, 2009; pp. 532–538. [Google Scholar] [CrossRef]
  28. Feng, H.; Chen, D.; Lv, H. Sensible and secure IoT communication for digital twins, cyber twins, web twins. Internet Things Cyber. Phys. Syst. 2021, 1, 34–44. [Google Scholar] [CrossRef]
  29. Kurnia, M.; Suprapto, S.; Ni’mah, Y.L. Adsorption of Remazol Blue And Indigosol Yellow Mixed Dyes Using Bidara Arab Leaves (Ziziphus spina-christi). Indones. J. Chem. Anal. IJCA 2024, 7, 23–33. [Google Scholar] [CrossRef]
  30. Zhong, Z.; Zhao, S.; Xia, J.; Luo, Q.; Zhou, Q.; Yang, S.; He, F.; Yao, Y. Regression prediction model for shear strength of cold joint in concrete. Structures 2024, 68, 107168. [Google Scholar] [CrossRef]
  31. Farahani, S.; Khade, V.; Basu, S.; Pilla, S. A data-driven predictive maintenance framework for injection molding process. J. Manuf. Process. 2022, 80, 887–897. [Google Scholar] [CrossRef]
  32. Louppe, G. Understanding Random Forests: From Theory to Practice. arXiv 2015, arXiv:1407.7502. [Google Scholar] [CrossRef]
  33. Chen, Q.; Qian, J.; Yang, H.; Li, J.; Lin, X.; Wang, B. Multiscale coupling analysis and modeling of airflow and heat transfer for warehouse-packaging-kiwifruit under forced-air cooling. Biosyst. Eng. 2024, 244, 166–176. [Google Scholar] [CrossRef]
  34. Takefuji, Y. Beyond XGBoost and SHAP: Unveiling true feature importance. J. Hazard. Mater. 2025, 488, 137382. [Google Scholar] [CrossRef]
  35. Deng, S.; Aldrich, C.; Liu, X.; Zhang, F. Explainability in Reservoir Well-logging Evaluation: Comparison of Variable Importance Analysis with Shapley Value Regression, SHAP and LIME. IFAC-Pap. 2024, 58, 66–71. [Google Scholar] [CrossRef]
  36. Mehdiyev, N.; Majlatow, M.; Fettke, P. Integrating permutation feature importance with conformal prediction for robust Explainable Artificial Intelligence in predictive process monitoring. Eng. Appl. Artif. Intell. 2025, 149, 110363. [Google Scholar] [CrossRef]
  37. Brown, M.G.L.; Peterson, M.G.; Tezaur, I.K.; Peterson, K.J.; Bull, D.L. Random forest regression feature importance for climate impact pathway detection. J. Comput. Appl. Math. 2025, 464, 116479. [Google Scholar] [CrossRef]
  38. Probst, P.; Wright, M.N.; Boulesteix, A.L. Hyperparameters and Tuning Strategies for Random Forest. 2019. Available online: https://wires.onlinelibrary.wiley.com/doi/10.1002/widm.1301 (accessed on 10 April 2025).
  39. Shen, Y.; Wang, Z.; Dong, H.; Liu, H. Multi-sensor multi-rate fusion estimation for networked systems: Advances and perspectives. Inf. Fusion 2022, 82, 19–27. [Google Scholar] [CrossRef]
  40. Kurs Transaksi BI. Available online: https://www.bi.go.id/id/statistik/informasi-kurs/transaksi-bi/default.aspx (accessed on 3 December 2024).
  41. Stenström, C.; Norrbin, P.; Parida, A.; Kumar, U. Preventive and corrective maintenance—Cost comparison and cost–benefit analysis. Struct. Infrastruct. Eng. 2016, 12, 603–617. [Google Scholar] [CrossRef]
  42. Kim, M.; Jeong, J.; Bae, S. Demand Forecasting Based on Machine Learning for Mass Customization in Smart Manufacturing. In Proceedings of the 2019 International Conference on Data Mining and Machine Learning, Hong Kong, China, 28–30 April 2019; (ICDMML 2019). Association for Computing Machinery: New York, NY, USA, 2019; pp. 6–11. [Google Scholar] [CrossRef]
  43. Curreri, F.; Patanè, L.; Xibilia, M.G. RNN- and LSTM-Based Soft Sensors Transferability for an Industrial Process. Sensors 2021, 21, 823. [Google Scholar] [CrossRef]
  44. Aliev, T.; Korolev, I.; Yasnov, M.; Nosonovsky, M.; Skorb, E.V. Rosé or white, glass or plastic: Computer vision and machine learning study of cavitation bubbles in sparkling wines. RSC Adv. 2025, 15, 5151–5158. [Google Scholar] [CrossRef]
  45. Arianti, N.D.; Muslih, M.; Sitorus, A.; Bulan, R. Oscillation effect dataset on the measurement accuracy of load-cell sensor applied to the weigh basket. Data Brief 2021, 38, 107453. [Google Scholar] [CrossRef]
Figure 1. Data acquisition architecture.
Agriengineering 07 00187 g001
Figure 2. Sensor placement in the bagging unit.
Agriengineering 07 00187 g002
Figure 3. Data processing flow.
Agriengineering 07 00187 g003
Figure 4. Scatter plot where x = air pressure; y = clamping time; and color = fertilizer weight from 49.98 kg to 50.98 kg.
Agriengineering 07 00187 g004
Figure 5. Surface plot of RMSE values, max_depth, and number of trees.
Agriengineering 07 00187 g005
Figure 6. Smart Bagging System workflow.
Agriengineering 07 00187 g006
Figure 7. Control block diagram of the Smart Bagging System.
Agriengineering 07 00187 g007
Table 1. Model configuration for ML algorithms.
ModelParameterDescriptionValue
SVRCRegularization parameter balancing error and model complexity1.0
(default WEKA)
ε (epsilon)Defines error margin without penalty0.001
(default WEKA)
ANNHidden layerNumber of neurons per hidden layerAuto-computed (a in WEKA)
ArchitectureOne hidden layer with auto neuron calculationDefault WEKA
LRIntercept fittingEnables bias termTrue
NormalizationWhether input is normalized before trainingFalse
RFRn_estimatorsNumber of decision trees in the ensemble100
(default WEKA)
max_depthMaximum tree depth 0 = unlimited
(default WEKA)
Table 2. Descriptive statistics of sensor variables.
VariableMeanStDevMinMax
Machine temperature (°C)451.4641.1950.25
Humidity (%)59.43.8652.463.7
Product water content (%)64.368.033879
Air pressure (bar)8.751.257.3511.39
Percentage of on-spec fertilizer size (%)99.360.3498.1599.74
Environmental dust (mg/m3)0.0100.010.02
Clamping time (s)4.090.723.234.97
Product temperature (°C)36.144.2124.7544.25
Machine vibration (mm/s)0.850.720.243.6
Product weight (kg)—Y50.440.1949.9850.98
Table 3. Analytical results for various ML algorithms.
ANNRFRLRSVR
R20.93600.96480.90770.9154
Mean Absolute Error (MAE)0.05170.03280.05450.0468
Root Mean Squared Error (RMSE)0.06800.04920.07750.0773
Relative Absolute Error (RAE) (%)35.724722.670937.653332.3508
Root Relative Squared Error (RRSE) (%)36.510926.448441.632441.5049
Table 4. Wilcoxon signed-rank test comparing R2 values between RFR and other models.
Model 1Model 2Wilcoxon Statisticp-ValueSignificance (α < 0.05)
RFRANN00.001953Significant
RFRSVR00.001953Significant
RFRLR60.027344Significant
Table 5. Training time and per-bag inference latency of the models.
ModelTraining Time (s)Avg. Inference Time per Bag (ms)
RFR0.146112.0408
ANN0.02951.3408
SVR0.00221.5658
LR0.00221.2288
Table 6. Attribute importance based on average impurity decrease.
No.FeatureAttribute Importance
1Clamping time (s)0.37
2Air pressure (bar)0.34
3Humidity (%)0.10
4Machine vibration (mm/s)0.04
5Machine temperature (°C)0.04
6Percentage of on-spec fertilizer size (%)0.04
7Product water content (%)0.04
8Product temperature (°C)0.04
9Environmental dust (mg/m3)0.01
Table 7. Comparison of feature importance methods.
MethodAdvantagesLimitationsRef.
Random Forest Importance
  • Built-in and easy to implement
  • Fast and efficient for large datasets
  • Suitable for early-stage feature screening
  • Provides a global overview of feature influence
  • Practical for real-time industrial applications
  • Biased toward features with more categories or higher variance
  • Does not account for feature interaction
[6]
Permutation Importance
  • Can be applied to any model
  • Measures the actual impact of feature permutation on model performance
  • Reduces bias from categorical feature frequency
  • Computationally more expensive
  • Sensitive to multicollinearity
  • Can vary depending on data partitions
[40]
SHAP Values
  • Provides both local and global interpretability
  • Based on the Shapley value from cooperative game theory
  • Produces intuitive visual explanations
  • High computational cost
  • Complex to implement on large-scale or deep models
  • May not be practical for real-time or edge applications
[41]
Table 8. Model performance changes in ablation analysis (R2 and ΔR2).
Removed FeatureR2ΔR2Brief Interpretation
X1—Machine temperature (°C)0.9589−0.0106Minimal impact
X2—Humidity (%)0.9549−0.0067Very small effect
X3—Product water content (%)0.9601−0.0118Not significant
X4—Air pressure (bar)0.9513−0.003Very slight impact
X5—Percentage of on-spec fertilizer size (%)0.9498−0.0015Nearly neutral
X6—Environmental dust (mg/m3)0.94820No impact at all
X7—Clamping time (s)0.9721−0.0239Performance improved
X8—Product temperature (°C)0.9582−0.0009Almost no impact
X9—Machine vibration (mm/s)0.93950.0088Limited but relevant contribution
Table 9. RMSE value of RFR hyperparameter tuning based on max_depth and n_estimators.
n_estimators102050100200500100015002000
Maxdepth50.05240.04890.05010.05010.04850.04870.04820.04830.0484
100.05230.04980.05130.04970.04970.04910.04870.04870.0488
150.05430.05220.0510.04960.04960.04910.04870.04870.0488
200.05430.05220.0510.04960.04960.04910.04870.04870.0488
250.05430.05220.0510.04960.04960.04910.04870.04870.0488
300.05430.05220.0510.04960.04960.04910.04870.04870.0488
Table 10. Total savings detail.
No.DetailsAmount (IDR/year)
1Losses before ML implementation30,591,000,000
2Estimated losses after ML implementation1,529,550,000
3ML implementation + maintenance costs250,000,000
Total Savings28,811,450,000
Disclaimer/Publisher’s Note: The statements, opinions and data contained in all publications are solely those of the individual author(s) and contributor(s) and not of MDPI and/or the editor(s). MDPI and/or the editor(s) disclaim responsibility for any injury to people or property resulting from any ideas, methods, instructions or products referred to in the content.

