Article

Spatial Distribution of Greenhouse Gas Emissions and Environmental Variables in Compost Barn Dairy Systems

by
Ana Luíza Guimarães André
1,
Patrícia Ferreira Ponciano Ferraz
2,*,
Gabriel Araujo e Silva Ferraz
2,
Jacqueline Cardoso Ferreira
2,
Franck Morais de Oliveira
2,
Eduardo Mitke Brandão Reis
3,
Matteo Barbari
4 and
Giuseppe Rossi
4
1
Department of Animal Science, Faculty of Animal Science and Veterinary Medicine, Federal University of Lavras (UFLA), Lavras 37200-900, Brazil
2
Department of Agricultural Engineering, Federal University of Lavras (UFLA), Lavras 37200-900, Brazil
3
Center for Biological and Nature Sciences, Federal University of Acre (UFAC), Rio Branco 69920-900, Brazil
4
Department of Agriculture, Food, Environment and Forestry, University of Florence, 50145 Florence, Italy
*
Author to whom correspondence should be addressed.
AgriEngineering 2025, 7(5), 158; https://doi.org/10.3390/agriengineering7050158
Submission received: 1 April 2025 / Revised: 5 May 2025 / Accepted: 13 May 2025 / Published: 19 May 2025

Abstract

:
The dairy sector plays a fundamental role in the economic development of numerous regions by creating jobs and sustaining the livelihoods of millions of people. However, concerns related to animal welfare and environmental sustainability—particularly greenhouse gas (GHG) emissions—persist in intensive dairy systems. This study aimed to measure and assess the presence of GHGs, such as methane (CH4) and carbon dioxide (CO2), in a compost barn facility, using spatial variability tools to analyze the distribution of these gasses at different heights (0.25 m and 1.5 m) relative to the animals’ bedding. Data were collected over five consecutive days using a prototype equipped with low-cost sensors. Geostatistical analysis was performed using R, and spatial distribution maps were generated with Surfer 13®. Results showed elevated CH4 concentrations at 0.25 m, exceeding values typically reported for similar systems values (60–117 ppm), while CO2 concentrations remained within the expected range (970–1480 ppm), suggesting low risk to animals, workers, and the environment. The findings highlight the importance of continuous environmental monitoring to promote sustainability and productivity in confined dairy operations.

1. Introduction

The increasing demand for food, combined with environmental concerns, has driven significant changes in dairy farming to meet consumer expectations, ensure animal welfare, minimize environmental impacts, and promote sustainability [1,2].
Dairy farming faces ongoing challenges in reconciling productivity, animal welfare, and sustainability. As a result, confinement systems and management practices have become essential for ensuring adequate living conditions for animals and optimizing resources use [3]. Well-designed facilities not only provide comfort to livestock but also directly influence productivity and economic returns for producers [4]. Environmental challenges, combined with social and economic factors, threaten the sustainability of the dairy industry and demand innovative strategies to reduce impacts and ensure its long-term viability [5].
Another relevant aspect is the contribution of the dairy production chain to greenhouse gas (GHG) emissions. Studies indicate that livestock emissions account for approximately 14.5% of total anthropogenic GHG emissions, with dairy farming contributing around 20% of this total [6]. Therefore, the appropriate choice of confinement systems becomes crucial to minimizing the environmental impacts associated with this activity.
Compost barns are a promising alternative to conventional confinement systems, offering greater animal comfort and improved environmental control [7,8]. However, as an intensive system, the continuous decomposition of organic material and related activities can increase GHG emissions [9], potentially affecting air quality, the health of animals and workers, and overall sustainability.
The primary gasses emitted in dairy farming are methane (CH4), carbon dioxide (CO2), and nitrous oxide (N2O), all of which have significant environmental impact potential. The emission of these gasses intensifies the greenhouse effect and contributes to climate change [10,11,12], being directly linked to the efficiency of biological processes and environmental management practices [13].
Among GHGs, CH4 represents a greater environmental risk than CO2 due to its global warming potential, which is 28 times higher [14,15]. This gas is produced through the decomposition of organic waste, ruminant digestion, the metabolism of certain bacteria, and fossil fuel extraction [16].
In livestock systems, CH4 is predominantly generated by the microbial fermentation of cellulose material in the rumen and, to a lesser extent, in the intestines [17,18]. This process can result in a loss of 2–12% of the gross energy ingested by lactating cows, reducing feed efficiency, weight gain, and milk production [19,20,21,22]. Additionally, the management and storage of organic waste contribute significantly to CH4 emissions. It is estimated that 16–21.9% of total CH4 emissions in livestock result from the anaerobic degradation of manure [23,24].
In comparison, CO2 is naturally present in the atmosphere, but its concentration can increase in confinement systems due to limited air renewal, animal respiration, and enteric fermentation [16]. Inadequate ventilation can lead to gas accumulation, intensifying thermal stress, compromising welfare, reducing food and water intake, and negatively impacting herd productivity [25,26]. Hence, adopting strategies to monitor and reduce these emissions is critical to promoting more sustainable production systems.
Low-cost gas sensors have gained attention as practical tools for monitoring GHG in livestock facilities due to their affordability, portability, and real-time operation capabilities. These sensors typically detect changes in physical or chemical properties—such as electrical resistance or voltage—when exposed to target gasses, making them attractive for distributed environmental monitoring systems that can support animal welfare through improved air quality control [27,28,29]. However, despite their advantages, low-cost sensors still present limitations that affect measurement reliability. Commercially available models often suffer from low selectivity and may respond to interfering gasses in the environment, resulting in false positives [30,31,32]. In addition, they usually require frequent calibration and, in some cases, high operating temperatures, which increase energy consumption and reduce long-term stability [31,33]. To address these challenges, recent research has explored improvements in sensor materials, design, and signal processing algorithms. These advances aim to enhance sensitivity, selectivity, and operational efficiency, pointing to a [27] promising future for the application of low-cost sensors in livestock systems, contributing to environmental sustainability and animal health management.
Furthermore, understanding the spatial distribution of gasses within facilities is crucial to optimizing management systems. Geostatistics has emerged as a valuable tool for analyzing the spatial variability of gas emissions, enabling the identification of critical areas and a more efficient adjustment of farming systems [34,35]. This approach supports a more accurate evaluation of factors that interfere with the production environment, contributing to the implementation of measures that minimize dairy farming impacts [36,37].
Thus, this study aimed to measure and assess the presence of GHGs, such as CH4 and CO2, within a compost barn facility, using spatial variability tools to analyze the distribution of these gasses at different heights (0.25 m and 1.5 m) relative to the animals’ bedding.

2. Materials and Methods

All experimental procedures were approved by the Animal Ethics Committee of the Federal University of Lavras—UFLA (CEUA), under protocol n°. 044/22.

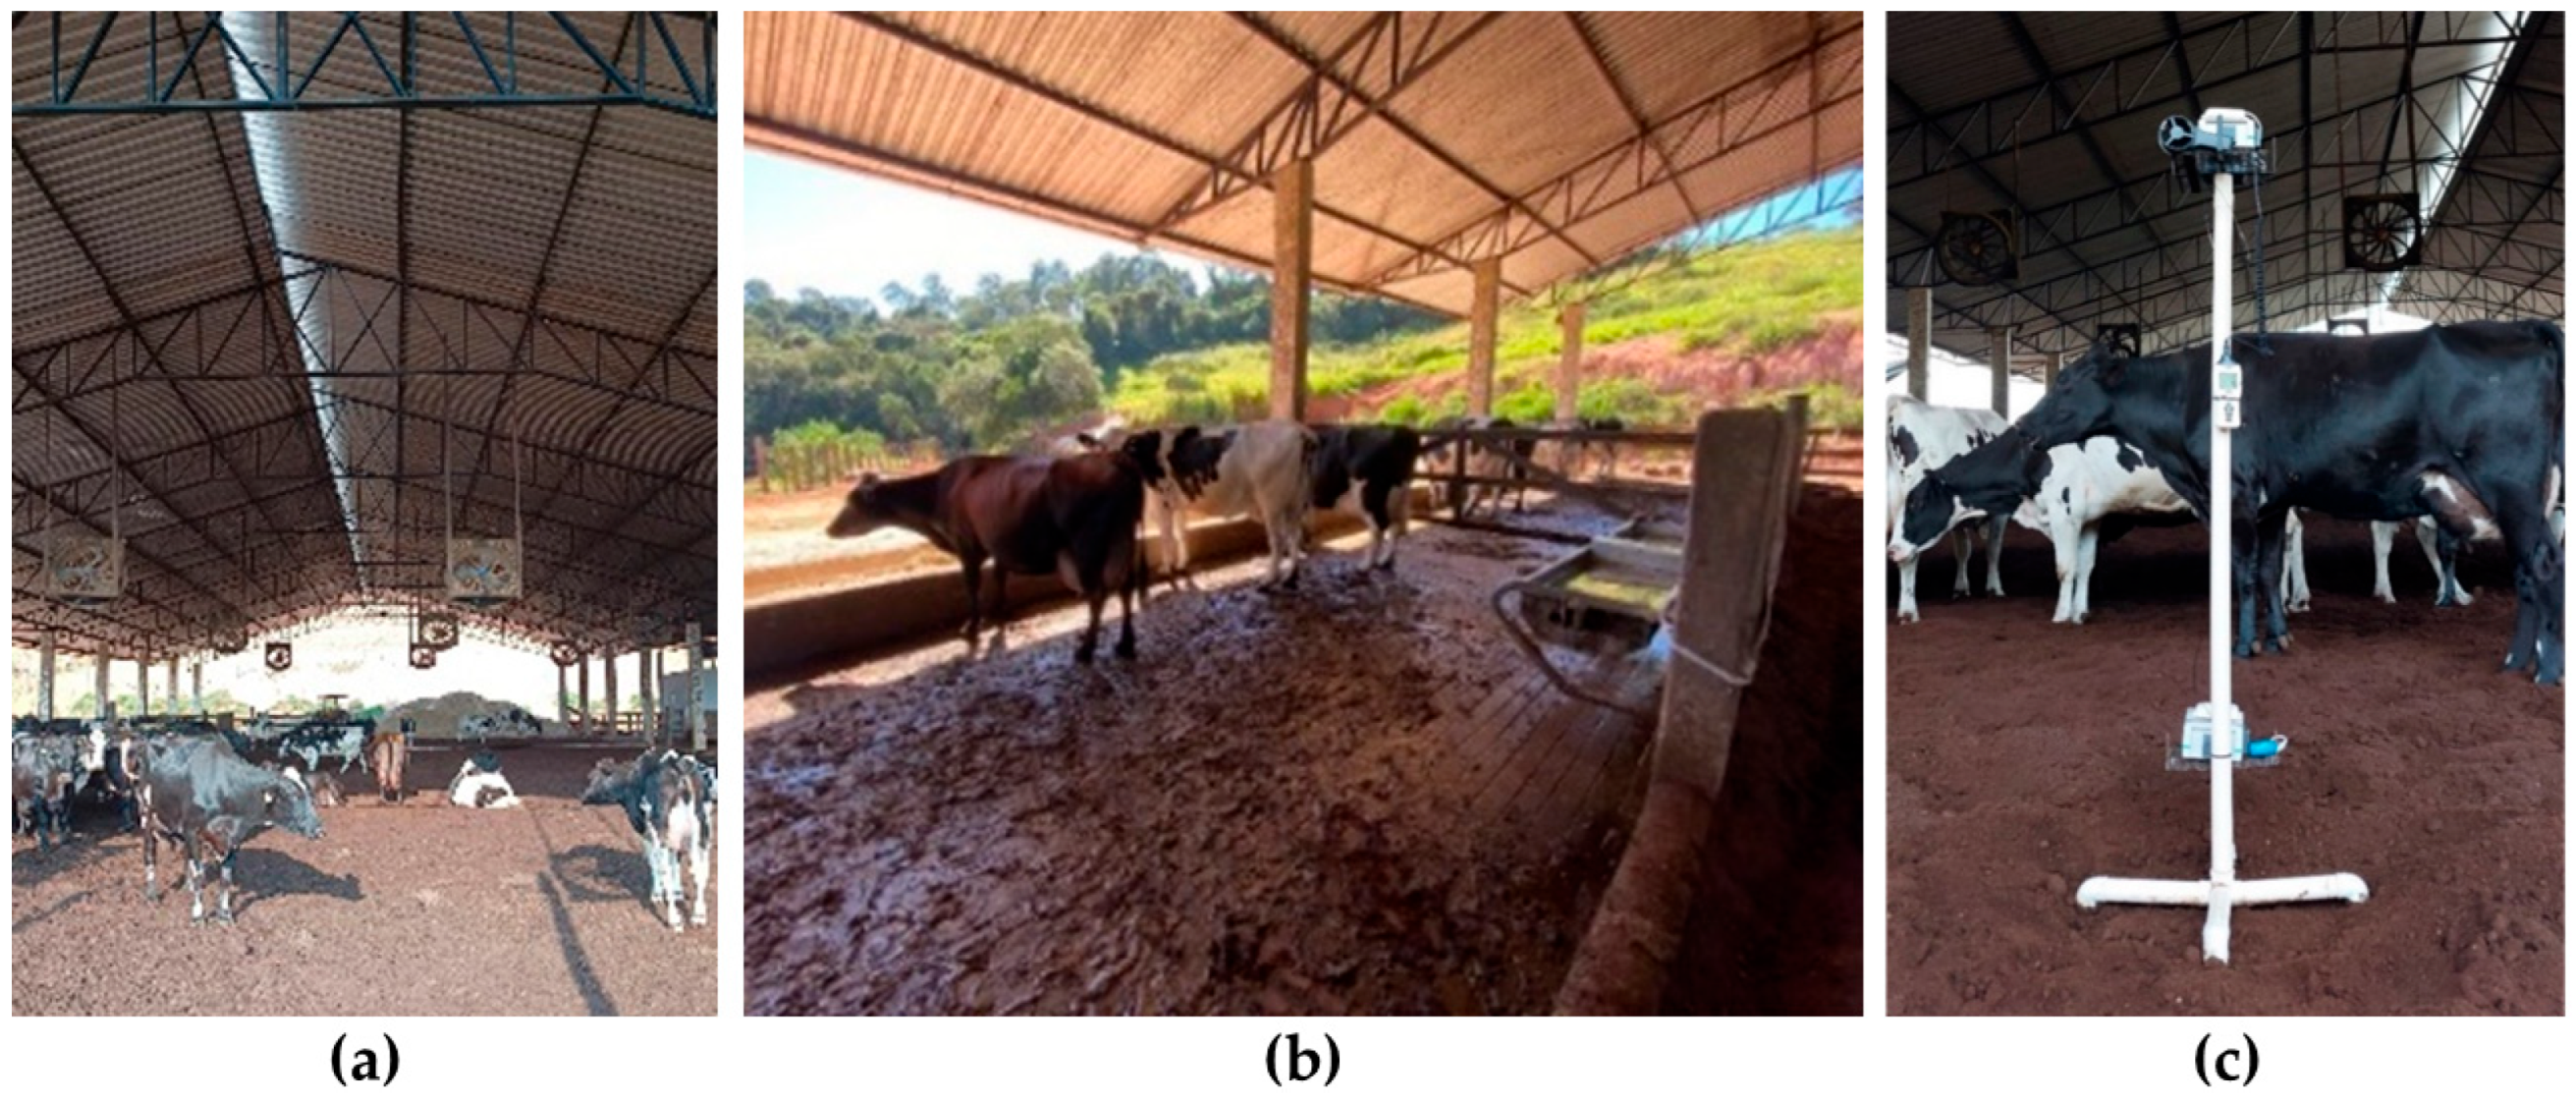
2.1. Location Description

The study was carried out over five consecutive days in November 2023 at a dairy cattle facility operating under the compost barn system, located in the southern region of Minas Gerais, Brazil. The facility is located at an altitude of 920.62 m, with geographic coordinates of 21°15′ S latitude and 45°09′ W longitude, and is oriented along a true east–west axis.
Based on the Köppen climate classification, the area falls within the Cwa category, which denotes a humid subtropical climate with dry winters and hot, rainy summers [38].
During the experimental period, the external environmental variables of the facility were recorded, and average values were calculated based on the five days of evaluation. The recorded thermal conditions showed an average maximum temperature of 28.56 °C, minimum of 22.91 °C, and relative humidity (RH) of 67.39%.
The compost barn is 54 m long, 22 m wide, and has a ceiling height of 4.5 m. Of the width, 4.0 m is allocated for the feeding corridor on the north side, as shown in Figure 1. The roof consists of galvanized tiles with a 30% slope, featuring eaves measuring three meters on the north and south sides and one meter on the east and west sides.
The resting area is separated from the feeding corridor and includes five partitions (3 m × 1.5 m—length × height), where MX300 water troughs (MX do Brasil, São Paulo, Brazil) are installed to prevent direct contact between the water and the bedding. The floor of the feeding corridor is made of grooved concrete. The compost bedding consists of sawdust, 65 cm deep, and was turned twice daily during the season in which the experiment was conducted.
Ventilation is mechanical, operating in a west-to-east direction and supported by 12 axial fans (Ziehl-Abegg® model; Ziehl-Abegg SE, Künzelsau, Germany), arranged in four rows (3 × 4) and installed 2.5 m above the bedding. These fans are high-speed, low-volume (LVHS) devices, each with a diameter of 1.10 m, three blades, a rotational speed of 950 rpm, a power output of 0.86 kW, and an airflow rate of 23.000 m3/h.
The data collection period took place while the facility housed 86 lactating cows at a density of 13.81 m2 per cow and an average production of 2000 L per day. The animals in the barn were divided into three groups based on productivity: 35 high-production, 21 medium-production, and 30 low-production cows.
The farm’s standard routine was maintained throughout the entire experimental period, following the same schedules for milking (5:00 and 16:00), feed replenishment, and bedding turning (6:00 and 17:00). Additionally, the fans remained on throughout the data collection period.

2.2. Acquisition of Evaluated Variables

The thermal environment conditions—dry bulb temperature (Tdb, °C), dew point temperature (tdp, °C), and relative air humidity (RH, %)—were recorded inside the facility using a Hobo® MX2301A data logger (Onset Computer Corporation, Bourne, MA, USA), with accuracies of ±0.2 °C and ±2.5%, respectively. Air Velocity (V, m.s−1) was measured with a KR-835 vane anemometer, with a measurement range of 0.4 to 30 m.s−1. The gas monitoring of CH4 and CO2 was carried out using a prototype developed and calibrated by the University of Florence, Italy. More details on the prototype’s development can be found in Becciolini et al. [39].
All variables were collected using an 80-point grid inside the barn, with points distributed at intervals of 3.20 × 4.00 m (length × width), as illustrated in Figure 2.
To characterize the thermal environment and the presence of gasses under conditions similar to those experienced by organic matter in the bedding and by the animals, data were collected simultaneously at two heights (0.25 m and 1.50 m) above the sawdust bedding, as shown in Figure 3c. Data were recorded every 10 s for one minute at each point.
After collecting thermal environmental data, the environmental variables (Tdb, Tdp, and RH) were used to calculate the Temperature and Humidity Index (THI) based on the equation proposed by Thom [40], as shown in Equation (1).
T H I = T d b + 0.36 T d p + 41.5
where THI is the Temperature and Humidity Index (dimensionless); Tdb is the dry bulb temperature (°C); and Tdp is the dew point temperature (°C).

2.3. Geostatistical Analysis of Data

The collected data were subjected to geostatistical analysis to assess the spatial variability of thermal environmental variables (THI and V) and gasses (CH4 and CO2) using the R statistical software, version 4.3.3, and the geoR package, version 1.9-4 [41,42,43]. Semivariance analysis was applied to assess spatial dependence using ordinary kriging interpolation. Semivariance was calculated using Equation (2), as described by Bachmaier and Backes (2008) [44].
y ^ h = 1 2 N h i = 1 N h [ Z X i Z ( X i + h ) ] 2
where N(h) is the number of experimental pairs of observations Z(Xi), and Z (Xi + h) are positions separated by a distance h.
The semivariance was fitted using the spherical mathematical model and the Restricted Maximum Likelihood (REML) method, resulting in less biased estimates [45]. The parameters—nugget effect (C0), contribution (C1), sill variance (C0 + C1), and range (a)—were determined based on the semivariance equation and adjusted according to the observed in the semivariogram plots. To assess the quality of the adjustments, the degree of spatial dependence (DSD) was calculated as the ratio of the C0 to the C0 + C1, multiplied by 100. The classification followed these criteria: DSD values above 75% indicate weak spatial dependence, values between 25% and 75% indicate moderate dependence, and values below 25% indicate strong dependence [46].
Cross-validation was performed to validate the semivariogram adjustments and determine the mean error (ME), the standard deviation of the mean error (SDm), the reduced error (RE), and the standard deviation of the reduced error (SDR) [47].
After these adjustments, the data were interpolated using ordinary kriging, enabling the visualization of the spatial distribution patterns of the variables within the facility. The geostatistical maps were generated using a trial version of Surfer 13 (Golden Software, 2016) [48].

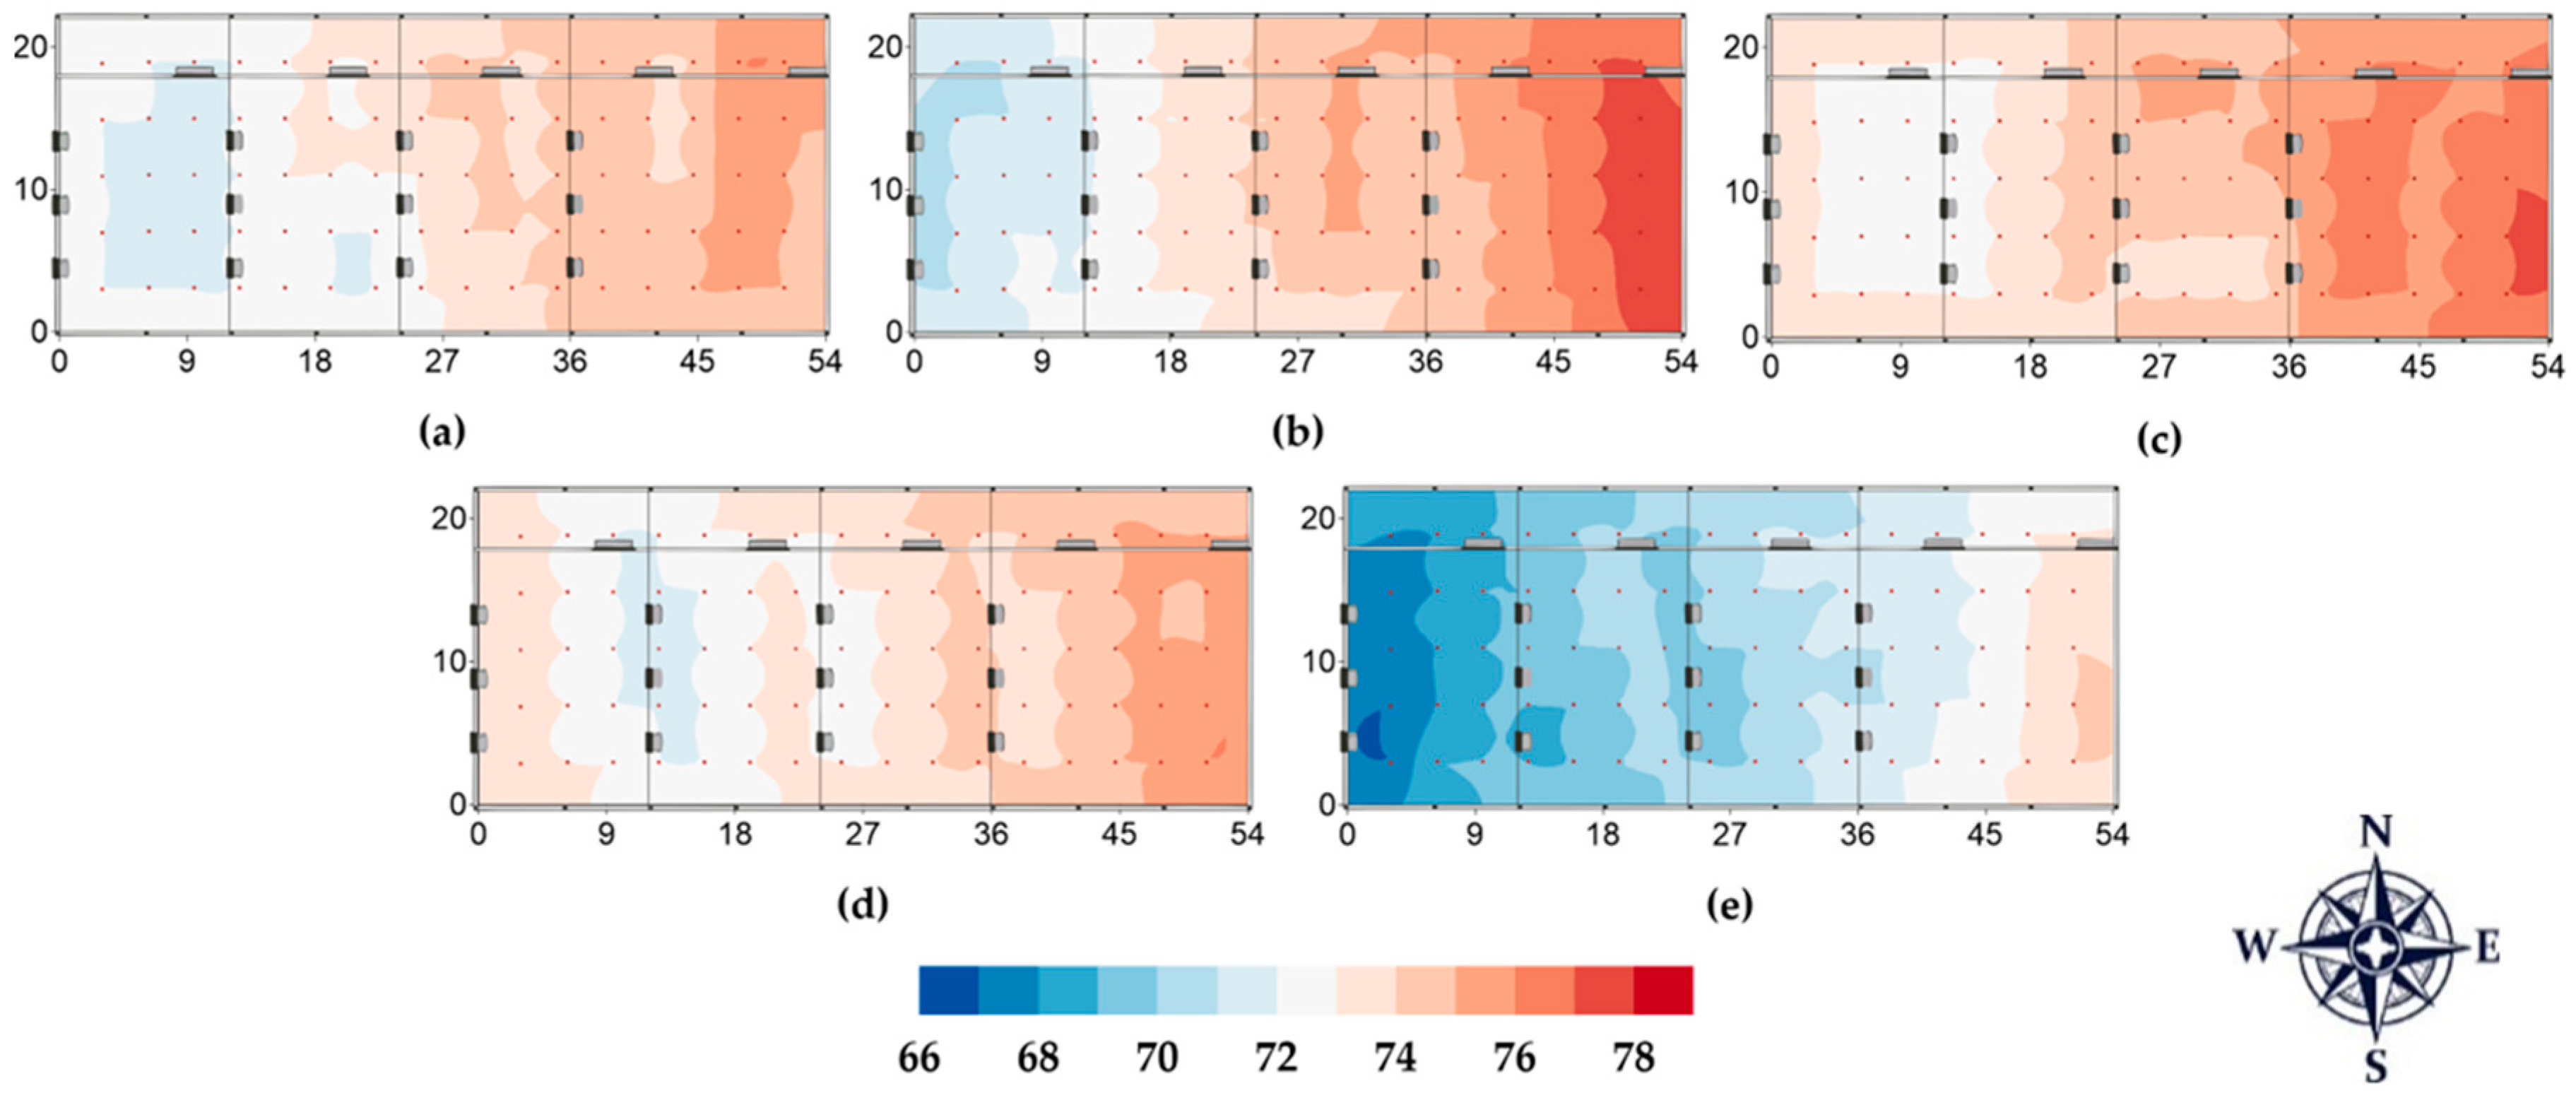
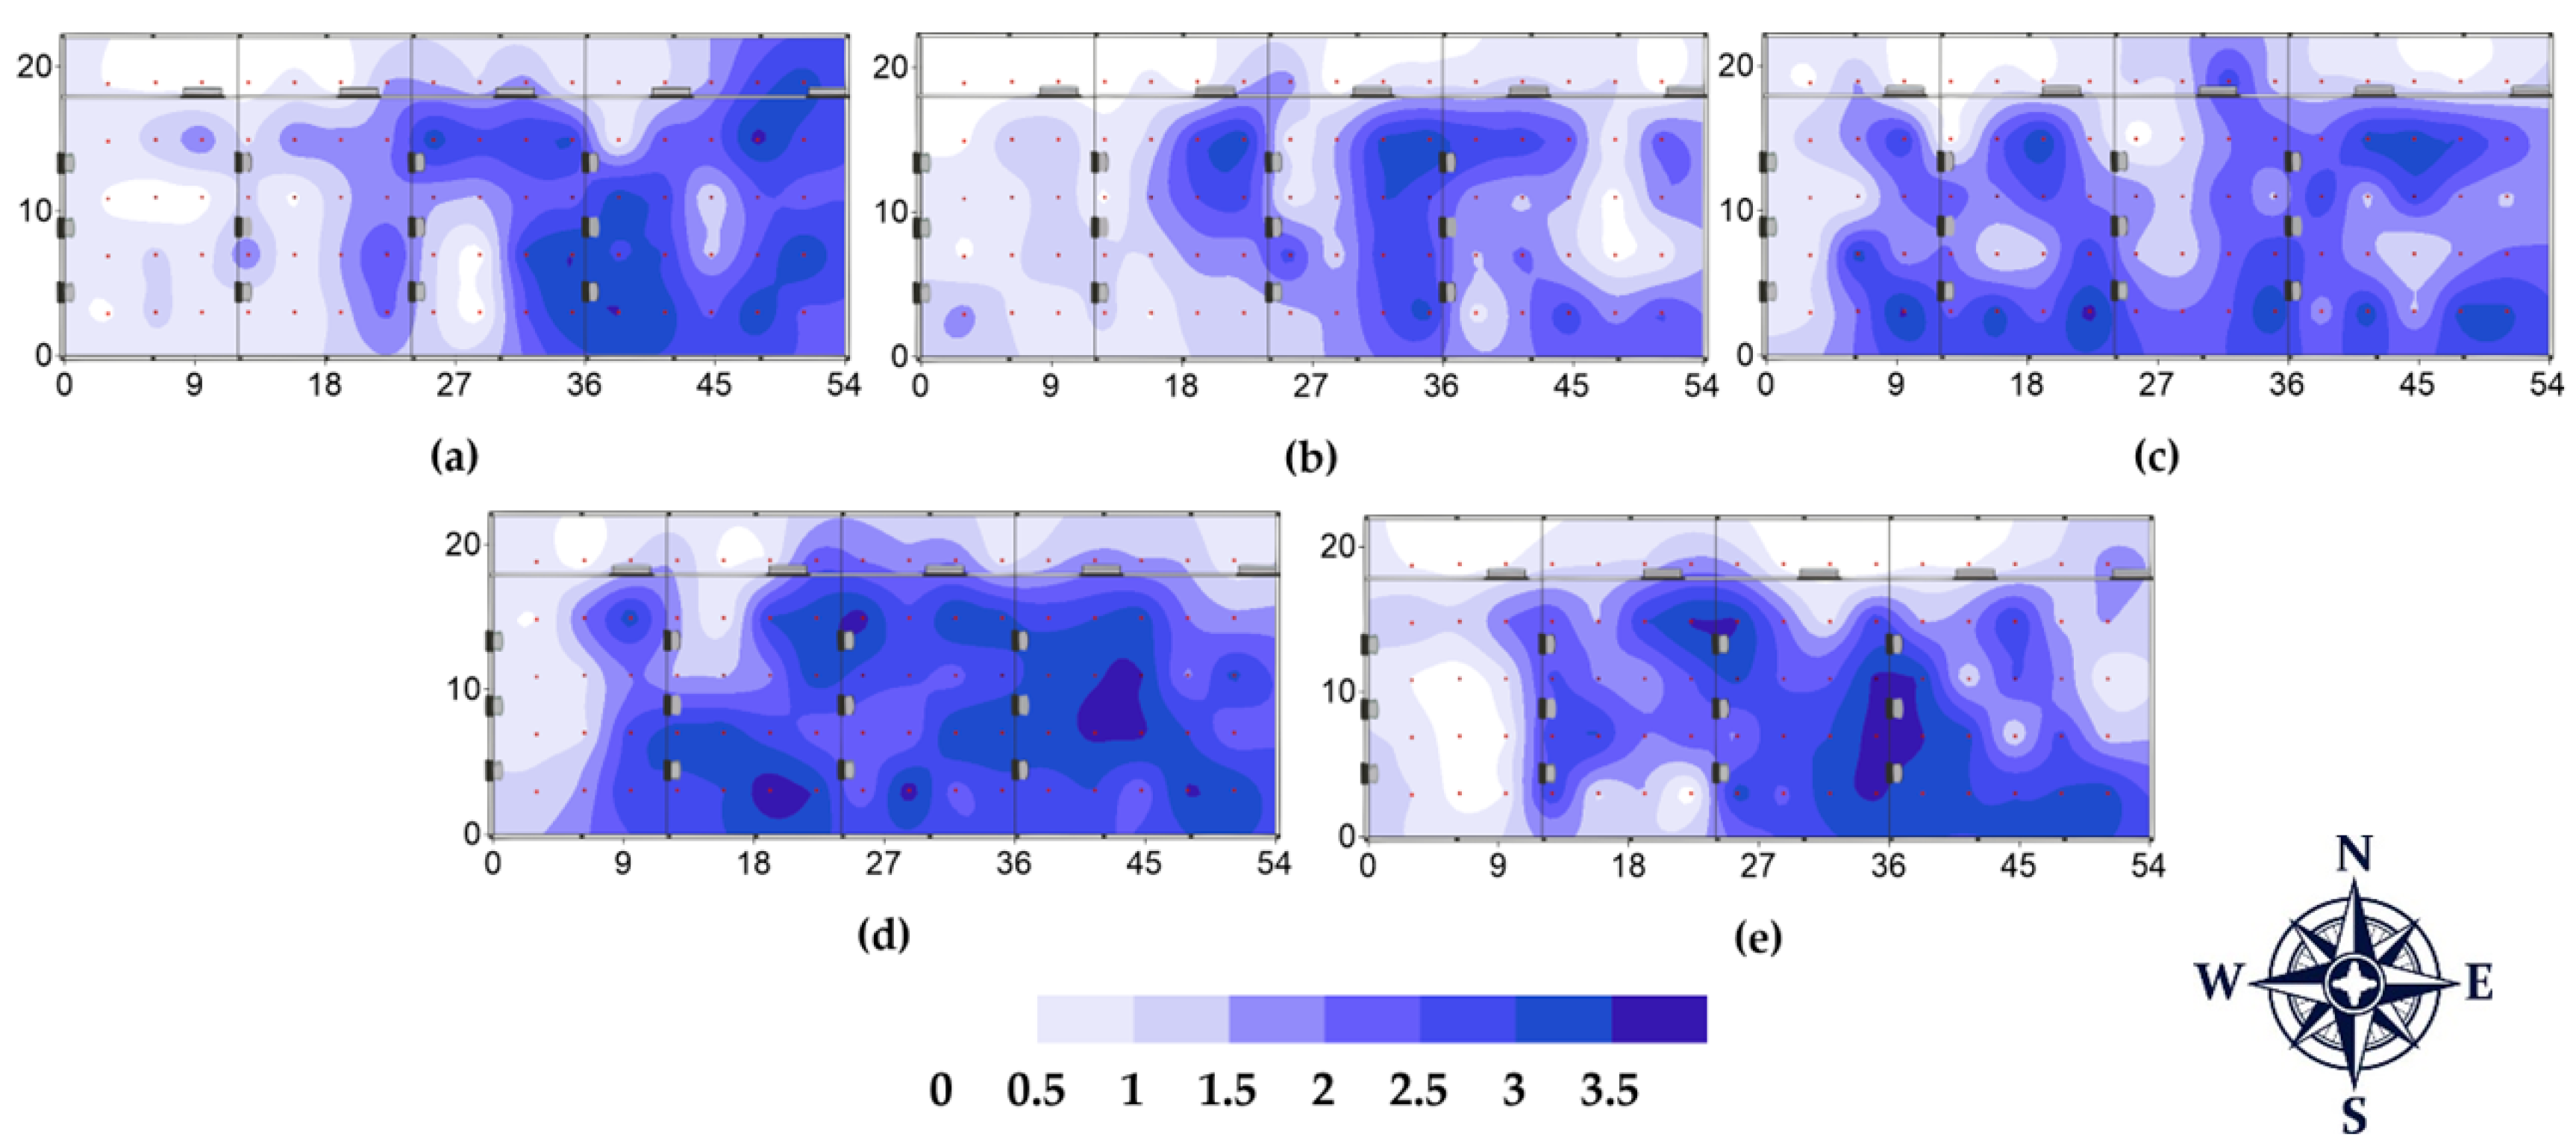
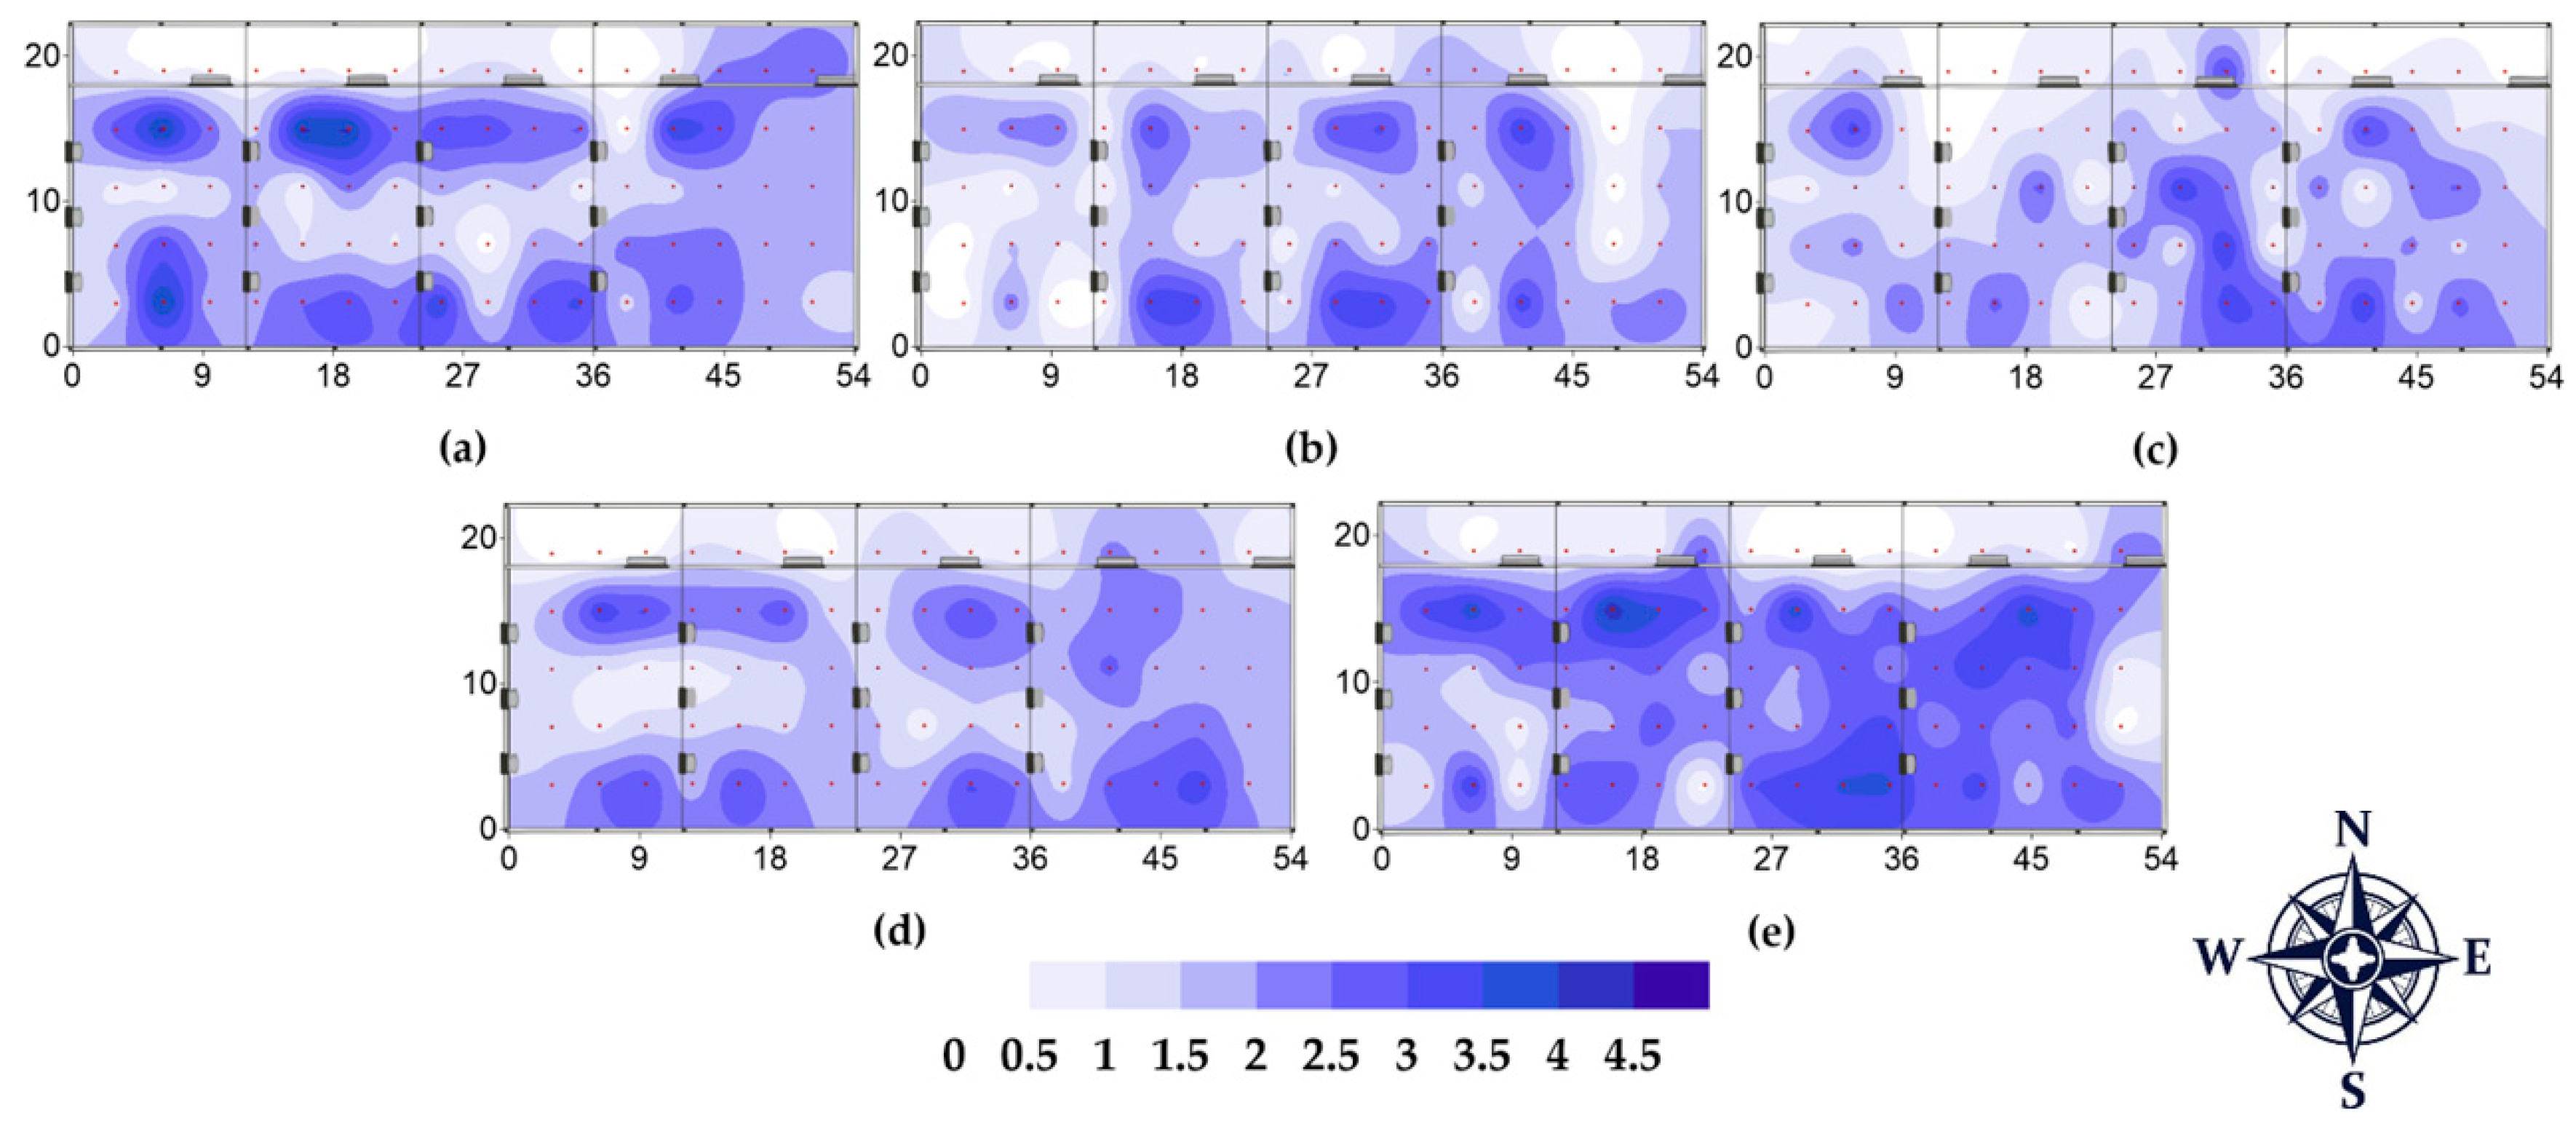
3. Results and Discussion

Geostatistical analysis was employed to predict and model the spatial variability of THI and V within the compost barn, thereby identifying the spatial dependence of these variables within the facility, as shown in Table 1.
The mean error (ME) and reduced error (RE) were close to zero, while the standard deviation of reduced error (SDR) was approximately 1.0. Additionally, the standard deviation of the mean error (SDm) reached its lowest possible values, indicating that the adjustments were successfully applied to all variables at their respective heights and dates under study [47].
The C0 for the THI exhibited a strong DSD over the five evaluated days at both heights (0.25 m and 1.5 m), with values generally below 25%, often close to zero. The variable V predominantly showed strong DSD values at both heights, except on the third collection day, when the values reached 47.22% (0.25 m) and 72.62% (1.5 m), classifying them as moderate (25% to 75%).
The range values determine the spatial dependence limit, indicating the extent to which the variable is spatially influenced [47]. For THI, the range values exceeded 20 on all five days at 0.25 m. A similar trend was observed at 1.5 m, except on the first day, when the range value was only 3. For V, the range values were predominantly below 20 at both heights, except on the third day at 1.5 m, when they reached 38.39.
The THI combines the effects of two climatic properties, Tdb and RH, to analyze herd comfort conditions and performance [49,50].
Figure 4 and Figure 5 illustrate the spatial distribution of the THI at heights of 0.25 m and 1.5 m, respectively, over the five evaluated days.
During the study period, THI values ranged from 67 to 78 at 0.25 m above the bedding (Figure 4) and from 66.9 to 76 at a height of 1.50 m (Figure 5). Values below 74 indicate ideal conditions; values between 74 and 79 suggest a warning situation; values between 79 and 84 represent a condition requiring preventive measures; and values above 84 indicate an emergency situation [51].
In the maps (Figure 4 and Figure 5), areas with bluish hues indicate lower THI values, suggesting that animals experienced environmental conditions closer to thermal comfort. Conversely, some regions of the barn marked with reddish colors exhibited THI values near 78, indicating a warning situation. These elevated THI values can have significant implications for animal welfare, as environments with high THI are associated with thermal stress, potentially compromising production and animal health.
According to Silva et al. [52], thermal stress reduces milk production, increases somatic cell counts (SCC), and affects milk quality. These effects are likely due to reduced dry matter intake and alterations in animal metabolism, expressed by changes in milk composition, including reduced fat, protein, and lactose levels, indicating nutritional imbalances [53,54,55].
Furthermore, animals exposed to environments with THI above 74 may experience reproductive efficiency challenges, including difficulty detecting estrus, higher abortion rates, and prolonged intervals between calving [56,57,58,59].
In this study, the days with observed elevated THI values, as evidenced by the reddish areas of the barn, indicate that the animals were at risk of negative impacts that potentially affect herd productivity.
In response to the challenges of thermal stress in intensive facilities, mechanical ventilation and evaporative cooling systems have been implemented to provide improved thermal conditions for confined dairy cows, aiming to reduce thermal stress and maintain milk production [60]. However, for this type of housing, water-based cooling systems, if not properly designed, can present challenges due to increased bedding moisture within the facility [61]. Alternatively, various methods have been employed, such as increased water availability and access, and nutritional strategies to help reduce thermal stress and improve herd zootechnical indices [62].
Regardless of the confinement system adopted, air circulation is essential, whether natural, mechanical, or combined. In compost barn systems, ventilation is necessary as it facilitates the dissipation of heat and moisture generated by the animals and the composting process, while also aiding in the removal of gasses [63,64].
The spatial distribution of V at a height of 0.25 m can be observed in Figure 6.
Over the evaluated period, V at 0.25 m above the bedding ranged from 0 to 3.87 m.s−1. In Figure 6, the dark blue areas on the map indicate regions with higher V (values close to or above 2.5 m.s−1), while the lighter areas represent regions with lower V (ranging from 0 to 2 m.s−1).
The feeding corridor on the northern side of the barn showed the lowest V, registering values below 1.5 m.s−1. Higher V is observed in the southern part of the barn, mainly due to the airflow directed toward the resting area, where the animals spend most of their time. In compost barn confinement systems, maintaining uniform airflow throughout the facility is essential to ensure consistent air circulation across the barn. During thermal stress, animals tend to gather in areas with higher airflow, leading to the accumulation feces and urine on the bedding, which increases moisture levels in the resting area [65].
In this type of system, the bedding’s surface temperature is influenced by the ambient conditions, rising or falling according to the recorded Tdb in the facility [66]. Adequate ventilation within the barn helps dissipate heat from the bedding surface and facilitates moisture evaporation [67]. Ventilation systems should be designed to achieve a V of approximately 3 m.s−1 to meet the animals’ needs, ensure ventilation efficiency, and maintain bedding moisture at appropriate levels [68]. According to [69], stress effects caused by high Tdb and RH intensify when V is below 1.5 m.s−1. Properly designed ventilation systems promote health, thermal comfort, and immunity, and help remove moisture from the bedding surface [70].
As V increases, the efficiency of heat dissipation by the animals improves, reducing the sensation of heat, especially under high RH conditions [69,71]. This effect is essential for the thermal comfort of dairy cattle, as proper ventilation facilitates sensible heat loss through convection and sweat evaporation, thereby mitigating the impacts of thermal stress.
Figure 7 depicts the spatial distribution of V (m.s−1) at a height of 1.5 m over the five evaluated days.
Similarly to the observations at 0.25 m, the lowest incidence of air circulation at 1.5 m was recorded on the northern side of the barn, specifically in the feeding corridor, a region without mechanical ventilation. This condition is represented by the white coloration in Figure 7a–e.
At this height, the V values exceeded the maximum recorded at 0.25 m (3.87 m.s−1), reaching 4.47 m.s−1, as indicated by the dark blue color in Figure 7.
Inadequate ventilation within facilities can reduce internal air exchange, increasing humidity, odors, and gas concentrations in the barn, thereby exposing animals to uncomfortable and unhealthy conditions [23,72].
Environmental variables are crucial for understanding gas dynamics within facilities, as they directly influence animal welfare and behavior. Factors such as Tdb, RH, and V affect gas dispersion, impacting air quality and, consequently, animal health and comfort [73].
To analyze the distribution of CH4 and CO2 within the facility (Table 2), geostatistics was utilized. The estimated semivariogram parameters followed the same evaluation standards, using the spherical mathematical model as the basis for adjustment and applying the REML method for fitting.
The results for ME and RE for CH4 and CO2 gasses were low, either null or close to zero. The standard deviation of SDR was approximately 1.0. Regarding the standard deviation of the SDm, only CH4 measurements taken at 0.25 m over the five days exhibited low values, also close to 1.0.
The C0 for CH4 measured at 1.5 m consistently indicated DSD across all sampling days; however, at 0.25 m, the results varied, with moderate DSD observed on the third and fifth sampling days. For CO2, the DSD values were predominantly moderate at 1.5 m, except on the third sampling day [46].
The smallest recorded range value was 3.00, observed on the first and second sampling days for CH4 at 0.25 m and on the second day for CH4 at 1.5 m. The highest range value, 34.37, was obtained for CH4 at 0.25 m on the fifth sampling day.
Figure 8 illustrates the spatial distribution of CH4 at a height of 0.25 m over the five days of data collection.
Measurements of CH4 inside the facility at a height of 0.25 m ranged from 235 to 246 ppm (Figure 8). On the fifth evaluation day, a higher concentration of gas was observed on the western side of the facility, with readings between 245 and 246 ppm of CH4, as indicated by the red coloration in Figure 8e. The CH4 levels recorded during this period exceeded the reference range of 60 to 117 ppm established by Jungbluth et al. [74] for dairy production emissions, although they were not associated with negative impacts on the animals.
Figure 9 illustrates the spatial distribution of CH4 at a height of 1.5 m above the bedding, with concentrations ranging from 32 and 196.33 ppm, represented by violet and red colors, respectively.
The highest concentration of CH4 at a height of 1.5 m was recorded on the first sampling day (Figure 9a), reaching nearly 196.33 ppm, indicated by the red color. This measurement was taken on the northern side of the barn, in the feeding corridor adjacent to the first water trough, oriented along the west–east axis. This area was characterized by a lack of mechanical ventilation and low air circulation, relying solely on natural ventilation, which was insufficient to provide adequate airflow and thermal comfort for the animals.
In dairy cow farming systems, CH4 emissions are influenced by several factors, including breed, diet, production levels, and lactation stage [75]. Additionally, ventilation plays a critical role in determining gas concentrations within the environment.
Excessive CH4 production may negatively impact animal productivity, the gross energy lost during the enteric fermentation process, energy that could otherwise support growth, milk production, or weight gain, is diverted to CH4 production [19,20]. Beyond reducing production efficiency, CH4 emissions contribute significantly to global warming as one of the primary GHG driving climate change. Although CH4 has a relatively short atmospheric lifespan compared to gasses like CO2, its capacity to trap heat is substantially greater, making it a particularly potent warming agent over the short term [76,77].
The spatial distribution of CO2 was analyzed at two heights above the bedding, 0.25 m and 1.5 m (see Figure 10 and Figure 11, respectively). At 0.25 m, the minimum recorded value was 451 ppm, indicated by plum hue, whereas the maximum value was 697 ppm, depicted in black (Figure 10).
The spatial distribution of CO2 at 0.25 m, as observed in Figure 10e, revealed a dispersion pattern within the facility. Some points exhibited high concentrations (651 to 691 ppm), indicated by dark red to black coloration. These high-concentration points were recorded exclusively on the fifth day of evaluation and did not appear on the other days. On that day, two regions in the barn showed concentrations above 651 ppm: one on the western side and another on the eastern side. The western side, characterized by greater natural airflow and irregular accumulation of organic matter due to uneven bedding management, likely contributed to higher CO2 concentration in this area. In contrast, the eastern side, influenced by a natural wind barrier and located at the endpoint of the mechanical ventilation flow, exhibited distinct distribution patterns.
At a height of 0.25 m, the CO2 concentration remained below the critical range established by Jungbluth et al. [74] for dairy production (970 to 1480 ppm). The values observed in this study, ranging from 451 to 697 ppm, were significantly below 1000 ppm, a threshold at which [78] suggest that symptoms such as drowsiness and shortness of breath may occur.
Figure 11 shows the CO2 concentrations at a height of 1.5 m above the compost bedding. At this level, the concentration ranged from 362 to 504.33 ppm, represented by plum and black colors, respectively.
At a height of 1.5 m, CO2 concentrations were lower than those recorded at 0.25 m. Because CO2 is denser than air, it tends to accumulate in the lower layers of facilities, particularly in environments with limited ventilation [23]. Such accumulation can pose health and welfare risks to animals. High CO2 concentrations may cause respiratory tract irritation, compromise welfare, and threaten the sustainability of the dairy industry [25]. This situation underscores the importance of an efficient ventilation system to renew air and prevent high gas concentration zones.
Higher CO2 concentrations were observed in the feeding corridor located on the northern side of the facility on the first and fifth days, as shown in Figure 11a and Figure 11e, respectively. According to Bewley et al. [79], feeding alleys can retain approximately 25–30% of animal waste, contributing to higher gas concentrations in these regions. Furthermore, both mechanical and natural ventilation play fundamental roles in dispersing gasses, influencing their distribution. Variations in ventilation patterns (Figure 6 and Figure 7) across the sampling days likely influenced gas dynamics, as shown by the changes in gas dispersion.
It is important to note that pollutant gas emissions within the facility can be influenced by environmental variables, which are strongly associated with constantly changing climatic conditions [73]. Measuring these environmental variables, such as Tdb, RH, and V, can help interpret the spatial variability and dispersion of gasses within the compost barn.
Based on the identified spatial dispersion patterns within the compost barn facility, this study reinforces the need for research to understand the impacts of CH4 and CO2 emissions on animal welfare, human health, and environmental sustainability. Elevated gas concentrations can compromise indoor air quality, reduce productivity, and threaten thermal comfort, while also posing risks to workers. Additionally, because CH4 and CO2 are key contributors to global warming, understanding their dispersion is essential for developing effective mitigation strategies, such as improved facility management, enhanced ventilation systems, and the adoption of sustainable technologies.

4. Conclusions

The results of this study highlight the importance of spatial analysis in the dispersion of environmental variables, such as the THI, V, and GHG (CH4 and CO2) within compost barn systems. Data interpolation through kriging enables the visualization of the spatial distribution of these parameters at different heights (0.25 m and 1.5 m), revealing distinct patterns within the facility.
The recorded THI values indicated a warning condition (74–79), highlighting the need for mitigation measures to reduce thermal stress and prevent adverse effects on the animals’ productivity. Additionally, V measurements revealed that while ventilation at 1.5 m exceeded comfort levels (greater than 1.5 m.s−1), potentially cause stress to the animals, the values at 0.25 m were adequate for maintaining composting without compromising herd welfare.
Considering the GHG results, CH4 concentrations measured at 0.25 m above the bedding ranged from 235 to 246 ppm, surpassing the literature-reported values (60–117 ppm). Conversely, CO2 levels (451 to 697 ppm at 0.25 m and 362 to 504.33 ppm at 1.5 m) remained below the critical limits established in the literature (970 to 1480 ppm), alleviating concerns about its accumulation within the facility’s environment.

Author Contributions

Conceptualization, A.L.G.A., P.F.P.F., and G.A.e.S.F.; methodology, A.L.G.A., P.F.P.F., G.A.e.S.F., J.C.F., E.M.B.R., and G.R.; software, A.L.G.A., P.F.P.F., G.A.e.S.F., and J.C.F., validation, A.L.G.A., P.F.P.F., G.A.e.S.F., J.C.F., F.M.d.O., E.M.B.R., M.B., and G.R.; formal analysis, A.L.G.A., P.F.P.F., G.A.e.S.F., and E.M.B.R.; investigation, A.L.G.A., P.F.P.F., and J.C.F.; resources, P.F.P.F., J.C.F., M.B., and G.R.; data curation, A.L.G.A., G.A.e.S.F., and J.C.F.; writing—original draft preparation, A.L.G.A.; writing—review and editing, A.L.G.A., P.F.P.F., J.C.F., and E.M.B.R.; visualization, A.L.G.A., P.F.P.F., and J.C.F.; supervision, P.F.P.F., G.A.e.S.F., E.M.B.R., M.B., and G.R.; project administration, P.F.P.F.; funding acquisition, P.F.P.F., M.B., and G.R. All authors have read and agreed to the published version of the manuscript.

Funding

This research was funded by the National Council for Scientific and Technological Development, (CNPq) projects 404420/2021-4, and the Minas Gerais Research Funding Foundation (FAPEMIG), projects APQ-01082-21 and BPD-00034-22.

Data Availability Statement

The original contributions presented in the study are included in the article.

Acknowledgments

The authors would like to thank the Federal University of Lavras (UFLA) and the University of Florence (UniFi) for their support. We also extend our appreciation to CNPq, CAPES, and FAPEMIG for the scholarships provided. Special thanks to CNPq (404420/2021-4) and Fapemig (APQ-01082-21 and BPD-00034-22) for the financial support provided.

Conflicts of Interest

The authors declare no conflicts of interest.

References

  1. Min, B.R.; Lee, S.; Jung, H.; Miller, D.N.; Chen, R. Enteric Methane Emissions and Animal Performance in Dairy and Beef Cattle Production: Strategies, Opportunities, and Impact of Reducing Emissions. Animals 2022, 12, 948. [Google Scholar] [CrossRef]
  2. de L. Santos, G.C.; Neto, S.G.; Bezerra, L.R.; de Medeiros, A.N. Use of cakes to feed dairy cows: A review. Braz. J. Anim. Environ. Res. 2020, 3, 89–113. [Google Scholar]
  3. Biasato, I.; D’Angelo, A.; Bertone, I.; Odore, R.; Bellino, C. Compost bedded-pack barn as an alternative housing system for dairy cattle in Italy: Effects on animal health and welfare and milk and milk product quality. Ital. J. Anim. Sci. 2019, 18, 1142–1153. [Google Scholar] [CrossRef]
  4. da Silva, M.V.; Pandorfi, H.; de Almeida, G.L.P.; da Silva, R.A.B.; Morales, K.R.M.; Guiselini, C.; Santana, T.C.; de Cangela, G.L.C.; Filho, J.A.D.B.; Moraes, A.S.; et al. Spatial Modeling via Geostatistics and Infrared Thermography of the Skin Temperature of Dairy Cows in a Compost Barn System in the Brazilian Semiarid Region. Smart Agr. Technol. 2023, 3, 100078. [Google Scholar] [CrossRef]
  5. Shi, Z.; Xi, L.; Zhao, X. Measurement of ammonia and hydrogen sulfide emission from three typical dairy barns and estimation of total ammonia emission for the Chinese dairy industry. Animals 2023, 13, 2301. [Google Scholar] [CrossRef] [PubMed]
  6. Ribeiro-Filho, H.M.N.; Civiero, M.; Kebreab, E. Potential to reduce greenhouse gas emissions through different dairy cattle systems in subtropical regions. PLoS ONE 2020, 15, e0234687. [Google Scholar] [CrossRef] [PubMed]
  7. da Silva, M.V.; Pandorfi, H.; de Almeida, G.L.P.; da Rosa Ferraz Jardim, A.M.; Batista, P.H.D.; da Silva, R.A.B.; Lopes, I.; de Oliveira, M.E.G.; de Silva, J.L.B.; Moraes, A.S. Spatial variability and exploratory inference of abiotic factors in barn compost confinement for cattle in the semiarid. J. Therm. Biol. 2020, 94, 102782. [Google Scholar] [CrossRef]
  8. Peixoto, M.S.M.; Barbosa Filho, J.A.D.; Machado, N.A.F.; De Sena Sales Viana, V.; Costa, J.F.M. Thermoregulatory behavior of dairy cows submitted to bedding temperature variations in Compost barn systems. Biol. Rhythm Res. 2019, 52, 1120–1129. [Google Scholar] [CrossRef]
  9. Fuertes, E.; Balcells, J.; Maynegre, J.; Fuente, G.; Sarri, L.; Seradj, A.R. Measurement of methane and ammonia emissions from compost-bedded pack systems in dairy barns: Tilling effect and seasonal variations. Animals 2023, 13, 1871. [Google Scholar] [CrossRef]
  10. Džermeikaitė, K.; Krištolaitytė, J.; Antanaitis, R. Relationship between Dairy Cow Health and Intensity of Greenhouse Gas Emissions. Animals 2024, 14, 829. [Google Scholar] [CrossRef]
  11. Zhuang, M.; Shan, N.; Wang, Y.; Caro, D.; Fleming, R.M.; Wang, L. Different Characteristics of Greenhouse Gases and Ammonia Emissions from Conventional Stored Dairy Cattle and Swine Manure in China. Sci. Total Environ. 2020, 722, 137693. [Google Scholar] [CrossRef]
  12. Grossi, G.; Goglio, P.; Vitali, A.; Williams, A.G. Livestock and climate change: Impact of livestock on climate and mitigation strategies. Anim. Front. 2019, 9, 69–76. [Google Scholar] [CrossRef] [PubMed]
  13. Singaravadivelan, A.; Sachin, P.B.; Harikumar, S.; Vijayakumar, P.; Vindhya, M.V.; Farhana, F.M.B.; Rameesa, K.K.; Mathew, J. Life cycle assessment of greenhouse gas emission from the dairy production system—Review. Trop. Anim. Health Prod. 2023, 55, 320. [Google Scholar] [CrossRef] [PubMed]
  14. Forster, P.; Storelvmo, T.; Armour, K.; Collins, W.; Dufresne, J.L.; Frame, D.; Lunt, D.J.; Mauritsen, T.; Palmer, M.D.; Watanabe, M.; et al. The Earth’s Energy Budget, Climate Feedbacks, and Climate Sensitivity. In Climate Change 2021: The Physical Science Basis.; Cambridge University Press: Cambridge, UK; New York, NY, USA, 2021; pp. 923–1054. [Google Scholar]
  15. Signor, D.; Cerri, C.E.P. Nitrous oxide emissions in agricultural soils: A review. Pesqui. Agropecu. Trop. 2013, 43, 322–338. [Google Scholar] [CrossRef]
  16. de Oliveira, V.C.; da Silva, L.F.; Oliveira, C.E.A.; Franco, J.R.; Rodrigues, S.A.; de Souza, C.M.A.; Andrade, R.R.; Damasceno, F.A.; de Fátima Ferreira Tinôco, I.; Bambi, G. Characterization and Mitigation Measures for Carbon Dioxide, Methane, and Ammonia Emissions in Dairy Barns. Livest. Sci. 2024, 290, 105595. [Google Scholar] [CrossRef]
  17. Ferraz, P.F.P.; Ferraz, G.A.e.S.; Ferreira, J.C.; Aguiar, J.V.; Santana, L.S.; Norton, T. Assessment of Ammonia Emissions and Greenhouse Gases in Dairy Cattle Facilities: A Bibliometric Analysis. Animals 2024, 14, 1721. [Google Scholar] [CrossRef]
  18. Zanon, T.; Fichter, G.; Mittermair, P.; Nocker, L.; Gauly, M.; Peratoner, G. Quantifying methane emissions under field conditions under 2 different dairy production scenarios: Low-input versus high-input milk production. J. Dairy Sci. 2023, 106, 4711–4724. [Google Scholar] [CrossRef]
  19. Pragna, P.; Chauhan, S.S.; Sejian, V.; Leury, B.J.; Dunshea, F.R. Climate change and goat production: Enteric methane emission and its mitigation. Animals 2018, 8, 235. [Google Scholar] [CrossRef]
  20. Lôbo, A.M.B.O.; Lôbo, R.N.B.; Facó, O.; Souza, V.; Alves, A.A.C.; Costa, A.C.; Albuquerque, M.A.M. Characterization of milk production and composition of four exotic goat breeds in Brazil. Small Rumin. Res. 2017, 153, 9–16. [Google Scholar] [CrossRef]
  21. Bell, M.J.; Wall, E.; Simm, G.; Russel, G. Effects of genetic line and feeding system on methane from dairy systems. Anim. Feed Sci. Technol. 2011, 166–167, 699–707. [Google Scholar] [CrossRef]
  22. Johnson, K.A.; Johnson, D.E. Methane emissions from cattle. J. Anim. Sci. 1995, 73, 2483–2492. [Google Scholar] [CrossRef] [PubMed]
  23. Damasceno, F.A. Compost Barn as an Alternative for Dairy Farming, 3rd ed.; Gulliver: João Pessoa, Brazil, 2020; p. 396. [Google Scholar]
  24. Hindrichsen, I.K.; Wettstein, H.R.; Machmüller, A.; Jorg, B.; Kreuzer, M. Effect of the Carbohydrate Composition of feed Concentratates on Methane Emission from dairy Cows and Their Slurry. Environ. Monit. Assess. 2005, 107, 329–350. [Google Scholar] [CrossRef]
  25. Stokstad, M.; Klem, T.B.; Myrmel, M.; Oma, V.S.; Toftaker, I.; Osteras, O.; Nodtvedt, A. Using biosecurity measures to combat respiratory disease in cattle: The Norwegian control program for bovine respiratory syncytial virus and bovine Coronavirus. Front. Vet. Sci. 2020, 7, 167. [Google Scholar] [CrossRef]
  26. Pereira, M.H.C.; Rodrigues, A.D.P.; Martins, T.; Oliveira, W.V.C.; Silveira, P.S.A.; Wiltbank, M.C.; Vasconcelos, J.L.M. Timed artificial insemination programs during the summer in lactating dairy cows: Comparison of the 5-d Cosynch protocol with an estrogen/progesterone-based protocol. J. Dairy. Sci. 2013, 96, 6904–6914. [Google Scholar] [CrossRef] [PubMed]
  27. Furst, L.; Feliciano, M.; Frare, L.; Igrejas, G. A Portable Device for Methane Measurement Using a Low-Cost Semiconductor Sensor: Development, Calibration and Environmental Applications. Sensors 2021, 21, 7456. [Google Scholar] [CrossRef]
  28. Butturini, A.; Fonollosa, J. Use of Metal Oxide Semiconductor Sensors to Measure Methane in Aquatic Ecosystems in the Presence of Cross-Interfering Compounds. Limnol. Oceanogr. Methods 2022, 20, 710–720. [Google Scholar] [CrossRef]
  29. Fakra, D.A.H.; Andriatoavina, D.A.S.; Razafindralambo, N.A.M.N.; Amarillis, K.A.; Andriamampianina, J.M.M. A Simple and Low-Cost Integrative Sensor System for Methane and Hydrogen Measurement. Sens. Int. 2020, 1, 100032. [Google Scholar] [CrossRef]
  30. Oliaee, S.N.; Khodadadi, A.; Mortazavi, Y.; Alipour, S. Highly Selective Pt/SnO2 Sensor to Propane or Methane in Presence of CO and Ethanol, Using Gold Nanoparticles on Fe2O3 Catalytic Filter. Sens. Actuators B Chem. 2010, 147, 400–405. [Google Scholar] [CrossRef]
  31. Riddick, S.N.; Mauzerall, D.L.; Celia, M.; Allen, G.; Pitt, J.; Kang, M.; Riddick, J.C. The Calibration and Deployment of a Low-Cost Methane Sensor. Atmos. Environ. 2020, 230, 117440. [Google Scholar] [CrossRef]
  32. Van den Bossche, M.; Rose, N.T.; De Wekker, S.F.J. Potential of a Low-Cost Gas Sensor for Atmospheric Methane Monitoring. Sens. Actuators B Chem. 2017, 238, 501–509. [Google Scholar] [CrossRef]
  33. Fu, L.; You, S.; Li, G.; Li, X.; Fan, Z. Application of Semiconductor Metal Oxide in Chemiresistive Methane Gas Sensor: Recent Developments and Future Perspectives. Molecules 2023, 28, 6710. [Google Scholar] [CrossRef] [PubMed]
  34. Massari, J.M.; Moura, D.J.; Curi, T.M.R.C.; Vercellino, R.A.; Medeiros, B.B.L. Zoning of environmental conditions inside a wean-to-finish pig facility. Energ. Agric. Botucatu. 2016, 36, 739–748. [Google Scholar] [CrossRef]
  35. Ribeiro, P.A.P.; Yanagi Junior, T.; Oliveira, D.D.; Ferraz, G.A.S.; Lourençone, D. Análise geoestatística das iluminâncias em aviários para poedeiras equipados com lâmpadas fluorescents compactas e de led. Energ. Agric. Botucatu. 2016, 36, 11–21. [Google Scholar]
  36. Ferreira, J.C.; Ferraz, P.F.P.; Ferraz, G.A.S.; Oliveira, F.M.; Cadavid, V.G.; Rossi, G.; Becciolini, V. Spatial variability of methane and carbon dioxide gases in a Compost-Bedded Pack Barn system. Agron. Res. 2024, 22, 110–126. [Google Scholar]
  37. Oliveira, C.E.A.; Tinôco, I.F.F.; Damasceno, F.A.; Oliveira, V.C.; Rodrigues, P.H.M.; Ferraz, G.A.S.; Sousa, F.C.; Andrade, R.R.; Nascimento, J.A.C.; Silva, L.F. Air velocity spatial variability in open Compost-Bedded Pack Barn system with positive pressure ventilation. An. Acad. Bras Cienc. 2023, 95, e20220415. [Google Scholar]
  38. Dantas, A.A.A.; de Carvalho, L.G.; Ferreira, E. Climatic classification and tendencies in Lavras region, MG. Ciênc. Agrotec. 2007, 31, 1862–1866. [Google Scholar] [CrossRef]
  39. Becciolini, V.; Conti, L.; Rossi, G.; Marin, D.B.; Merlini, M.; Coletti, G.; Barbari, M. Real-Time Measurements of Gaseous and Particulate Emissions from Livestock Buildings and Manure Stores with Novel UAV-Based System. In Proceedings of the Conference of the Italian Society of Agricultural Engineering, Turin, Italy, 19–22 September 2022. [Google Scholar]
  40. Thom, E.C. The discomfort index. Weatherwise 1959, 12, 57–61. [Google Scholar]
  41. R Core Team. R: A Language and Environment for Statistical Computing; R Foundation for Statistical Computing: Vienna, Austria, 2024; Available online: https://www.R-project.org/ (accessed on 27 April 2024).
  42. Ribeiro, P.J., Jr.; Diggle, P.; Christensen, O.; Schlather, M.; Bivand, R.; Ripley, B. geoR: Analysis of Geostatistical Data, R package version 1.9-4; 2024. Available online: http://www.leg.ufpr.br/geoR/ (accessed on 29 April 2024).
  43. Oliveira, R.A.; Souza, C.F.; Silva, R.C.; Lima, R.R. Spatial variability of environmental variables in a free-stall barn. Rev. Bras. Eng. Agríc. Ambient. 2017, 21, 410–414. [Google Scholar]
  44. Bachmaier, M.; Backers, M. Variogram or semivariogram? understanding the variances in a variogram. Prec. Agric. 2008, 9, 173–175. [Google Scholar] [CrossRef]
  45. Ferraz, P.F.P.; Ferraz, G.A.S.; Schiassi, L.; Nogueira, V.H.B.; Barbari, M.; Damasceno, F.A. Spatial variability of litter temperature, relative air humidity and skin temperature of chicks in a commercial broiler house. Agron. Res. 2019, 17, 408–417. [Google Scholar]
  46. Cambardella, C.A.; Moorman, T.B.; Novak, J.M.; Parkin, T.B.; Karlen, D.L.; Turco, R.F.; Konopka, A.E. Field-scale variability of soil properties in central Iowa soils. Soil Science Society of America journal. Soil Sci. Soc. Am. J. 1994, 58, 1501–1511. [Google Scholar] [CrossRef]
  47. Ferraz, G.A.S.; Silva, F.M.; Oliveira, M.S.; Custódio, A.A.P.; Ferraz, P.F.P. Spatial variability of plant attributes in a coffee plantation. Ver. Ciênc. Agron. 2017, 48, 81–91. [Google Scholar] [CrossRef]
  48. Golden Software, L.L.C. Surfer (Version 13.4.553) Computer Software. Golden Software: Golden, CO, USA, 2016. Available online: https://www.goldensoftware.com/products/surfer (accessed on 28 April 2023).
  49. Frigeri, K.D.M.; Deniz, M.; Damasceno, F.A.; Barbari, M.; Herbut, P.; Vieira, F.M.C. Effect of Heat Stress on the Behavior of Lactating Cows Housed in Compost Barns: A Systematic Review. Appl. Sci. 2023, 13, 2044. [Google Scholar] [CrossRef]
  50. Rosanova, C.; Rebouças, G.F.; da Silva, M.D.M.P.; Rezende, D.M.L.C.; da Rocha, A.S.; Pereira Junior, A.; da Silva, E.W. Determinação do ITU–índice de temperatura e umidade da região de Araguaína-TO para avaliação do conforto térmico de bovinos leiteiros. Braz. J. Dev. 2020, 6, 69254–69258. [Google Scholar] [CrossRef]
  51. Mader, T.L.; Davis, M.S.; Brown-Brandl, T. Environmental factors influencing heat stress in feedlot cattle. J. Anim. Sci. 2006, 84, 712–719. [Google Scholar] [CrossRef] [PubMed]
  52. da Silva, M.V.; de Almeida, G.L.P.; Pandorfi, H.; Moraes, A.S.; de Almeida Macêdo, G.A.P.; Batista, P.H.D.; da Silva, R.A.B.; Quiselini, C. Influence of meteorological elements on behavioral responses of gir cows and effects on milk quality. Acta scientiarum. Anim. Sci. 2021, 43, e52604. [Google Scholar] [CrossRef]
  53. Nogara, K.F.; Bill Kaelle, G.C.; Gouveia Tavares, Q.; Marcon, T.R.; Gopinger, E.; Zopollatto, M.; Debortoli, E.d.C. Influência das estações do ano sobre a qualidade microbiológica do leite de fazendas leiteiras da região norte do Rio Grande do Sul, Brasil. Braz. Anim. Sci. 2022, 23, e-72795P. [Google Scholar] [CrossRef]
  54. Almeida, J.V.N.; Marques, L.R.; Marques, T.C.; Guimarães, K.C.; Leão, K.M. Influence of thermal stress on the productive and reproductive aspects of cattle—Review. Res. Soc. Dev. 2020, 9, e230973837. [Google Scholar] [CrossRef]
  55. Baumgard, L.H.; Rhoads, R.P., Jr. Effects of heat stress on postabsorptive metabolism and energetics. Annu. Rev. Anim. Biosci. 2013, 1, 311–337. [Google Scholar] [CrossRef]
  56. Hansen, P.J.; Fuquay, J.W. Stress in Dairy Animals Heat Stress: Effects on Reproduction. In Reference Module in Food Science; Academic Press: Cambridge, MA, USA, 2016. [Google Scholar] [CrossRef]
  57. Tao, S.; Orellana, R.M.; Weng, X.; Marins, T.N.; Dahl, G.E.; Bernard, J.K. Symposium Review: The Influences of Heat Stress on Bovine Mammary Gland Function. J. Dairy Sci. 2018, 101, 5642–5654. [Google Scholar] [CrossRef]
  58. Staples, C.R.; Thatcher, W.W. Heat Stress: Effects on Milk Production and Composition, 2nd ed.; Elsevier Ltd.: Amsterdam, The Netherlands, 2011; pp. 561–566. [Google Scholar]
  59. Soriani, N.; Panella, G.; Calamari, L. Rumination Time during the Summer Season and Its Relationships with Metabolic Conditions and Milk Production. J. Dairy Sci. 2013, 96, 5082–5094. [Google Scholar] [CrossRef] [PubMed]
  60. de Almeida Neto, L.A.; Pandorfi, H.; de Almeida, G.L.; Guiselini, C. Pre-milking acclimatization of ‘Girolando’ cows during the winter in the semiarid region. Rev. Bras. Eng. Agríc. Ambient. 2014, 18, 1072–1078. [Google Scholar]
  61. Danieli, B.; Barreta, D.A.; Schogor, A.L.B. Características e recomendações de gerenciamento no confinamento de vacas de leite em compost barn: Revisão. Sci. Agrar. 2018, 19, 249–255. [Google Scholar] [CrossRef]
  62. Dal Más, F.E.; Debiage, R.R.; Schuh, B.R.F.; Guirro, E.C.B.P. Estresse térmico em bovinos leiteiros—Impactos, avaliação e medidas de controle. Rev. Vet. Foco 2020, 17, 2. [Google Scholar]
  63. Lobeck, K.M.; Endres, M.I.; Shane, E.M.; Godden, S.M.; Fetrow, J. Animal Welfare in Cross-Ventilated, Compost-Bedded Pack, and Naturally Ventilated Dairy Barns in the Upper Midwest. J. Dairy Sci. 2011, 94, 5469–5479. [Google Scholar] [CrossRef] [PubMed]
  64. Janni, K.A.; Endreas, M.I.; Reneau, J.K.; Schoper, W.W. Compost Dairy Barn Layout and Management Recommendations. Appl. Eng. Agric. 2007, 23, 97–102. [Google Scholar] [CrossRef]
  65. Leso, L.; Barbari, M.; Lopes, M.A.; Damasceno, F.A.; Galama, P.; Taraba, J.L.; Kuipers, A. Invited Review: Compost-Bedded Pack Barns for Dairy Cows. J. Dairy Sci. 2020, 103, 1072–1099. [Google Scholar] [CrossRef]
  66. Eckelkamp, E.A.; Taraba, J.L.; Akers, K.A.; Harmon, R.J.; Bewley, J.M. Understanding Compost Bedded Pack Barns: Interactions among Environmental Factors, Bedding Characteristics, and Udder Health. Livest. Sci. 2016, 190, 35–42. [Google Scholar] [CrossRef]
  67. Llonch, L.; Castillejos, L.; Mainau, E.; Manteca, X.; Ferret, A. Effect of Forest Biomass as Bedding Material on Compost-Bedded Pack Performance, Microbial Content, and Behavior of Nonlactating Dairy Cows. J. Dairy Sci. 2020, 103, 10676–10688. [Google Scholar] [CrossRef]
  68. Radavelli, W.M.; Danieli, B.; Zotti, M.L.A.N.; Gomes, F.J.; Endres, M.I.; Schogor, A.L.B. Compost barns in Brazilian Subtropical region (Part 1): Facility, barn management and herd characteristics. Res. Soc. Dev. 2020, 9, e445985198. [Google Scholar] [CrossRef]
  69. Gaughan, J.B.; Mader, T.L.; Holt, S.M.; Lisle, A. A New Heat Load Index for Feedlot Cattle. J. Anim. Sci. 2008, 86, 226–234. [Google Scholar] [CrossRef] [PubMed]
  70. Bewley, J.M.; Taraba, J.L.; Day, G.B.; Black, R.A. Compost Bedded Pack Barn Design Features and Management Considerations. In Cooperative Extension Publ. ID-206; Cooperative Extension Service, University of Kentucky College of Agriculture: Lexington, KY, USA, 2012; p. 150. [Google Scholar]
  71. Berman, A. Invited review: Are adaptations present to support dairy cattle productivity in warm climates? J. Dairy Sci. 2011, 94, 2147–2158. [Google Scholar] [CrossRef]
  72. Ding, L.; Cao, W.; Shi, Z.; Li, B.; Wang, C.; Zhang, G.; Kristensen, S. Carbon Dioxide and Methane Emissions from the Scale Model of Open Dairy Lots. J. Air Waste Manag. Assoc. 2016, 66, 715–725. [Google Scholar] [CrossRef]
  73. Hempel, S.; Saha, C.K.; Fiedler, M.; Berg, W.; Hansen, C.; Amon, B.; Amon, T. Non-Linear Temperature Dependency of Ammonia and Methane Emissions from a Naturally Ventilated Dairy Barn. Biosyst. Eng. 2016, 145, 10–21. [Google Scholar] [CrossRef]
  74. Jungbluth, T.; Hartung, E.; Brose, G. Greenhouse Gas Emissions from Animal Houses and Manure Stores. Nutr. Cycl. Agroecosyst. 2001, 60, 133–145. [Google Scholar] [CrossRef]
  75. Negussie, E.; Lehtinen, J.; Mäntysaari, P.; Bayat, A.R.; Liinamo, A.E.; Mäntysaari, E.A.; Lisauer, M.H. Non-invasive individual methane measurement in dairy cows. Animal 2017, 11, 890–899. [Google Scholar] [CrossRef] [PubMed]
  76. Niero, G.; Cendron, F.; Penasa, M.; Marchi, M.; Cozzi, G.; Cassandro, M. Repeatability and Reproducibility of Measures of Bovine Methane Emissions Recorded Using a Laser Detector. Animals 2020, 10, 606. [Google Scholar] [CrossRef]
  77. Sejian, V.; Bhatta, R.; Soren, N.M.; Malik, P.K.; Ravindra, J.P.; Prasad, C.S.; Lal, R. Introduction to Concepts of Climate Change Impact on Livestock and Its Adaptation and Mitigation. Clim. Risk Manag. 2017, 16, 145–163. [Google Scholar]
  78. Fiedler, N.C.; Ramalho, A.H.C.; Falcão, R.S.; Menezes, R.A.S.; Biazatti, L.D. Emissão de Gases Tóxicos em Incêndios Florestais. Cienc. Florest. 2023, 33, e62965. [Google Scholar] [CrossRef]
  79. Bewley, J.M.; Robertson, L.M.; Eckelkamp, E.A. A 100-Year Review: Lactating Dairy Cattle Housing Management. J. Dairy Sci. 2017, 100, 10418–10431. [Google Scholar] [CrossRef]
Figure 1. Three-dimensional representation of the compost barn and its dimensions (m).
Agriengineering 07 00158 g001
Figure 2. Indication of the 80 points where data were collected in the compost barn.
Agriengineering 07 00158 g002
Figure 3. Sawdust bed (a), feeding track in the compost barn (b), and the support structure used to fix the sensors at heights of 0.25 m and 1.5 m (c).
Agriengineering 07 00158 g003
Figure 4. Spatial distribution of the Temperature and Humidity Index (THI) at 0.25 m during the five evaluated days: (a) day 1, (b) day 2, (c) day 3, (d) day 4, and (e) day 5.
Agriengineering 07 00158 g004
Figure 5. Spatial distribution of the Temperature and Humidity Index (THI) at 1.5 m during the five evaluated days: (a) day 1, (b) day 2, (c) day 3, (d) day 4, and (e) day 5.
Agriengineering 07 00158 g005
Figure 6. Spatial distribution of the Air Velocity (V, m.s−1) at 0.25 m over the five evaluated days: (a) day 1, (b) day 2, (c) day 3, (d) day 4, and (e) day 5.
Agriengineering 07 00158 g006
Figure 7. Spatial distribution of the Air Velocity (V, m.s−1) at 1.5 m during the five evaluated days: (a) day 1, (b) day 2, (c) day 3, (d) day 4, and (e) day 5.
Agriengineering 07 00158 g007
Figure 8. Spatial distribution of the methane (CH4) at 0.25 m during the five evaluated days: (a) day 1, (b) day 2, (c) day 3, (d) day 4, and (e) day 5.
Agriengineering 07 00158 g008
Figure 9. Spatial distribution of the methane (CH4) at 1.5 m over the five evaluated days: (a) day 1, (b) day 2, (c) day 3, (d) day 4, and (e) day 5.
Agriengineering 07 00158 g009
Figure 10. Spatial distribution of the carbon dioxide (CO2) at 0.25 m during the five evaluated days: (a) day 1, (b) day 2, (c) day 3, (d) day 4, and (e) day 5.
Agriengineering 07 00158 g010
Figure 11. Spatial distribution of the carbon dioxide (CO2) at 1.5 m during the five evaluated days: (a) day 1, (b) day 2, (c) day 3, (d) day 4, and (e) day 5.
Agriengineering 07 00158 g011
Table 1. Estimated parameters using the Restricted Maximum Likelihood (REML) method and the spherical model of experimental semivariograms for environmental variables—Temperature and Humidity Index (THI) and Air Velocity (V) over five days.
E.VhDay(C0)(C1)(C0 + C1)aDSDMESDmRESDR
THI0.2510.001.001.0020.450.00Strong0.0020.4590.0010.990
20.001.451.4531.860.00Strong0.0020.4570.0020.995
30.000.880.8830.770.38Strong0.0030.3600.0041.002
40.000.570.5724.810.00Strong0.0020.3080.0040.963
50.001.171.1731.640.00Strong−0.0020.397−0.0020.957
1.510.001.521.523.000.00Strong0.0001.247−4.5 × 10161.006
20.000.670.6731.880.00Strong−0.0020.266−0.0040.845
30.000.680.6836.800.00Strong0.0030.2760.0050.963
40.000.550.5523.440.00Strong0.0030.2880.0040.887
50.001.171.1731.640.00Strong−0.0010.290−0.0010.685
V0.2510.091.011.109.088.25Strong−0.0070.778−0.0040.996
20.020.930.947.971.94Strong−0.0030.761−0.0021.012
30.490.551.048.3847.22Moderate−0.0040.955−0.0021.006
40.120.991.1211.4311.12Strong−0.0070.744−0.0051.006
50.241.101.3412.6717.74Strong−0.0040.826−0.0031.000
1.510.001.081.085.380.00Strong−0.0020.960−0.0010.977
20.000.940.945.400.00Strong−0.0020.924−0.0011.004
30.690.260.9538.3972.62Moderate−0.0020.884−0.0011.005
40.000.660.667.590.00Strong−0.0070.612−0.0060.955
50.001.211.215.500.00Strong−0.0051.024−0.0020.991
E.V—Environmental variables; h—height (m); C0—nugget effect; C1—contribution; C0 + C1—sill variance; a—range; DSD—degree of spatial dependence; ME—mean error; SDm—standard deviation of the mean error; RE—reduced error; SDR—standard deviation of reduced error.
Table 2. Estimated parameters using the Restricted Maximum Likelihood (REML) method and the spherical semivariograms model for the gasses—methane (CH4) and carbon dioxide (CO2) over five days.
GasseshDay(C0)(C1)(C0 + C1)aDSDMESDmRESDR
CH40.2510.000.880.883.000.00Strong−1.1 × 10−140.951−1.1 × 10−141.006
20.000.720.723.000.00Strong−6.6 × 10−140.858−7.7 × 10−141.006
30.280.670.9529.6129.70Moderate0.0040.6680.0031.006
40.002.592.593.000.00Strong7.1 × 10−151.6294.4 × 10−151.006
51.201.222.4334.3749.61Moderate0.0021.2530.0011.011
1.5193.85949.261043.1124.209.00Strong0.04017.1640.0011.004
20.00673.90673.903.000.00Strong−1.4 × 10−1426.288−5.4 × 10−161.006
30.00624.32624.3222.210.00Strong−0.07910.678−0.0030.971
485.24702.07787.3119.1510.83Strong−0.17916.522−0.0051.004
50.00706.37706.3718.540.00Strong0.06013.0470.0020.997
CO20.251149.791044.151193.947.6812.55Strong−0.09628.706−0.0021.000
2407.62983.481391.107.7429.30Moderate−0.17433.393−0.0031.004
30.001143.541143.549.0910.00Strong−0.25723.803−0.0051.001
4128.99777.12906.118.2114.24Strong0.04824.9770.0011.010
5674.021368.082042.1010.4733.01Moderate0.20538.9370.0031.017
1.51224.57192.05416.6212.8553.90Moderate−0.02518.347−0.0011.007
2157.66312.47470.1314.4633.54Moderate−0.01716.9030.0001.000
369.60240.83310.439.7322.42Strong−0.08914.111−0.0031.000
4205.87261.11466.9819.0644.09Moderate−0.03217.717−0.0011.012
5212.32160.55372.8717.8456.94Moderate0.01716.8990.0011.004
h—height (m); C0—nugget effect; C1—contribution; C0 + C1—sill variance; a—range; DSD—degree of spatial dependence; ME—mean error; SDm—standard deviation of the mean error; RE—reduced error; SDR—standard deviation of reduced error.
Disclaimer/Publisher’s Note: The statements, opinions and data contained in all publications are solely those of the individual author(s) and contributor(s) and not of MDPI and/or the editor(s). MDPI and/or the editor(s) disclaim responsibility for any injury to people or property resulting from any ideas, methods, instructions or products referred to in the content.

