1. Introduction
Flock weighing is a fundamental practice in poultry farming, as it allows for the continuous monitoring of bird development. Although manual weighing is still widely used in commercial systems, it presents operational limitations. With advances in microelectronics, automated systems have been developed to optimize this process. However, the adoption of such technologies faces resistance and requires technical and scientific comparisons with traditional methods. Therefore, it is necessary to evaluate the efficiency of different weighing systems available, considering current technological advancements [
1].
Manual weighing, which predominates in commercial poultry farms, is considered inefficient due to the extensive time required per bird (averaging 7 to 27 s per animal—observational data), the physical effort demanded from the staff, and the stress caused to the birds by handling [
2,
3]. Additionally, it is prone to reading errors and sampling bias, especially due to the tendency to capture heavier and less agile birds [
4,
5].
Automatic weighing consists of one or more platforms connected to an analysis and/or data transfer unit. The birds voluntarily step onto the weighing platform and data are recorded. Some scales have technology to detect and differentiate the presence of one or more birds, as well as disregarding waste deposited on the weighing platform. Automatic weighing would allow for the continuous monitoring of the weight of the flock, without placing stress on the birds or requiring a high intensity of labor in order to obtain this information. One of the questions regarding weighing sampling is whether or not it is necessary to perform it in different areas in the shed. This is true for both the manual and automatic methods.
Despite technological advances in the automation of broiler weighing, there are still limitations regarding the reliability of the data generated, especially during the final stages of the rearing period. Previous studies have reported inconsistencies between weights obtained through automatic and manual methods, with divergent results in terms of accuracy and sample representativeness [
1,
3,
6]. While some authors have found equivalence between weighing methods, others have observed the under- or overestimation of both the weights and the number of birds assessed automatically [
7,
8,
9,
10]. These discrepancies highlight the need for a systematic evaluation of the efficiency and reliability of different weighing methods in commercial environments, considering factors that may influence the quality of the data collected throughout the production cycle. Given the previously identified issues, we hypothesize that manual weighing differs from automatic weighing, and that weight variations exist across different regions of the shed.
The objective of this study was to evaluate the existence of discrepancies between manual and automatic weighing systems with the use of platforms in real production situations. Specifically, we want to (i) compare, at each stage of flock development, the results of automatic weighing technology with manual weighing, and (ii) analyze the effect of different regions of the shed on the live weight of the birds using manual and automatic scales.
2. Materials and Methods
2.1. Characterization of the Experimental Area and Animals
This research was developed on a commercial broiler farm located in the city of Itu—SP (23°19′02.0″ S 47°23′05.2″ W). The climate of the region is CWA according to the Köppen Classification. Two production cycles were evaluated.
This study was conducted in an agro-industrial production complex consisting of 10 poultry sheds (150 m long, 12 m wide, and 2.5 m high) and a blue house model, oriented in an east–west direction. The sheds had an automatic line of feeders and nipple drinkers. The adiabatic evaporative cooling system consisted of cellulose evaporative plates, with negative pressure through the use of eight exhaust fans on the transverse walls opposite to the direction of air intake in the facility. The distance between the sheds was 15 m. Production was characterized by an average density of 14 birds/m2, totaling 25 thousand birds housed in each shed. Two complete production cycles were evaluated, with three sheds being evaluated in each cycle, totaling six sheds, and 150,000 mixed-sex Cobb and Hubbard Flex birds were used. Feeding was automated on three feeding lines, ad libitum, according to the phases (pre-starter, starter, growth, and slaughter), and the vaccination and medication protocol was carried out in accordance with the company’s guidelines.
2.2. Description of Weighing Systems
2.2.1. Automatic Weighing
Automatic weighing was performed continuously; however, for comparison between the average weight of the flock, the weighings related to the day of manual weighing were considered. The scale used for automatic weighing in this study was the BAT2 model (Veit Electronics®, Moravany, Czech Republic). It had a maximum operational capacity of 100 kg, an accuracy of 0.1%, and a resolution of 1 g. The scale was programmed so that the weights were recorded when the birds climbed up and down the weighing platform. A weight correction curve was used with the addition of 7% according to previous experiences under commercial conditions (pilot test), higher than that recommended by the supplier.
Four automatic scales were installed in each shed, distributed along the length of the facility as shown in
Figure 1. This distribution was not performed so that the platforms were equidistant. In this case, it was decided to centralize them on the partitions which previously existed in the shed due to the management with migration fences adopted by the producer. The scales were positioned between the line of feeders and drinkers.
It is worth noting that between 1 and 20 days, the birds remained only in Division 2, where the “chicken coop” was located. Therefore, only scale 2 of each shed was used during this period. As the flock grew, the area available for the birds increased, and consequently the number of scales that were used increased.
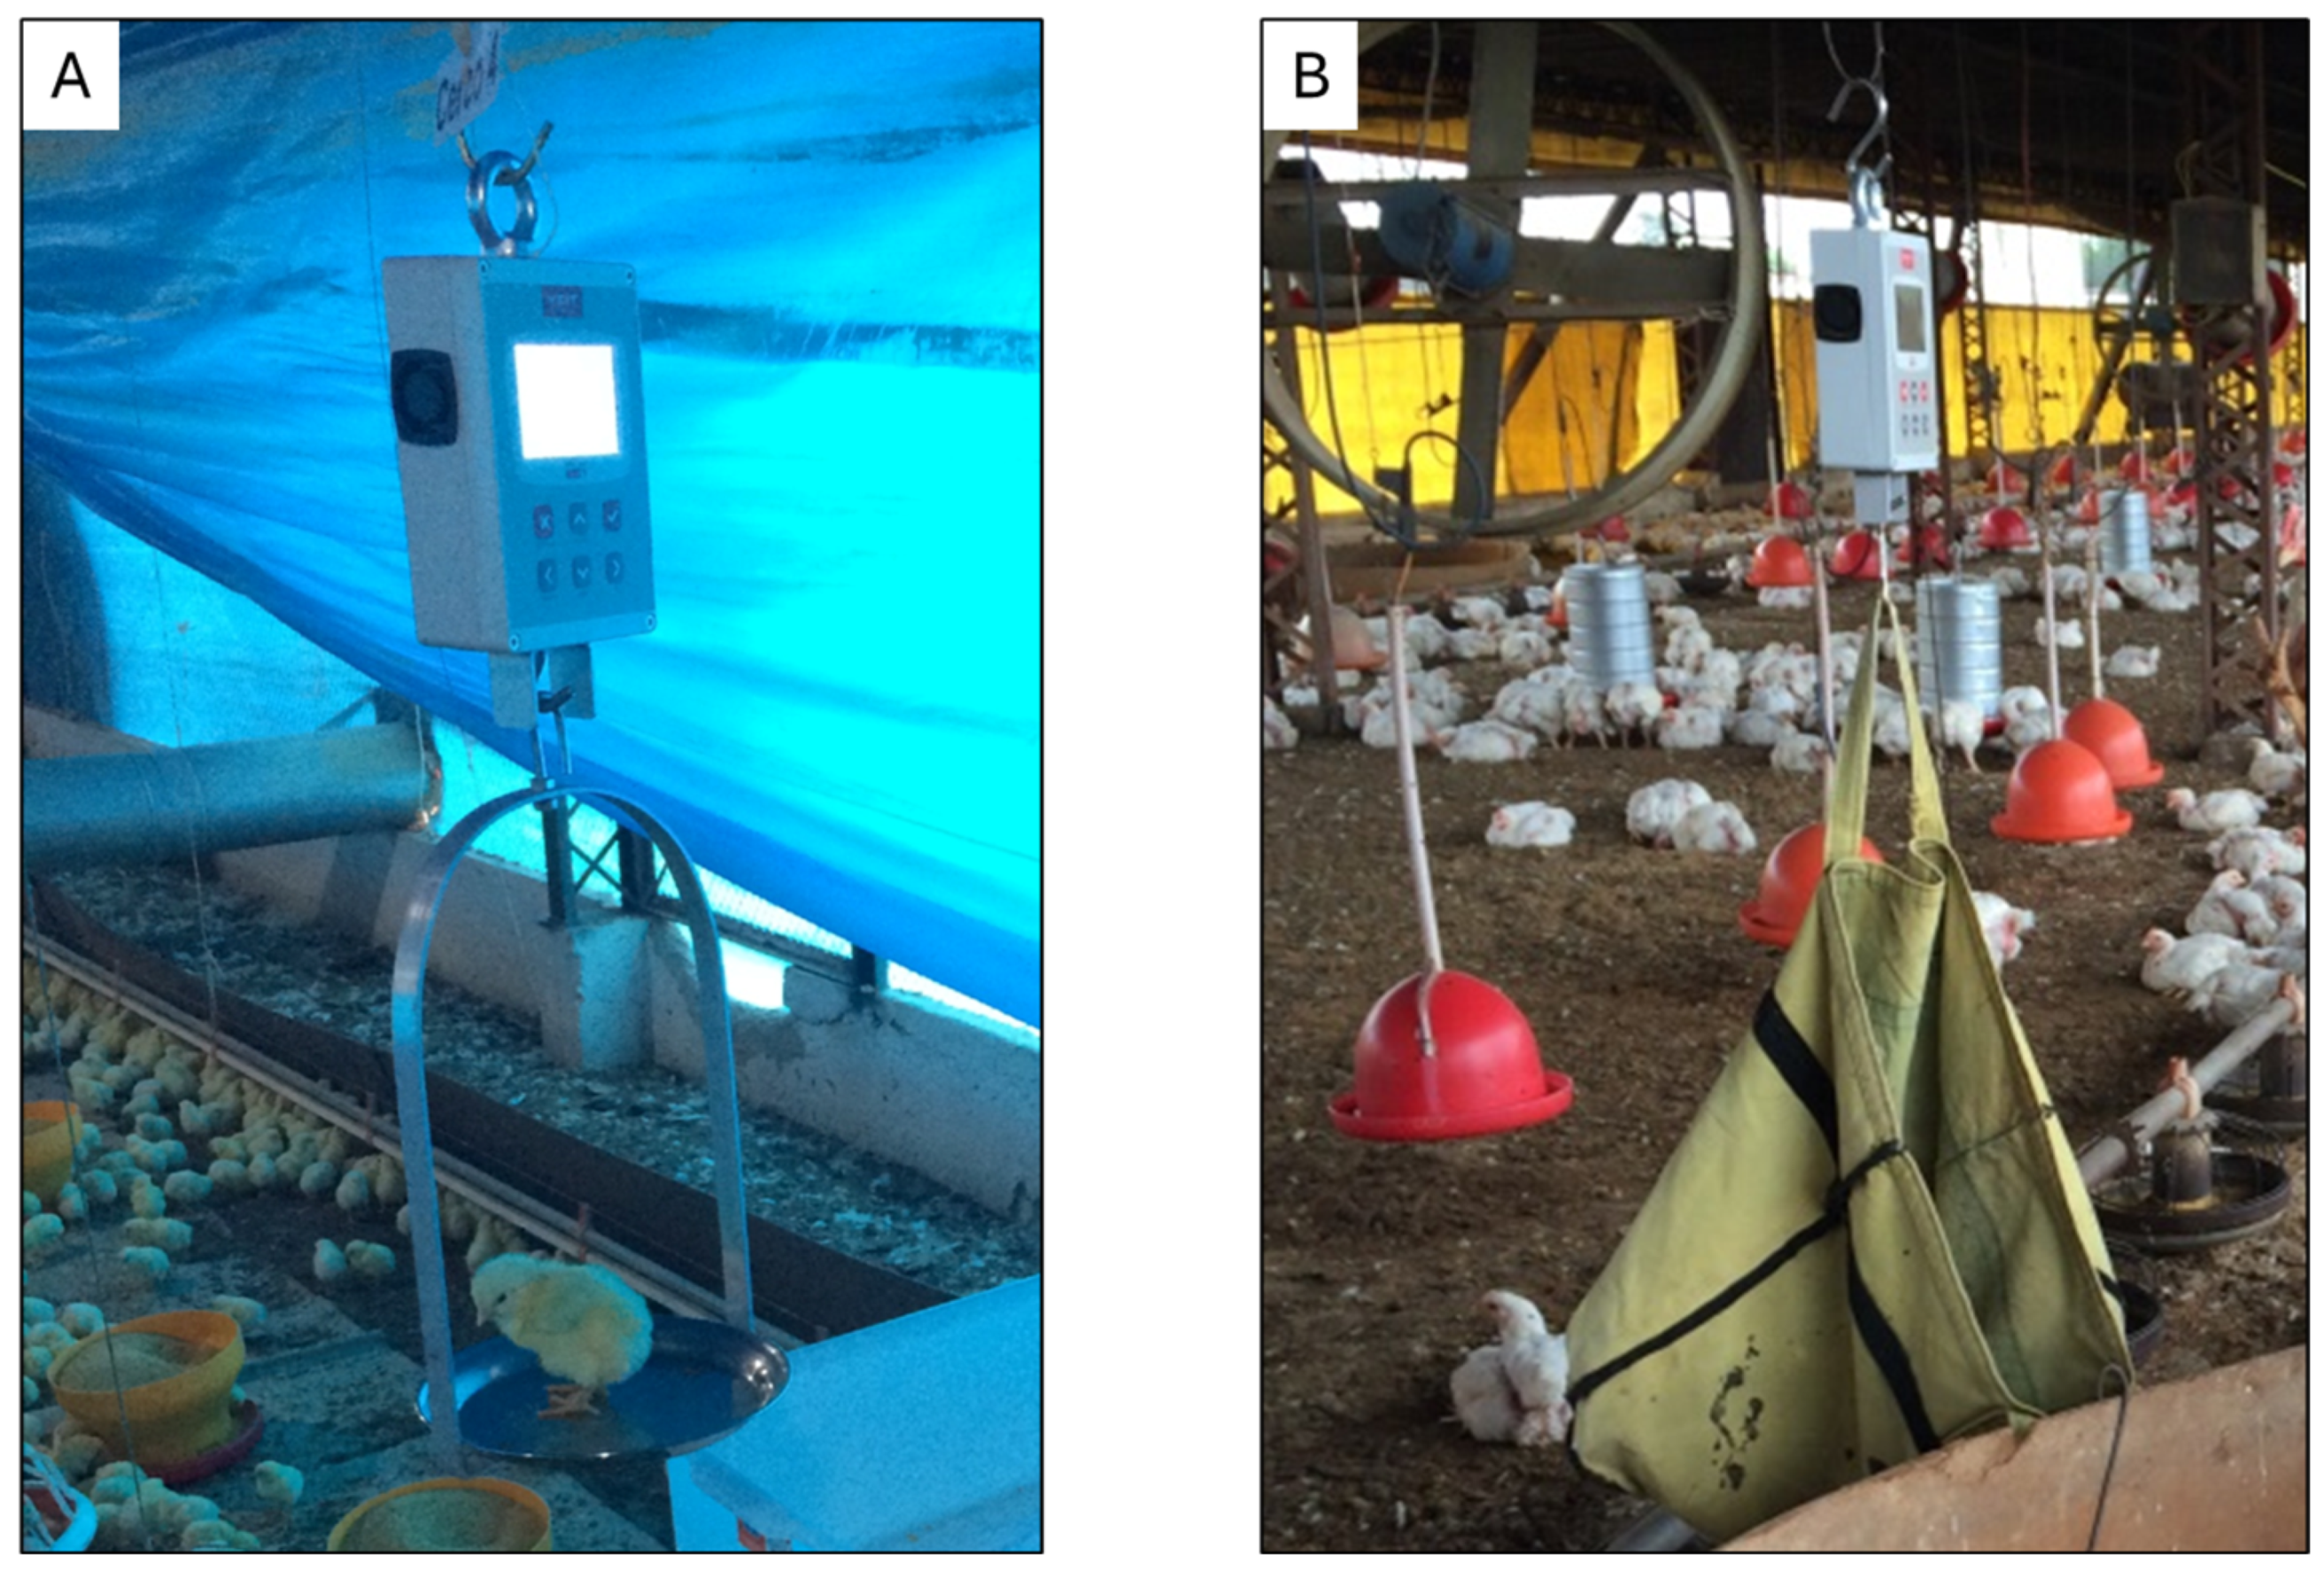
The location and use of the scales in the experimental area can be seen in
Figure 2.
2.2.2. Manual Weighing
Manual weighings were performed weekly according to the growth of the birds, ending in the 7th week. It should be considered that the flocks were not all housed on the same day, thus presenting an age window between the flocks of each phase. Therefore, the weighings were planned to meet the demands of each flock. Since the housings were carried out on different days, in order to standardize the weighings every 7 days, there was an adjustment in the readings between the first and second week. Therefore, from the second week onwards, the weighings were performed at weekly intervals, as described in
Table 1.
The BAT1 digital scale (Veit Electronics) was used for manual weighing. The maximum operational capacity was up to 50 kg and the resolution was 1 g.
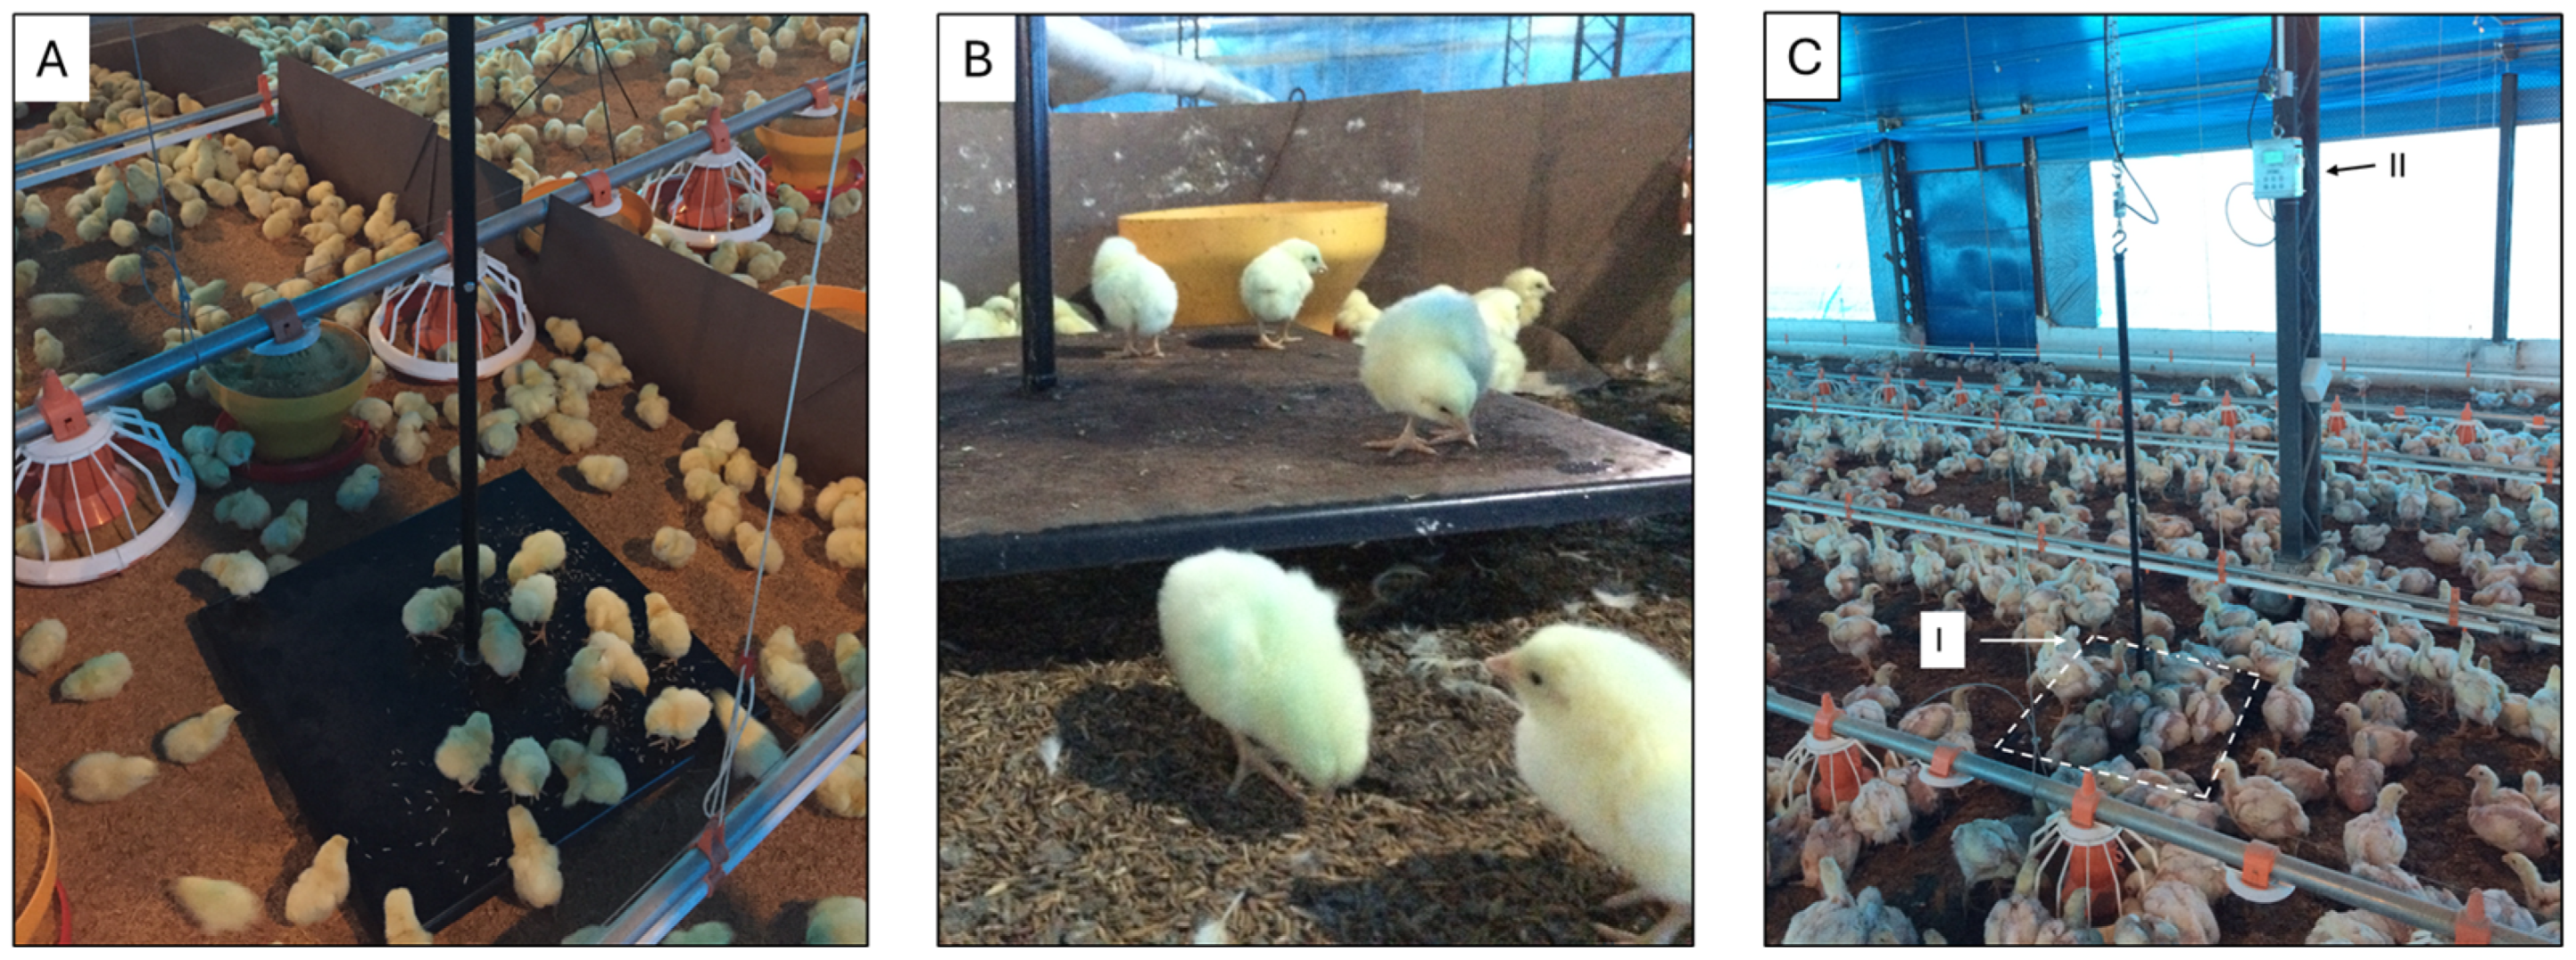
According to the age group of the birds, different handling methods were adopted to adapt to their characteristics, using plates and bags for weighing as follows (
Figure 3):
Manual weighing always occurred in the quadrant where the automatic scale was installed. Weighing management followed the changes that commonly occur in a production system, according to the opening of the brooders. These, in turn, are opened and released according to the development of the birds. Therefore, the spatial variability of manual weighing positioning followed this management. The distribution layout of the automatic scales and manual weighing positions can be seen in
Figure 1.
It should be considered that there was a weekly adjustment depending on the opening of the breeding circles and their age. The general scheme of animals sampled during the production cycle can be seen in
Table 2.
The decision to adopt 30 birds per measurement point was based on a previous experience (pilot test), in which all the fenced birds were initially weighed at the time of weighing. After preliminary analyses of these data (variance stabilization analysis), it was concluded that it was not necessary to collect data from all fenced birds. Therefore, 30 birds were evaluated per weighing point.
2.3. Statistical Methods
In order to study the divisions in animal performance, a completely randomized design was adopted for the division variables from the fourth week onwards. Each weighing in each division during the week was considered a repetition. First, the assumptions of data normality and homogeneity of variance were tested using the Kolmogorov–Smirnov (normality) and Box–Cox (homoscedasticity) tests. Thus, the dependent variables, weight and temperature, were transformed in order to stabilize the variance. After that, an analysis of variance (ANOVA) was performed to test the hypotheses at a probability level of 95%. The ANOVA was performed using the GLM (General Linear Models) procedure of the SAS 9.3, 2011 (Statistical Analysis System) statistical program, considering the Sum of Squares type III due to the sample imbalance for all designs. Finally, a Tukey–Kramer mean comparison test was performed, at a probability level of 95%, to determine in which treatment there is a difference between the estimated means, if the ANOVA indicated a significant difference between the treatments for each situation studied.
To represent the structure of the statistical analysis, the following equation describes the general linear model (GLM) applied in the analysis of variance:
where Y
ij = observed value of the dependent variable (weight or temperature) in the
ith division and
jth repetition; μ = overall mean; α
i = fixed effect of the ith division; and ε
ij = random error associated with each observation, assumed to be normally distributed with mean zero and constant variance, ε
ij∼N(0, σ
2).
3. Results and Discussion
The highest frequency of weighings was recorded in the second week (2385 records), while the lowest occurred in the seventh week (718 records). A decreasing linear trend was also observed in the number of birds accessing the platform over the weeks.
3.1. Comparative Analysis of Shed Regions
There were differences (
p < 0.005) between the partitions of the broiler sheds in all divisions from the 4th to 7th week when the birds were weighed with automatic scales. The opposite was observed for the birds weighed with manual scales, in which the weights between the partitions were similar (
p > 0.05) in the weeks evaluated, with the exception of the last week of evaluation (
Table 3).
This result is explained by the difference in the sample size of these two methods, since manual weighing collected 60 birds in each division and automatic scales easily reached the mark of 1000 daily records. However, it is worth noting from a commercial point of view that the differences between the maximum and minimum values between the partitions are small, except in the last week, which would not have an impact on the poultry industry, although there is a statistical difference between the partitions of the sheds, especially in the automatic case.
The lower weights of the birds in division 4, both in the sheds with automatic or manual scales, can be explained by the higher air temperature in division 4 (
Table 4), which possibly caused thermal stress in the animals, affecting their performance [
11].
This thermal variability in negative pressure ventilation sheds is quite common. Nascimento et al. [
12] found a thermal difference between quadrants of negative pressure ventilation poultry houses, i.e., spatial thermal heterogeneity. Miragliotta et al. [
13] also observed high spatial thermal variability in the shed, similar to what was found in this study. The authors Menegali et al. [
14] and Damasceno et al. [
15] commented on the inefficiency and thermal heterogeneity throughout the negative pressure ventilation system sheds for broilers. Even though partitions 4 and 3 had the lowest house temperatures compared to the others, it is worth noting that these were outside the ideal ranges (22 °C) [
15]. When broilers are within the thermoneutral zone, they present higher production rates (weight gain, feed conversion, etc.) [
16,
17,
18].
In general, based on the data presented in
Table 3, it can be concluded that there were no statistical differences in the positioning of the dividers in the manual weighing, except in the 7th week. On the other hand, in the automatic weighings there were differences in all dividers and in all weeks, evidencing that this weighing method is more sensitive to identify common weight variability across the shed. Therefore, it is suggested that one automatic scale is not sufficiently representative of a flock and that platforms should also be placed in the different quadrants of a shed.
3.2. Comparison Between Manual and Automatic Weighing Results
The comparison between the weights obtained by the manual and automatic methods was performed at the ages at which the manual weighings occurred, as described in
Table 1. For all ages, with the exception of weights in week 5, there was a statistical difference between the weights obtained by automatic and manual weighing. The results are described in
Table 5.
The largest discrepancy occurred in the 1st week of evaluation (+10%), while in the 5th week, the measurements coincided (0%). This variation can be attributed to the lower accuracy of manual scales when weighing young animals, whose reduced body weight amplifies small absolute differences in relative terms. Furthermore, manual handling is more prone to operational errors, such as animal instability, inaccurate readings, or inadequate calibration. The progressive adaptation of the animals to the automatic scale may have also contributed to the reduction in variations over time. The convergence of values in the following weeks reinforces the reliability of the automatic scales, especially after the initial adaptation phase, with the potential to enhance the accuracy of zootechnical data, minimize animal stress, and streamline management.
These results are in agreement with Newberry et al. [
2] and Blokhuis et al. [
7], who concluded that the average weight obtained automatically was lower than that obtained manually. However, Schomburg et al. [
8] compared automatic and manual weighing, observing that automatic weighing overestimated the number of animals due to occasional problems with system recalibration, which resulted in measured weights greater than the actual weights. However, other authors found results contrary to this work, such as Turner et al. [
1,
6] and Doyle and Leeson [
3], who found no statistical differences between automatic and manual weighing. These research results should be considered in the way in which they were performed, whether on laboratory or production scales, and especially in the particularity of the equipment evaluated. However, some researchers obtained different results for manual and automatic weighing.
Vranken et al. [
19], when comparing automatic weighing with manual weighing, found reductions of 1%; 14%; 4%; −6%; −2%, and −14% for the 2nd, 3rd, 4th, 5th, 6th, and 7th weeks, respectively. The authors did not describe whether or not they used any correction curves. These authors sought to use image analysis in conjunction with the automatic scale to create an algorithm that would help provide a better estimate of flock weight and obtained an error of 5% more than manual weighing in the 7th week.
4. Conclusions
Manual and automatic weighings showed slight differences in the weighing of birds. Although there were statistical differences between sections of the barn in weeks 4, 5, and 6, these do not compromise management decisions, allowing for the recommendation of using the automatic scale in a representative quadrant during these phases. However, in the final week of production, when weight precision is crucial for commercial and slaughter decisions, it is essential to have a scale in each quadrant, regardless of the weighing method.
Thus, the rational use of automatic scales can optimize the monitoring of broiler performance, reduce excessive handling, and consequently minimize animal stress, promoting greater welfare. Additionally, standardizing the use of scales at strategic points in the barn contributes to the technological efficiency of the production system, combining data accuracy with reduced operational costs and improved decision-making.
Author Contributions
I.M.D.L.P.—Data collection, Writing—original draft, Conceptualization, Data curation, Methodology, Writing—original draft, Validation; R.M.F.S.—Writing—original draft, Validation; J.N.R.—Data collection, Conceptualization; H.T.Z.C.—Data analysis; I.J.O.d.S.—Data collection, Writing—original draft, Conceptualization, Data curation, Methodology, Writing—original draft, Validation. All authors have read and agreed to the published version of the manuscript.
Funding
The authors declare that this study received funding from Elanco Animal Health. The funder had the following involvement with the study: material acquisition.
Institutional Review Board Statement
The experiment was approved by the Ethics Committee for the Use of Animals (CEUA) of ESALQ (Protocol 2015-12).
Informed Consent Statement
No applicable.
Data Availability Statement
The original contributions presented in this study are included in the article. Further inquiries can be directed to the corresponding author(s).
Conflicts of Interest
Author Pasian is a former employee of Elanco Animal Health. Author Reple works for Elanco Animal Health. The remaining authors declare that the research was conducted in the absence of any commercial or financial relationships that could be construed as a potential conflict of interest.
References
- Turner, M.J.B.; Gurney, P.; Belyavin, C.G. Automatic weighing of layer-replacement pullets housed on litter or in cages. Br. Poult. Sci. 1983, 24, 33–45. [Google Scholar] [CrossRef]
- Newberry, R.C.; Hunt, J.R.; Garriner, E.E. Behaviour of roaster chickens towards an automatic weighing perch. Br. Poult. Sci. 1985, 26, 229–237. [Google Scholar] [CrossRef]
- Doyle, I.; Leeson, S. Automatic weighing of poultry reared on a litter floor. Can. J. Anim. Sci. 1989, 69, 1075–1081. [Google Scholar] [CrossRef]
- Feighner, S.D.; Godowsky, E.F.; Miller, B.M. Portable microcomputer-based weighing systems: Applications in poultry science. Poult. Sci. 1986, 65, 868–873. [Google Scholar] [CrossRef]
- Meijerhof, R. Automatic weighing system gives advantages. Pluimveehouderij 1989, 19, 12–13. [Google Scholar]
- Turner, M.J.B.; Gurney, P.; Crowther, V.S.W.; Sharp, J.W. An automatic weighing system for poultry. J. Agric. Eng. Res. 1984, 29, 17–24. [Google Scholar] [CrossRef]
- Blokhuis, H.J.; van der Haar, J.W.; Fuchs, J.M.M. Do weighing figures represent the flock average? Poult. Misset Int. 1988, 4, 17–19. [Google Scholar]
- Schomburg, H.; Malchow, J.; Sanders, O.; Knöll, J.; Schrader, L. Elevated platforms with integrated weighing beams allow automatic monitoring of usage and activity in broiler chickens. Smart Agric. Technol. 2023, 3, 100095. [Google Scholar] [CrossRef]
- Chedad, A.; Aerts, J.M.; Vrankren, E.; Lippens, M.; Zoons, J.; Berckmans, D. Do heavy broiler chickens visit automatic weighing system less than lighter birds? Br. Poult. Sci. 2003, 44, 663–668. [Google Scholar] [CrossRef] [PubMed]
- Hughes, B.O.; Elson, H.A. The use of perches by broilers in floor pens. Br. Poult. Sci. 1977, 18, 715–722. [Google Scholar] [CrossRef]
- Sakamoto, K.S.; Silveira, R.M.F.; Benincasa, N.C.; Contreras Castillo, C.J.; Lobos, C.M.V.; Silva, I.J.O.d. Tunnel-Ventilated Sheds with Negative Pressure Reduce Thermal Stress and Improve the Meat Quality of Broilers. Animals 2024, 14, 2017. [Google Scholar] [CrossRef] [PubMed]
- Nascimento, G.R.; Nääs, I.A.; Baracho, M.S.; Pereira, D.F.; Neves, D.P. Termografia infravermelho na estimativa de conforto térmico de frangos de corte. Rev. Bras. Eng. Agric. Ambient. 2014, 18, 658–663. [Google Scholar] [CrossRef]
- Miragliotta, M.Y.; Nääs, I.A.; Manzione, R.L.; Nascimento, F.F. Spatial analysis of stress conditions inside broiler house under tunnel ventilation. Sci. Agric. 2006, 63, 426–432. [Google Scholar] [CrossRef]
- Menegali, I.; Tinôco, I.F.F.; Baêta, F.C.; Cecon, P.R.; Guimarães, M.C.C.; Cordeiro, M.B. Ambiente térmico e concentração de gases em instalações para frangos de corte no período de aquecimento. Rev. Bras. Eng. Agric. Ambient. 2009, 13, 984–990. [Google Scholar] [CrossRef]
- Damasceno, F.A.; Yanagi Junior, T.; Lima, R.R.; Gomes, R.C.C.; Moraes, S.R.P. Avaliação do bem-estar de frangos de corte em dois galpões comerciais climatizados. Cienc. Agrotec. 2010, 34, 1031–1038. [Google Scholar] [CrossRef]
- Nascimento, S.T.; Silva, I.J.O.; Maia, A.S.C.; Castro, A.C.; Vieira, F.M.C. Mean surface temperature prediction models for broiler chickens-a study of sensible heat flow. Int. J. Biometeorol. 2013, 58, 195–201. [Google Scholar] [CrossRef] [PubMed]
- Furtado, D.A.; Azevedo, P.V.; Tinôco, I.F.F. Análise do conforto térmico em galpões avícolas com diferentes sistemas de acondicionamento. Rev. Bras. Eng. Agric. Ambient. 2003, 7, 559–564. [Google Scholar] [CrossRef]
- Nazareno, A.C.; Pandorfi, H.; Almeida, G.L.P.; Giongo, P.R.; Pedrosa, E.M.R.; Cristiane Guiselini, C. Avaliação do conforto térmico e desempenho de frangos de corte sob regime de criação diferenciado. Rev. Bras. Eng. Agric. Ambient. 2009, 13, 13–22. [Google Scholar] [CrossRef]
- Vranken, E.; Chedad, A.; Aerts, J.M.; Berckmans, D. Improving theaccuracy of automatic broiler weighing by imag analysis. In Proceedings of the 2nd European Conference of Precision Livestock Farming, Proceedings, Wageningen, The Netherlands, 6–8 July 2009; pp. 265–271. [Google Scholar]
| Disclaimer/Publisher’s Note: The statements, opinions and data contained in all publications are solely those of the individual author(s) and contributor(s) and not of MDPI and/or the editor(s). MDPI and/or the editor(s) disclaim responsibility for any injury to people or property resulting from any ideas, methods, instructions or products referred to in the content. |
© 2025 by the authors. Licensee MDPI, Basel, Switzerland. This article is an open access article distributed under the terms and conditions of the Creative Commons Attribution (CC BY) license (https://creativecommons.org/licenses/by/4.0/).


 ,
, 

