1. Introduction
The rapid growth of poultry production, driven by the rising global demand for affordable and nutritious protein sources, has come under scrutiny because of concerns surrounding poultry welfare. As welfare encompasses various aspects, including physical conditions, living habitat, and mental well-being of broilers, it plays a crucial role in achieving good quality and higher quantity poultry production [
1]. Birds require spacious housing to move, easy access to feed and water, and opportunities for social interaction throughout their lifecycle. Henceforth, precision technologies are being explored to facilitate the preservation and betterment of health in livestock [
2].
In this context, mobility is a key indicator of broiler welfare [
3]. Diminished walking ability in broilers may imply and/or result in issues such as insufficient feed intake [
3], stress [
1], decreased weight at the time of slaughter, or can even lead to high mortality rates [
4]. It is a prevalent problem in the poultry industry as approximately 14–30% of broilers are affected by deficient walking ability, i.e., gait scoring (GS) of 3 or above, in broiler farms [
5]. Hence, it may cause high economic losses by negatively affecting poultry production in terms of quality and quantity.
Classically, broiler walking ability has been determined by experts carrying discrete examinations of individual broilers and assessing their walking ability through scaled GS evaluation protocols (e.g., 0–5 or 0–2 scale protocols). This method is resource-intensive in terms of time and labor requirements as well as susceptible to inter- and intra-assessor observational errors. Furthermore, today’s large-scale farm management obligations necessitate rapid and reliable insights into broiler welfare indicators such as gait conditions [
6]. Lately, more and more automated mobility analyses of broilers have been performed via computer vision-based deep learning (DL) models and machine learning (ML) approaches [
7]. Such models are employed to automatically predict GS levels through either broiler feature extraction or mobility analysis. Some researchers have worked on examining and recording one chicken at a time in a special setting in a lab, extracting walking features of individual chickens, such as speed or number of steps, through image segmentation and ML approaches [
8,
9,
10]. On the other hand, in some studies, activity indexes and physical parameters of broilers in group settings have been studied via statistical methods and then correlated with pre-assessed GS levels [
11,
12]. These studies were able to determine walking ability problems, such as lameness in birds, and predict GS.
Several DL methods have been proposed to address chicken locomotion and provide insights into their activities. These models are non-intrusive, requiring minimal bird handling and decreasing biosecurity risks. They are cost-effective compared with more hardware-intensive solutions such as radio frequency identifier (RFID) tags or pedometers, which incur higher costs when repetitively applied over several flocks for longer periods. Moreover, DL model applications are more robust and can provide detailed insights into chicken behaviors, enhancing welfare management practices. In some studies, individual broiler poses are investigated through DL models by following key skeletal points extracted from lateral video recordings [
13,
14,
15,
16]. The resulting pose estimations have proved promising in detecting lameness, walking ability, and various behaviors of individual broilers from side-view cameras. On the other hand, in some research vision-based DL models are applied in continuous tracking of individual broilers in group settings [
17,
18,
19]. They have obtained considerable results in partially providing broiler walking distances and thus their walking ability as depicted in traversed time and speed; meanwhile, continuous tracking of broilers was found to be still a major issue to be tackled. These studies require birds to go through a tunnel, which may alter bird walking behaviors in a natural state. Upon reviewing previous research, it became evident that a timely and resource-efficient method for assessing the GS of multiple individual birds in a group setting is still lacking.
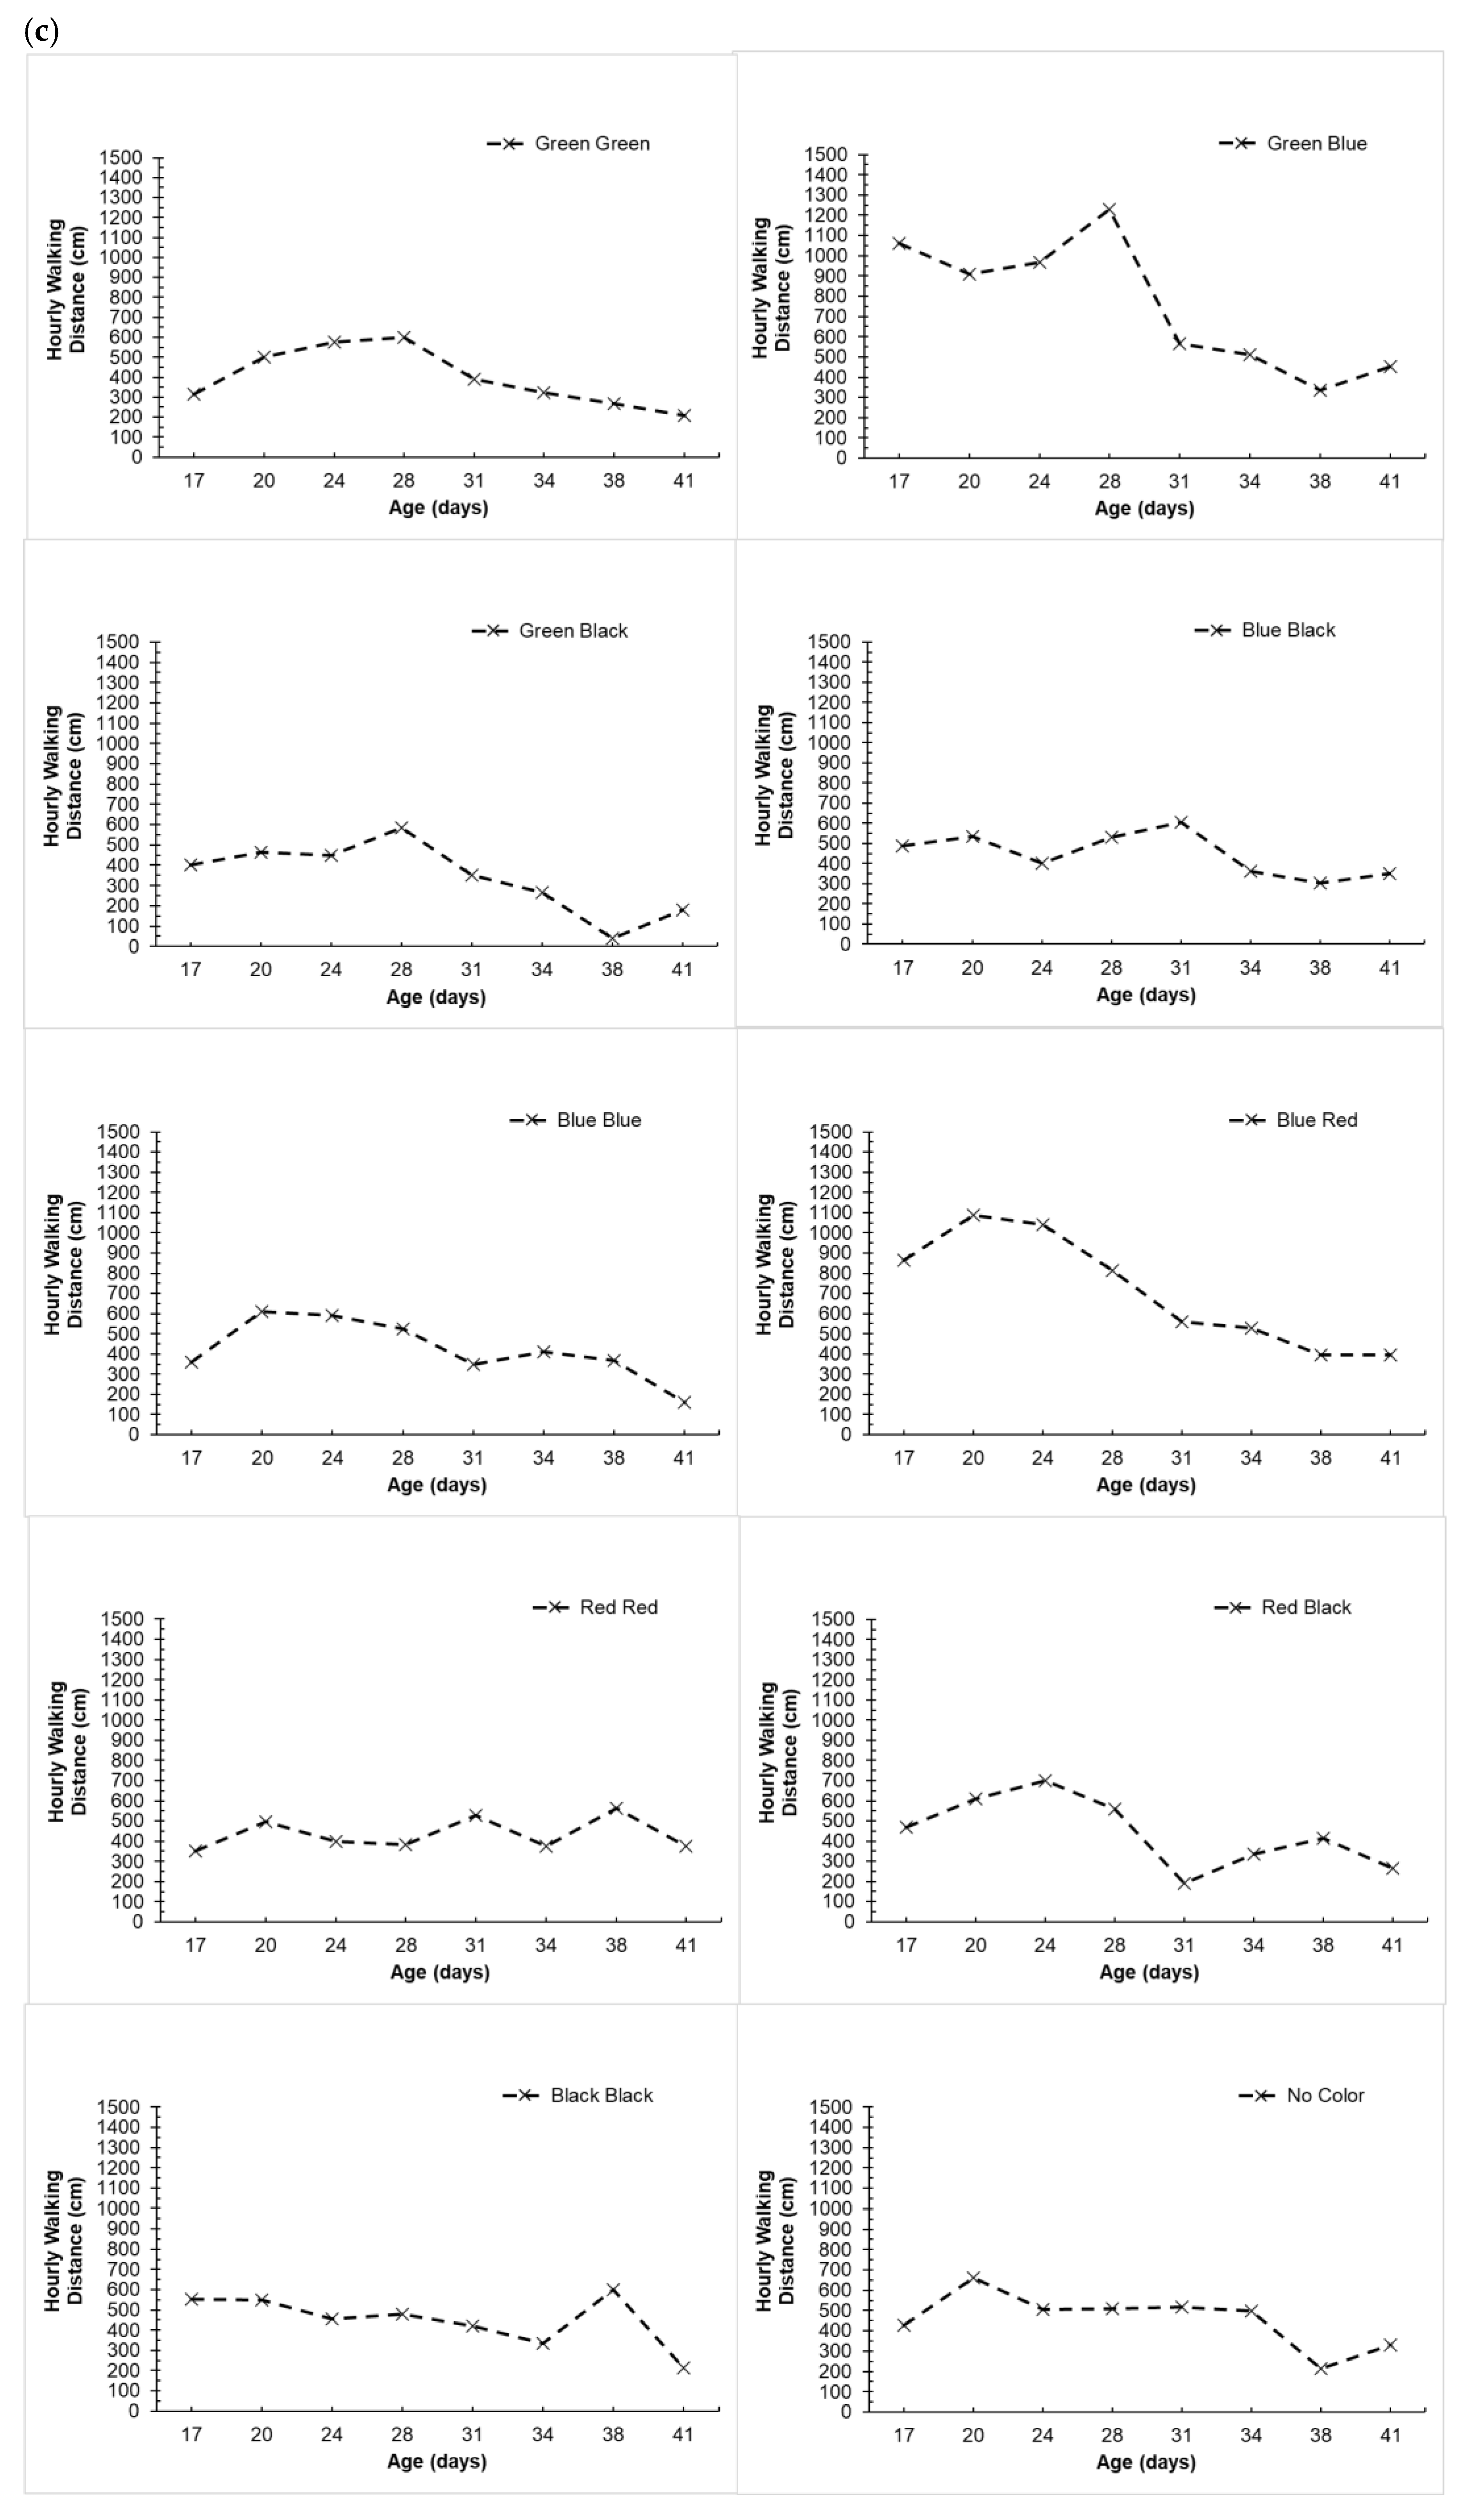
The objectives of this study were to identify and track color-coded broilers continuously, consequently utilizing this information for continuous assessment and prediction of GS levels of multiple individual broilers in a group setting as a viable alternative to classical methods. First, a DL model, YOLOv8, was developed to detect and classify color-coded birds and subsequently estimate their mobility indicators such as daily and hourly walking distance, speed, idleness and movement ratios, and time at the feeder and drinker ratios throughout the rearing period. Second, it was sought to find a robust ML model to classify or regress the manually assessed GS with the proposed mobility indicators.
2. Materials and Methods
2.1. Pen Setup and Data Collection
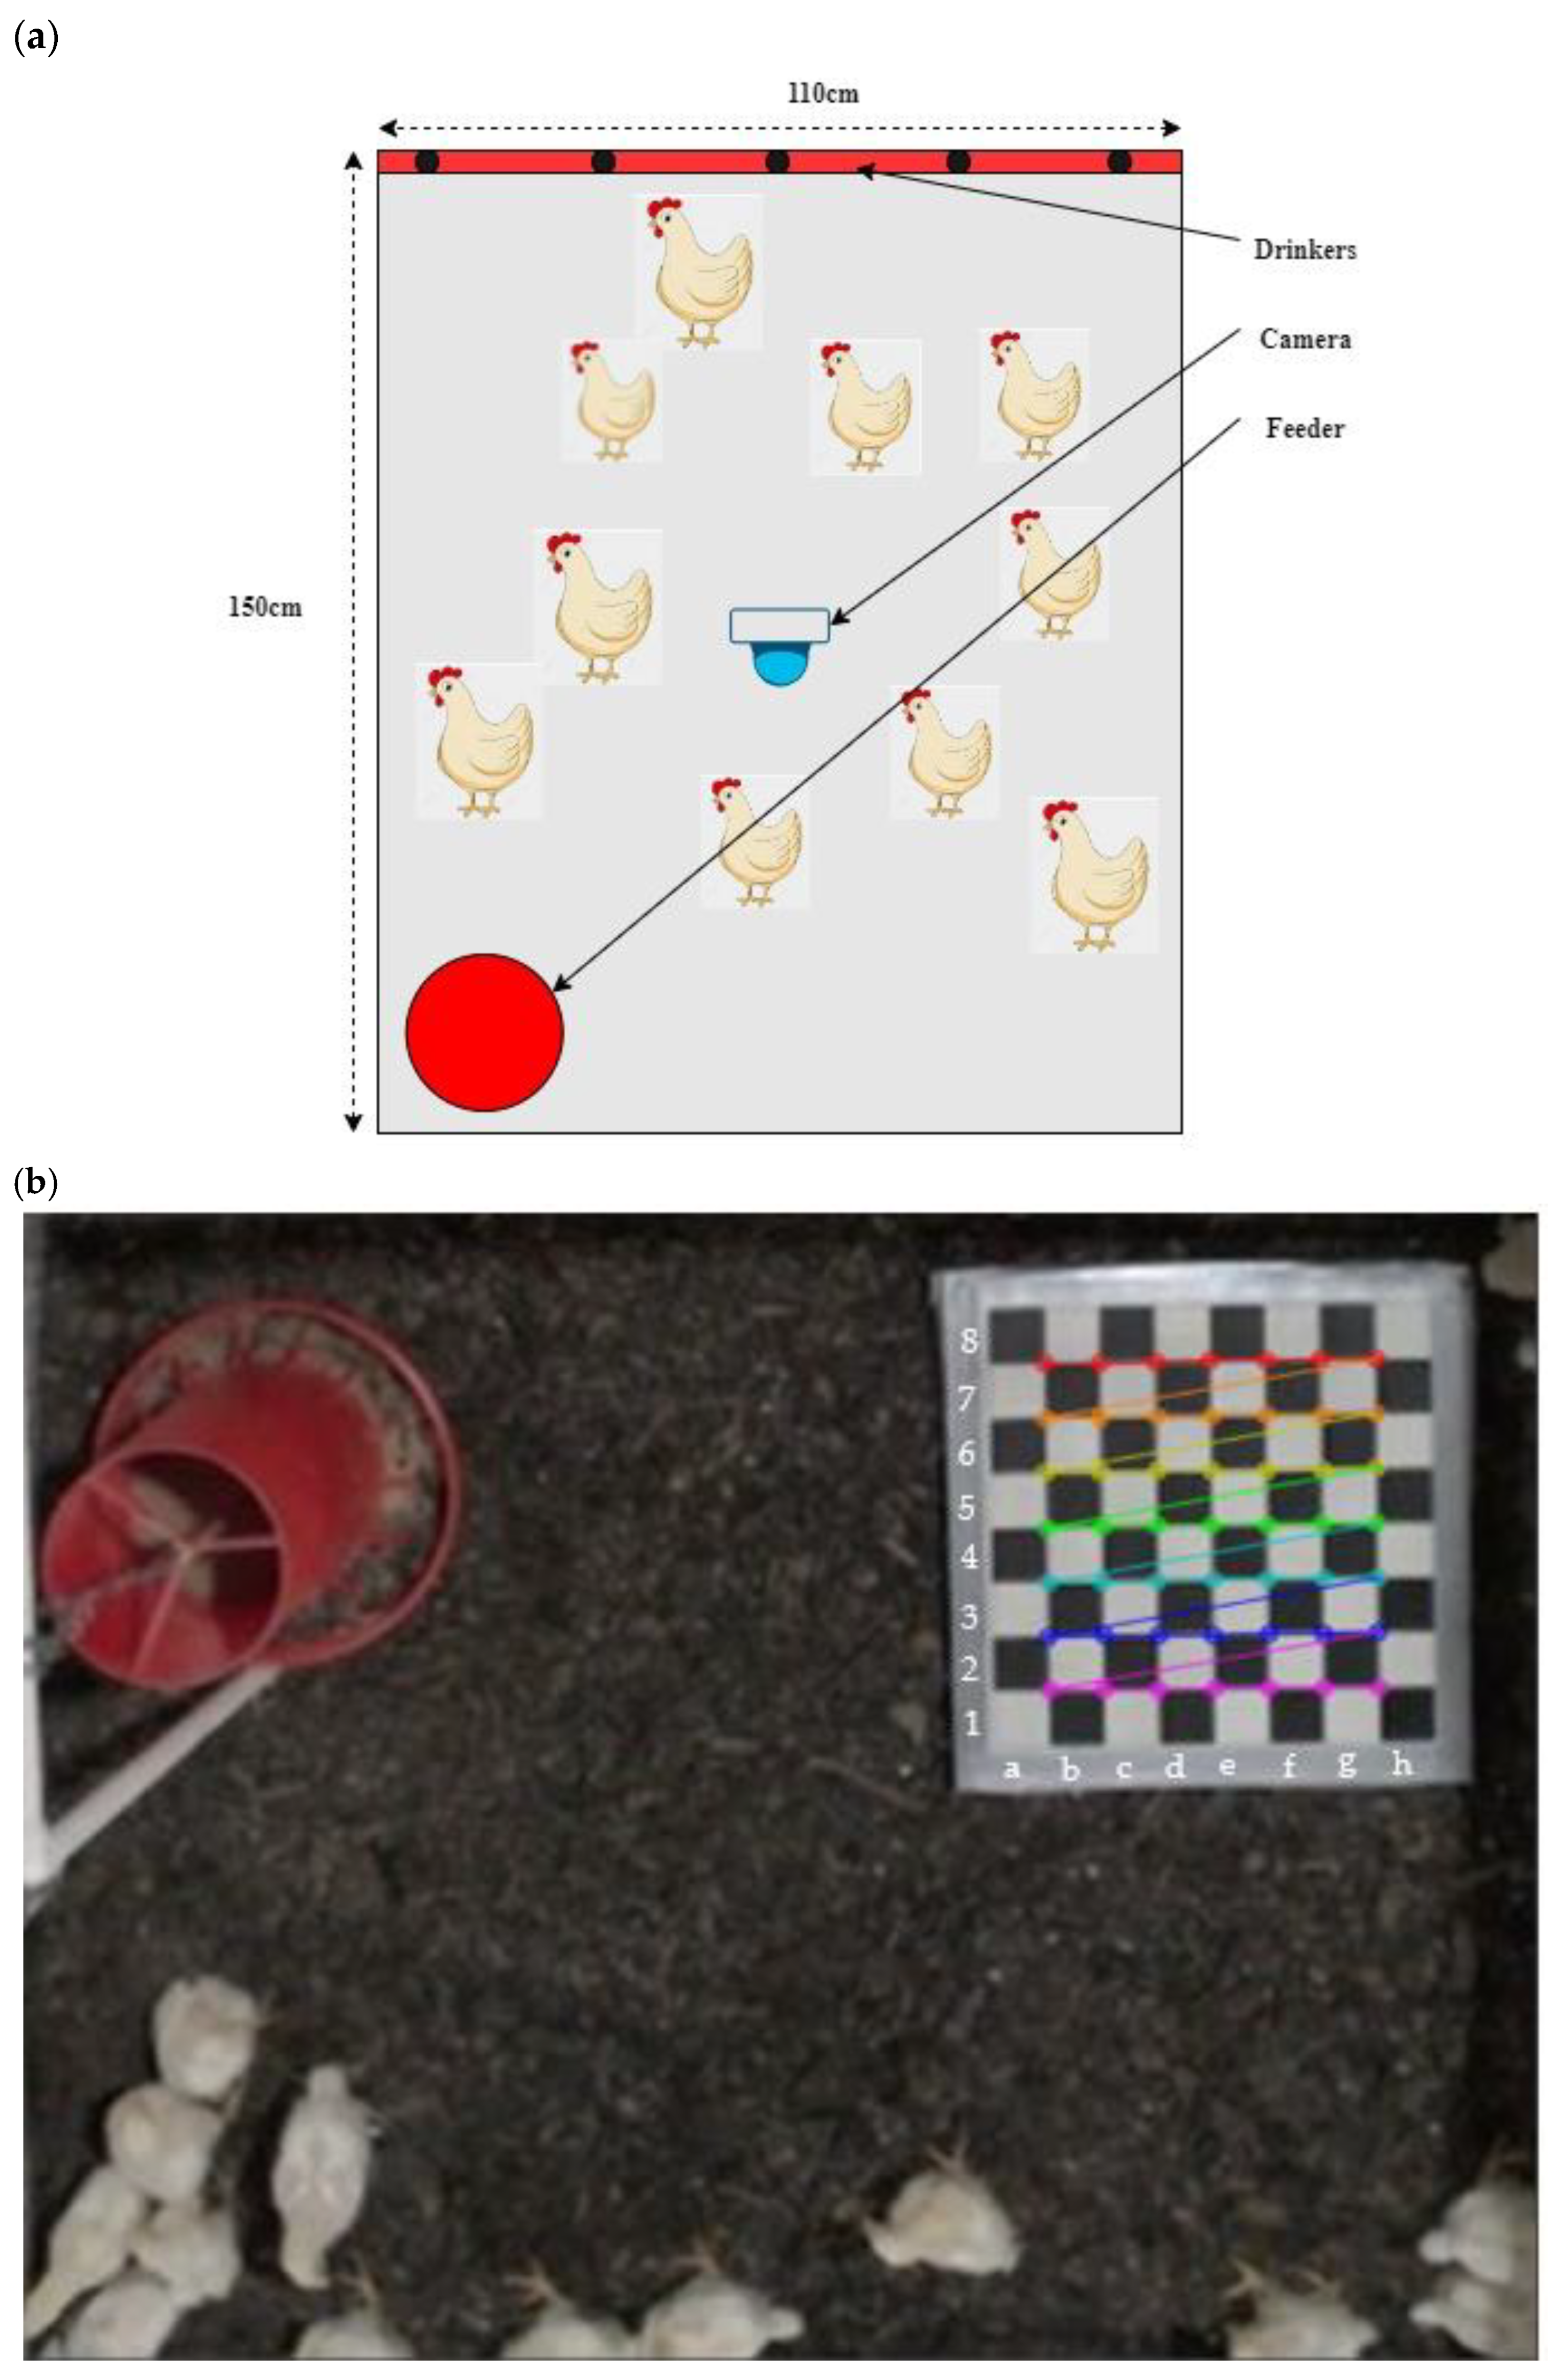
The experiment was conducted in the Johnson Research and Teaching Unit (JRTU) laboratories at the University of Tennessee Knoxville, USA. A total of 10 chickens (Cobb 700 breed), with a 1:1 male (M)-female (F) ratio, were involved. This quantity was determined in observance of the 24 Kg/m
2 standard stocking density limit for slow-growing broilers and pen dimensions, shown in
Figure 1a [
19]. The data collection and assessment period spanned 46 days, from February 04 to March 21, 2023. Each broiler was color-coded on the back with two stripes using animal-body-friendly markers. The 10 color codes were Green Green (F), Green Blue (M), Green Black (F), Blue Black (F), Blue Blue (F), Blue Red (M), Red Red (M), Red Black (M), Black Black (F), and No Color (M). The color-coding method was practical and less costly, making it well-suited for vision-based DL models to detect individual broilers, henceforth investigating the feasibility of such models in providing alternative GS assessment methods. Although, for its broader applications in large-scale farms more innovative identification solutions could be developed.
In
Figure 1a, the corresponding pen dimensions, 110 cm by 150 cm, along with the position of the standard low-cost RGB camera, feeder with 30 cm pan diameter, and water source, are demonstrated. The camera recorded high-definition (HD) videos at 720p resolution with 30 frames per second rate. It was then used to produce images with a resolution of 1280 × 720 pixels. A systematic sampling approach was followed to gather video recordings at specific intervals daily for the entire experimental period [
20]. The camera recorded for 15 min every hour of the day for the period of the experiment. It was positioned 2.2 m above the ground, capturing the pen walls along with a small portion of its surroundings.
The image distortion proportion was determined using a standard chessboard with 48 cm × 48 cm dimensions (i.e., 6 cm × 6 cm per square), as shown in
Figure 1b. The corner pixel positions of the inner 7 × 7 squares were detected using open-source Python codes. The absolute difference between the upper (a7–h7, h1–h7) and the lower (a1–h1, a1–a7) edges, i.e., image distortion, for the x and y dimensions were determined 0.03% and 0.06%, respectively. Moreover, the pen dimensions were small as well, resulting in diminutive image distortions. Hence, image distortion was considered minimal, and a linear distribution of the pixel lengths was assumed. Based on the dimensions of the experimental pen, the scale was determined to be 1.7 mm per pixel. The 15-min time span was deemed as a statistically sufficient sample for the entire hour [
20]. For the analysis purpose, we utilized data from 8 AM to 8 PM period as this period contains most of the daily activities of broilers.
2.2. Manual GS Assessments
GS is a classical approach to manually categorizing walking ability in chickens [
21]. It uses a score between 0 and 5, denoting different levels of lameness severity apparent while performing gaits. For example, a bird that performs gait perfectly with no obvious irregularities, such as leaning, frequent sitting while walking, or limping, would receive a score of 0, while a bird exhibiting minimal, noticeable, significant, or extremely abnormal walking would score between 1 and 5, respectively [
1,
9].
Thus, a gait expert was employed to assess the GS of individual birds twice a week in this study. To avoid the introduction of bias from different observers, only one expert was utilized. Prior to the GS assessments, the assistant typically visited the pen frequently to increase bird adaptation with human visitors and reduce stress on them during future evaluations. The expert visited the pen at a random hour and observed each individual broiler giving a score based on the observable gait conditions as classified above. First, individual broilers were released at a designated hallway with no litter approximately 40 cm in width and 200 cm in length. It was then monitored for about 2 min with occasional slight stimulation to make it walkthrough. Consequently, the observations were recorded in a sheet. Hence, a standardized assessment was followed throughout the experiment.
2.3. YOLOv8 DL Models
The YOLOv8 DL model was used to identify individual broilers in this study (Ultralytics, Frederick, MD, USA, 2023). It is a vision-based DL model primarily designed to perform object localization and classification in a single-stage regression process, thus outperforming counterpart Convolutional Neural Network (CNN) based models, such as Faster Region-based or Mask CNN, in terms of inference speed and memory efficiency and providing comparable precision levels [
22,
23]. There are different versions of the YOLOv8 model, such as YOLOv8n, YOLOv8s, YOLOv8m, and YOLOv8l; the smallest model has 3 million parameters, while the largest one is designed with over 100 million parameters [
24]. The former models are effective on smaller datasets, while the latter ones are feasible with bigger and more complex applications. Moreover, smaller models are prone to overfitting, providing less generalizability when tested with new data, while the larger ones are harder to train and require larger training datasets and computational resources. In this experiment, these models were tested, and the one that best provided a balance between accuracy and computational costs, given the dataset at hand, was selected.
2.4. YOLOv8 Model Development
Images from four different times of the day, corresponding to 08:00–08:15, 12:00–12:15, 16:00–16:15, and 20:00–20:15 (HH:mm), were used for the training of the YOLOv8 model. These periods were spaced 4 h apart to capture a wide range of distinct broiler behaviors, enabling the model to learn from diverse data. For training purposes, images were obtained by extracting one frame per minute (fpm) from the quarter-hourly recordings, resulting in around 15 images for a 15-min video. We deemed it appropriate to use one-minute apart frames to keep a balance between computational costs as well as efficiently capturing a less correlated consecutive imagery. DL models are highly prone to memorizing data; hence, a less correlated dataset is more effective in training a model with higher generalizability.
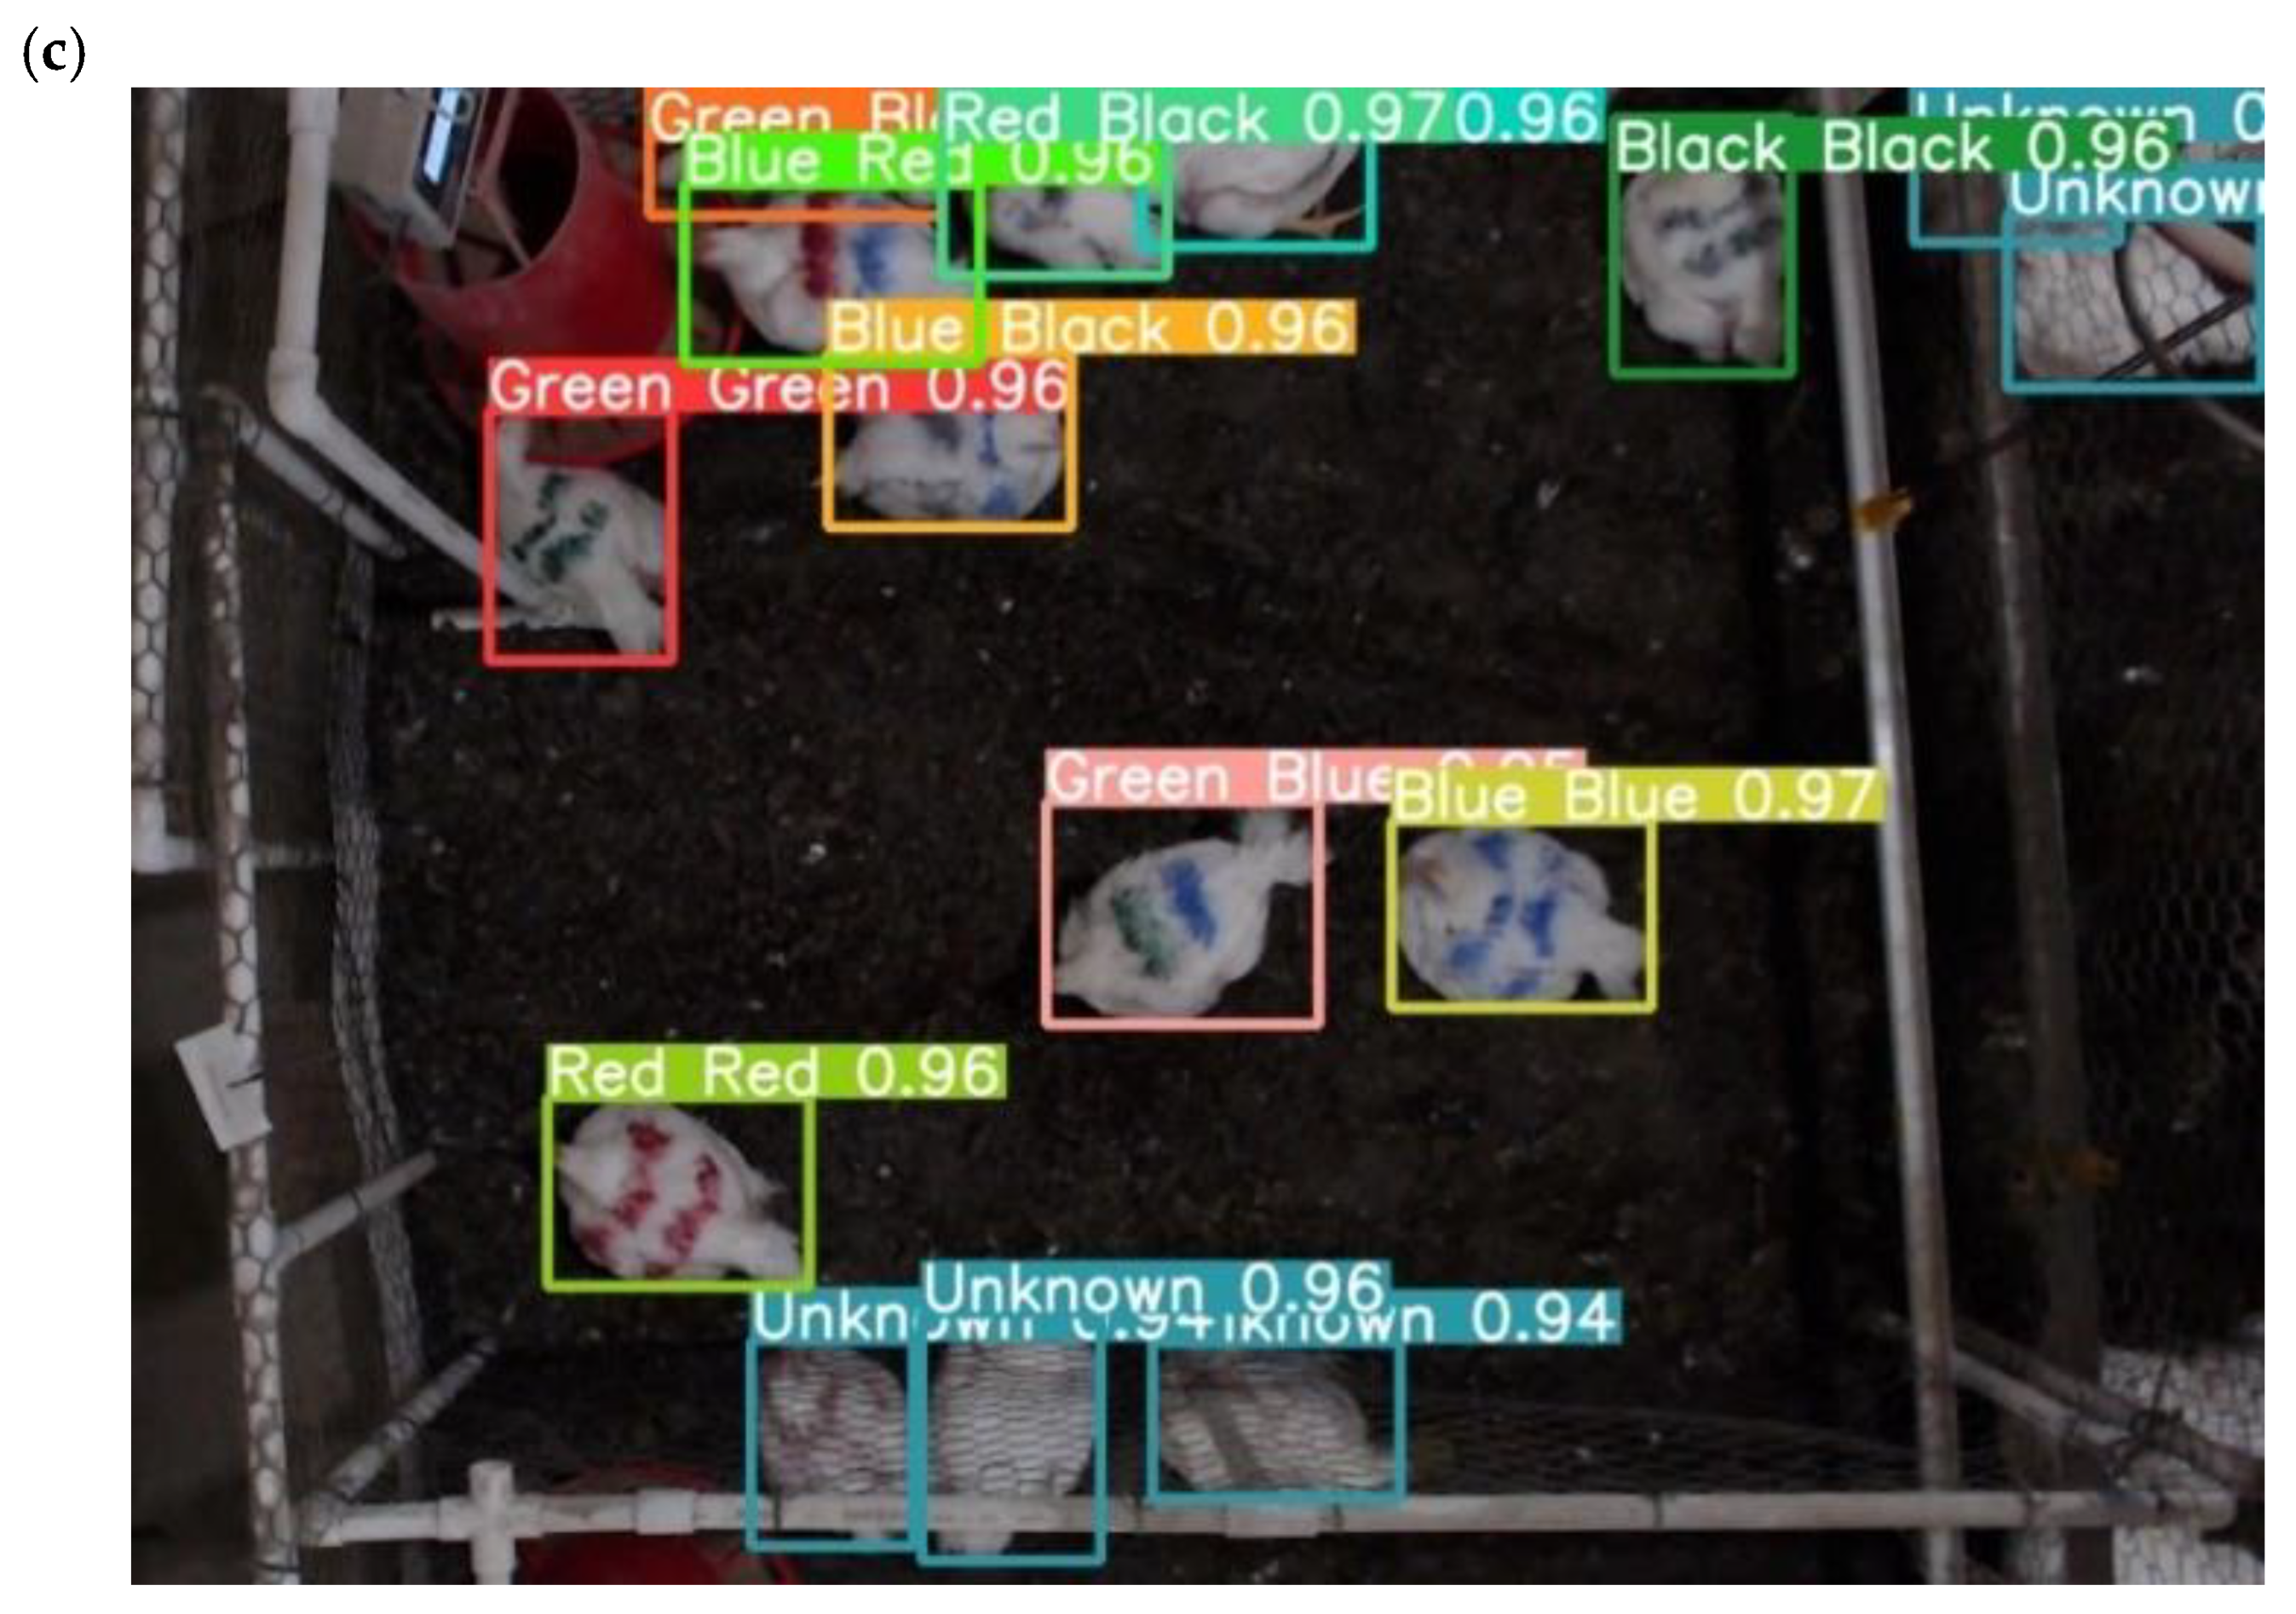
The dataset was further validated by manually examining the quality and usability of each video (i.e., images), and the ones with lighting issues, any human existing within the frame, or broilers behaving abnormally during daily management practices were eliminated. Consequently, around 800 images were labeled manually using an online open-source labeling website (
www.makesense.ai, accessed on 1 May 2023). Each broiler was carefully covered with a bounding box to show its position in the pen. In addition to the color codes mentioned, the broilers from surrounding pens were labeled as ‘unknowns’ to lessen confusion by the model. While it was possible to separate the pen from surrounding pens by black tarps, it was aimed to train the model with an extra class further and enable it to identify certain broilers to be excluded in each frame. It mimicked real farm situations where certain broilers might be monitored while most would be excluded.
The development of the YOLOv8 model constituted training, validating, and testing phases; the dataset was divided into 600, 150, and 50 subsets for this purpose, respectively. During training, hyperparameters, such as epoch numbers ranging between 50 and 150, decaying learning rate, and batch sizes between 4 and 32, were tuned based on a trial-and-error approach. The Python 3.11.3 software was used to run the YOLOv8 model.
The F1-score and mean Average Precision (mAP) metrics, Equations (1) and (2), respectively, were used to compare the performance of the model under different scenarios. These metrics provide critical model performance in detection and classification and incorporate other metrics such as Precision and Recall. The TP, FP, and FN were the counts for true positive, false positive, and false negative detections, while
Q represented the number of classes, which were 11 in this study, 10 color-coded chickens plus 1 unknown class. The F1-score shows the robustness of the model in detecting an intended broiler class (i.e., true positives) while also lowering the rate for misclassifying other classes (i.e., false positives and false negatives) in the pen. While the average precision metric indicates the effectiveness of object detection classifications in a specific class in an image, the mAP demonstrates the effectiveness of the YOLOv8 model in detecting and classifying all the classes present in an image.
2.5. Mobility Indicator Estimation
In this study, it was assumed that estimating individual broiler movements every second, i.e., one frame per second rate, would cumulatively provide an overall rich understanding of their mobility. The dataset comprised video recordings spanning eight days, aligning with the days designated for GS assessments. Each day included 13 recordings, captured at 15-min intervals per hour throughout the day. Consequently, the trained model was applied to this dataset, and the (
x,
y) coordinates of the broilers at each second were obtained from the detected bounding boxes representing each class of broilers, as shown in
Figure 1c. These coordinates from consecutive images were then used to calculate the Euclidean distance (
d) traveled every second by a broiler. The walking distance, idleness, movement, speeds, and time at the drinker and feeder of individual broilers were calculated using these results by the following Formulas (3)–(9).
It was assumed a broiler is idle if the calculated Euclidean distance between two consecutive frames was less than 1.7 mm, the distance equivalent to a pixel in this study. As the model creates bounding boxes every second, the small body movements, such as moving the head, are also perceived as displacement by the model. Hence, we selected the 1.7 mm and less perceived movements as idleness. Consequently, the movement periods were determined as times when a broiler was not idle. Moreover, the time periods at the feeder and drinker were calculated from the obtained coordinates of the individual broilers inside the pen. As shown in
Figure 1, if the position of a broiler was in close vicinity, at 10 cm or less from either the feeder or drinkers, it was counted as having access to food or water at that moment. While idleness can mean a sleeping or resting state, % time at drinker and feeder can also be important depictions of their ability and accessibility to eat or drink.
2.6. Machine Learning Model Selection
ML models play a crucial role in data analysis and prediction tasks across various domains [
25]. Among the many popular regression and classification models, Support Vector Machines (SVM), Random Forest (RF), and Ordinal Logistic Regression (OL) were applied for regressing and classifying manual GS assessments with mobility indicators, and other parameters, such as age, sex, and recording time which can influence broilers mobility, thus may help in building a GS prediction model. These models differ in handling complex and simple datasets, and they have different levels of architectural complexities. Hence, we were experimental in finding out the best model which suits our set of data.
The generalized coefficient of determination (R
2), root mean squared error (RMSE), and the misclassification rate (MR) metrics, given below in Equations (10)–(12), were used to compare the performance of the ML models. The generalized R
2 is a metric mainly applied to logistic regressions where the dependent variable is categorical. Basically, it measures the likelihood of fitness of an alternative model,
LM, to the null model,
L0, with
n# of observations. This metric is different than the classical R
2 one which determines the fitness of a linear model. While the RMSE metric indicates the extent predictions sway away from actual values, the MR metric demonstrates the ability of the models to classify the GS levels given the mobility indicators [
26]. The JMP 17.1 statistical software was utilized in the ML models’ regression analysis of our mobility and GS datasets.
Furthermore, K-fold cross-validation was employed to assess the generalizability of the ML models, ensuring robust performance across unseen validation datasets. The common 5-fold approach was used, splitting the dataset into 80% training and 20% validation sets for each fold, resulting in 5 iterations of training and validation. This method provides a balance between minimizing prediction variance and maintaining robustness against new data. By averaging metrics such as R2, RMSE, and MR across the 5 folds, the models were tested against new data, minimizing overfitting and providing a reliable estimate of their predictive performance on unseen broiler gait data.
2.7. Statistical Analysis
Individual broilers, with 10 replicates in the group, were used as experimental units for assessing GS against mobility indicators. To evaluate the correlation and significance levels among the continuous independent variables, including movement ratio, idleness ratio, time at feeder and drinker, walking distance, speed, and age, multivariate correlation analysis was conducted. It provided the correlation strength and direction among these variables; hence, their multicollinearity levels were realized. It helped in identifying a possible set of variables to use in the ML prediction models. In addition, bivariate Logistic regression analysis was performed to identify the most significant continuous parameters impacting the dependent categorical variable, GS levels. Parameters that showed significant levels of p < 0.05 in the bivariate analysis and lower correlation levels among themselves, i.e., low multicollinearity, were selected in the final ML models to predict GS. All statistical analyses were performed using JMP software to ensure accurate computations and results.
4. Conclusions
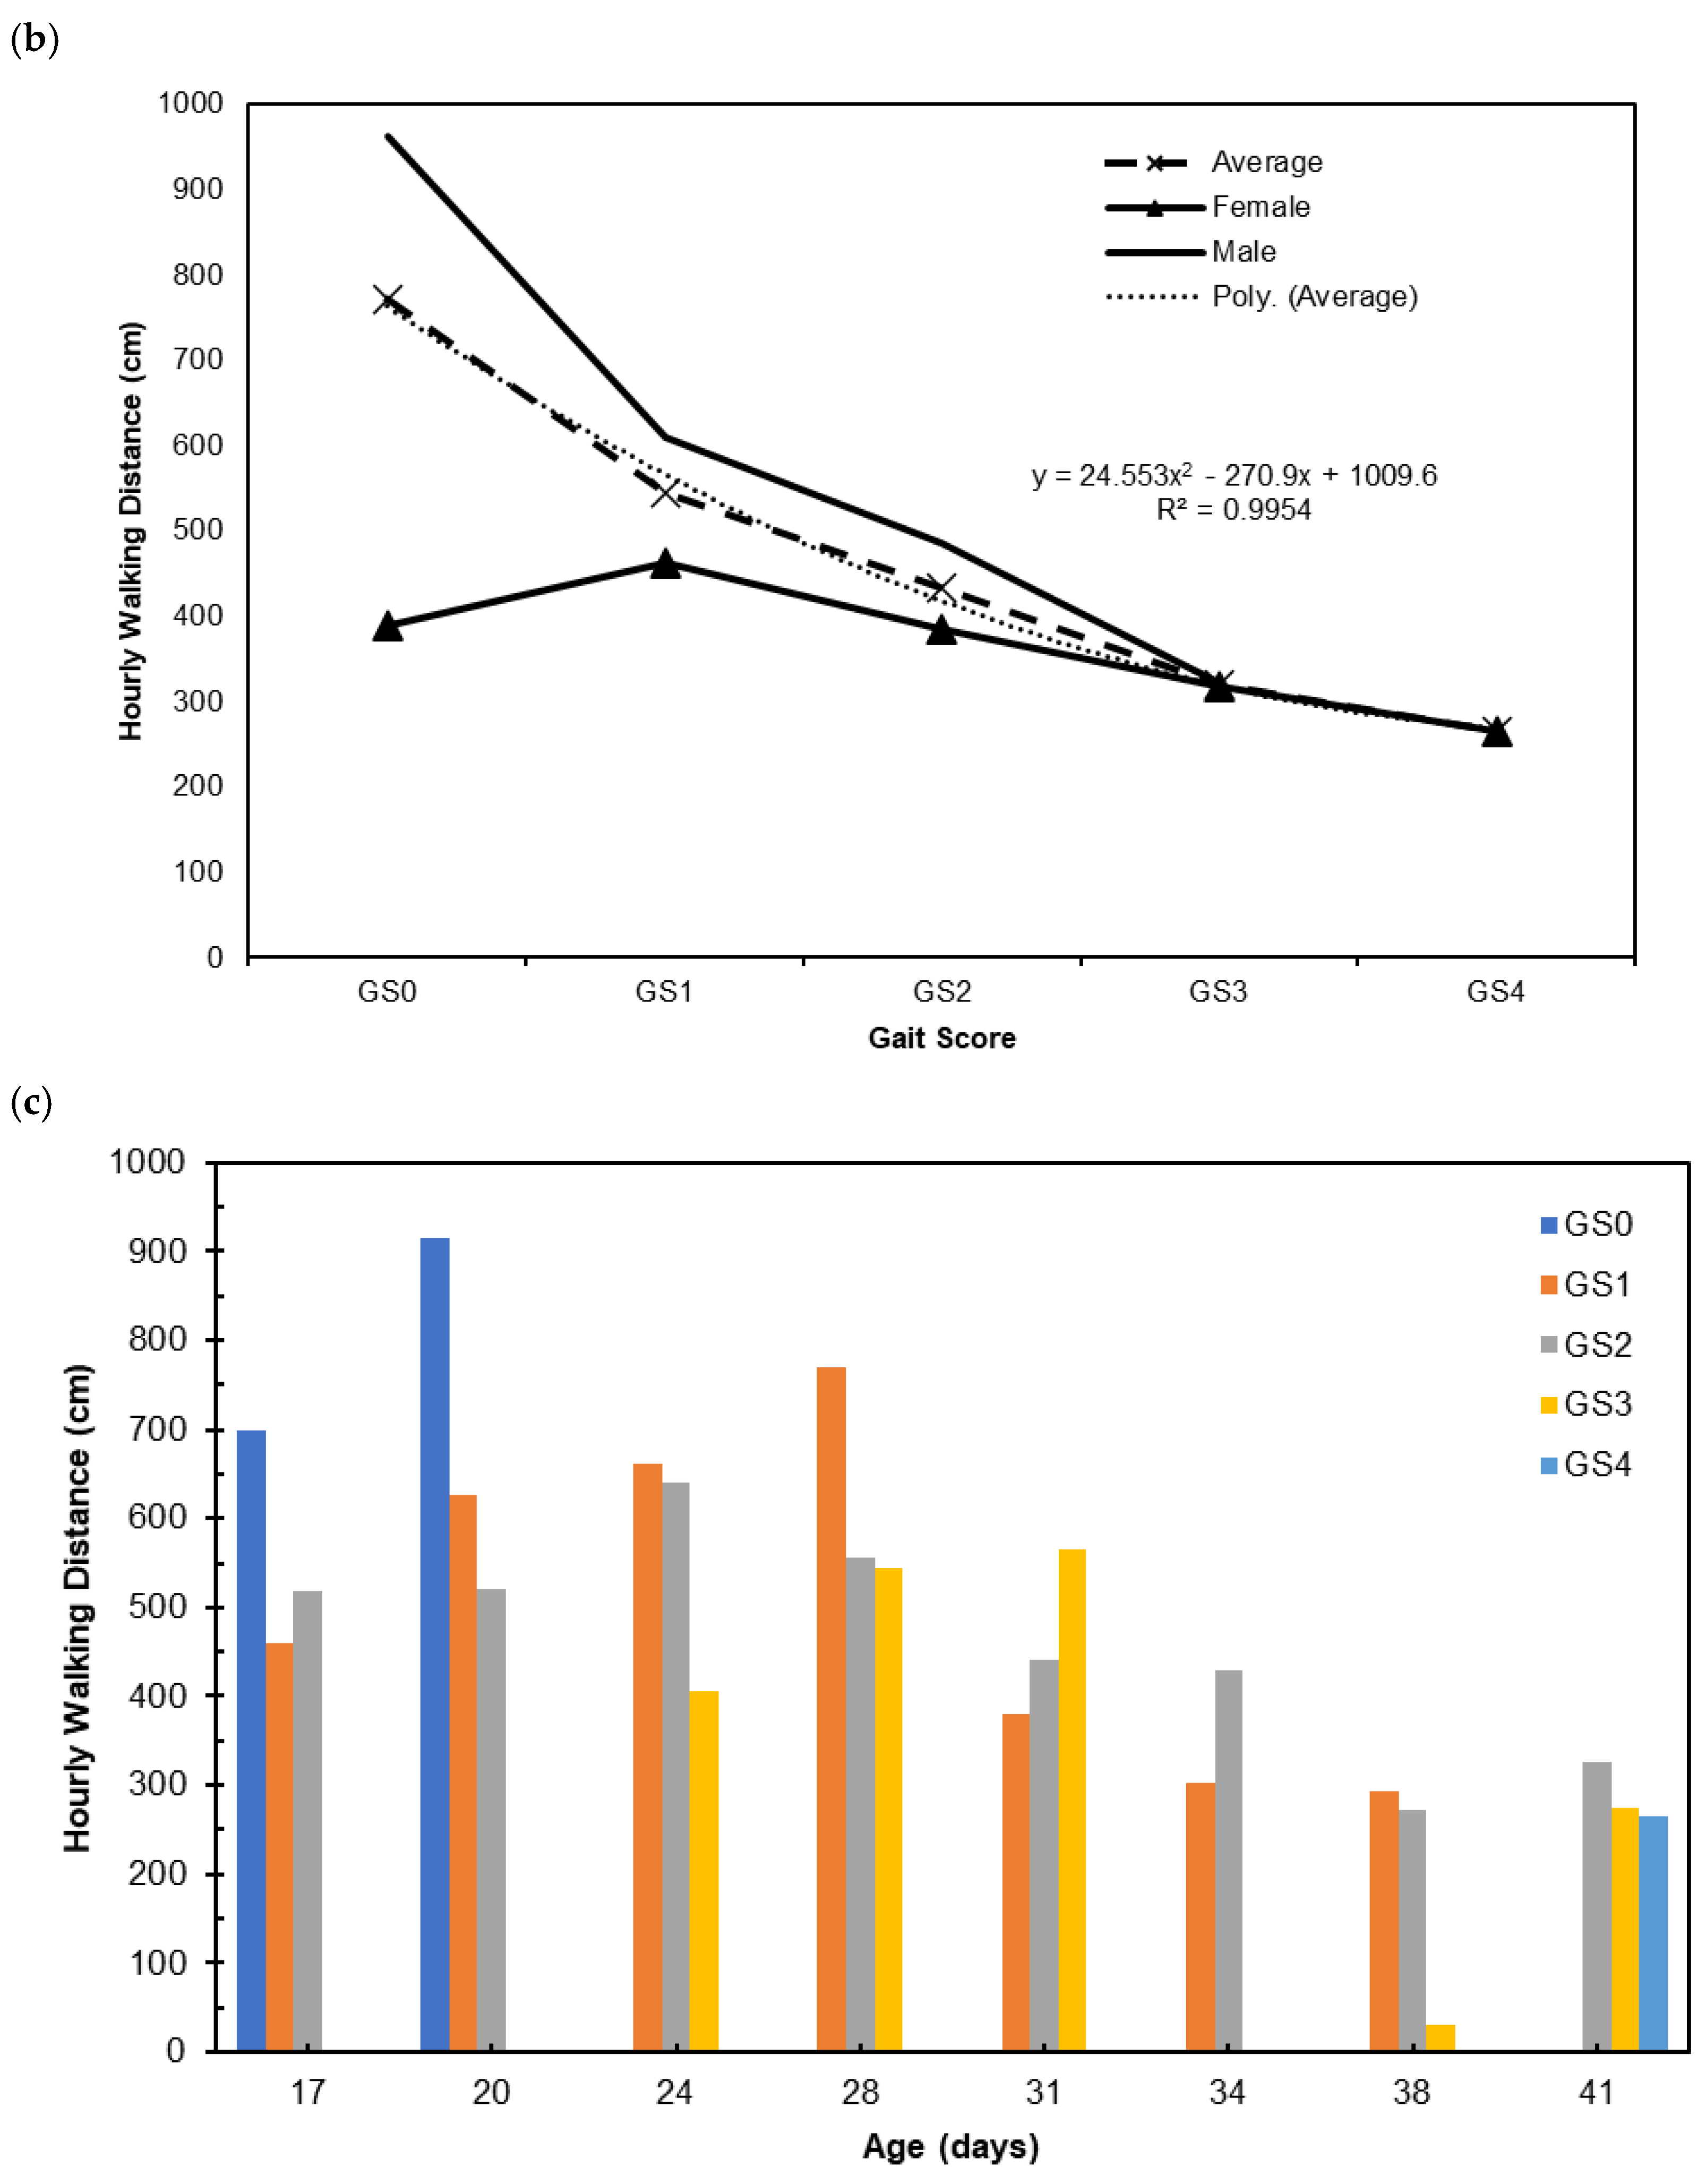
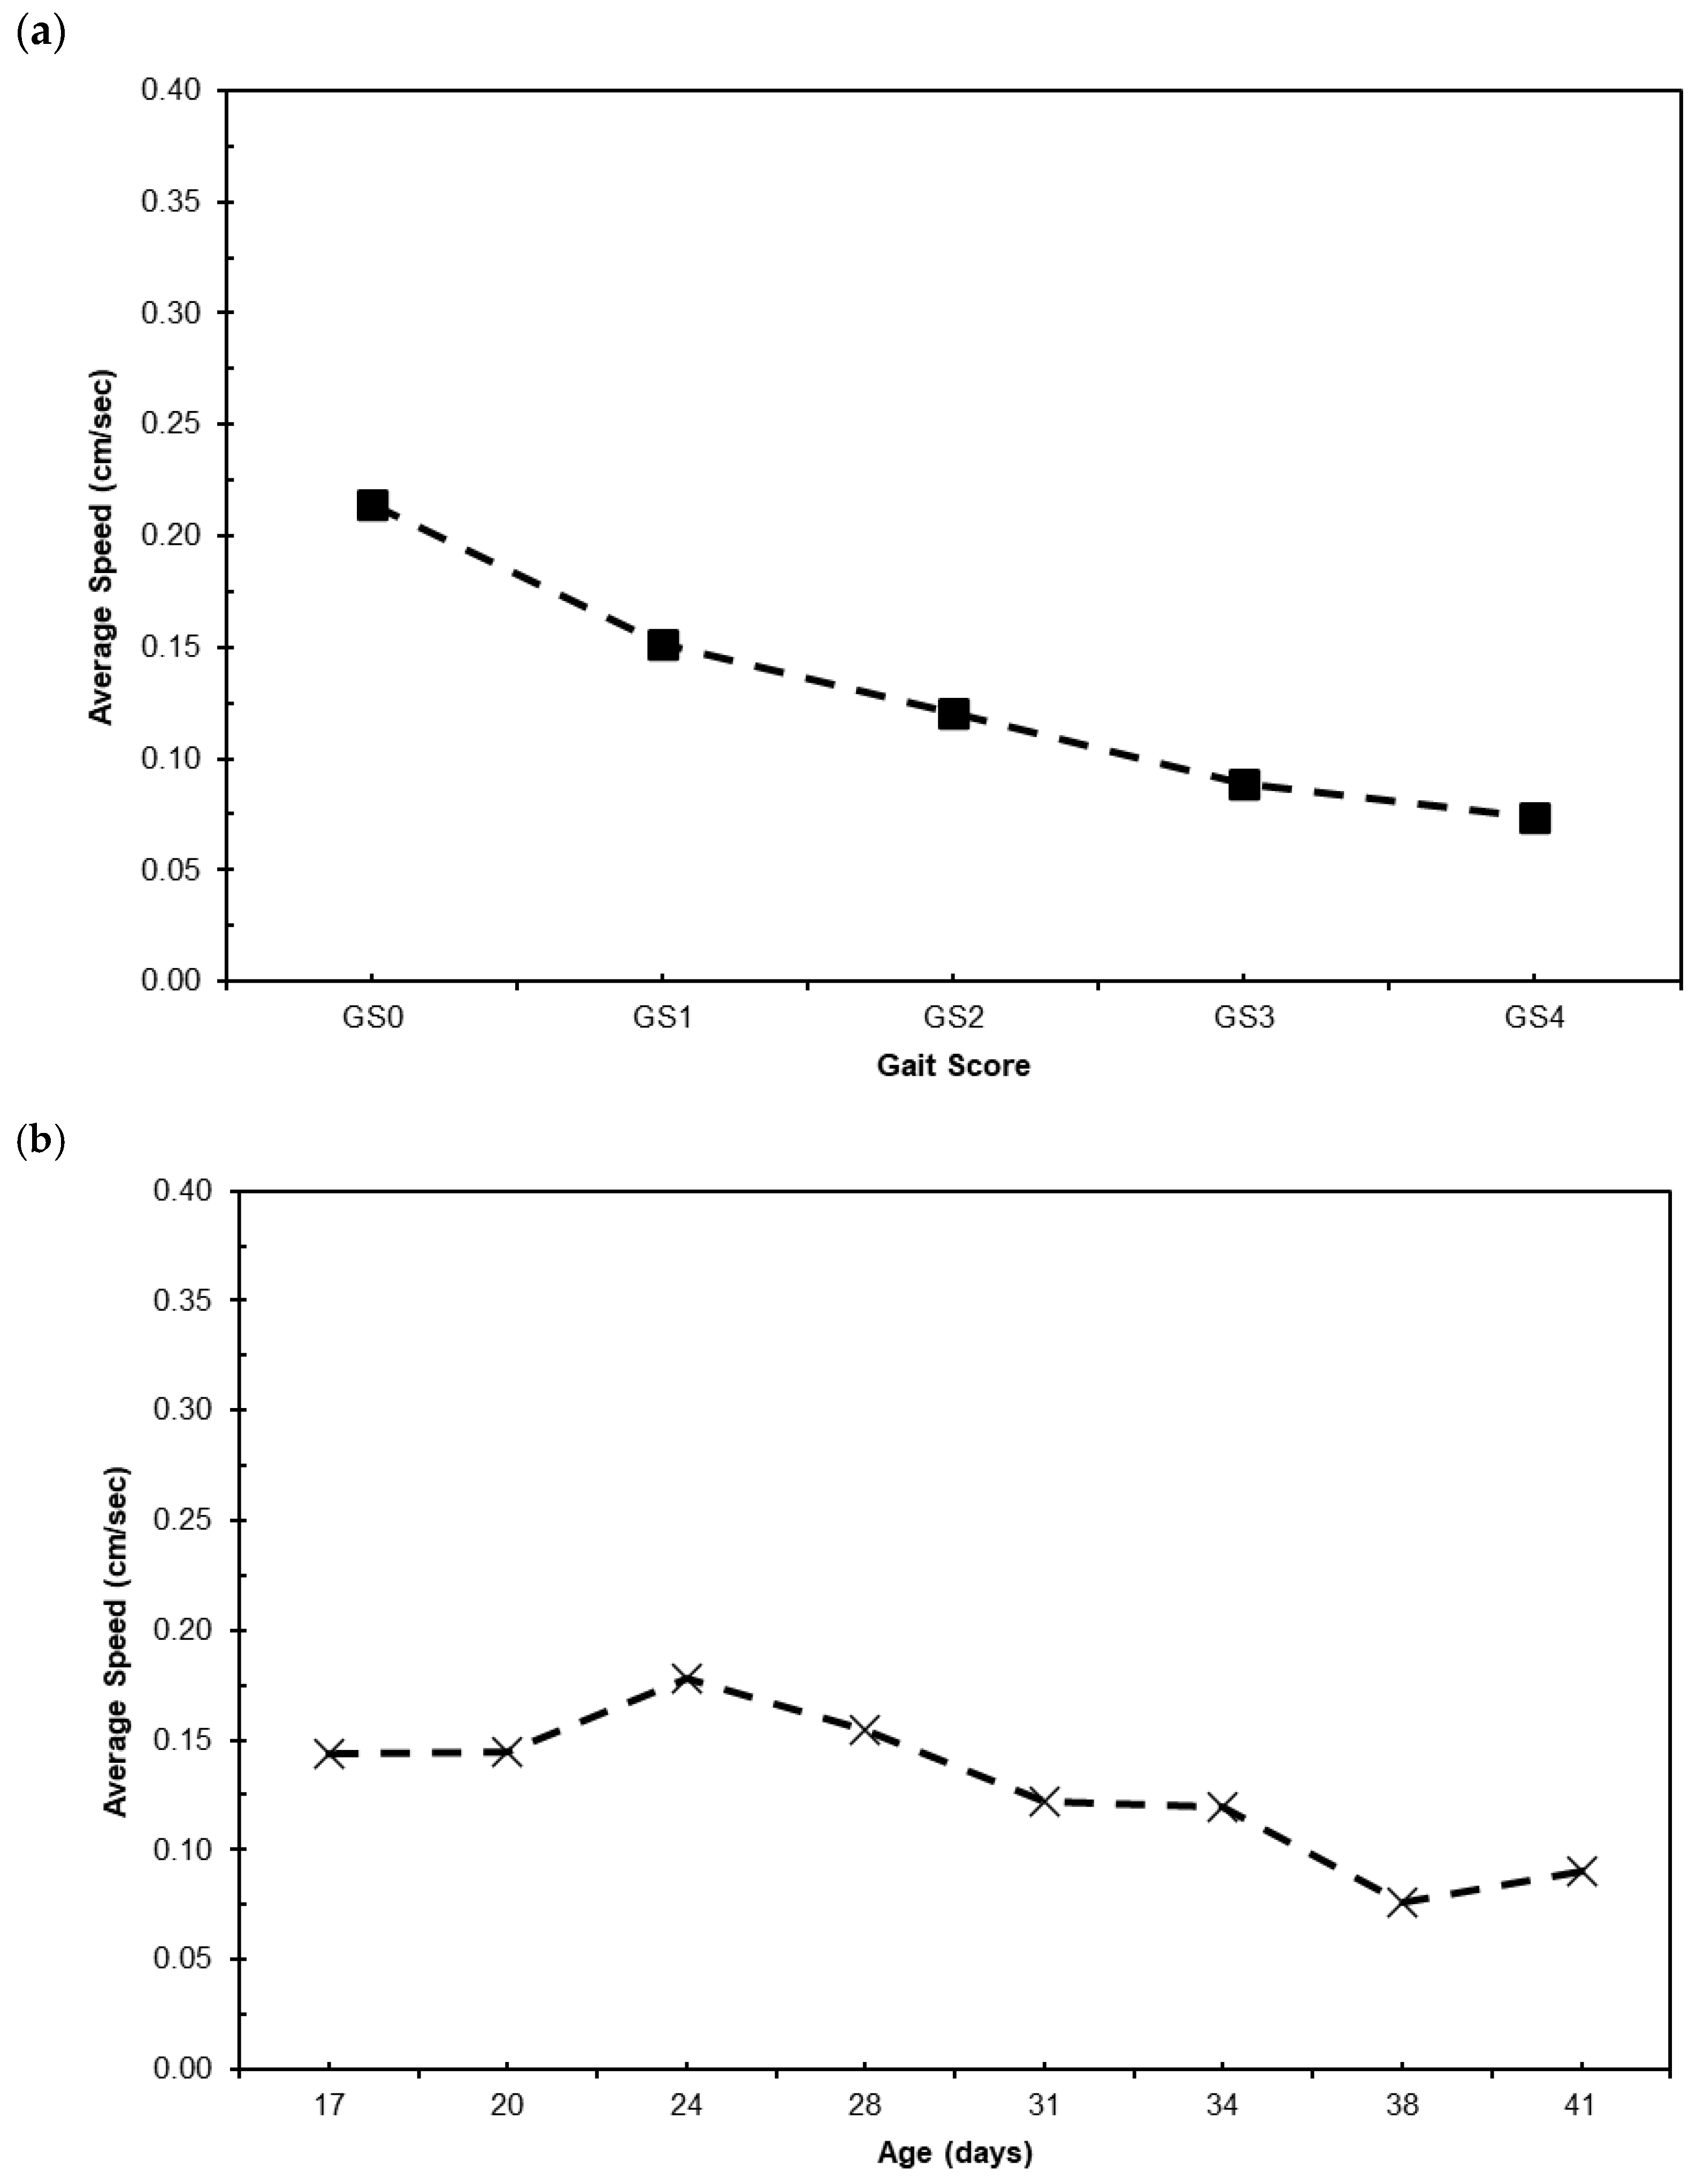
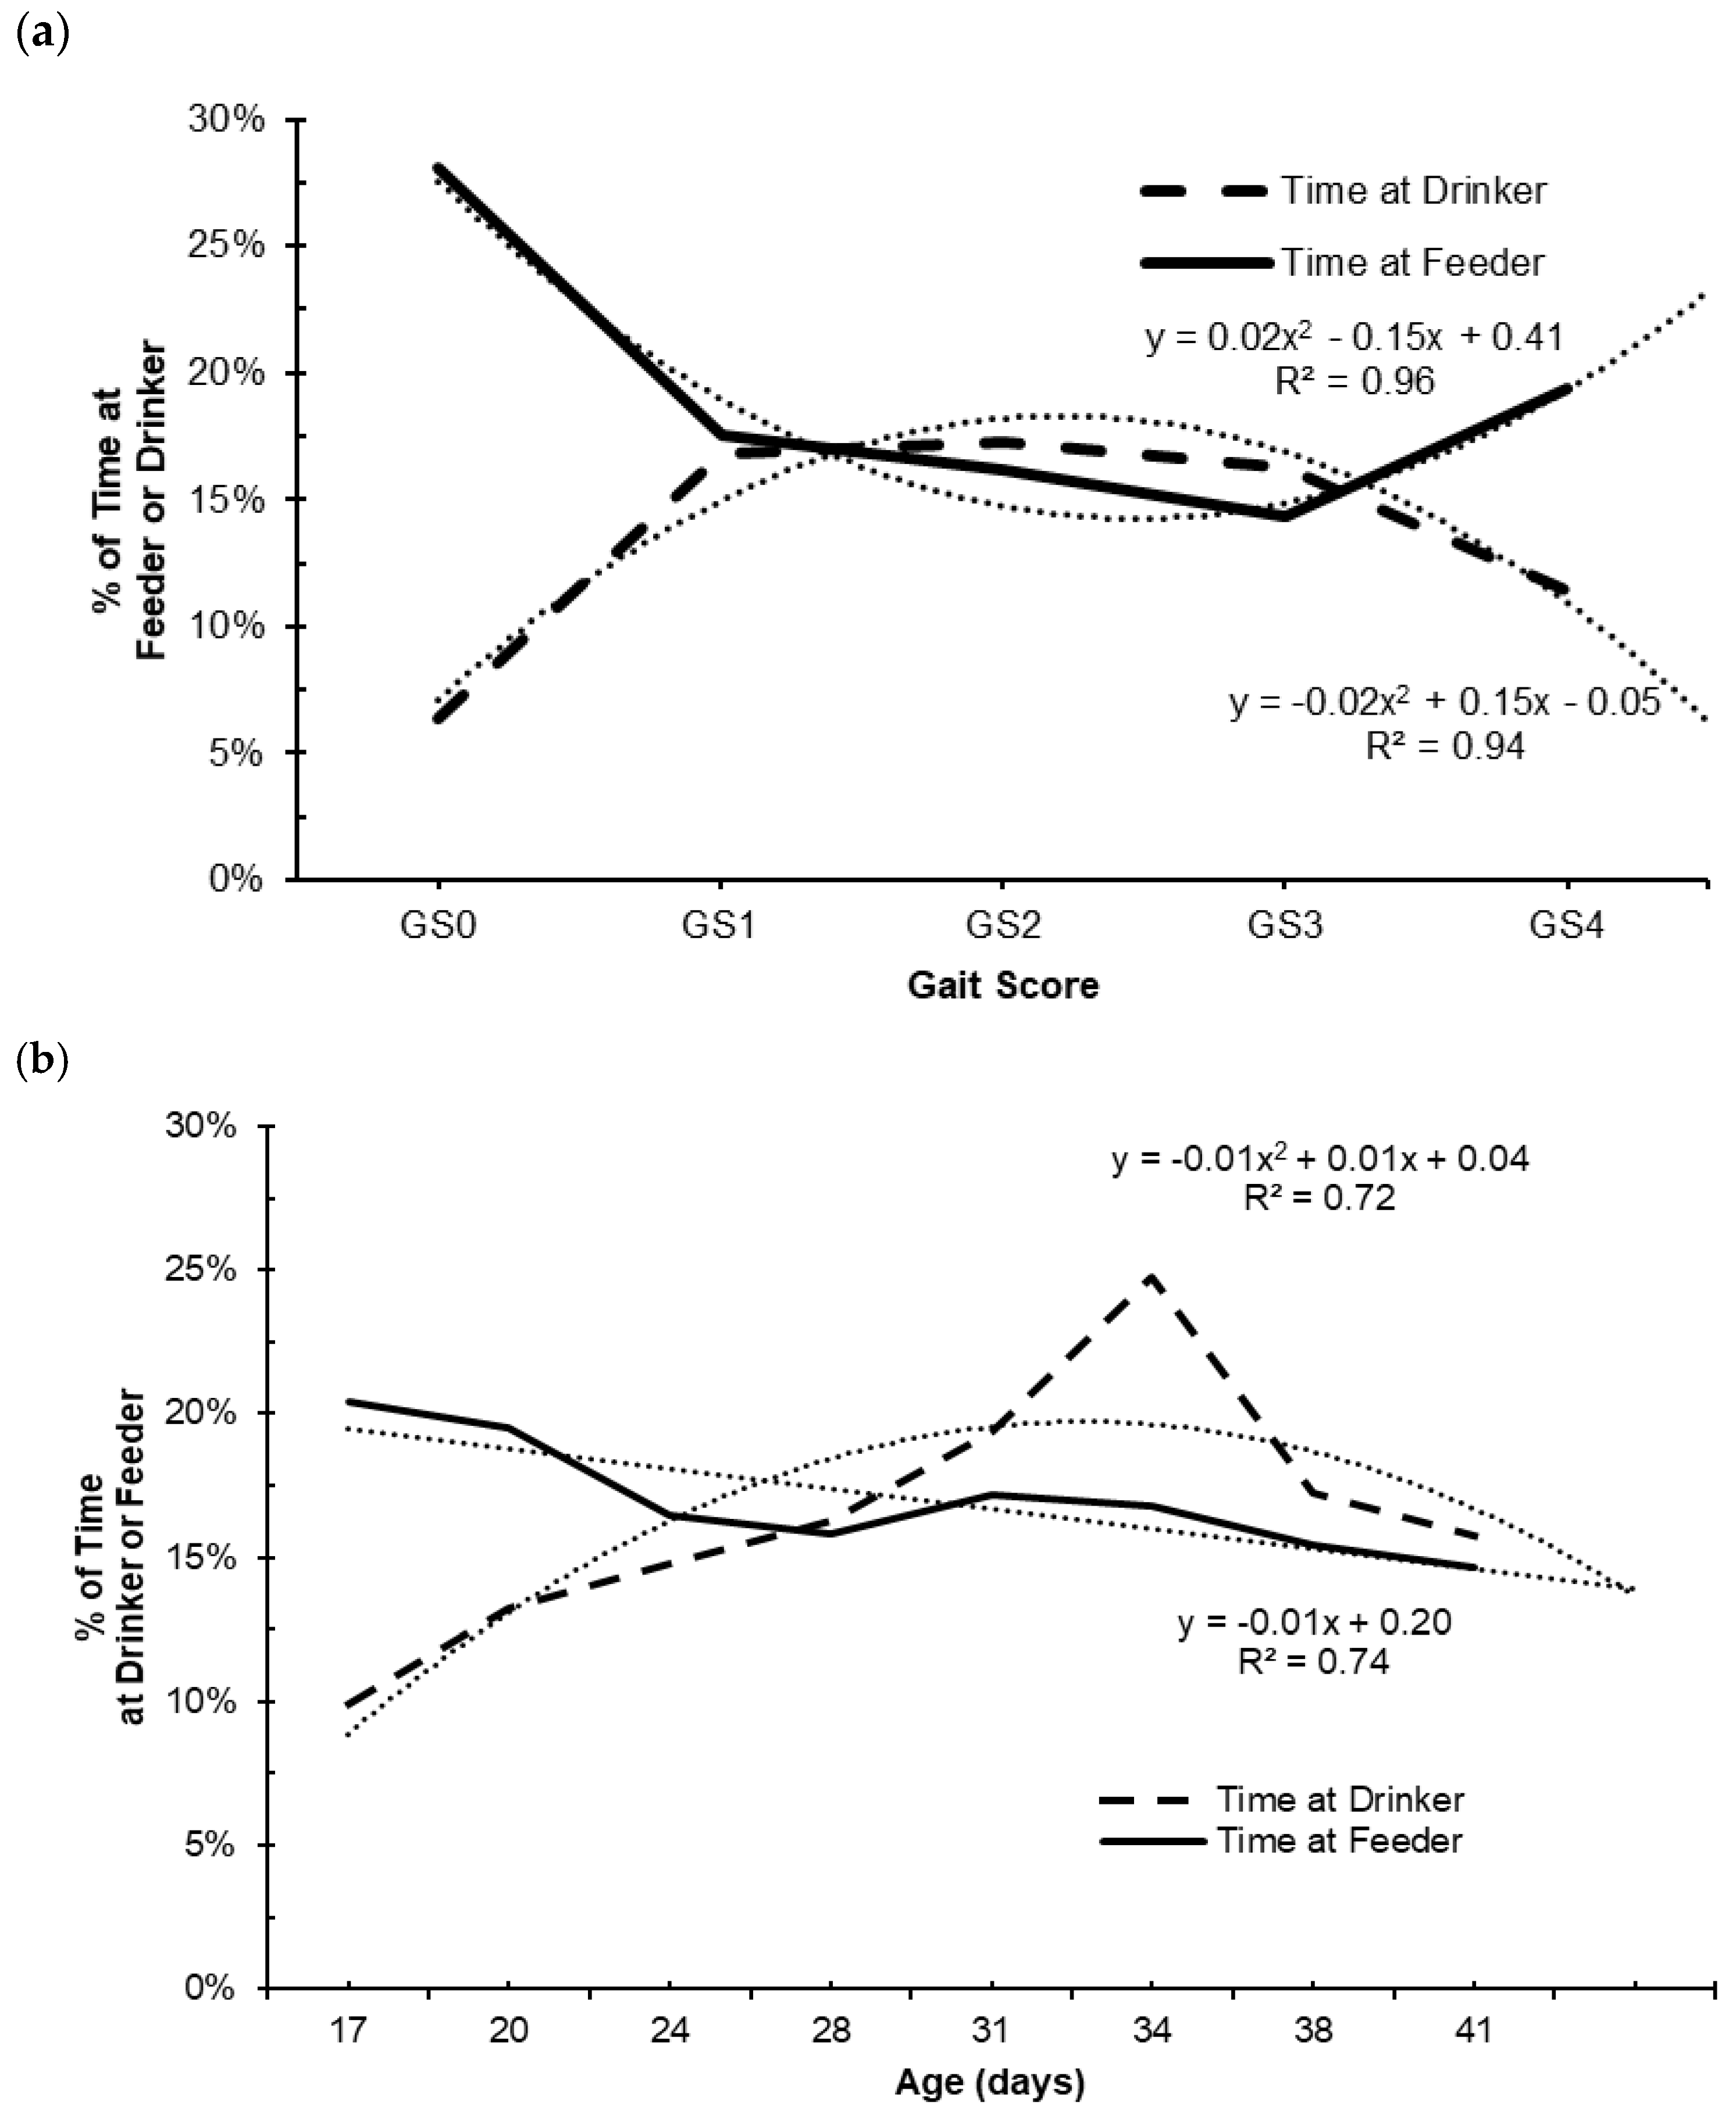
Deteriorating gait levels in fast-growing broilers is a major welfare concern for producers. Here, six mobility indicators were proposed and tested for predicting manual GS assessments of broilers using ML models. The YOLOv8 model was trained, achieving 91% mAP and 98% F1-score under a 50–95% confidence level. The mobility indicators were derived from the results of the trained DL model application on the dataset; the broiler gaits were manually assessed twice a week. It was found that the average hourly walking distance, mobility level, and idleness ratios of the individual broilers, for the most part, followed their declining GS levels over the eight-day period (p < 0.05). Meanwhile, the worsening GS of the broilers was also observed in the drinking and feeding behaviors as well as the daily total feed intake of the broilers. The hourly walking distance variable with the lowest multicollinearity was used in the ML models to predict GS. The RF model predicted GS with the lowest MR rate of 0.35, 0.54 RMSE, and highest generalized R2 of 0.62, as well as outperforming consistently in the 5-fold cross-validation tests. The findings highlight the practicality and promise of DL and ML approaches in broiler welfare management. Although the scale of this study may represent a key limitation, future research can build upon these findings to improve GS predictions using non-intrusive methods, enabling applications across broader broiler production systems.


