1. Introduction
Optimizing the design and working parameters of agricultural implement is essential for improving performance, production efficiency, and cultivation quality, while also minimizing fuel consumption and its adverse environmental effects. Operating implements with optimum settings can enhance soil tilth quality with minimal energy use [
1,
2,
3]. Numerous studies have emphasized the significant energy requirements of tillage equipment during field operations, highlighting the importance of efficient energy management to reduce fuel consumption and costs.
Estimation models provide the ability to estimate the draft and torque requirements of tillage tools using minimal data, reducing the reliance on cost-intensive and time-consuming field experiments. These models also aid in enhancing tool design by analyzing and comparing various factors that influence draft requirements. In recent years, soft computing techniques have gained widespread recognition for their accuracy and efficiency. Predictive modeling approaches, such as regression models, response surface methodology, and artificial neural networks (ANNs), have delivered promising results in agricultural engineering [
4,
5,
6]. These techniques enable the analysis and optimization of complex agricultural processes by identifying relationships between input parameters and desired outcomes. Regression models provide a straightforward statistical framework for predicting system behavior based on historical data, while RSM facilitates the optimization of multiple variables simultaneously to enhance performance. ANNs, inspired by the human brain’s neural structure, offer a powerful machine learning-based approach capable of capturing nonlinear patterns and improving predictive accuracy.
The sophisticated and stochastic tool–soil interaction, combined with the limitations of traditional methods like linear regression, calls for advanced optimization techniques. Among these, the genetic algorithm (GA) has been established as a resilient global optimization method. By simulating the process of natural selection, the GA efficiently explores large solution spaces, making it particularly well suited for addressing complex, nonlinear problems, such as optimizing the operational parameters of agricultural machinery. The GA has been widely adopted in agricultural research for tasks such as tool performance optimization and energy management due to its ability to handle both discrete and continuous systems effectively [
7,
8]. In a multi-objective GA, a population of potential solutions evolves over multiple generations. The algorithm evaluates each solution based on objective functions and applies Pareto dominance principles to identify a set of optimal trade-offs, known as the Pareto front. The final solution set allows decision-makers to choose an optimal configuration based on specific priorities. GAs outperform ANNs in optimization tasks due to their ability to explore complex, multi-modal solution spaces without requiring gradient information. Unlike ANNs, which rely on large datasets and risk overfitting, GAs use evolutionary principles to find optimal solutions efficiently. They are more interpretable, work well for multi-objective optimization, and do not require predefined problem structures [
9,
10,
11,
12].
Researchers have utilized various approaches, including regression models, ANNs, GAs, and hybrid techniques like genetic particle swarm optimization (GAPSO), to model and optimize the operational parameters of tillage and seeding machinery [
12,
13,
14,
15,
16]. GAPSO leverages the GA’s ability to explore a diverse set of solutions and PSO’s fast exploitation capability, leading to improved global optimization performance. The integration of predictive models with optimization tools has been successfully implemented across multiple disciplines [
17,
18,
19,
20]. The GA’s standalone capability to optimize parameters, coupled with its flexibility and computational efficiency, offers a distinct advantage over alternative techniques. In an optimization problem, one is interested in minimizing the undesirable effect(s) and maximizing the desirable effect(s). Multi-objective optimization (MOO) using the GA involves optimizing a number of objectives simultaneously and leveraging resources efficiently to ensure the best possible outcomes. In MOO, the final solution of the objective functions reflects a trade-off between multiple objectives, which may be entirely conflicting, partially conflicting, or non-conflicting [
21,
22,
23]. Multi-objective evolutionary algorithm, i.e., genetic algorithm-based search for an optimal solution, among other meta-heuristic approaches is among the most widely used stochastic search methods for solving multi-objective optimization problems and is used in this study for performance optimization of an integrated tillage implement. It is essentially a combined active–passive disk harrow (APDH), featuring a front gang driven by the tractor PTO and a free-rolling rear gang. Its benefits include enhanced soil tilth with fewer field passes, improved penetration capability, reduced draft, reduced wheel slippage, and better utilization of the tractor’s engine power [
2,
3,
16,
24].
In this study, experimental data from soil bin trials were utilized to develop regression models to predict specific draft and specific torque of APDH based on input parameters such as gang angle, speed ratio, soil cone index (CI), and working depth. Subsequently, a GA-based optimization framework was implemented to identify the optimal combinations of parameters that minimize energy expenditure while maximizing performance. The findings are intended to offer practical guidance for the design and operation of active–passive tillage machinery, promoting energy efficiency and environmentally sustainable agricultural practices.
2. Materials and Methods
2.1. Indoor Soil Bin and Test Setup
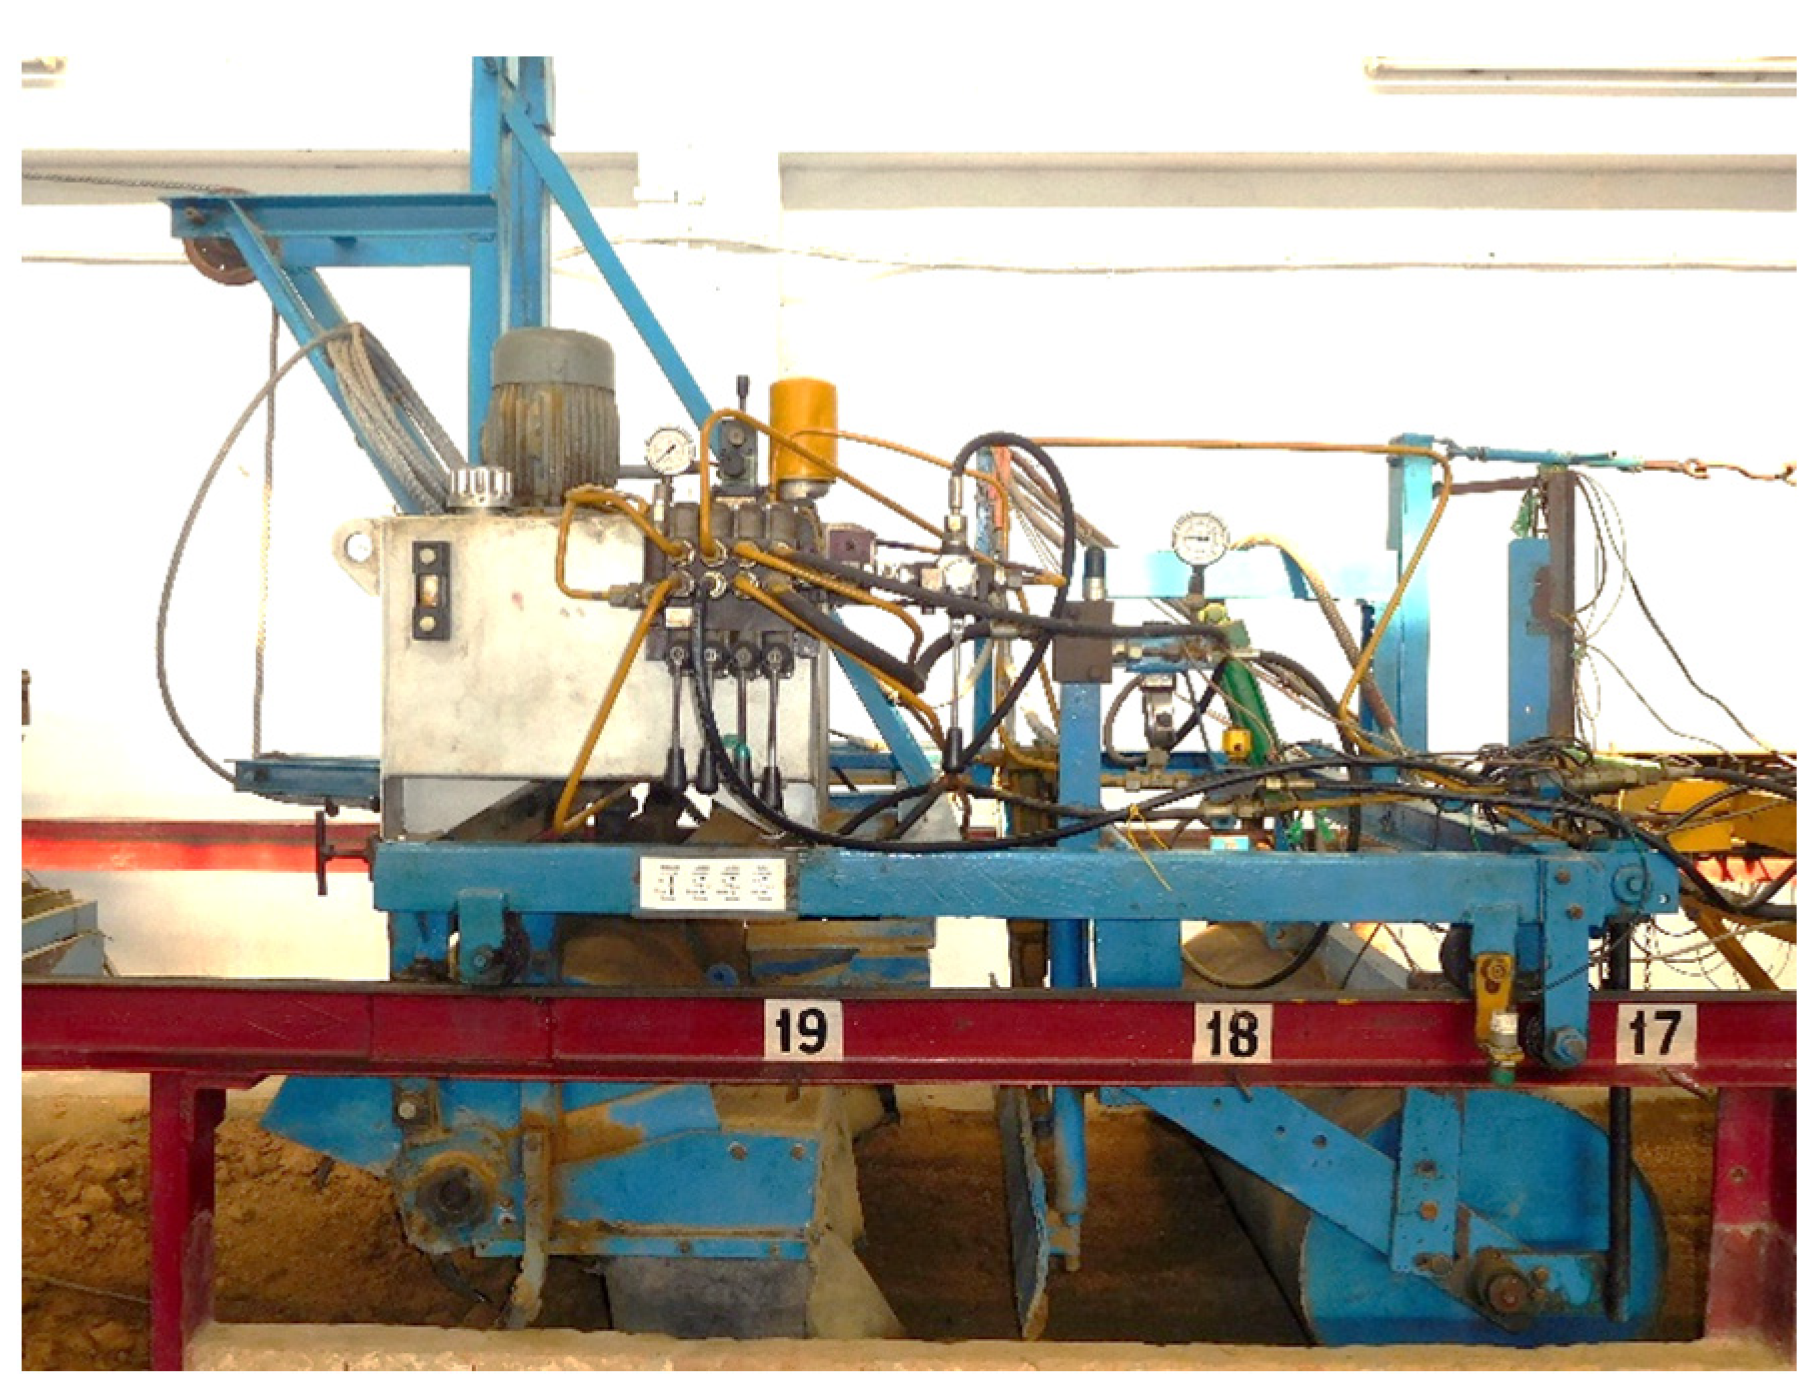
Research was conducted in an indoor soil bin measuring 15 m in length, 1.80 m in width, and 0.60 m in depth with an integrated active–passive offset-type disk harrow (APDH). The bin consisted of a soil bin track, soil processing carriage, gear reduction unit of a power tiller for forward/reverse movement, wire rope unit, an instrument panel, and a data logging system [
16]. The soil processing carriage (
Figure 1) helped in preparing the test bed at different soil compaction levels. It comprised a rotavator powered by a 3.75 kW, three-phase, and 1420 rpm induction motor, a leveling blade, and a roller for tilling, leveling, and compacting the soil, respectively. The APDH (
Figure 2) featured 03 powered disks in the front and 03 free-rolling disks in the rear set of gangs. The disk diameter is 510 mm with a concavity of 60 mm and a spacing of 225 mm between disks. A 10 hp, three-phase motor was used to transmit power to the front gang. The designed APDH had a working width of 630 mm, with its operating depth becoming adjustable using a hydraulic cylinder. The angle of the front-powered disks (α) could be adjusted by altering the angle of the shafts transmitting motion through U-joints and utilizing a series of holes in the frame while repositioning the mounted bearings. The frame of the APDH was fitted with slotted channels (C-shaped), allowing it to be attached to the soil processing carriage.
2.2. Experimental Plan
The soil type was sandy clay loam with particle density 2650 kg m
−3, angle of internal friction 22°, and was taxonomically grouped as Alfisol (Oxyaquic haplustalf). The prototype of the considered implement was tested in the soil bin at different α (25°, 30°, 35°, and 40°), speed ratios (2.4, 3.0, 3.6, and 4.6), cone index (CI) (0.50, 0.80, and 1.10 MPa), and at different depths (100, 120, and 140 mm). Speed ratio (u/v) is the ratio between the peripheral speed of the disk (u) to the forward speed of the machine (v). In this study, forward speed was maintained at 0.89 m s
−1, the maximum permissible speed in the bin, while peripheral speed was adjusted by changing the disk speed between 80 and 150 revolutions per minute to obtain the required speed ratios. All of these mentioned parameters influence the power requirements of actively rotating disks [
25,
26,
27].
2.3. Determination of Soil and Operating Parameters
The data on soil moisture content were taken using an infrared moisture meter. A hydraulically operated soil cone penetrating device was used to record the penetration resistance (or soil CI) as per ASAE Standards [
28]. The forward speed was measured using a proximity sensor attached to the processing carriage. The draft requirement was recorded using a 2000 kg load transducer (S-type) positioned between the processing carriage and implement. The torque requirement of APDH was measured with a 1 kN m capacity torque sensor. The data of all sensors used were fed to a data logging unit (HBM-Spider8) and then saved to a laptop.
2.4. Test Procedure
The soil bed was formed using the soil processing carriage prior to each experiment. A rotavator was employed to relieve soil stresses before the experiments, subsequently accompanied by water sprinkling to achieve the desired moisture of 9–11% (db). The soil was evened out with a leveler and compressed with a hydraulic roller to attain the desired soil CI. Tests were conducted after verifying the uniformity of the soil bed (p ≤ 0.01) by recording moisture and the CI. Tests were conducted over a seven-meter track in the central section of the soil bed with each test repeated three times. Using the load transducer, torque sensor, and proximity sensor, draft, torque, and operating speed data were continuously recorded. After the operation, the CI of the tilled soil (CItilled) was also measured at five points about one-meter distance apart along the test bed. After each test, the bed was disturbed and re-prepared using the same procedure for subsequent tests.
2.5. Statistical Analysis and Development of Regression Models
The experimental design was fully randomized with 03 replications for each parameter. ANOVA and post hoc analysis using Duncan’s test were performed to assess differences between treatment means. SPSS software (version 22.0) was used to perform regression analysis using the multiple regression method. Curve fitting was applied to analyze the relationship between independent (CI, u/v ratio, depth, and α) and dependent (specific draft and specific torque) parameters and these relationships were incorporated into the ultimate regression model. The regression models were fitted in an iterative manner to the data using nonlinear least-squares optimization following the Levenberg–Marquardt algorithm. To refine the model, stepwise or backward elimination regression methods were applied to identify the most relevant predictors. Residual analysis was also conducted to check for heteroscedasticity and ensure the assumption of normality in residuals, which validates the model’s reliability. If issues arise, transforming variables or applying interaction terms might improve model accuracy. Interactions between variables were excluded in the development models, as their inclusion added complexity without significantly enhancing accuracy. To evaluate model efficiency, statistical indices: mean index error (MIE), variance account for (VarAF), root mean square error (RMSE), R
2, and mean absolute error (MAE) were calculated.
where E
i, M
i, and A
i are the values of estimated, measured, and average specific draft or specific torque, and n is the number of observations. MIE quantifies the non-diagonal estimation and should ideally be close to zero for an accurate model. A VarAF of 100% signifies that the developed model perfectly estimated the measured output, while a VarAF of 0% indicates poor estimation accuracy. The RMSE is the standard deviation of the residuals reflecting the prediction power of the model. If the VarAF is 100% and the RMSE is zero, the model would be considered perfect, as it would indicate that the predicted values exactly match the measured data with no deviation. R² is widely used to assess goodness of fit. The MAE, denoting accuracy in percent, was also used to compare the model’s estimated performance.
2.6. Optimization of Operating Parameters
Specific draft and specific torque requirement estimation models were developed using multiple regression technique to ultimately predict the total power requirement (Pe). A model was also developed to predict the CI of the tilled soil (CItilled). These developed estimation models were used to carry out multi-objective optimization (MOO) in MATLAB software to determine the optimum ‘α’ and speed ratio before developing a field prototype with the aim to carry out tillage with minimum Pe and maximum reduction in CItilled.
A MOO problem for achieving optimum tillage performance with minimum power consumption was formulated for the implement operating in three different soil conditions (CI values of 500 ± 30, 800 ± 30, and 1100 ± 30 kPa representing soft, tilled, and firm soil, respectively) as discussed earlier. Five independent variables (decision variables) namely α (degrees), operating depth (mm), forward speed (km h
−1), front gang axle rpm (N
FGA), and soil CI (MPa) denoted, respectively, as X
1, X
2, X
3, X
4, and X
5 were considered such that the vector of decision variables is as given in Equation (7).
The optimization problem of interest had two objective functions which were minimizing the estimated total power requirement of the tractor (Pe) and minimizing the cone index of the tilled soil (CI
tilled). Two functions were defined, f
1(X) for P
e and f
2(X) for CI
tilled given in the results section. With these functions defined, the optimization problem was formulated (Equation (8)):
where X
i is the decision variable space limited by upper and lower bounds (l
b ≤ X ≤ u
b; l
b for lower bound and u
b for upper bound) on the decision variables. The optimization problem under consideration was constrained by upper and lower bounds for decision variables and are expressed by Equations (9)–(13).
The MOO problem was solved using the ‘gamultiobj’ function in MATLAB, which efficiently finds a set of Pareto-optimal solutions for conflicting objectives. Since the GA is inherently a minimization algorithm, the maximum reduction in CItilled objective is transformed into a minimization problem by negating it. To implement this, an objective function file is created, defining Pe and CItilled as functions of key variables. The optimization problem is then constrained within defined upper and lower bounds to ensure practical feasibility. The ‘gamultiobj’ function is then executed with these constraints, generating a set of Pareto-optimal solutions, where no single solution is universally better—trade-offs exist between reducing energy consumption and improving soil conditions.
To analyze the results, a Pareto front is plotted, visually depicting the trade-offs between power requirement and soil improvement. The decision-maker can select an optimal solution based on operational priorities. This approach ensures an efficient and data-driven selection of tillage parameters, leveraging the GA’s ability to explore complex solution spaces. MATLAB’s GA-based MOO approach provides a robust framework for optimizing agricultural processes, balancing competing objectives for sustainable and energy-efficient tillage operations.
2.7. Validation of the Developed Regression Models
The specific draft and torque requirement estimation models were validated using data collected during a separate set of soil bin tests, distinct from those used for model development and from the field data collected during tillage operation. The maximum absolute deviation (MAD) quantified the maximum deviation of model outputs from the data recorded from soil bin and field tests.
3. Results and Discussion
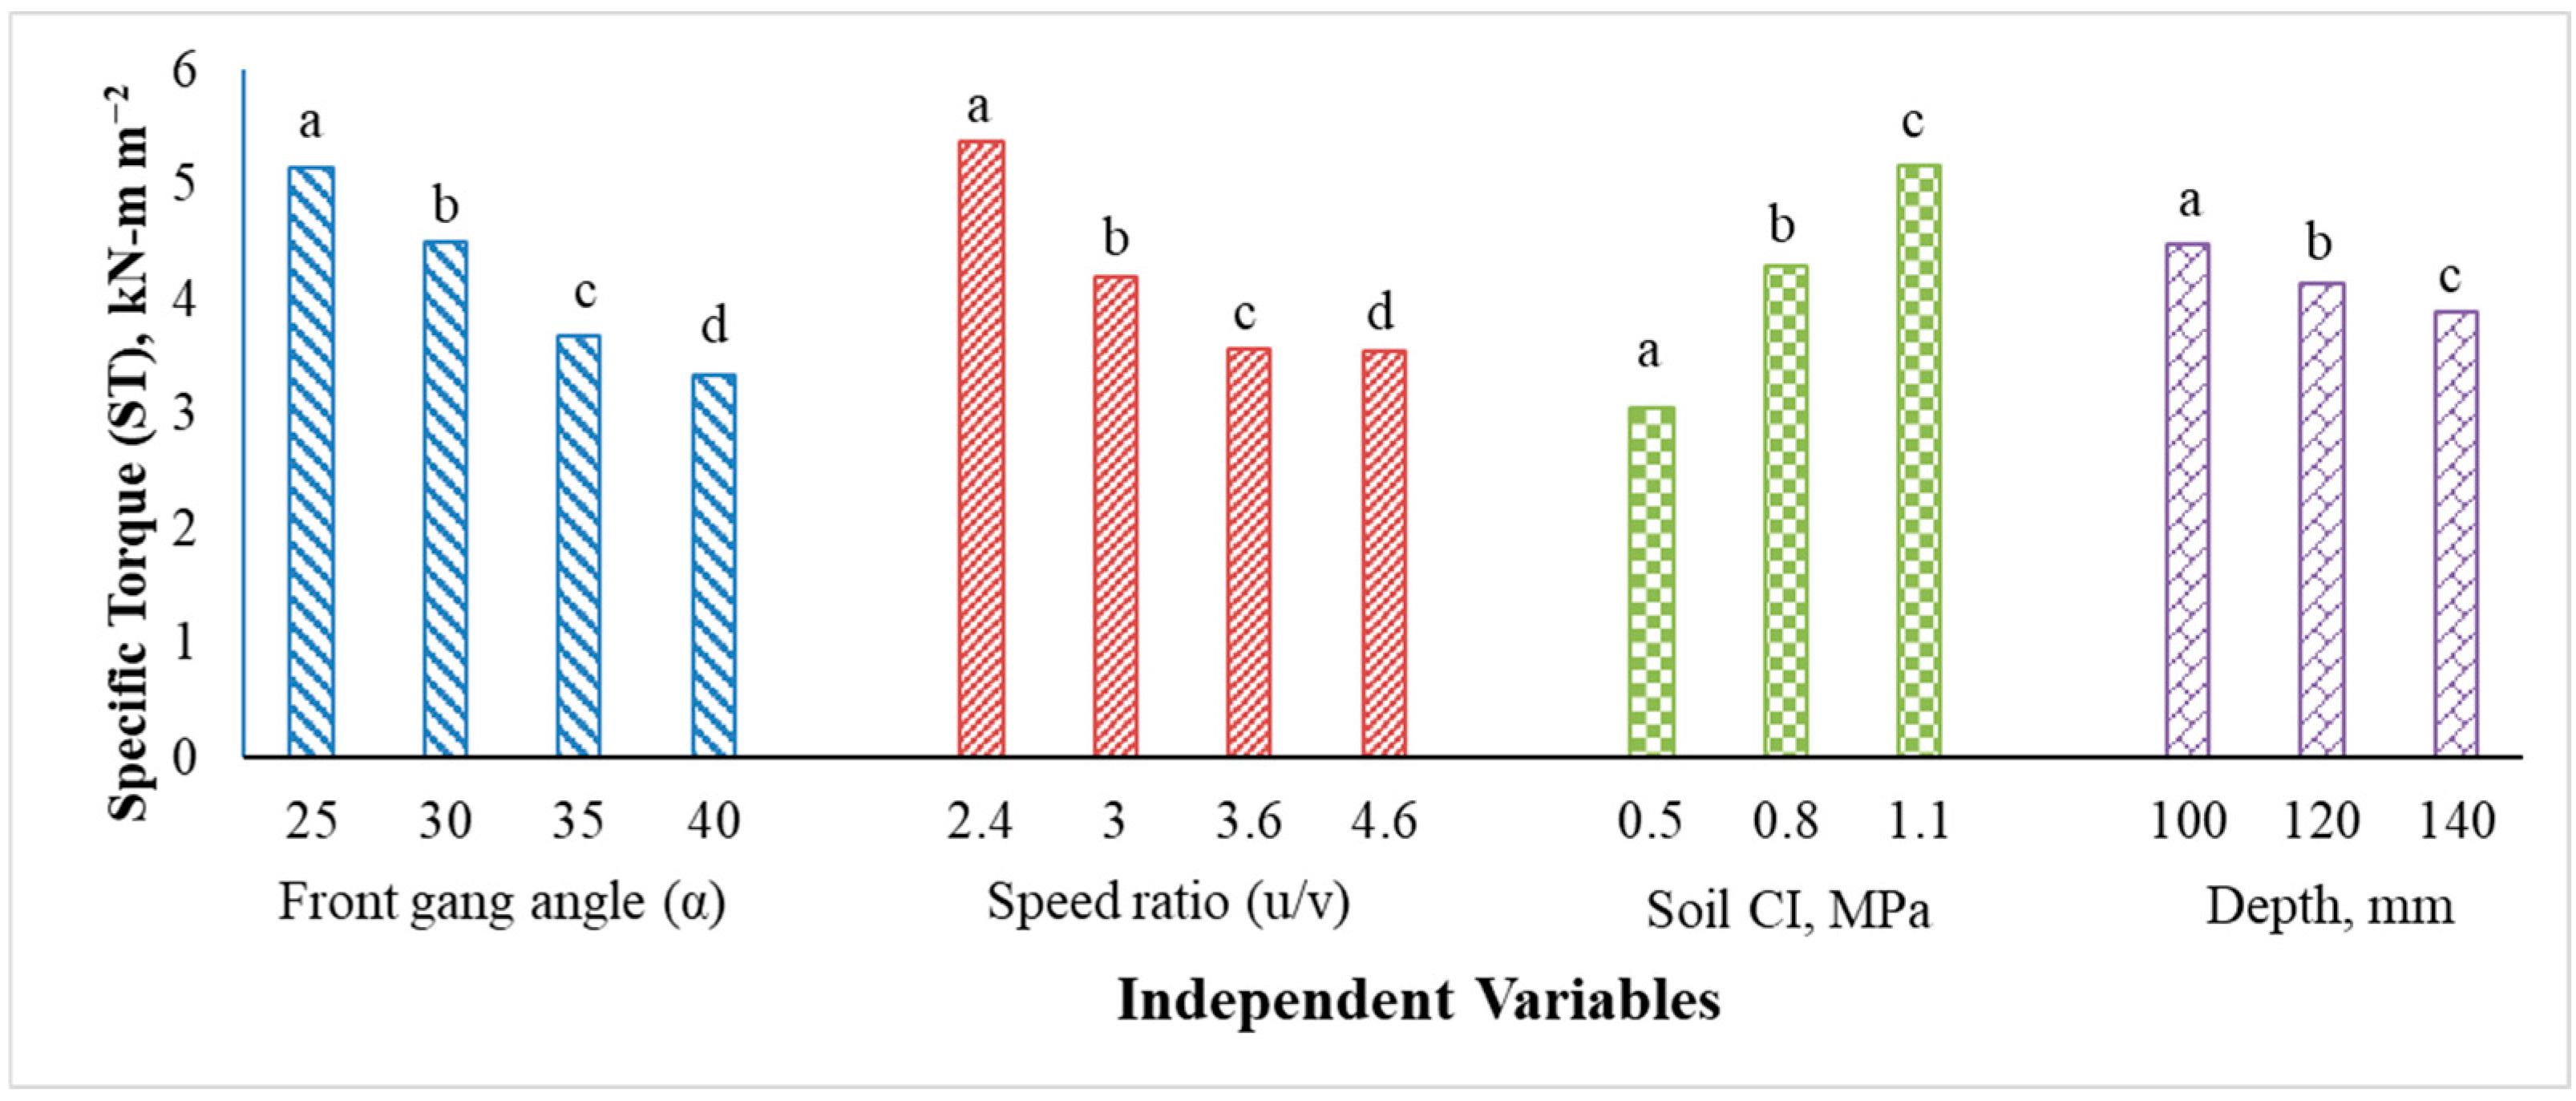
The APDH test rig was operated in the soil bin at different α, u/v settings, CI, and working depths and the results are presented in
Figure 3 and
Figure 4. The effect of these operating parameters on specific draft (SD) and specific torque (ST) requirements is discussed below.
3.1. Impact of Operating Parameters on Specific Draft (SD) Requirement
ANOVA results revealed that the individual effects of all independent variables on the SD requirement were statistically significant at the 5% significance level. The F-values indicated that α had the greatest influence on the SD requirement, followed by the CI, u/v ratio, and depth of operation. The findings indicate that the SD of the APDH decreased with an increasing u/v ratio, with the most significant reduction occurring up to a u/v of 3.6, beyond which any increase in rotational speed yields negligible benefits. This suggests that increasing disk speed improves soil pulverization and reduces draft until a threshold where the soil shear strength reaches a minimum. Duncan’s test confirms significant differences in mean SD values across different u/v ratios at a 5% significance level, reinforcing that optimal performance is achieved at a u/v of around 3.6.
The study reveals that the SD of the APDH increased with an increase in gang angle (α), with a moderate rise up to 35° followed by a sharp increase beyond this point. This trend is attributed to the decreasing rear-side bearing area and increasing soil volume managed by the disks. Duncan’s test confirms significant differences in mean SD values across different α levels at a 5% significance level, indicating that higher gang angles result in increased draft requirements, particularly beyond the critical threshold of 35°.
The findings indicate that the SD of the APDH decreased with an increment in working depth. This reduction, ranging from 1.53% to 19.27%, is attributed to the relatively lower increase in the draft at greater depths due to the enhanced pushing force generated by the front set of powered disks and a higher increase in the soil displacement area. These results suggest that deeper operations may improve efficiency by reducing the SD requirement.
The study shows that the SD of the APDH increased with higher soil CI due to greater soil resistance. The mean SD rose significantly as soil CI increased from 0.5 to 1.1 MPa, with a percentage increase ranging from 42.18% to 64.50% across different gang angles at a working depth of 120 mm. Comparable trends were found at 100 and 140 mm depths, confirming that higher soil resistance leads to increased draft requirements, emphasizing the need for appropriate operational adjustments in denser soils.
3.2. Impact of Operating Parameters on Specific Torque (ST) Requirement
ANOVA results revealed that the individual effects of all independent variables on the ST requirement were statistically significant at the 5% significance level. The F-values indicated that CI had the greatest influence on the ST requirement, followed by u/v ratio, α, and depth of operation. The findings indicate that the ST requirement of the APDH decreased with an increasing u/v ratio, with the most significant reduction occurring up to a u/v of 3.6; thereafter, rotational speed has a negligible effect. This reduction is attributed to lower cutting force requirements and frequent engagement with already tilled soil at higher rotational speeds. Duncan’s test confirms no significant difference in ST between u/v ratios of 3.6 and 4.6, suggesting that increasing the rotational speed beyond 3.6 provides no additional torque-related benefits.
The results show that the ST requirement of the APDH decreased with increasing α, with a sharp reduction observed from 25° to 35° and a smaller reduction beyond 35°. This trend is attributed to the lesser frictional force resulting from the decreasing contact area between the rear side of the disks and the furrow wall. However, an increase in the volume of soil managed beyond 35° counteracts this effect, leading to a smaller reduction in ST. Duncan’s test confirms significant differences in ST for different α values, reinforcing the impact of disk angle on torque requirements.
The findings suggest that the ST requirement of the APDH decreased with an increase in operating depth across all tested conditions. The reduction is attributed to a comparatively lesser increase in torque demand alongside a greater increase in soil disturbance area at higher depths. However, the absolute torque requirement increased with depth due to the greater amount of soil handled and higher penetration resistance. These results align with previous studies by [
25,
29], reinforcing the observed trend across different soil types.
The results indicate that the ST requirement of the APDH increased with an increase in soil CI. This is due to the greater soil resistance associated with greater CI values. The trend was consistent across different α values, u/v ratios, and working depths. Notably, the percentage increase in ST was more pronounced at higher α values, with the highest increase (76.82% to 98.62%) observed at α of 40°. These findings suggest that soil compaction significantly impacts the torque demand, which is crucial for optimizing APDH performance in varying soil conditions.
3.3. Specific Draft and Specific Torque Estimation Models
To develop regression models, the Levenberg–Marquardt algorithm was followed and the interactions between operational variables were excluded as it increased the model sophistication without improving its prediction power. A multi-collinearity test was conducted using tolerance and variance inflation factor (VIF) as signs of possible interdependencies among the operational variables, revealing no sign of multicollinearity as the VIF value was calculated to be one. The high VIF values (typically >10) suggest strong correlations between independent variables, potentially distorting the regression estimates. The developed models are discussed below.
Soil CI and operating depth were found to have a linear relationship with both specific draft and specific torque requirements. However, α had a quadratic relationship, and the speed ratio had a negative exponential relationship with both specific draft and specific torque requirements. The developed models for estimating specific draft (Equation (14)) and specific torque (Equation (15)) requirements are as follows.
where SD
APDH is in kN m
−2; ST
APDH is in kN-m m
−2; α is in degrees; CI is in MPa; d is the working depth in mm; u/v is the speed ratio; v is in km h
−1; and C
i = regression coefficients whose values are given in
Table 1 with standard errors for both SD and ST models, i = 0, 1, 2, 3, 4, 5.
The total power requirement (Pe) may be predicted from the SD
APDH and ST
APDH models as follows (Equation (16)):
where Pe is the total power requirement of the tractor in kW; SD is the specific draft in kN m
−2; v is in km h
−1; ST is in kN-m m
−2; A
sd is the area of soil disturbance in m
2; N is the rpm of powered disks; η
PTO to DB is the transmission efficiency from PTO to drawbar [
30]; and η
trans is the transmission efficiency from PTO to the front gang.
The results of regression analysis for the specific draft and specific torque estimation models are given in
Table 2.
3.4. Estimation Model for Cone Index of the Tilled Soil (CItilled)
The average values of the cone index of the tilled soil (CItilled) obtained during soil bin tests were analyzed and were used to develop a model for estimating CItilled using the multiple regression technique. The aim of developing the model for CItilled (Equation (17)) was to use this model for carrying out the multi-objective optimization. In general, the CItilled obtained after the operation was found to decrease with an increase in α, u/v, and operating depth at all tested soil cone indices. The ANOVA results indicated that all variables had a significant effect on the CItilled at a 1% level of significance with the initial soil CI having the greatest influence on the CItilled followed by u/v, depth, and α in that order.
Soil CI, working depth, and α were found to have a linear relationship while speed ratio was found to have a negative exponential relationship with CI
tilled. The developed model has high R
2 and low RMSE of 0.97 and 0.032, respectively. The results of regression analysis for the developed CI
tilled model are given in
Table 3. The estimated values of regression coefficients and their standard error for the developed CI
tilled model are given in
Table 4.
where CI
tilled is in MPa; α is in degrees; CI
before is the cone index of the soil before tillage in MPa; d is in mm; u/v is the speed ratio; and C
i = regression coefficients, i = 0, 1, 2, 3, 4.
3.5. Statistical Indices for the Developed Models
The statistical indices for the specific draft and specific torque models were calculated using Equations (1)–(5) for analyzing the efficiency of developed models, and the results are given in
Table 5. The indices calculated for the developed CI
tilled model are also given in
Table 5. The high VarAF and R
2, combined with low MIE, RMSE, and MAE, confirmed the accuracy of all developed models and demonstrated that the selected parameters effectively explained the majority of the variability in the test data.
3.6. Multi-Objective Optimization to Obtain the Optimum Combination of α and Speed Ratio
The multi-objective optimization (MOO) based on the genetic algorithm approach was performed in MATLAB to obtain the optimized values of α and speed ratio that satisfied the objective functions (i.e., minimizing P
e (Equation (16)) and minimizing CI
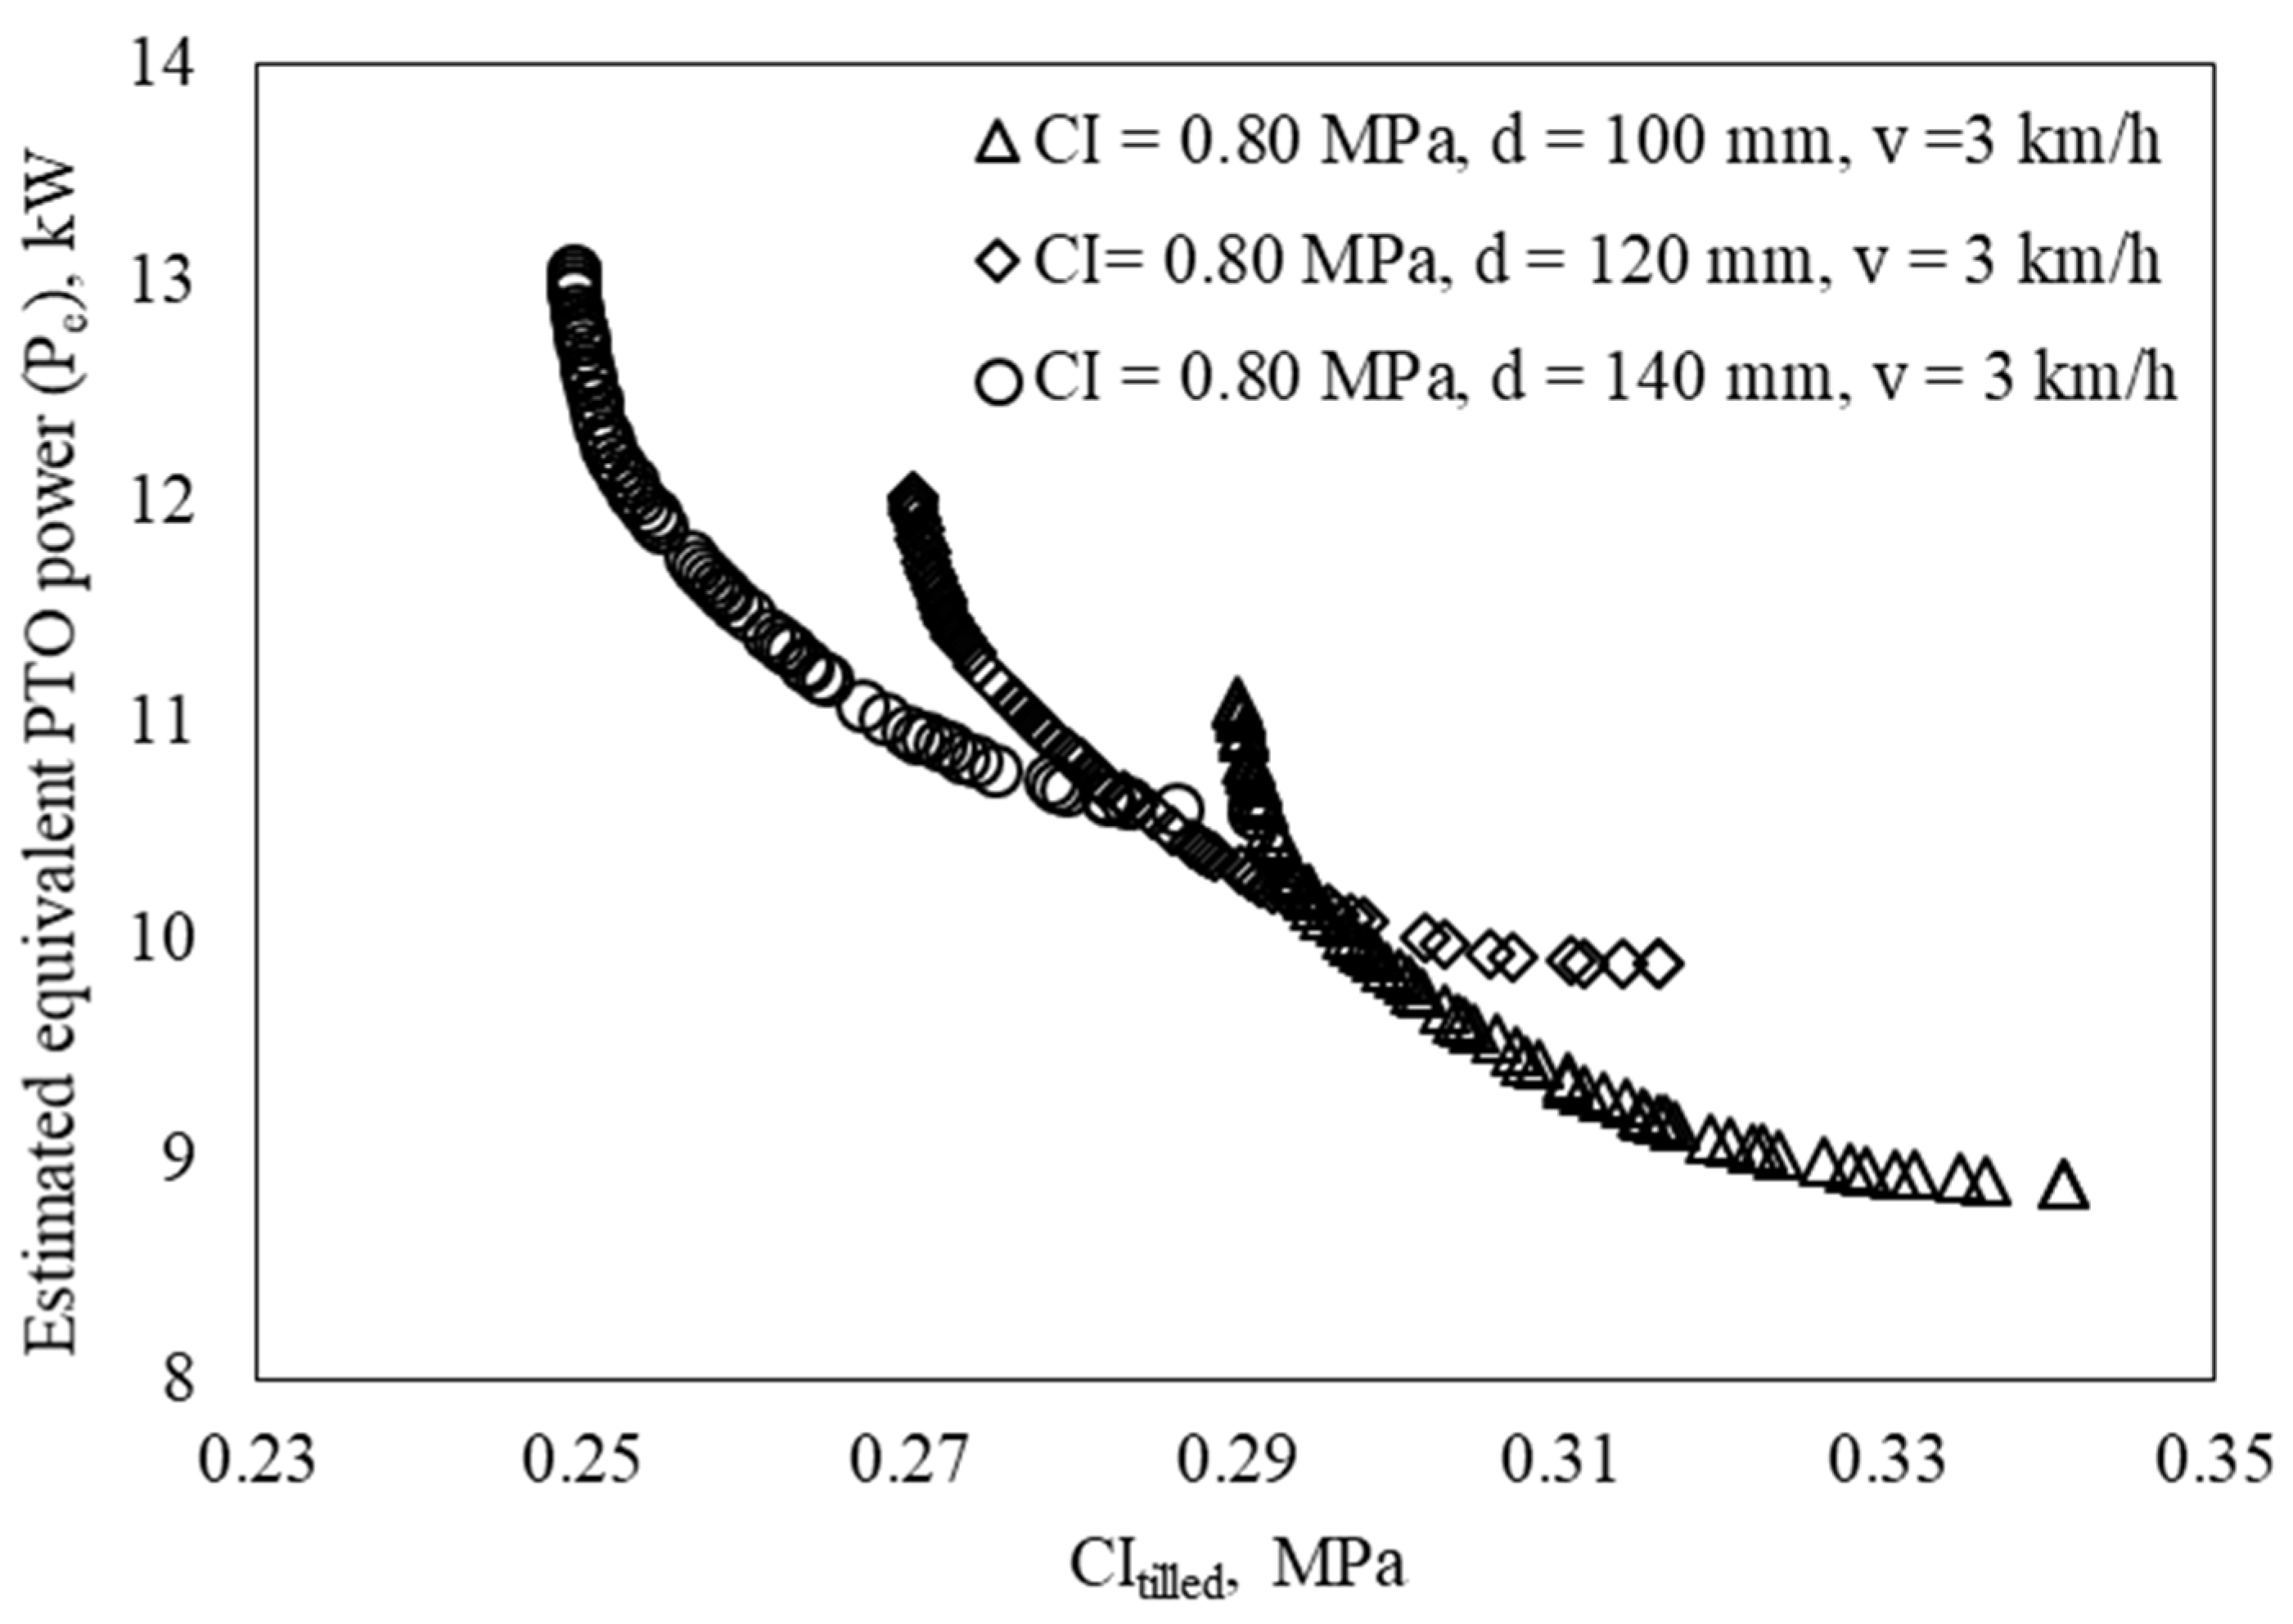
tilled (Equation (17)). Pareto fronts or sets of non-dominated solutions obtained for Pe vs. CI
tilled at some set operating conditions (CI
before, operating depth, and forward speed) are shown in
Figure 5. In this figure, moving from one solution to another in the Pareto set involves trade-offs between multiple objectives. One optimal solution among the possible solutions can be selected on the Pareto front based on the choice/preference of the decision-maker for any particular condition.
The numerical solutions of MOO obtained for different operating conditions are listed in
Table 6. In the present study, the aim was to test the implement in the field at the optimum settings of α and speed ratio obtained from the results of MOO. Based on soil bin data and following the MOO technique using the genetic algorithm, the optimum values of α and speed ratio were found to vary in the range of 35.91° to 36.98° and 3.27 to 3.87, respectively. Considering the optimum range of these variables, the field prototype of the APDH was designed and developed by fixing α at 36°, whereas the speed ratio was varied in the field. Further, it was noticed that with an increase in the forward speed from 3 to 6 km h
−1, the corresponding N
FGA needed to be increased from 92.9 rpm to 220.1 rpm to achieve optimized values of objective functions (i.e., minimum Pe with maximum reduction in CI
tilled values) for most of the non-dominated solutions.
3.7. Validation of the Regression Models from the Soil Bin Data
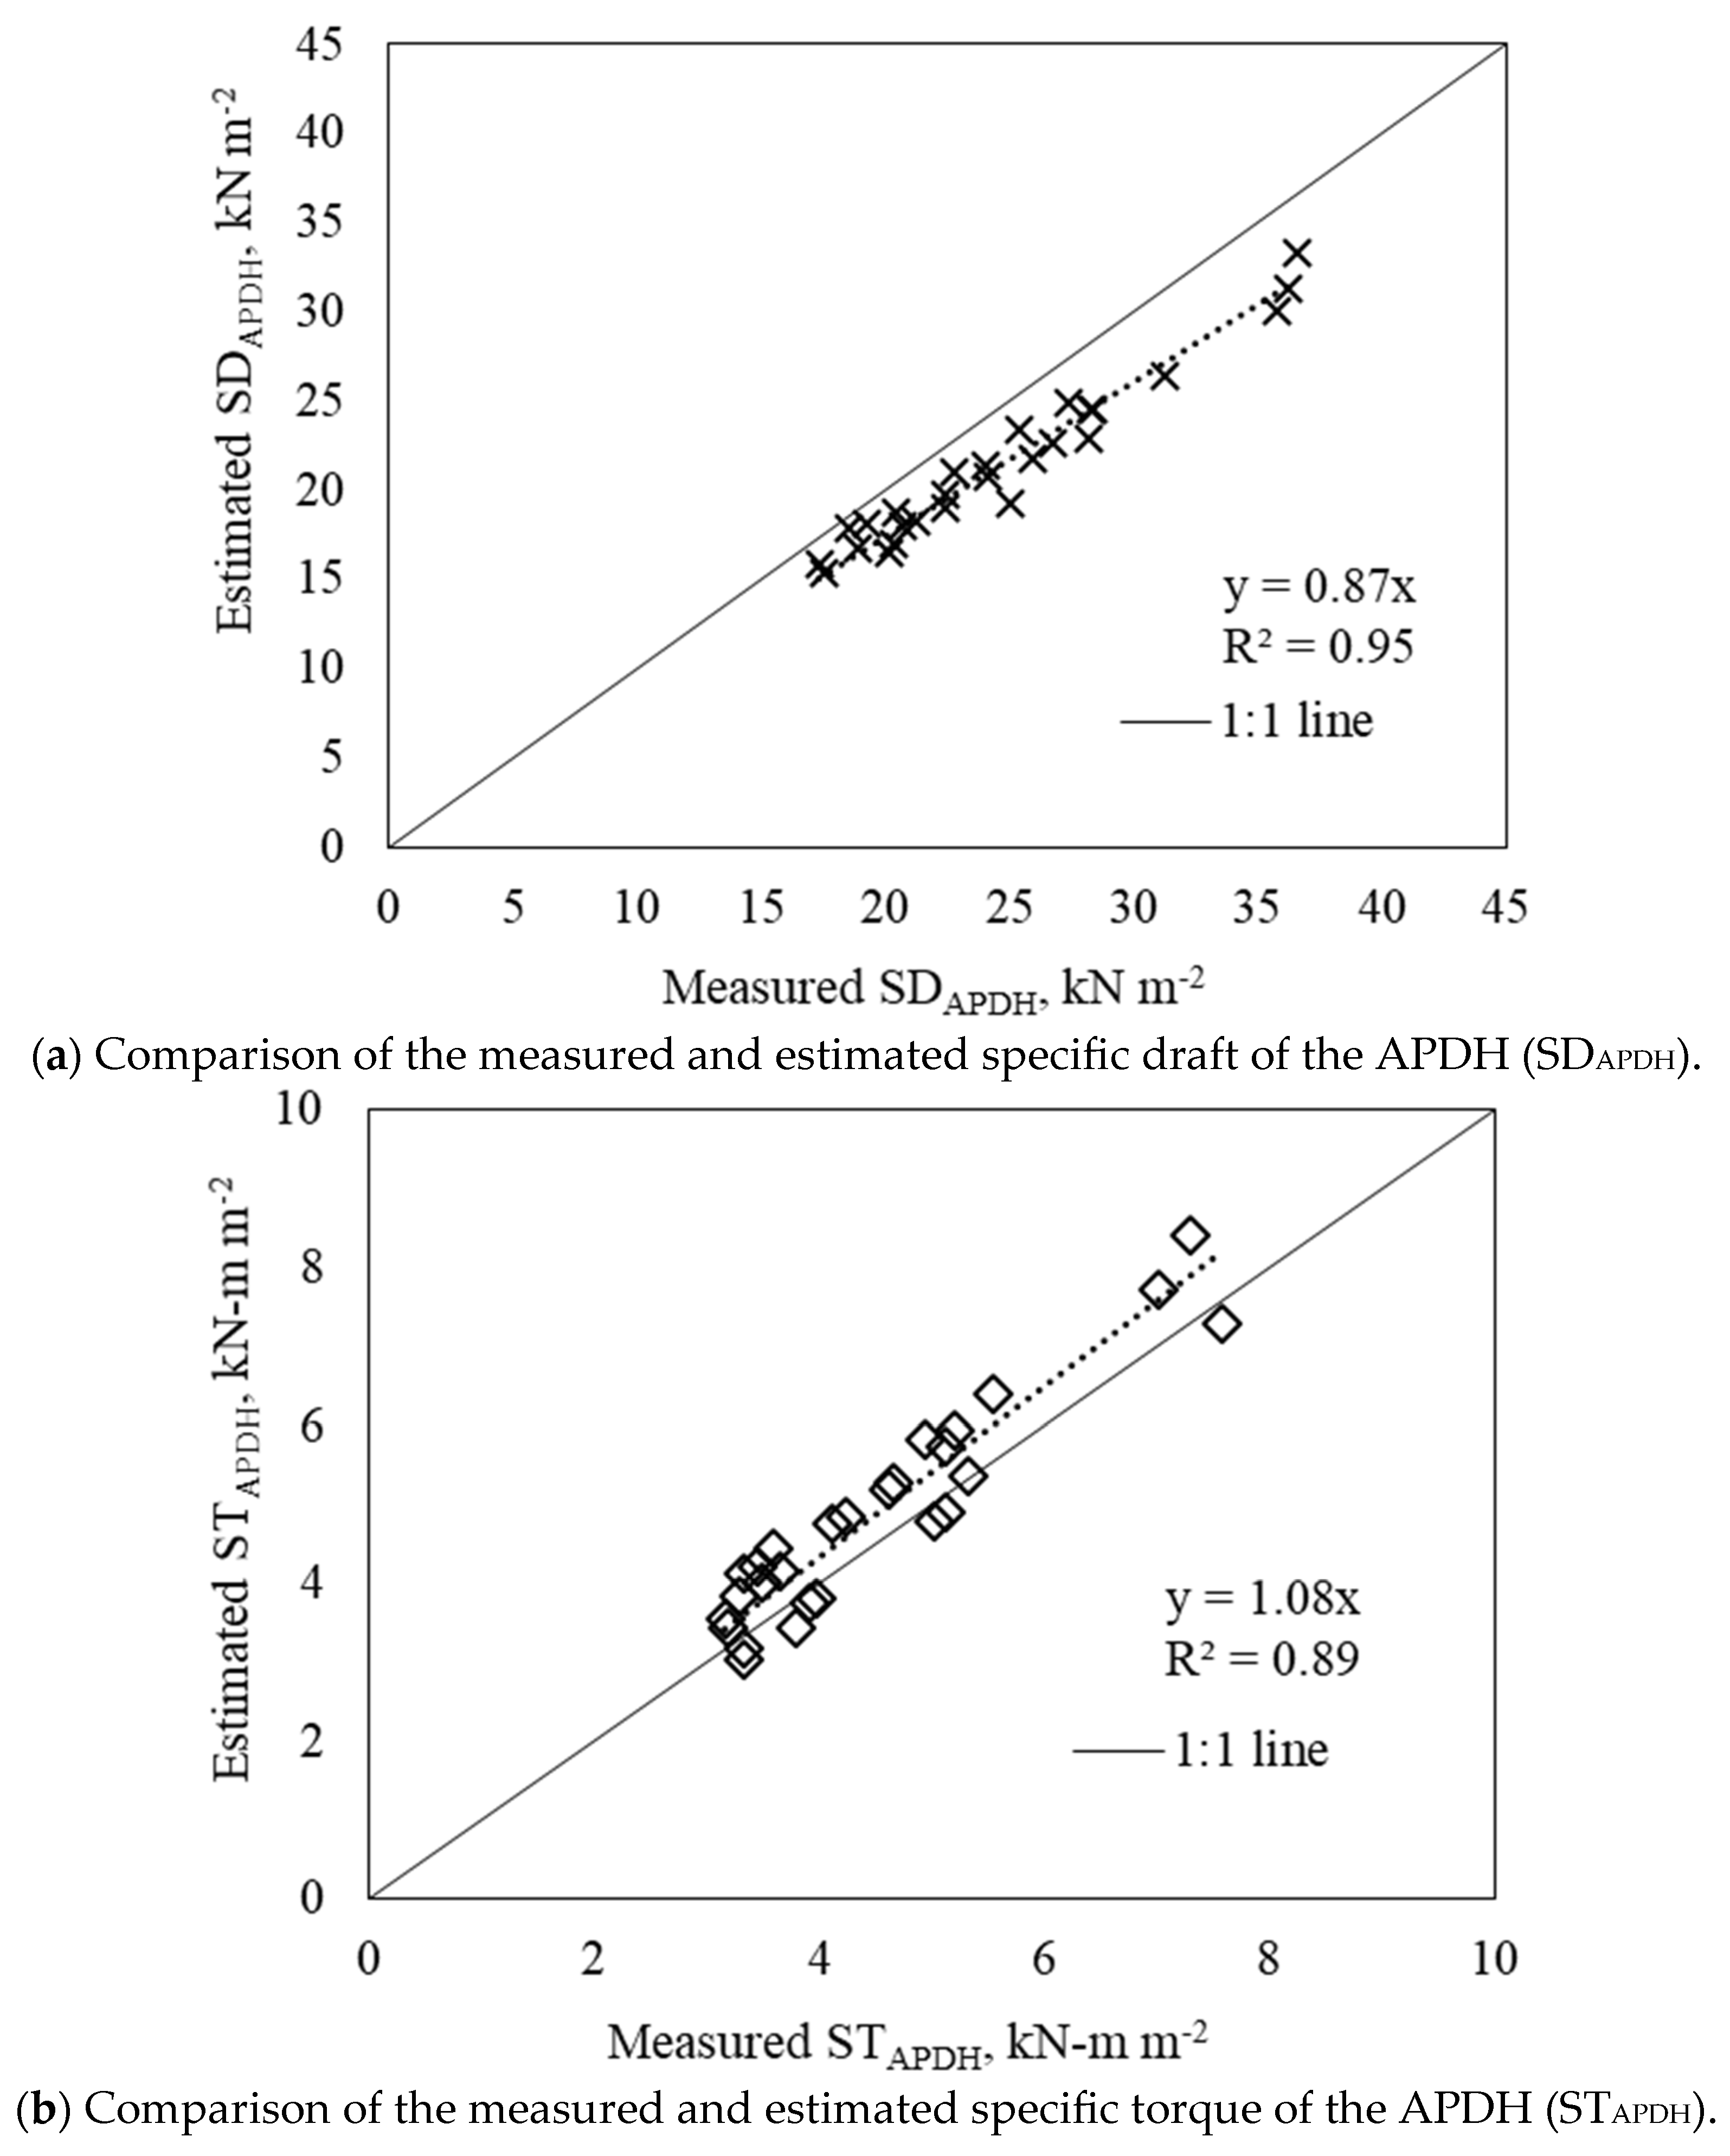
The developed models for estimating SD and ST were validated using data collected during a separate set of soil bin tests, distinct from those used for model development. The rotational speed of the disk, α, depth, and forward speed was varied randomly between 80 and 150 rpm, 25° to 40°, 60 to 140 mm, and 0.8 to 3.2 km h
−1, respectively, at different cone indices of soil (0.65 to 1.2 MPa). The observed and estimated values of the SD and ST are compared in
Figure 6a and
Figure 6b, respectively. It is evident that the slope of the best-fit line is close to unity with high R
2 for all the models developed. The MAD between observed and estimated values of parameters was found to be 18.50% and 13.11% for the SD and ST, respectively. These variations are considered acceptable because of the variations that existed in preparing the soil bed with the desired CI and also the experimental errors incurred while measuring the draft and torque.
3.8. Validation of the Developed Regression Models from the Field Data
The estimation models developed from soil bin data were also validated against the mean values of draft and torque data collected from the field tests. The observed and estimated values of the SD and ST requirements are compared in
Figure 7a and
Figure 7b, respectively. It can be seen in these figures that the slope of the best-fitted line is close to unity with good R
2 for both the models developed. However, the developed models were found to underestimate the SD and overestimate the ST requirement. The MADs between observed and estimated values of the specific draft and specific torque requirement were found to be 19.79% and 19.47%, respectively. The presence of loose and anchored crop residues, variations in soil conditions in the field, and the experimental errors incurred while measuring the draft and torque values could be the reasons behind the variations between observed and estimated values.
4. Conclusions
The specific draft and specific torque requirement of the APDH was found to increase with an increase in α and soil CI, and it decreased with an increase in u/v ratio at any α and operating depth. Using multiple regression technique, models were developed incorporating the soil CI, front gang angle, operating depth, forward speed, and u/v ratio from soil bin data to estimate the specific draft and torque requirements of the APDH in sandy clay loam soil with maximum absolute variations of 18.50%, 13.11%, and 12.04%, respectively. Soil CI and operating depth were found to have a linear relationship with both specific draft and specific torque requirements. However, α had a quadratic relationship, and the speed ratio had a negative exponential relationship with both specific draft and specific torque requirements. Based on soil bin data and following the MOO technique using genetic algorithm, the optimum values of front gang angle and u/v ratio for the APDH were found to vary in the range of 35.91° to 36.98° and 3.27 to 3.87, respectively. Further, it was found that with an increase in the forward speed (3 to 6 km h−1), the corresponding NFGA of APDH needed to be increased (92.9 to 220.1 rpm) to achieve optimized values of objective functions, i.e., minimum Pe and maximum reduction in CItilled values. The field trials demonstrated that by carefully setting the gang angle and the speed ratio, significant improvements in tillage efficiency were achieved, reducing overall fuel consumption and improving soil conditions. The combination of multiple regression modeling, GA-based multi-objective optimization, and field validation provided a comprehensive approach to optimizing tillage operations.
The developed models for estimating specific draft and specific torque will offer valuable insights to farmers and manufacturers regarding the necessary tractor power, facilitating the optimal selection of tractor-implement combinations for their farms. The findings of this research will serve as a useful resource for engineers and scientists involved in farm machinery development and management, as well as for manufacturers and farmers across India. Furthermore, this study provides a strong foundation for adopting active-passive combination tillage implements in the Indian farming system, enhancing tractor power utilization efficiency. Future studies involving diverse soil types and humidity levels will aid in confirming the model’s general applicability.


