Article

Mapping Paddy Fields Using Satellite Images and Machine Learning to Identify High Temperature-Induced Sterility in Nankoku, Japan

Faculty of Agriculture and Marine Science, Kochi University, Nankoku 783-8502, Japan
*
Author to whom correspondence should be addressed.
AgriEngineering 2025, 7(4), 122; https://doi.org/10.3390/agriengineering7040122
Submission received: 21 February 2025 / Revised: 12 April 2025 / Accepted: 14 April 2025 / Published: 15 April 2025

Abstract

:
High temperature-induced rice sterility has become a major issue in Japan; thus, the conditions influencing this sterility must be better understood to identify effective countermeasures. In this study, a random forest-based sterility estimation model was developed using the sterility rate measured via a field survey and satellite images. Applying this model to Nankoku, Japan, we attempted to map fields based on their sterility rates and visualize the spatial distribution of sterility. The results showed that the rate of change in reflectance from the heading stage until an effective accumulated temperature of 350 °C was reached was an effective model variable. Applying this model to map fields where rice sterility occurred from 2022 to 2024 revealed that more than 41% of the fields in Nankoku may have been damaged, suggesting that many fields might be at risk of adverse effects from high temperatures. The 3-year average sterility rate revealed areas with a high concentration of paddies with a low sterility rate, suggesting that investigating the environment and cultivation management techniques in these areas could provide insights to reduce the sterility rate. Moreover, the growth process up to the heading stage may contribute to the increase in the sterility rate. In the future, we plan to conduct a longitudinal survey based on the generated map to further investigate the relationships between cropping type, cultivar, and weather conditions to develop countermeasures.

1. Introduction

In Japan, the increase in high-temperature damage to rice paddies due to global warming is becoming a major problem. Sterility induced by high temperatures during the flowering stage has affected rice production in many parts of Japan [1]. The risk of sterility increases when the temperature exceeds 35 degrees during the flowering period [2]. The degree of sterility is quantified using the sterility rate, which is the ratio of the number of sterile grains to the total number of grains. The sterility rate observed in 2007—a high-temperature year—was higher than that observed in 2008—a normal year—and resulted in damage to Japanese rice paddies [3]. More recently, abnormally high temperatures have frequently occurred in the summer in Japan [4]. In 2018, when record-high temperatures were reached in many parts of the country from late July to early August, the heading of many paddies occurred during a period of high temperatures, and a rise in rice sterility was observed [1]. Interviews with farmers of Hataeda, Nankoku City, Kochi Prefecture, Japan, have suggested that sterility occurred at farmers’ paddies; however, it remains unclear where and to what extent sterility is occurring at the regional level.
Rice plants mostly self-pollinate. The anthers dehisce, and the pollen is dispersed before or immediately after the glumes open, and the pollen attaches to the stigma of the same flower [5]. The main cause of the sterility induced by high temperatures at the flowering stage is that high ear temperatures inhibit pollination, preventing the rice grains from ripening [2,6]. This pollination inhibition is due to non-dehisced anthers, poor pollen dispersal, poor pollen development, and the germination or growth failure of the pollen [2]. For example, it has been reported that the number of non-dehisced anthers increased by more than 20% under high-temperature conditions (39 °C) [7]. It has also been reported that, at a daytime air temperature of 37 °C, poor pollen dispersal due to poor anther dehiscence resulted in poor pollination [8]. Furthermore, high-temperature treatments (40 °C) resulted in poor elongation of pollen tubes after germination [9]. The occurrence of pollination inhibition at high ear temperatures is related not only to the air temperature but also to the solar radiation, humidity, and wind speed [8,10,11,12]. For example, Weerakoon et al. [11] reported that, at a daytime air temperature of 34 °C, the sterility rate increased by more than 0.14 when the relative humidity was 60% compared to when it was 85%. They indicated that this was because the high humidity increased the ear temperature. In addition, Yoshimoto et al. [13], using a simulation model of ear temperature, showed that the ear temperature was about 4 degrees higher than the air temperature when the air temperature was 35 degrees, the humidity was 70%, and the wind speed was less than 1 ms−1; furthermore, the ear temperature could be up to 7 degrees lower than the air temperature when the air temperature was 35 to 42 degrees, the humidity was 20 to 40%, and the wind speed was 2 to 4 ms−1. This indicates that the sterility mechanism may differ among cultivation sites as the effect on ear temperature differs depending on the weather conditions. Countermeasures against high temperature-induced sterility during the flowering stage include breeding heat-tolerant rice varieties, selecting a cropping type in which the flowering period does not overlap with the high-temperature period, and avoiding cultivation in high-risk regions. Pollination stabilization and early-morning flowering have been studied for breeding tolerant varieties [8,14]. For the latter, it is necessary to identify areas at high risk of high temperature-induced sterility and implement preventative measures in an integrated manner. Therefore, (1) the areas affected by and the extent of sterility must be evaluated, (2) appropriate countermeasures must be proposed, and (3) the effectiveness and limitations of such countermeasures must be evaluated [2]. These could potentially be used to feed back into policies for breeding tolerant varieties suited to the region. Yoshimoto et al. [1] found that the risk of high temperature-induced sterility increases when ear temperatures reach 33 °C or higher. Therefore, the authors proposed using the ear temperature at the heading stage as an indicator to evaluate the risk of sterility. This method can evaluate the risk independent of the weather conditions. This indicator facilitates the evaluation of the sterility risk through field surveys using thermal imaging cameras. However, field surveys covering large areas are labor-intensive. In regions such as Kochi Prefecture, where multiple cropping types are used, including cultivation that starts earlier than in other regions of Japan, field surveys are time-consuming and labor-intensive because the cultivation period is long. Therefore, to identify at-risk areas, a more efficient and less labor-intensive method that does not rely on field surveys is required.
Remote sensing, which is often used to estimate ground properties through the analysis of images captured using aerial platforms, can be effectively applied to regional rice surveys [15,16]. In particular, satellite images can cover an area of several to several hundreds of kilometers at a time and are therefore suitable for surveying large areas. When sterility occurs, the leaves do not wither, and they remain green as the nitrogen in the stems and leaves cannot be translocated to the ears during the ripening period. This suggests that the use of changes in leaf color, especially red reflectance, which is in the chlorophyll absorption zone, could be effective in identifying sterility [17]. Shimada et al. [18] reported that the normalized difference vegetation index (NDVI), which is calculated using red and near-infrared reflectance obtained from aerial images, can be used to identify sterile areas in paddy fields. In addition, Yawata et al. [19] developed a method for estimating rice yield under sterility occurrence using satellite remote sensing. In this method, green, red, and near-infrared wavelength bands were used, and the MAE calculated using field measurements was 42.3 gm−2. These reports suggested that remote sensing can be used to detect sterility, but these studies focused on sterility caused by cold damage. Tanaka et al. [20] demonstrated the feasibility of detecting poor rice ripening caused by high temperatures using a thermal infrared camera mounted on an unmanned aerial vehicle (UAV), while Yoshino et al. [21] used a portable spectrometer and multiple regression analysis, which revealed a significant correlation between the unripe grain percentage during the harvesting period and the spectral reflectance at five wavelengths (462.4, 464.6, 730.8, 735.2, and 737.4 nm) during the heading period. These studies on high temperature-induced damage focused on poor ripening and were conducted using UAVs or handheld cameras; few studies have focused on the use of satellite remote sensing technology to identify high temperature-induced sterility at a regional level.
The objectives of this study were to (1) develop an estimation method for high temperature-induced sterility rates based on satellite remote sensing images and (2) map the fields that may be sterile in Nankoku City, Kochi Prefecture, Japan, to visualize areas with a low or high risk of sterility. The sterility rates were measured in 2022 and 2023 using field surveys of rice paddies in Nankoku. Next, the sterility rate estimation variables were defined based on the changes in spectral reflectance. Subsequently, a machine learning model was constructed to estimate the sterility rates using the collected data. The model was used to estimate the sterility rates of rice paddies in Nankoku over three years. The characteristics of sterility occurrence and its impacts are discussed in the Discussion and Conclusions Sections.

2. Materials and Methods

Figure 1 illustrates the procedure used in this study. First, training data were collected to build a sterility rate estimation model. Second, candidates for the explanatory variables of the models were defined. Third, models were built based on machine learning and evaluated, and the model with the best performance was identified. Finally, fields in Nankoku City with a high potential for sterility were mapped by applying the selected model to satellite images of the city.

2.1. Study Site

2.1.1. Area for Sterility Rate Mapping

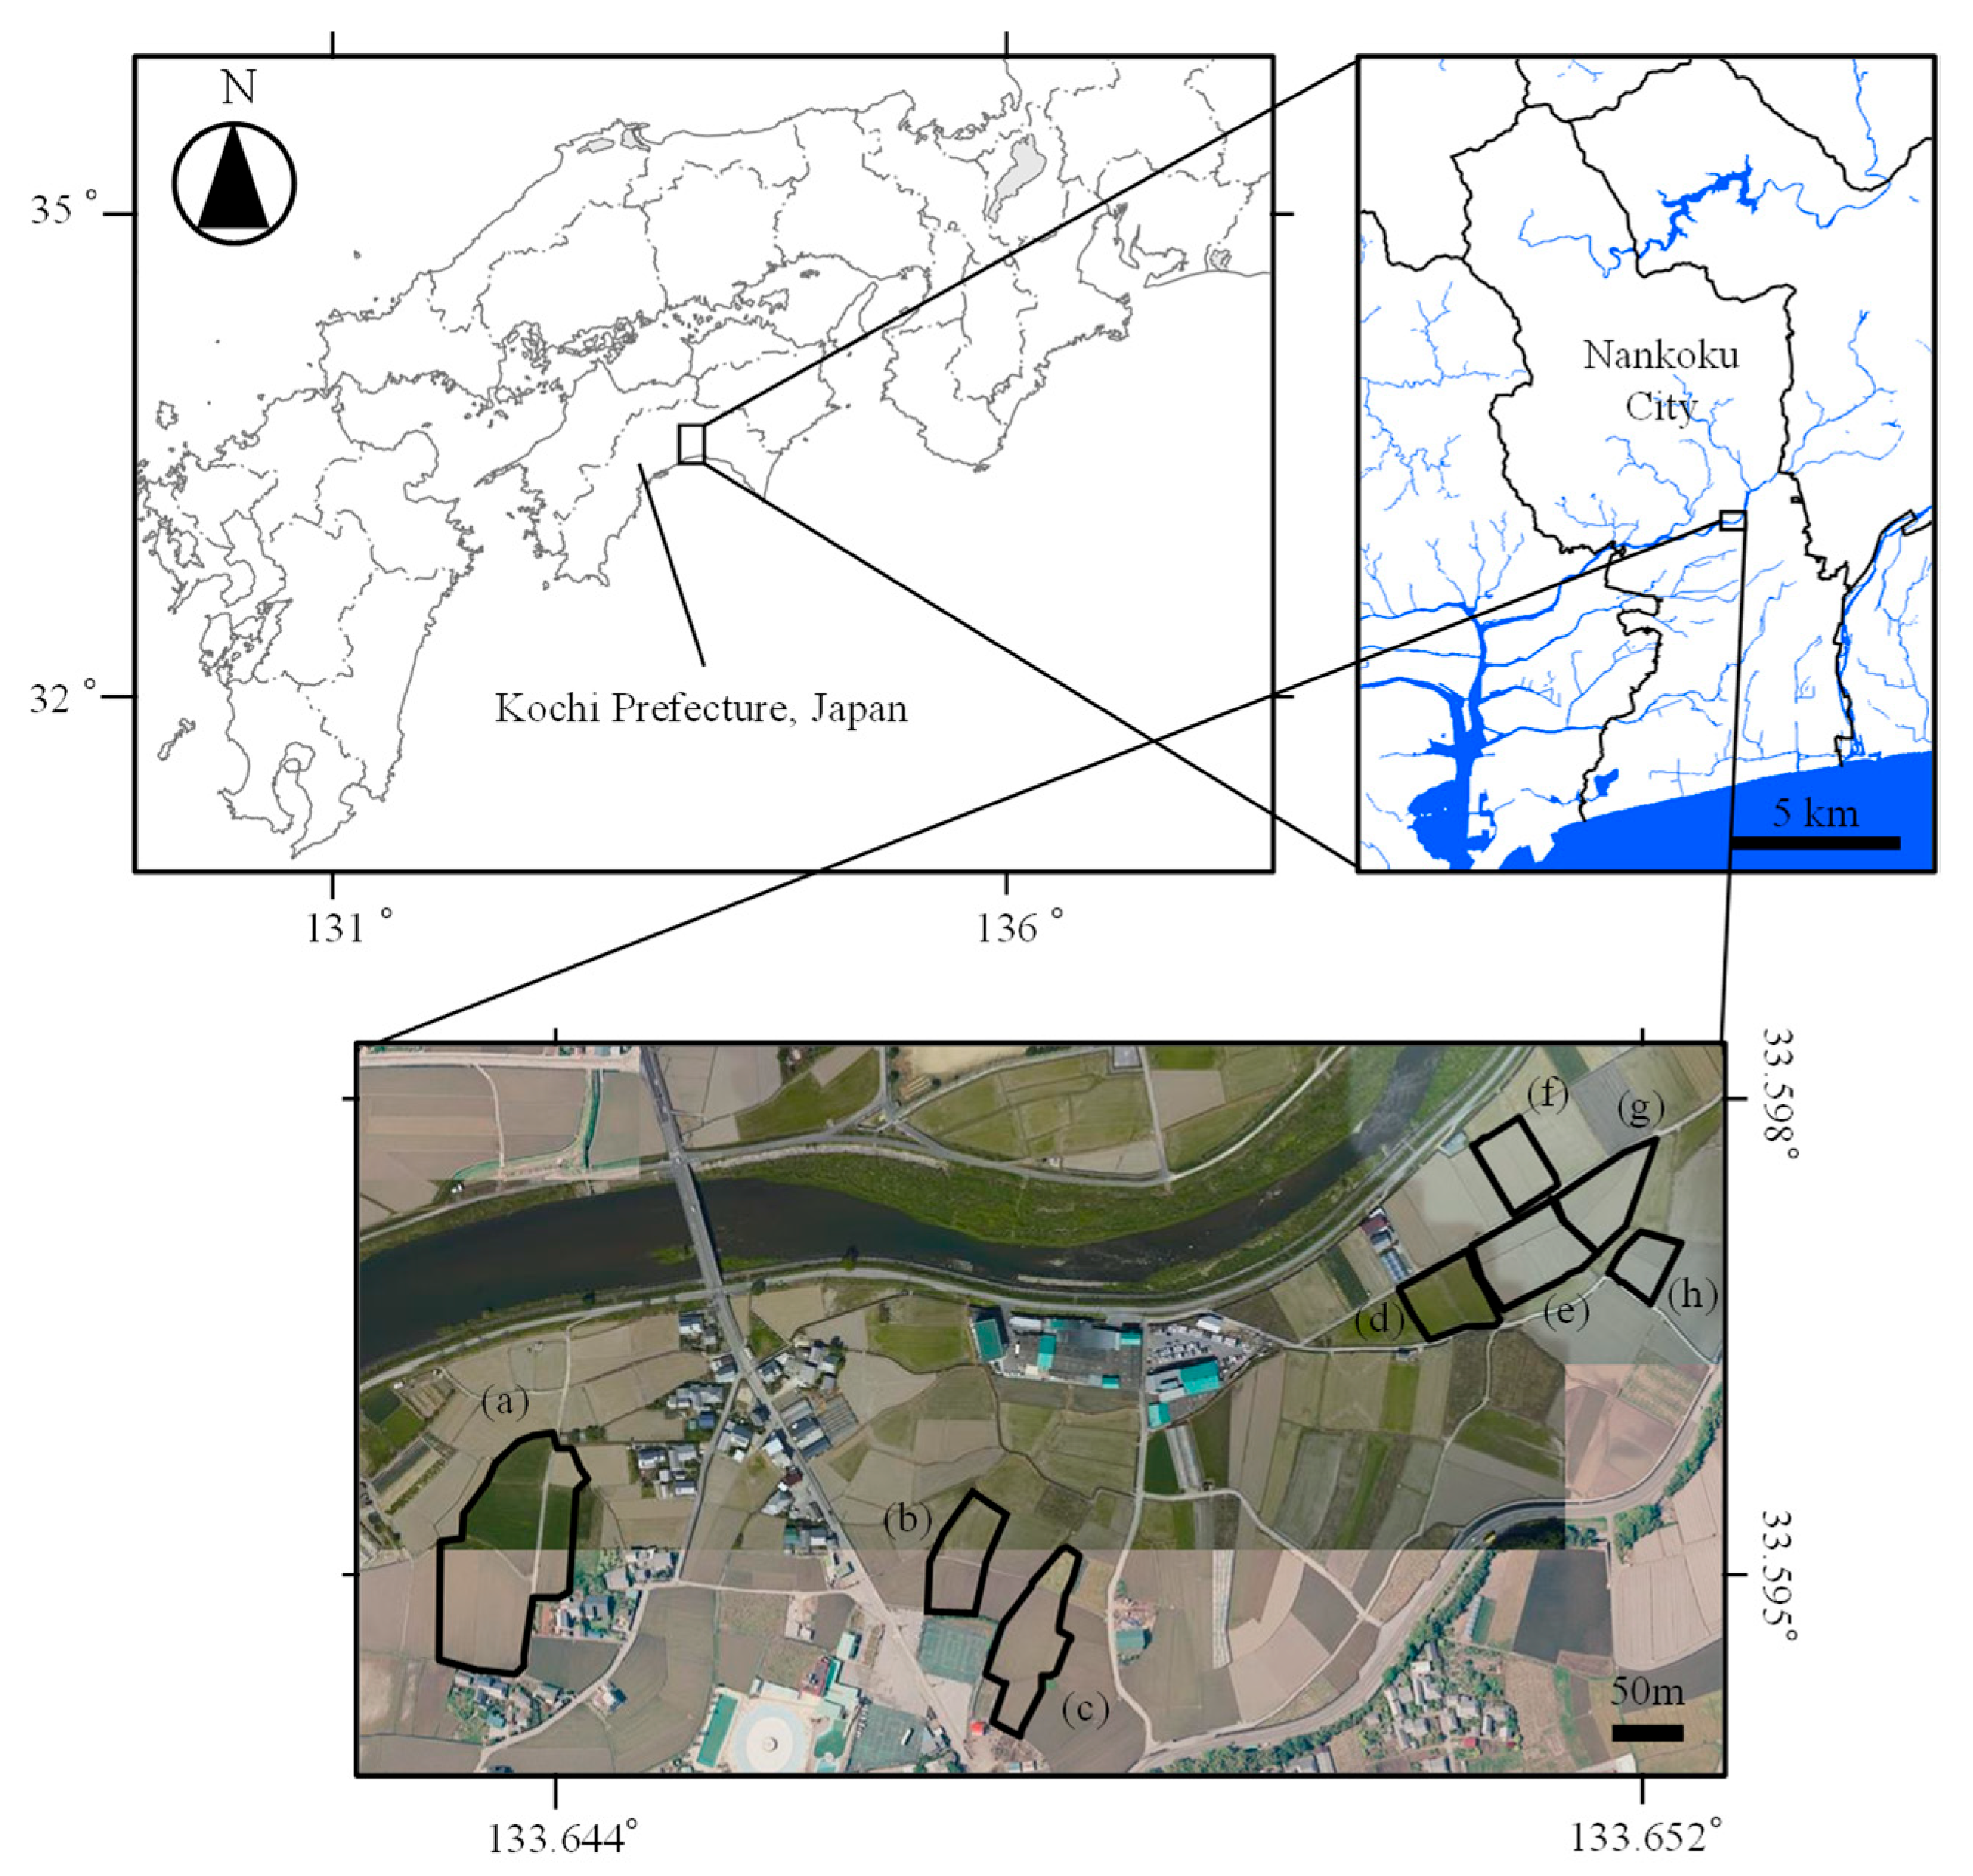
The target municipality for mapping paddy fields using sterility rates was Nankoku City (Figure 2). Nankoku City had the highest rice yield in Kochi Prefecture in 2023 [22]. In Kochi Prefecture, several cropping types (early- and normal-season cultivation) have been adopted, and varieties suitable for each cropping type have been cultivated. In early-season cultivation, rice is planted between late March and April, and the heading period typically occurs in June. For normal-season cultivation, rice is planted in May, and the heading period occurs between July and August [23].

2.1.2. Paddy Fields for Collecting Training Data

Fields with different cropping types and varieties were selected to collect training data on sterility rates (Figure 2). These fields had been cultivated and managed by a farmer in the area. Field surveys were conducted in 2022 and 2023. The cultivation history for each year is presented in Table 1. The planting density was 0.2 × 0.3 m for both years in all fields. A total of 108 test plots were set up in fields (a)–(e) in 2022, and 70 test plots were set up in fields (d)–(h) in 2023 at 6–15 m intervals. Each test plot was a circle with a diameter of 1 m and contained 17 plants. The central positions in the test plots were surveyed using a Drogger RWM.DC (BizStation, Matsumoto, Japan), which is a GNSS receiver with Centimeter-Level Augmentation Service (CLAS). Weeds and pests were controlled according to the farmer’s usual practices. Fungicides and insecticides were applied during the cultivation and transplanting of the seedlings.

2.1.3. Meteorological Conditions

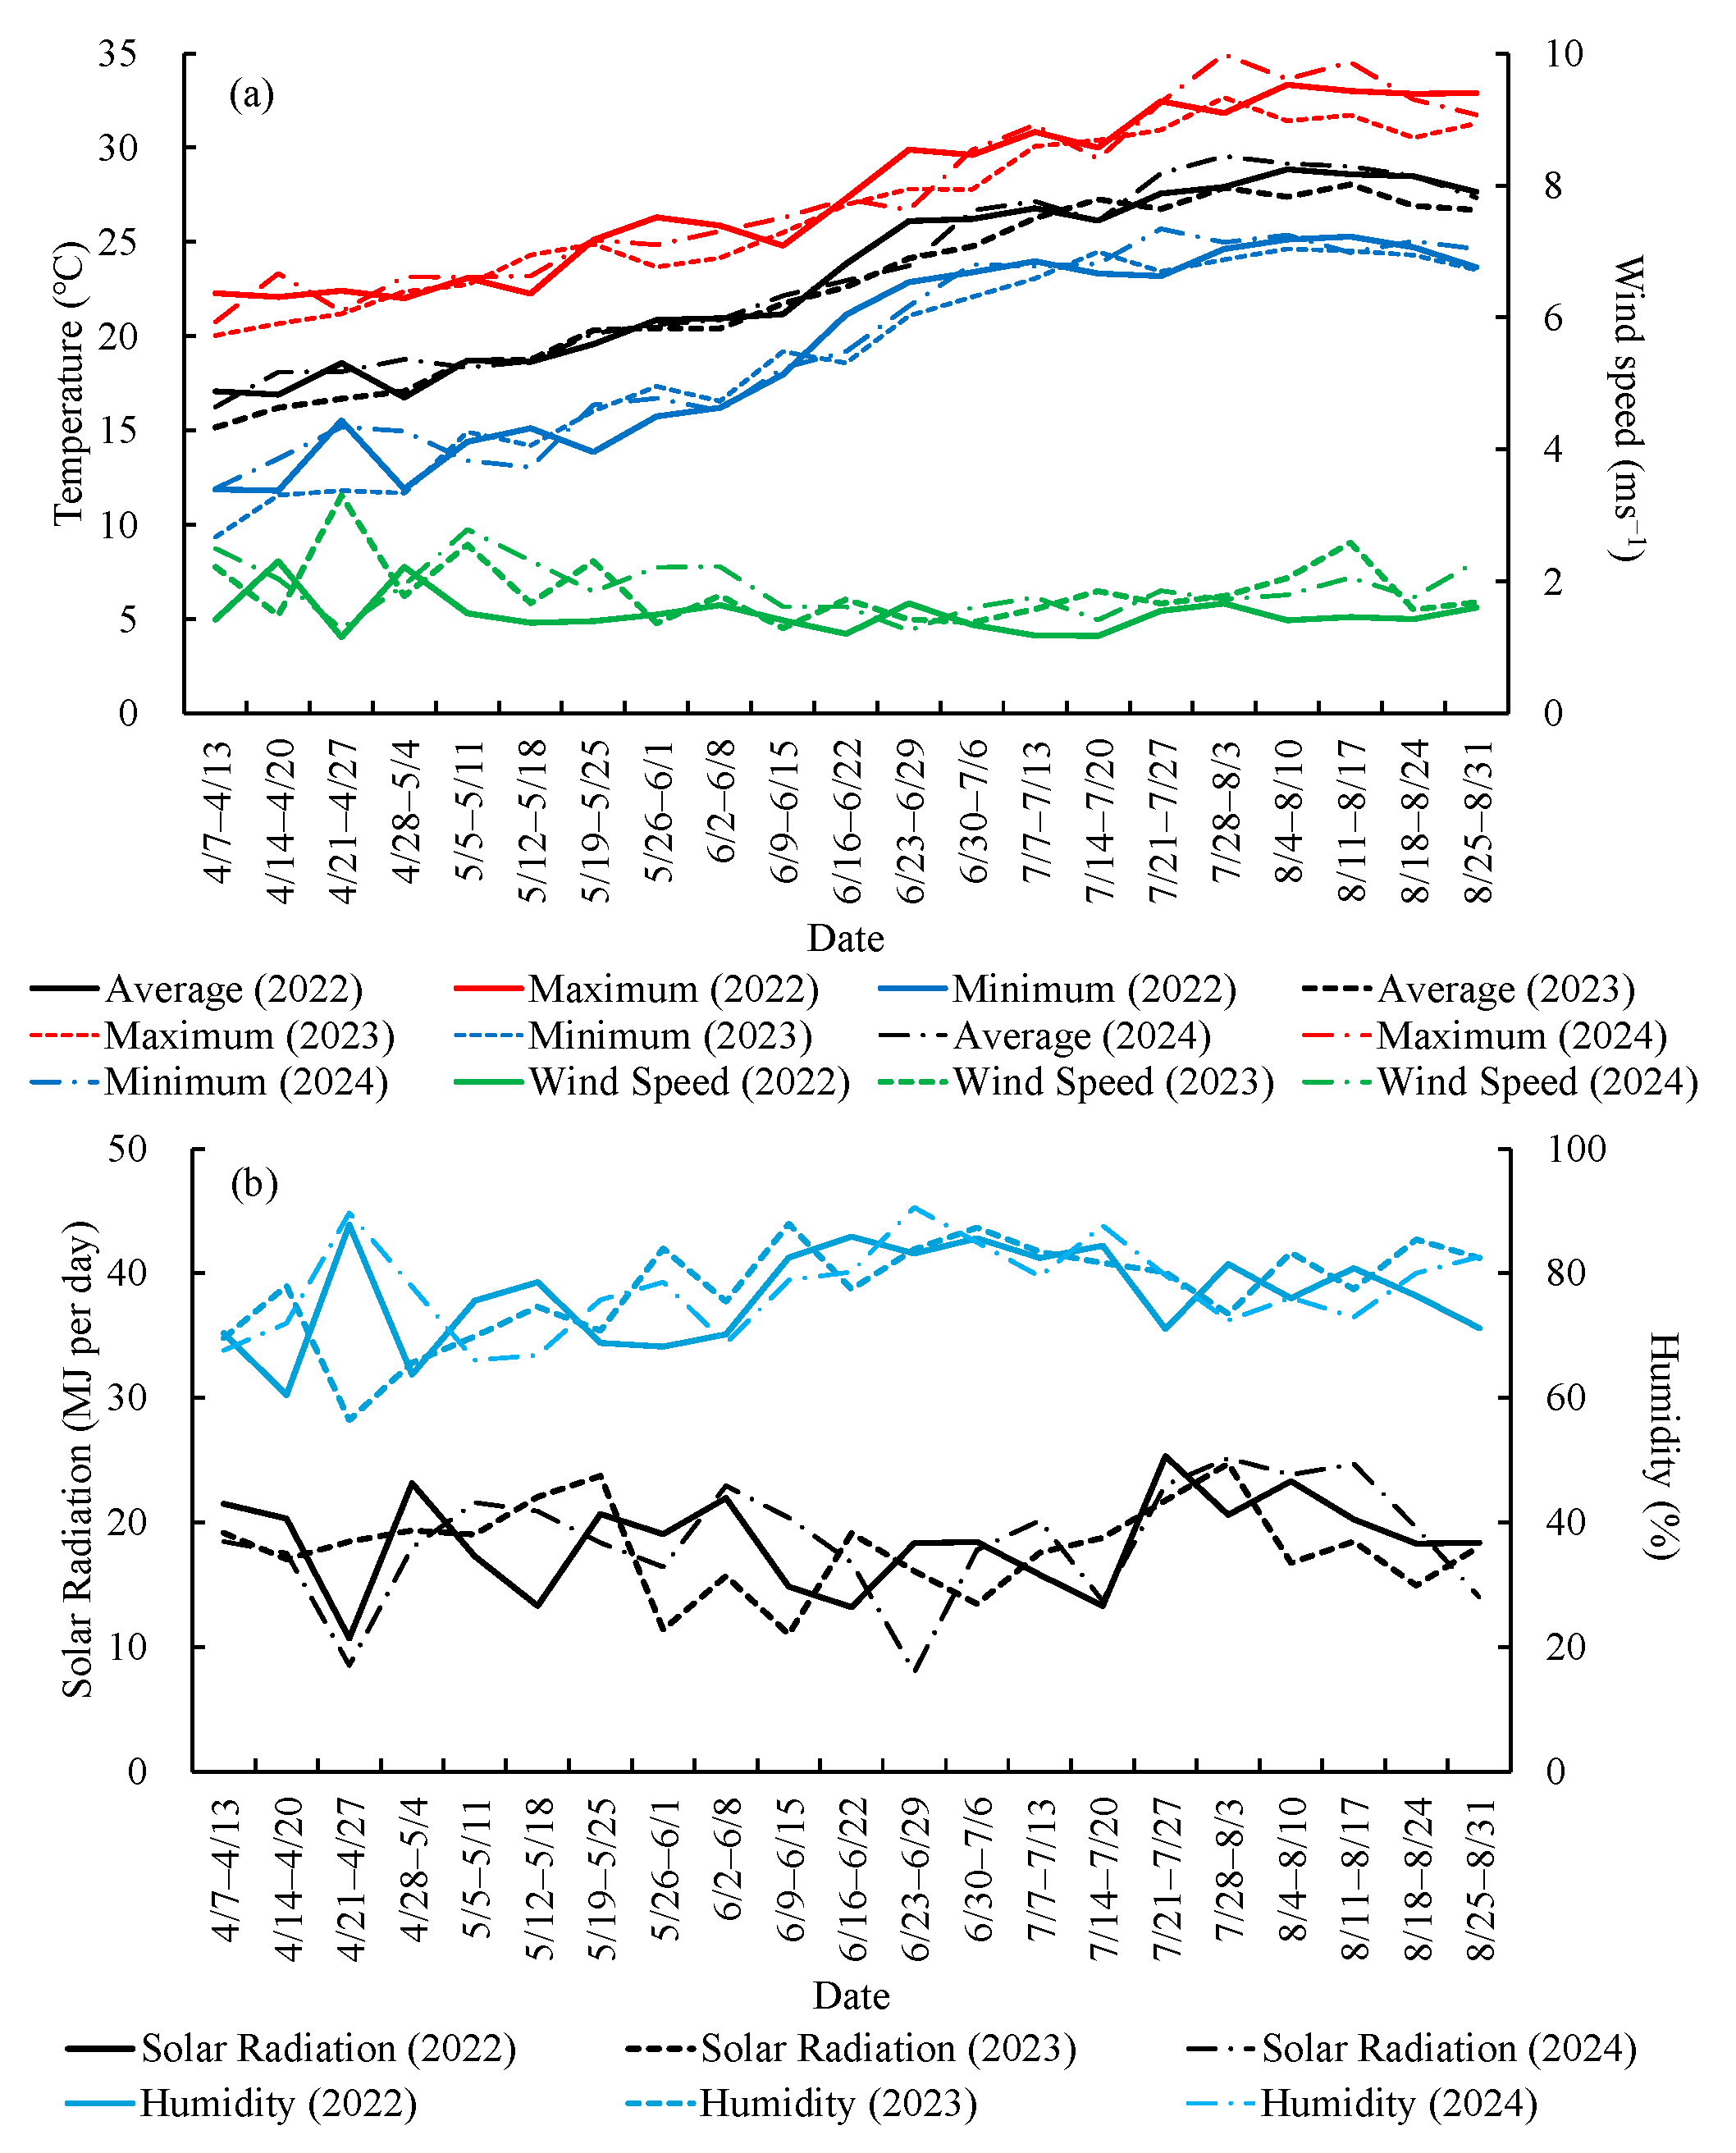
Figure 3 shows the meteorological data as five-day averages generated using the agrometeorological grid square data [24], including the daily mean temperature, daily maximum temperature, daily minimum temperature, daily mean wind speed, daily total solar radiation, and daily mean relative humidity from April to September from 2022 to 2024. In all years, the average wind speed was below 3 ms−1 for most of the period, and no strong winds (>10 m) [25] were observed that could have caused shattering losses of rice grains.

2.2. Field Survey of Sterility Rate

During the 2022 and 2023 harvest seasons, the aboveground portion of the paddy rice plants within the 1 m diameter circle in each test plot was harvested. After one week of natural drying, the grains were extracted and dried at 80 °C for 5 days in a ventilated dryer installed in a laboratory managed by Kochi University. The grains were then placed in water containing ethanol (specific gravity = 0.85). Floating and sunken grains were counted, and the former were defined as sterile grains [26]. The ratio of the number of sterile grains to the total number of grains was defined as the sterility rate (dimensionless quantity, range: 0 to 1) and used as an indicator of sterility.

2.3. Satellite Images

We used PlanetScope (Planet Labs, San Francisco, CA, USA) surface reflectance products for eight wavelength bands (coastal blue, 431–452 nm; blue, 465–515 nm; green, 513–549 nm; green, 547–583 nm; yellow, 600–620 nm; red, 650–680 nm; red edge, 697–713 nm; and NIR, 845–885 nm) [27]. The product was an atmospherically and geometrically corrected image with a pixel size of 3 m and a reflectance pixel value multiplied by 10,000, and 6 SV was used as the atmospheric correction algorithm [28].
Satellite images of days with low cloud cover from April to September from 2022 to 2024 were selected. The images covered the southern and central areas of Nankoku City, where almost all the rice paddies were located.
Figure 2. Paddy fields used for the field survey of sterility rate in this study. Fields (a)–(e) were used in 2022; fields (d)–(h) were used in 2023. The base map of this figure was obtained from GSI Maps [29].
Agriengineering 07 00122 g002
Figure 3. Meteorological conditions in 2022 to 2023: (a) temperature and wind speed; (b) solar radiation and relative humidity. The meteorological data were generated from the agrometeorological grid square data [24].
Agriengineering 07 00122 g003

2.4. Building of Sterility Rate Estimation Model

2.4.1. Definition of Explanatory Variables

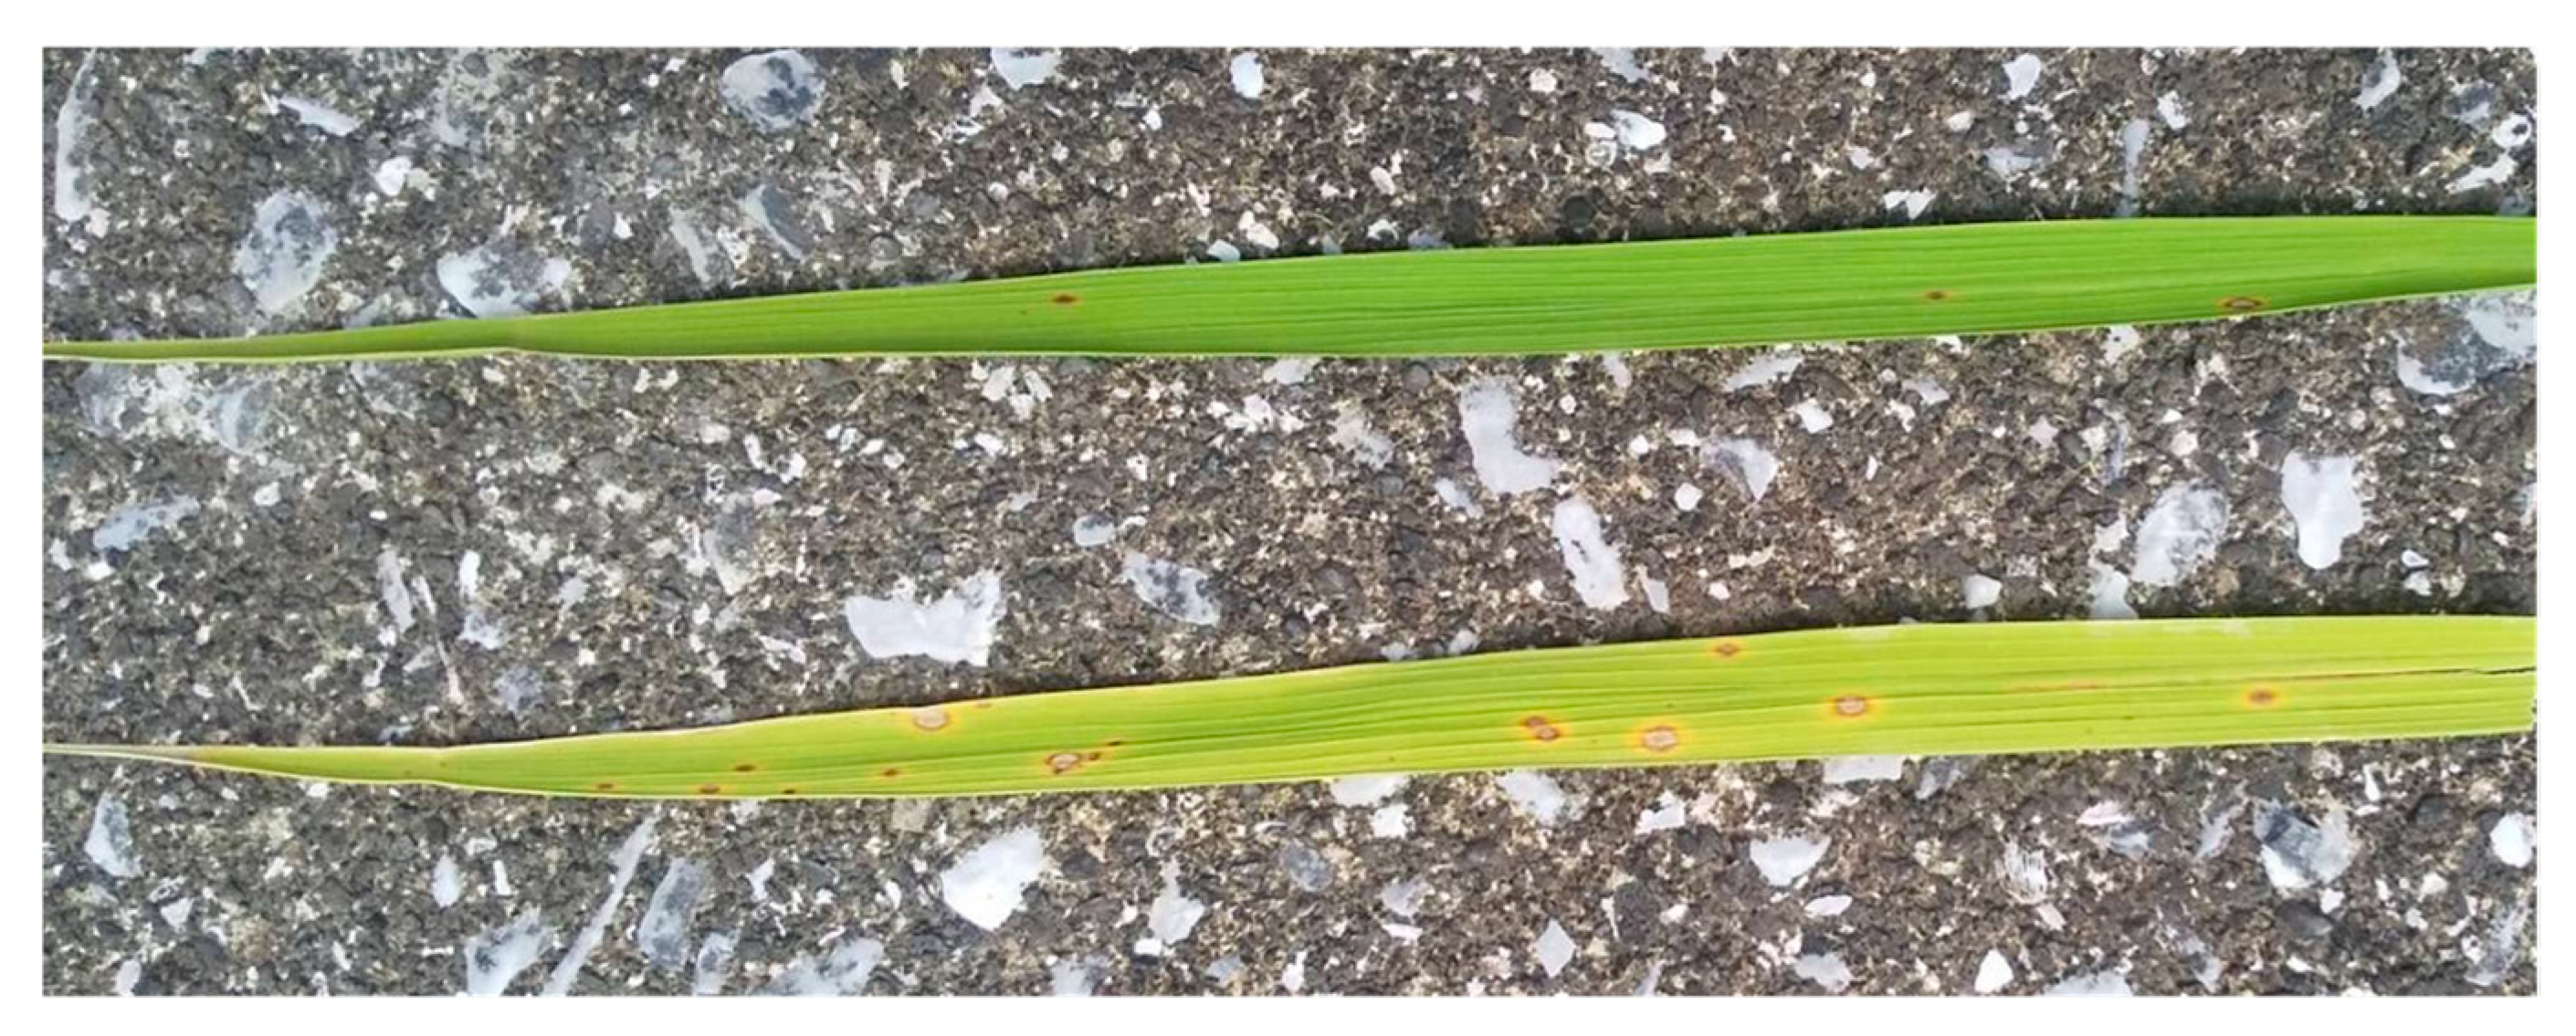
Normally, rice leaves turn yellow after the heading period due to grain maturation. However, when rice plants are sterile, the nitrogen accumulated in the leaves and stems does not translocate to the grains; therefore, the leaves remain green even after the heading stage [17] (Figure 4). This implies that the changes in leaf reflectance after the heading stage can be used to determine the sterility rate. However, as the resolution of the satellite images was 3 m, the reflectance of the pixels depended on the coverage of rice plants within the pixel. Thus, for sterility rate estimation using satellite images, we assumed that it would be more effective to use the rate of change in reflectance as the explanatory variable rather than the amount of change in reflectance to reduce the sensitivity to the coverage [30,31]. Therefore, Equation (1) was defined as an explanatory variable for estimating the sterility rate.
d R ( λ ) = R t ( λ ) R ( λ ) R ( λ )
where λ is a wavelength band of the satellite image; R(λ) is the reflectance of band λ at the heading stage; Rt (λ) is the reflectance of band λ at t °C (effective accumulated temperature (base temperature: 10 °C) since heading stage); and dR(λ) is the rate of change in reflectance. Because crop growth is often modeled as a function of accumulated temperature or effective accumulated temperature [32,33], this study also applied this as a variable to indicate the passage of time after the heading stage.
In general, leaf color can also change depending on the nitrogen status; therefore, the above indicators may include the effects of nitrogen deficiency [34]. In this study, it was assumed that there was no significant amount of nitrogen deficiency because the paddy fields used for collecting the training data were cultivated and managed by a farmer.

2.4.2. Creation of Sterility Rate Estimation Model

Although it was assumed that the rate of change in reflectance was effective for estimating the sterility rate, the most effective wavelength band and effective accumulated temperature were unclear. Therefore, we created estimation models for several accumulated temperatures using the rate of change in reflectance of all the wavelength bands and selected the one with the smallest estimation error. The procedure was as follows: For all the acquired satellite images, the pixel values corresponding to the location of each test plot were extracted. Natural spline interpolation, which allowed for the smooth interpolation of the given data [35], was performed on the time-series of reflectance data, thus generating reflectance data for each wavelength band up to an effective accumulated temperature of 500 °C, starting from the heading stage, in 50 °C increments. Using the generated reflectance data, the rate of change in reflectance for each effective accumulated temperature was calculated using Equation (1). For each effective accumulated temperature, a random forest model was trained to estimate the sterility rate, using the rate of change in reflectance as an explanatory variable. When creating the model, the data were randomly divided into training and validation data at a ratio of 9:1, and 10-fold cross-validation was applied to the training data to adjust the hyperparameters. The root mean square error (RMSE) was calculated for the validation data using Equation (2), and the best-performing model was selected. Random forest was used because it enables the construction of nonlinear models, suppresses overfitting, and interprets explanatory variables based on their importance. R software (ver. 4.3.2) was used for the aforementioned processing. The function “splinefun” was used for spline interpolation, and the package “caret” was used to run random forests, which applied a “tuneLength” of 7.
R M S E = 1 n i = 1 n S i S ^ i 2
where n, S, and S ^ are the total amount of data, the sterility rate obtained from the field survey, and the estimated sterility rate, respectively. The model with the lowest RMSE was selected for use in Section 2.5.

2.5. Mapping Paddy Fields in Nankoku Based on Estimated Sterility Rate

Farmland parcel data from Nankoku were obtained from the Ministry of Agriculture, Forestry, and Fisheries of Japan [36]. These data consisted of polygons that indicated the boundaries of each farmland parcel. The reflectance of each farmland parcel was obtained by averaging the pixel values of the satellite images located within 3 m of the polygon. A 3 m scale was used to exclude mixed pixels located near the boundaries of the parcel. Natural spline interpolation was applied to the time-series reflectance data obtained for each farmland parcel to generate the reflectance data for each effective accumulated temperature. Paddies for which reflectance data could not be obtained (i.e., paddies with an area too small to be reduced to 3 m and paddies under cloud cover) were excluded from the sterility rate estimation.
Nagata [37] reported that the NDVI increased from transplantation to the heading date, reaching its maximum around the heading date and then decreasing with ripening. The NDVI was calculated for each paddy field using the generated reflectance data, and the date of the maximum value was set as the heading date for that paddy field. The NDVI is described by Equation (3) [38]:
N D V I = N I R R E D N I R + R E D
where NIR and RED are the reflectance in the near-infrared and red wavelength bands, respectively. Because the minimum NDVI at the heading date in the study fields was 0.7, the fields with an NDVI of less than 0.7 from June to August were not considered paddy fields, and they were excluded from the sterility rate estimation model.
Based on the heading date obtained as described above, the rate of change in reflectance was calculated using Equation (1). The sterility rate of each field in Nankoku was estimated by inputting this rate into the sterility estimation model described in Section 2.4.2. The estimated sterility rates were assigned to farmland parcel data and visualized as a map using a geographic information system (GIS).

3. Results

3.1. Sterility Rate in Study Fields

Table 2 lists the sterility rates obtained from the field surveys. The later the heading date, the higher the sterility rate. In both 2022 and 2023, the average sterility rate was highest for Koshihikari cultivated during the normal season, which exceeded 0.3. The minimum and maximum sterility rates were 0.03 and 0.50, respectively.

3.2. Sterility Rate Estimation Model

By applying the satellite image selection criteria, nine scenes were acquired for 2022 (22 April; 8 May; 2 and 30 June; 26 July; 8, 13, and 30 August; and 7 September) and ten scenes for 2023 (16 April; 10 and 21 May; 16 June; 2, 22, and 29 July; 12 and 20 August; and 7 September). These satellite images were used to calculate the rate of change in reflectance in the test plots, and a sterility rate estimation model was developed using the procedure described in Section 2.4.2. The RMSE for the validation data was 0.05, which was lowest when using the rate of change in reflectance at an effective accumulated temperature of 350 °C. The importance of the explanatory variables in the model was 100, 61, 39, 36, 26, 5, 2, and 0 (range: 0–100) for the coastal blue, yellow, green I, green, near-infrared, blue, red, and red edge bands, respectively.

3.3. Estimation of Sterility Occurrence in Nankoku

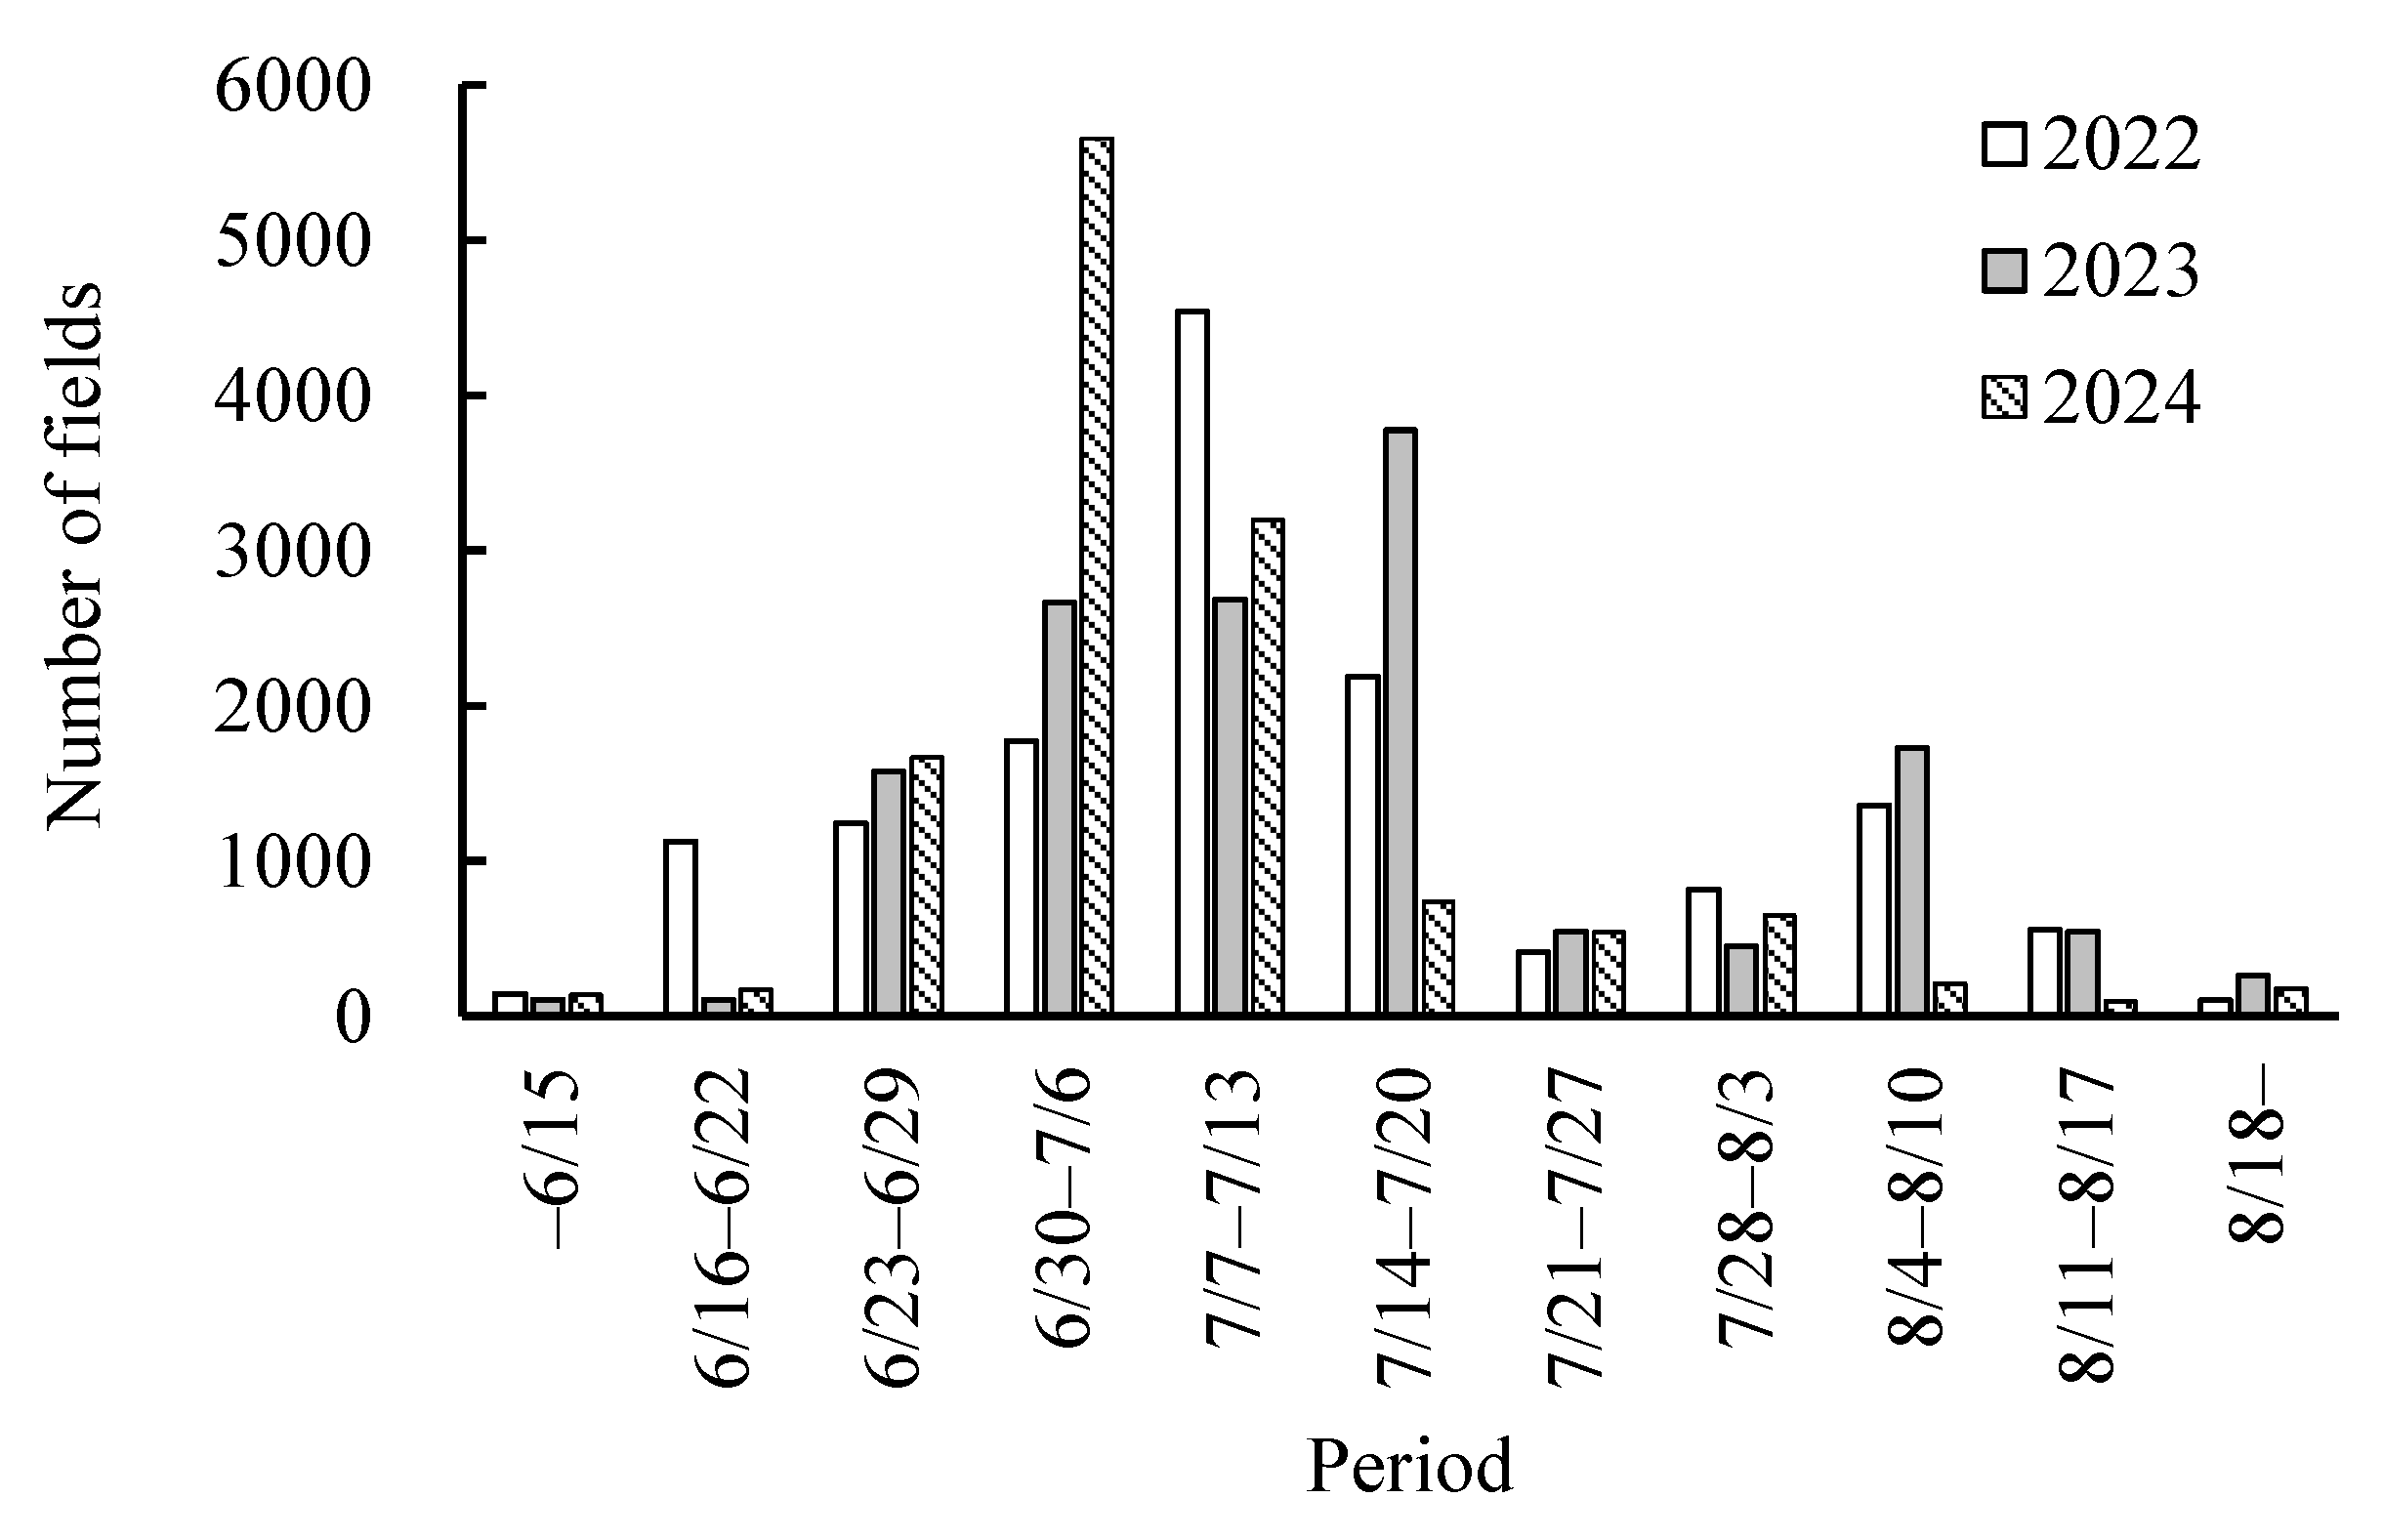
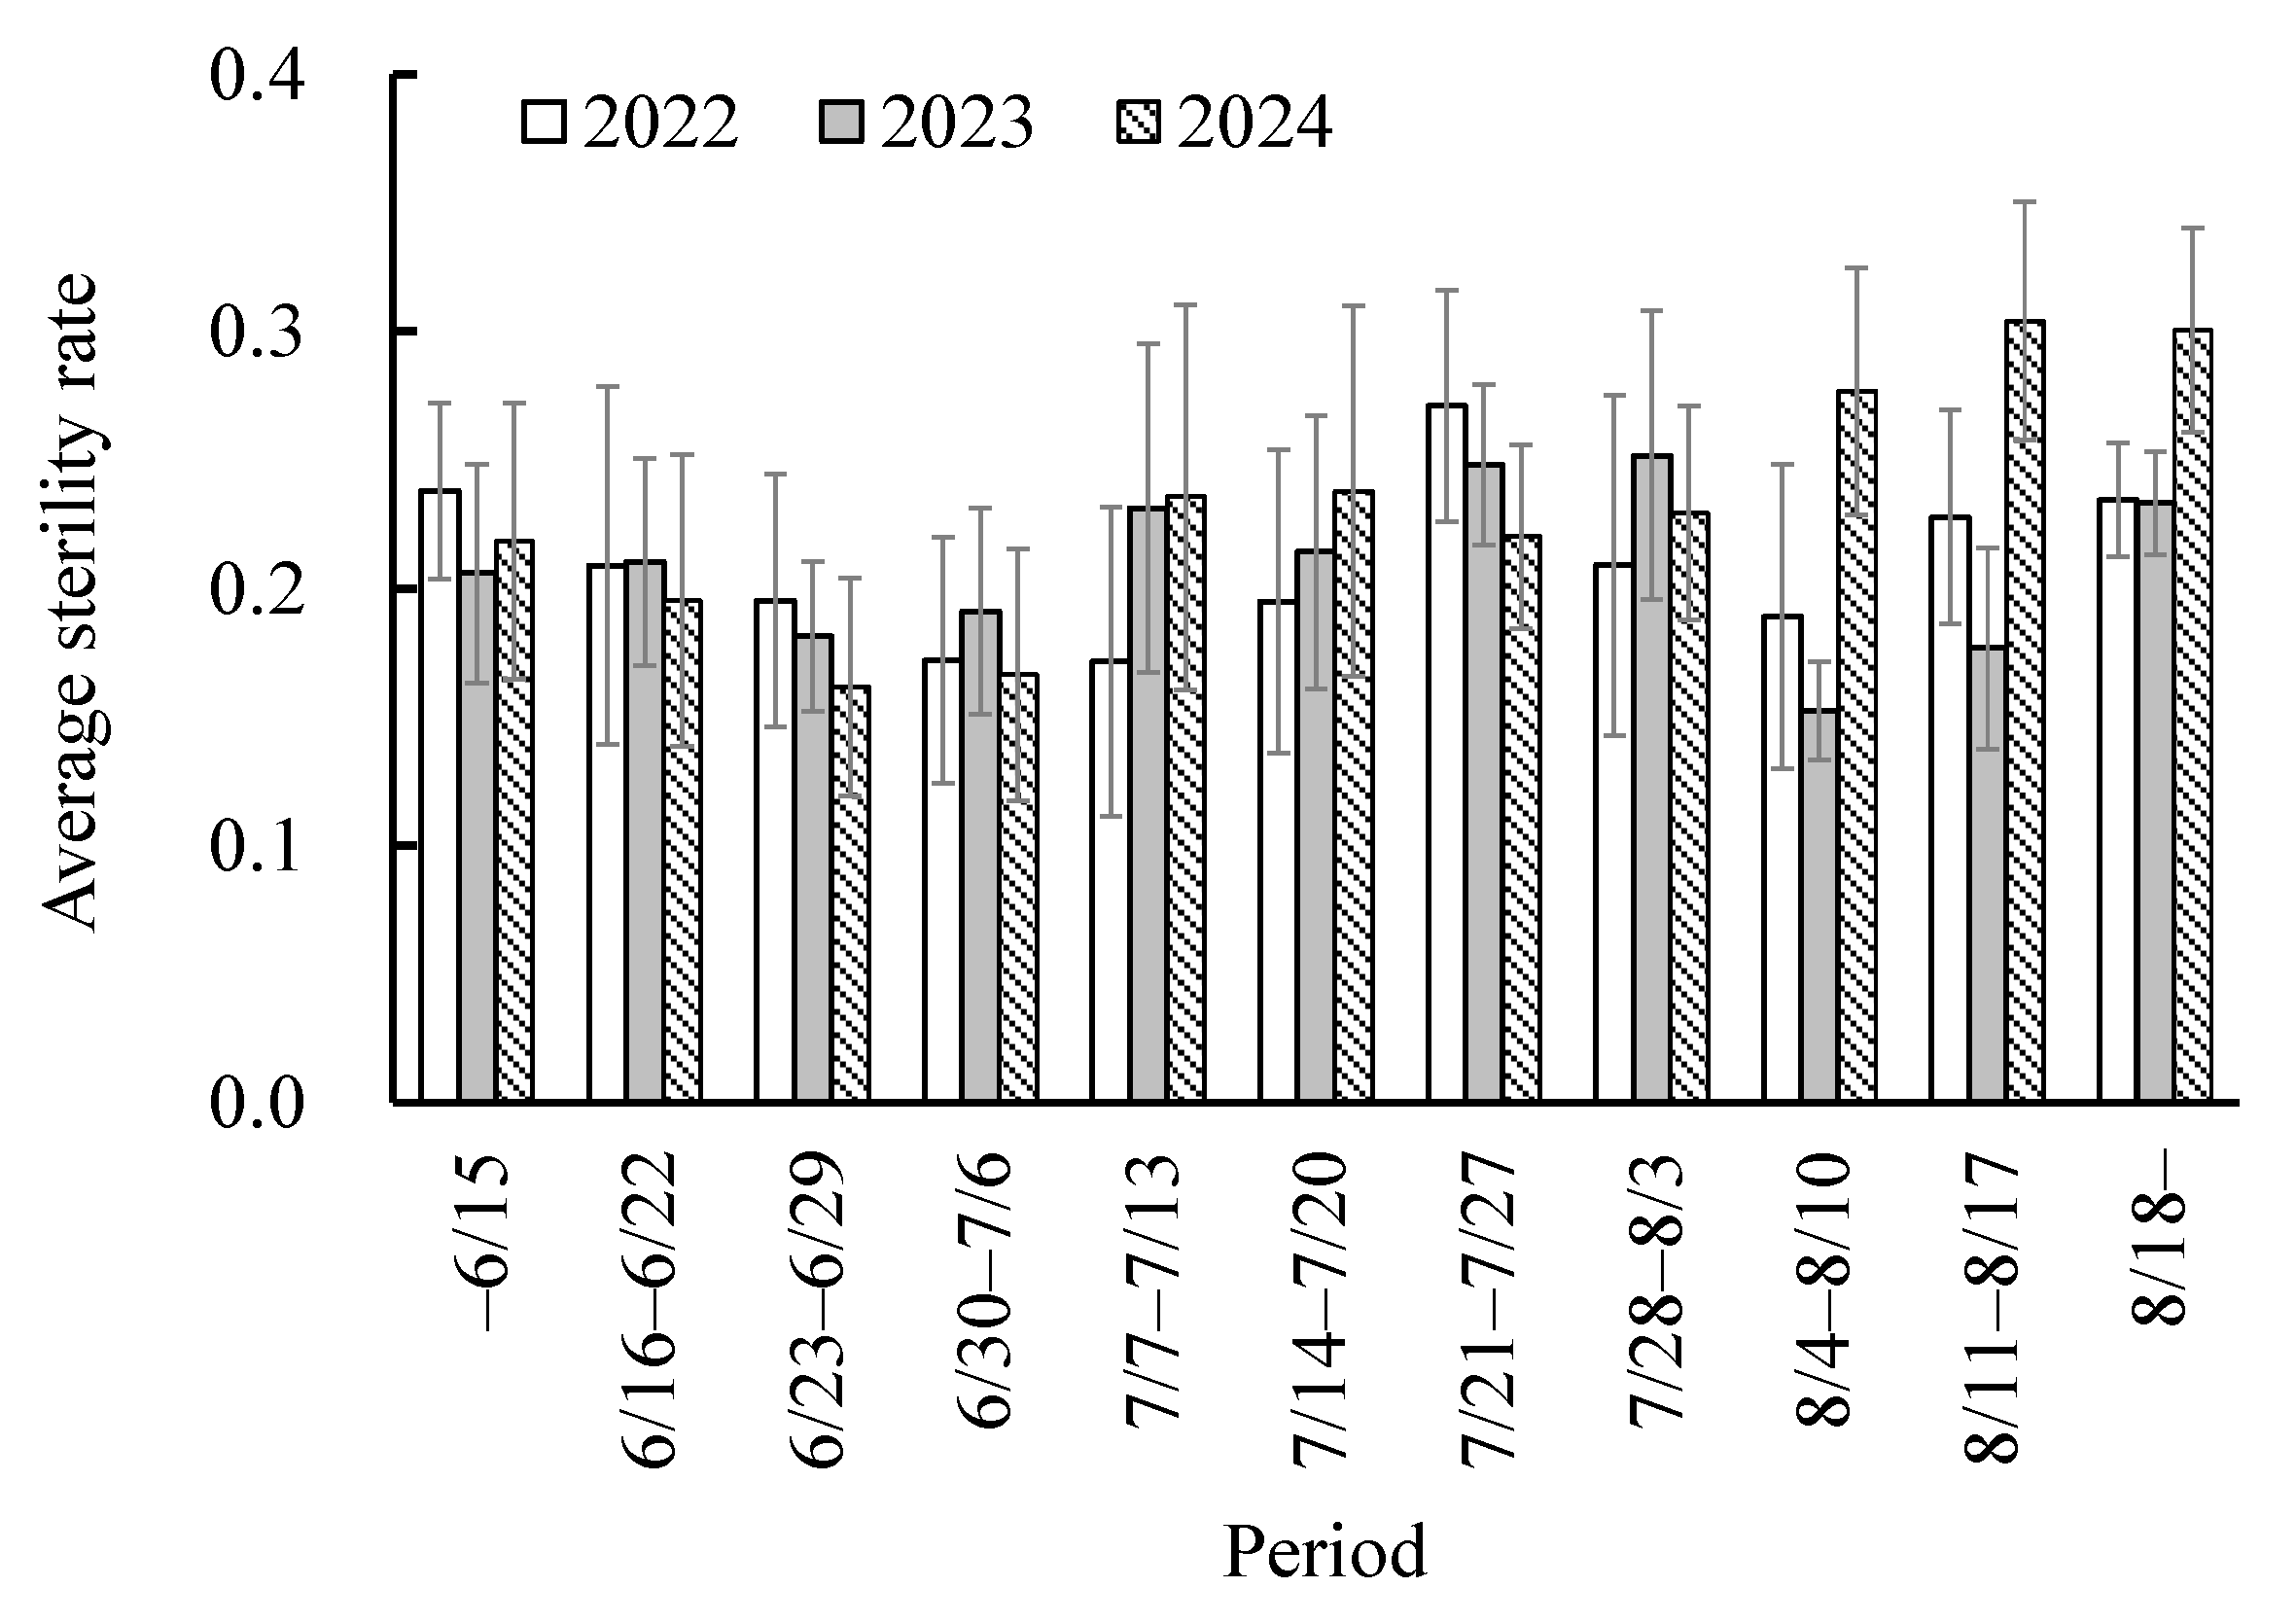
For 2022 and 2023, the scenes used in this section were the same as those used in Section 3.2, and nine scenes were acquired for 2024 (14 April; 9 and 25 May; 13 June; 5 and 21 July; 2 and 17 August; and 8 September). Using the procedure described in Section 2.5, 14,275, 14,485, and 13,255 fields were retained as target fields for estimating the sterility rate in 2022, 2023, and 2024, respectively. The heading dates estimated using the weekly NDVI are shown in Figure 5. The peak heading periods were 7–13 July and 4–10 August in 2022; 14–20 July and 4–10 August in 2023; and 30 June–6 July in 2024. For the cultivars in the test fields (Table 1), the mean error (bias) and mean absolute error for the heading date estimated using the NDVI were −1 and 3 days, respectively. The mean sterility rates for each period are shown in Figure 6. The sterility rate tended to be high in fields with heading dates in mid-June, late July to early August, and mid-August. In 2022, the highest sterility level was observed in fields where the heading date was between 21 and 27 July. In 2023, the highest sterility level was observed in fields where the heading date was between 28 July and 3 August; in 2024, the highest sterility rate was observed in fields where the heading date was after 11 August. In 2022 and 2024, the standard deviations tended to be larger than those in 2023. The mean sterility rate and standard deviation in 2022, 2023, and 2024 were 0.19 ± 0.062, 0.20 ± 0.054, and 0.20 ± 0.066, respectively.
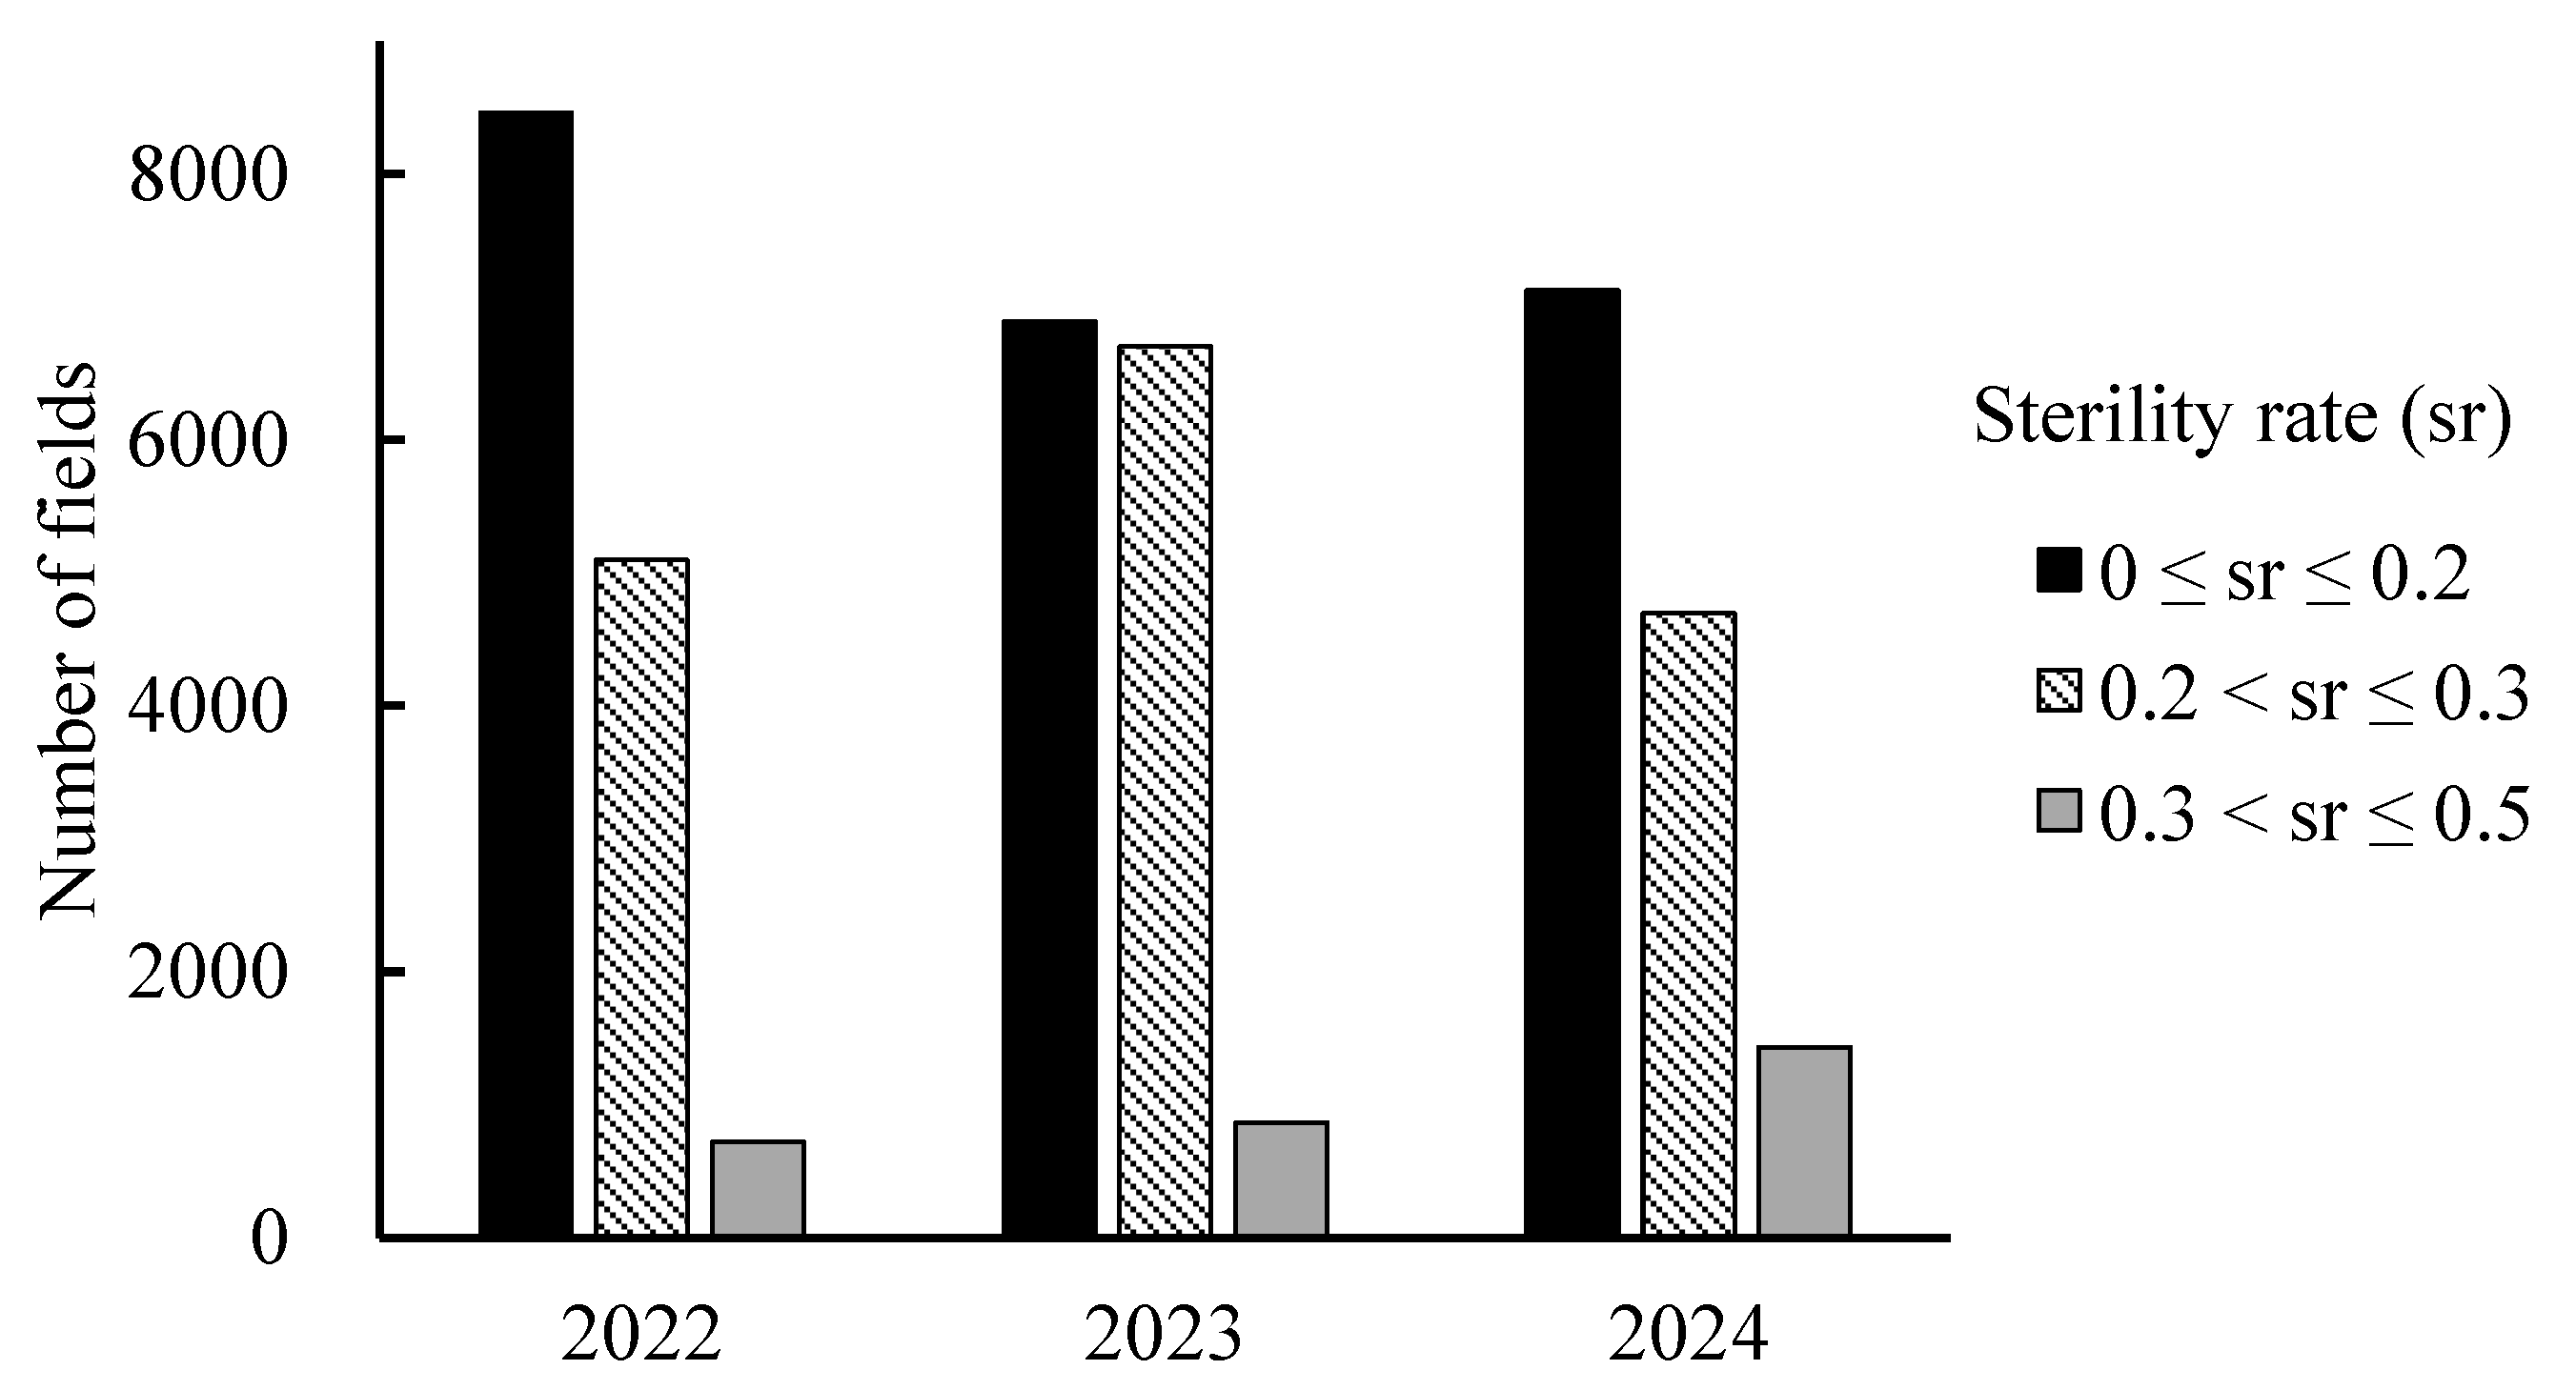
Figure 7 shows the results of color coding the fields based on the estimated sterility rate. Figure 8 shows the number of fields in each sterility class for the three years. In 2022, the fields with high sterility rates (>0.2) were distributed throughout the city in all areas, including hilly, residential, and agricultural areas (Figure 7a). They were most common in the areas located east and north of the residential area, and there were relatively few fields with high rates in agricultural areas located north of the center of the coastal area. In 2023, the fields with a high rate (>0.2) were widespread in the entire region compared to 2022 (Figure 7b). This increase was particularly marked in areas immediately east and south of the residential area. The number of fields with sterility rates exceeding 0.3 (red) also increased compared with that in 2022 (Figure 8). In 2024, the number of fields with a high sterility rate (>0.2) decreased compared to 2023; however, the percentage of fields with a sterility rate exceeding 0.3 increased (Figure 7c and Figure 8). These fields were most common in the areas immediately north and east/southeast of the residential area and south of the airport. Figure 7d shows a map of the 3-year average sterility rate for the fields. The map was color-coded into five levels: the fields with the lowest 3-year sterility rate (blue) were mostly located north of the central coastal area, and the fields with the next lowest rate (light green) were mostly located in the northwest, which was surrounded by hilly areas and located in the agricultural area at the top of the figure. Paddy fields with a large variation in 3-year average sterility rates were found in areas located just north and east of the residential area.
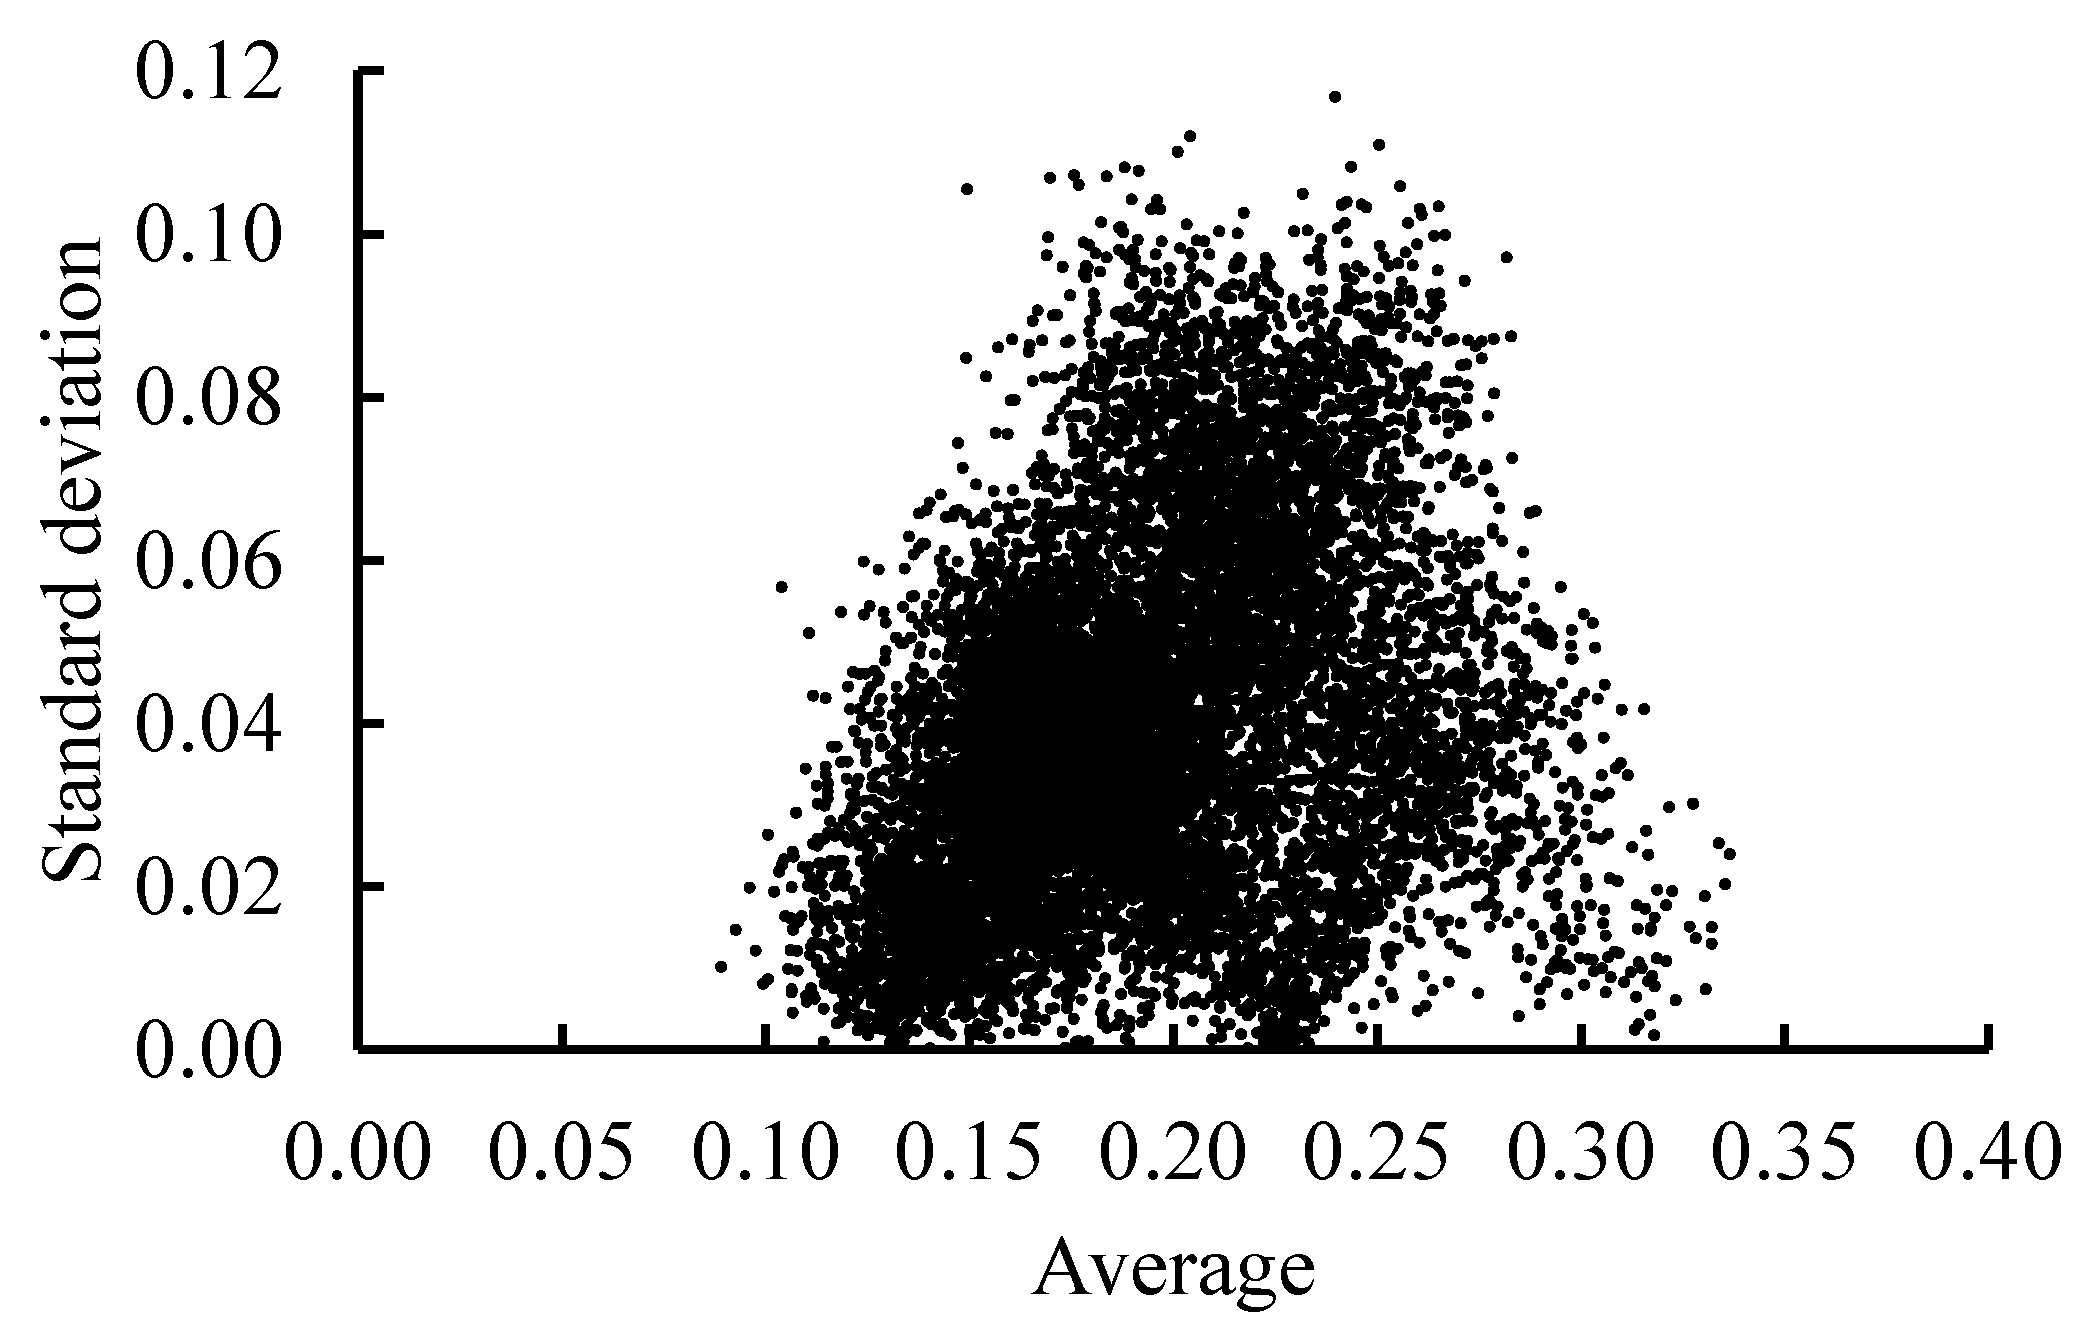
Figure 9 shows the relationship between the average and standard deviation of the estimated sterility rate over the three years. For an average sterility rate of 0.20 or less, a trend of smaller standard deviations for lower sterility rates was observed (R = 0.43), whereas for average sterility rates of 0.25 or more, a trend of smaller standard deviations for higher sterility rates was observed (R = 0.40).

4. Discussion

4.1. Occurrence of Rice Sterility in the Study Site

Yoshimoto et al. [1] found that the risk of sterility increases when the ear temperature is 33 °C or higher. The ear temperature could be 4 °C higher than the air temperature under high temperature and humidity and low wind-speed conditions [13]. Thus, considering the weather conditions (Figure 3), the study sites might have been at risk of sterility after 7 July in both years when the maximum air temperature was over 30 °C. The ear temperatures of five plots were measured in fields (e) and (g) (Figure 2) using a FLIR C5 thermal imaging camera (TELEDYNE FLIR, USA; temperature range: −20 to 400 °C; accuracy: ±3 °C or ±3%) on 25 July 2023, and the average was 35.8 °C.
As the farmer’s harvest plan was changed due to bad weather conditions, the harvest in this study was conducted approximately 100 °C (approximately 4 days) earlier than the optimum accumulated temperature for harvesting. This may have resulted in a higher sterility rate than the original rate as some grains were immature. Estimates of the relationship between the accumulated temperature and ripening rate based on previous reports [39,40] suggest that the sterility rate could have been 0.1 higher than the original value. Additionally, Saida et al. [41] reported sterility rates of approximately 0.1 in Nangokusodachi and Koshihikari plants grown in Kochi Prefecture, which were not subjected to high temperatures. Thus, in this study, paddy fields with an estimated sterility rate of more than 0.2 were defined as damaged by high temperatures. Based on this threshold, Koshihikari fields cultivated during the normal season were judged to be damaged (Table 2).
As shown in Table 1, the type and amount of fertilizer differed depending on the year and field. Therefore, it was possible that fertilization had some effect on the sterility rate in each field. However, the amount of fertilizer was determined based on the farmer’s experience, with the aim of avoiding insufficient fertilization and, in this study, it was assumed that the effect of fertilizer on the sterility rate was small. In the future, by collecting more data, an analysis of the effects of fertilizers could be carried out.

4.2. Evaluation of the Sterility Rate Estimation Model

The sterility rate estimation model was based on the rate of change in reflectance at an accumulated temperature of 350 °C (starting from the heading date) as the explanatory variable. Kikkawa and Shibata [42] reported that the period affecting the quality of the mature crop is up to 20 days after the heading date; therefore, 350 °C, which occurred approximately 20 days after the heading date, was appropriate for the model. The importance of the explanatory variables indicated that the data for the coastal blue and yellow bands could be used to estimate sterility rates. Yoshino et al. [21] reported that the blue band could predict high temperature-induced injury. The coastal blue band, which has a shorter wavelength than the blue band, is less sensitive to moisture absorption and is thus able to stably detect changes in leaf color. Normally, the magnitude and balance of the green and red reflectance change as the leaves become yellow after reaching maturity. Yellow light was selected because this wavelength band can reflect these changes. The RMSE of the model was 0.05, which was considered sufficiently accurate in visualizing inter-field differences in sterility rates, given that the within-field variation in sterility rate had a standard deviation of 0.03 to 0.08. Additionally, because the model was trained using data with sterility rates of 0.03 to 0.50, the model can be applied to a wide range of sterility rates. Since the sterility rate is an index calculated from the number of grains, future research could improve the estimation accuracy of the sterility rate by examining the spectrum that is correlated with the number of grains and modifying the model to take this into account. To estimate the sterility rate more accurately, future research could also consider using different machine learning algorithms or deep learning.

4.3. Estimation of Heading Dates

A bias of −1 day in the heading date estimation for the cultivars in the test fields (Table 1) indicated that there was almost no bias in the heading date estimation using the NDVI. Two peaks were observed in mid-July and early August in 2022 and 2023 (Figure 5). Two cropping types, early- and normal-season cultivation, are practiced in Nankoku, and the peaks corresponded to the heading dates of each cropping type. The peak for the early-season cultivation fields appeared between 7 and 13 July in 2022, which was earlier than that in 2023, probably because of the earlier growth caused by the higher temperatures in April and mid-June to mid-July (Figure 3). In contrast, the peak for the normal-season cultivation fields occurred between 4 and 10 August in both years. This may have been because the average daily temperature during the growing season was higher than that for the early-season cultivation, and the difference in the number of days corresponding to the temperature difference was smaller than that of early-season cultivation. In 2024, the heading timing was advanced across all the paddy fields, leading to only one peak being observed between 30 June and 6 July. Paddies under early-season cultivation may have emerged earlier than in other years because of the higher solar radiation in the period up to late June [43]. In addition, paddies under normal-season cultivation may have been introduced because of the high temperatures after July. These results indicate that the method used in this study, although simple, is useful for heading date estimation in areas with multiple cropping types and long growing seasons, such as in Kochi Prefecture.

4.4. Mapping Paddy Fields Using Estimated Sterility

According to the criteria defined in Section 4.1, sterility occurred before 15 June, from 21 to 27 July, and after 11 August in 2022; from 7 July to 3 August and after 18 August in 2023; and after 7 July in 2024. The period of 21–27 July in 2022 had higher maximum temperatures and higher solar radiation compared to earlier periods, which may have resulted in higher ear temperatures and sterility rates [2]. The periods from 28 July to 3 August in 2023 and after 21 July in 2024 may have also had increased sterility rates for the same reason. Focusing on the periods after 11 August in 2022 and 2023, the sterility rate after 18 August was similar in both years, whereas the sterility rate was lower in 2023 for the period of 11–17 August. The temperature and solar radiation during this period did not differ significantly between the two years, and the wind speed may have contributed to the lower sterility rate in 2023 [13]. These results suggest that multiple weather factors are associated with the occurrence and extent of high temperature-induced sterility in Nankoku City rice paddies. During the period of 7–13 July, there was little difference in the weather conditions between the years, although sterility was higher in 2023 and 2024 than in 2022. As ear emergence was delayed by a week in 2023 and accelerated by a week in 2024 compared to that in 2022 (Figure 5), the weather conditions and growth process up to the heading date might have affected the plants’ susceptibility to sterility. Moreover, the strength of this effect may differ between cultivars [41]. Further research is needed to determine the effect of the relationship between the growth process up to the heading stage and weather conditions on the sterility rate for each cropping type.
The rice that emerged before 15 June 2022, may have experienced a larger temperature increase afterward, resulting in an increase in the number of rice grains judged to be sterile due to poor maturity caused by the high temperatures [44,45] rather than sterility caused by high temperatures during the flowering stage. This is because the method of determining sterile rice in this study (Section 2.2) identified rice with significantly poor ripening as sterile rice. Therefore, it should be noted that the estimated sterility rate may include the effect of high temperature not only at the flowering stage but also at the maturing stage.
Using a threshold of 0.2 for sterility, 5813, 7571, and 6129 fields were estimated to be damaged (41%, 52%, and 46% of the studied fields) in 2022, 2023, and 2024, respectively. These results suggest that damage may have occurred in many fields even if the severity varied. Figure 7a–c show that sterility can occur regardless of location. Since there were cases where rice paddies with low and high sterility rates were adjacent to each other, it is possible that differences in the cultivar and cultivation management methods and environmental factors may have affected the severity of the sterility. Figure 7d and Figure 9 show that every year, there were rice paddies with high and low sterility rates. Rice paddies with low 3-year average rates were particularly common in the southern central area and other agricultural areas with a high concentration of rice paddies. This may be due to the ease of cultivation management. Rice paddies located close to residential areas may be difficult to manage because there is poor access between them. The method of estimating the sterility rate in this study assumed that leaf color did not change due to nitrogen deficiency in the paddy fields (Section 2.4.1). Therefore, if the cultivation management in the paddy fields in the validation data was lower than that of the fields in the training data, the estimated sterility rate might have been affected by changes in leaf color due to nitrogen deficiency. As mentioned above, the growth processes up to the heading stage may affect the susceptibility to sterility. Therefore, by conducting interviews on the cultivation management methods used in these rice paddies and removing fields with low management levels, additional insights for decreasing the sterility rate may be obtained. In future research, we will conduct a yield survey for rice paddies with a high 3-year average rate and a survey of the microclimate to clarify the factors behind high sterility rates.

5. Conclusions

To understand the occurrence of sterility due to high temperatures at the rice flowering stage in Kochi Prefecture, Japan, a sterility rate estimation model (RMSE = 0.05) was developed using the random forest algorithm. The results of applying the model to satellite images from 2022 to 2024 showed that the average sterility rate in Nankoku was approximately 0.20. The estimated sterility rates were generally consistent with the weather conditions in both years. If a sterility rate of 0.2 or higher was defined as a damaged field, then more than 41% of the fields in Nankoku would be considered damaged, suggesting that many fields may be at risk of high temperature-induced sterility. Paddy field maps based on the estimated sterility showed fields with low or high sterility every year, suggesting the existence of areas with low and high risk of sterility. The relationship between sterility rate and heading period suggests the need for a detailed study of a time-series of the changes in weather and crop growth up to the heading date. In future research, a longitudinal survey will be conducted to clarify the actual occurrence of high temperature-induced sterility in Kochi Prefecture and develop appropriate countermeasures.

Author Contributions

Conceptualization: N.H.; data curation, N.H.; formal analysis, N.H.; investigation, S.M. and H.Y.; methodology, N.H. and S.M.; project administration, N.H.; resources, N.H.; software, N.H.; supervision, N.H.; validation, S.M., N.H. and H.Y.; visualization, S.M. and N.H.; writing—original draft, S.M. and N.H.; writing—review and editing, N.H. All authors have read and agreed to the published version of the manuscript.

Funding

This research received no external funding.

Data Availability Statement

The datasets from the field surveys are available from the corresponding author upon reasonable request. The satellite images are commercially available and therefore are not available from the corresponding author.

Acknowledgments

The Education and Research Program (Planet Labs Inc.) was used to collect the satellite images. Planet Labs, Inc., had no role in the design, analysis, or writing of the manuscript. The authors gratefully acknowledge the support of the members of the Geoinformatics Laboratory at Kochi University in preparing this manuscript.

Conflicts of Interest

The authors declare no conflicts of interest.

References

  1. Yoshimoto, M.; Sakai, H.; Ishigooka, Y.; Kuwagata, T.; Ishimaru, T.; Nakagawa, H.; Maruyama, A.; Ogiwara, H.; Nagata, K. Field survey on rice spikelet sterility in an extremely hot summer of 2018 in Japan. J. Agric. Meteorol. 2021, 77, 262–269. [Google Scholar] [CrossRef]
  2. Matsui, T. Floret Sterility Induced by High Temperatures at the Flowering Stage in Rice (Oryza sativa L.). Jpn. J. Crop Sci. 2009, 78, 303–311. [Google Scholar] [CrossRef]
  3. Hasegawa, T.; Ishimaru, T.; Kondo, M.; Kuwagata, T.; Yoshimoto, M.; Fukuoka, M. Spikelet sterility of rice ob-served in the record hot summer of 2007 and the factors associated with its variation. J. Agiric. Meteorol. 2011, 67, 225–232. [Google Scholar] [CrossRef]
  4. Japan Meteorological Agency. Available online: https://www.data.jma.go.jp/cpdinfo/temp/sum_jpn.html (accessed on 9 April 2025).
  5. Sato, Y.; Yokoya, S. Effects of male sterility caused by low temperature at the booting stage on out-crossing rates in rice (Oryza sativa L.). Breed. Res. 2008, 10, 127–134. [Google Scholar] [CrossRef]
  6. Morita, S. Eco-Physiological Analysis for High-Temperature Effects on Rice—Grain Ripening. Bull. Natl. Agric. Res. Cent. Kyushu Okinawa Reg. 2009, 52, 1–78. [Google Scholar]
  7. Matsui, T.; Omasa, K.; Horie, T. High Temperature at Flowering Inhibits Swelling of Pollen Grains, a Driving Force for Thecae Dehiscence in Rice (Oryza sativa L.). Plant Prod. Sci. 2000, 3, 430–434. [Google Scholar] [CrossRef]
  8. Matsui, T.; Kobayasi, K.; Kagata, H.; Horie, T. Correlation between Viability of Pollination and Length of Basal Dehiscence of the Theca in Rice under a Hot-and-Humid Condition. Plant Prod. Sci. 2005, 8, 109–114. [Google Scholar] [CrossRef]
  9. Nabeshima, M.; Ebata, M.; Ishikawa, M. Studies on the High Temperature and Dry Wind Injuries in Flowering Rice Plant: Fertilization Injury Induced by High Temperature. Rep. Tokai Br. Crop Sci. Soc. Jpn. 1988, 105, 1–2. [Google Scholar]
  10. Ishimaru, T.; Okamura, M.; Nagaoka, I.; Yamaguchi, H.; Yoshimoto, M.; Ohdaira, Y. Quantitative assessment on the grain appearance of a new Japanese rice cultivar ‘Niji-no-kirameki’ with a novel heat-avoidance mechanism during ripening. Plant Stress 2022, 4, 100074. [Google Scholar] [CrossRef]
  11. Weerakoon, W.M.W.; Maruyama, A.; Ohba, K. Impact of Humidity on Temperature-Induced Grain Sterility in Rice (Oryza sativa L). J. Agron. Crop Sci. 2008, 194, 135–140. [Google Scholar] [CrossRef]
  12. Yoshimoto, M.; Fukuoka, M.; Tsujimoto, Y.; Matsui, T.; Kobayasi, K.; Saito, K.; van Oort, P.A.J.; Inusah, B.I.Y.; Vijayalakshmi, C.; Vijayalakshmi, D.; et al. Monitoring canopy micrometeorology in diverse climates to improve prediction of heat-induced spikelet sterility in rice under climate change. Agric. For. Meteorol. 2022, 316, 108860. [Google Scholar] [CrossRef]
  13. Yoshimoto, M.; Matsui, T.; Kobayasi, K.; Nakagawa, H.; Fukuoka, M.; Hasegawa, T. Mictometeorological Effects on Heat Induced Spikelet Sterility of Rice Estimated by Energy Balance Model. In Proceedings of the Abstracts of the 224th Meeting of the CSSJ, Kanazawa, Japan, 26–27 September 2007; pp. 162–163. [Google Scholar]
  14. Sheehy, J.; Elmido, A.; Centeno, G.; Pablico, P. Searching for New Plants for Climate Change. J. Agric. Meteorol. 2005, 60, 463–468. [Google Scholar] [CrossRef]
  15. Thorp, K.R.; Drajat, D. Deep machine learning with Sentinel satellite data to map paddy rice production stages across West Java, Indonesia. Remote Sens. Environ. 2021, 265, 112679. [Google Scholar] [CrossRef]
  16. Bridhikitti, A.; Overcamp, T.J. Estimation of Southeast Asian rice paddy areas with different ecosystems from moderate-resolution satellite imagery. Agric. Ecosyst. Environ. 2012, 146, 113–120. [Google Scholar] [CrossRef]
  17. Hokkaido Central Agricultural Experiment Station. Analysis of damage on paddy rice using satellite remote sensing. Misc. Pub. Hokkaido Prefect Agric. Exp. Stn. 1994, 22, 144–146. [Google Scholar]
  18. Shimada, H.; Shima, E.; Tanaka, K.; Nagayoshi, T.; Yoshino, K.; Hattori, T.; Kato, W.; Watanabe, K. Monitoring for investigation of field by simple 4 band camera system with stereo photography. J. JSIDRE 2006, 74, 969–972. [Google Scholar]
  19. Yawata, K.; Yamamoto, T.; Hashimoto, N.; Ishida, R.; Yoshikawa, H. Mixed model estimation of rice yield based on NDVI and GNDVI using a satellite image. In Proceedings of the Remote Sensing for Agriculture, Ecosystems, and Hydrology XXI, Strasbourg, France, 9–12 September 2019; Volume 11149, p. 1114918. [Google Scholar]
  20. Tanaka, K.; Hama, A.; Kondoh, A. Analysis of high-temperature stress on rice grains by UAV remote sensing. In Proceedings of the General Meeting of the Association of Japanese Geographers 2017s, Tsukuba, Japan, 28–30 March 2017; p. 100277. [Google Scholar]
  21. Yoshino, S.; Toyofuku, K.; Sone, C.; Ogawa, A. Estimating the Degree of the High-Temperature Damage in Rice Grain Ripening by Proximity Remote Sensing during the Heading Period. Jpn. J. Crop Sci. 2022, 91, 215–222. [Google Scholar] [CrossRef]
  22. Cropping Type of Paddy in Kochi Prefecture. Available online: https://www.nogyo.tosa.pref.kochi.lg.jp/download/?t=LD&id=6928&fid=59399 (accessed on 8 April 2024).
  23. Statistical Survey on Crops. Available online: https://www.maff.go.jp/j/tokei/kouhyou/sakumotu/ (accessed on 8 April 2024).
  24. The Agro-Meteorological Grid Square Data. Available online: https://amu.rd.naro.go.jp/wiki_open/doku.php?id=start (accessed on 8 April 2024).
  25. Tsuboi, Y.; Hitaka, N. Studies on Wind Damage of Rice Plant (5) Shattering loss caused by strong wind. J. Agric. Meteorol. 1966, 21, 127–130. [Google Scholar] [CrossRef]
  26. Mitsui, T.; Maruyama, S. Alleviation of Spikelet Sterility of Rice Caused by High Temperatures by Applying Auxin and Jasmonic Acid. Jpn. J. Crop Sci. 2019, 88, 182–186. [Google Scholar] [CrossRef]
  27. Planet Labs. Planet Labs Constellation Overview: Planetscope. In PlanetScope Product Specifications; Planet Labs: San Francisco, CA, USA, 2023; p. 10. [Google Scholar]
  28. Planet Surface Reflectance. Available online: https://assets.planet.com/marketing/PDF/Planet_Surface_Reflectance_Technical_White_Paper.pdf (accessed on 11 February 2025).
  29. GSI Maps. Available online: https://www.gsi.go.jp/ (accessed on 8 April 2024).
  30. Wang, N.; Guo, Y.; Wei, X.; Zhou, M.; Wang, H.; Bai, Y. UAV-based remote sensing using visible and multispectral indices for the estimation of vegetation cover in an oasis of a desert. Ecol. Indic. 2022, 141, 109155. [Google Scholar] [CrossRef]
  31. Liu, L.; Xie, Y.; Zhu, B.; Song, K. Rice leaf chlorophyll content estimation with different crop coverages based on Sentinel-2. Ecol. Inform. 2024, 81, 102622. [Google Scholar] [CrossRef]
  32. Hashimoto, N.; Saito, Y.; Yamamoto, S.; Ishibashi, T.; Ito, R.; Maki, M.; Homma, K. Relationship between Leaf Area Index and Yield Components in Farmers’ Paddy Fields. AgriEngineering 2023, 5, 1754–1765. [Google Scholar] [CrossRef]
  33. Hirooka, Y.; Homma, K.; Shiraiwa, T.; Kuwada, M. Parameterization of leaf growth in rice (Oryza sativa L.) utilizing a plant canopy analyzer. Field Crops Res. 2016, 186, 117–123. [Google Scholar] [CrossRef]
  34. Intaravanne, Y.; Sumriddetchkajorn, S. Android-based rice leaf color analyzer for estimating the needed amount of nitrogen fertilizer. Comput. Electron. Agric. 2015, 116, 228–233. [Google Scholar] [CrossRef]
  35. Wood, S.N. Generalized Additive Models, An Introduction with R, 2nd ed.; Chapman and Hall/CRC: New York, NY, USA, 2017. [Google Scholar]
  36. Polygons of Land Parcels. Available online: https://www.maff.go.jp/j/tokei/porigon/index.html (accessed on 15 November 2023).
  37. Nagata, T. The way to use of UAV remote sensing for paddy rice. Hokuno 2021, 88, 12–17. [Google Scholar]
  38. Rouse, J.W.; Haas, R.H.; Schell, J.A.; Deering, D.W.; Harlan, J.C. Monitoring the Vernal Advancement and Retrogradation (Greenwave Effect) of Natural Vegetation; NASA/GSFC Type III Final Report; NASA: Greenbelt, MD, USA, 1974. [Google Scholar]
  39. Arai-Sanoh, Y.; Okamura, M.; Mukouyama, T.; Kobayashi, N.; Ogiwara, H.; Yoshida, H.; Kondo, M. Determination of Suitable Harvesting Time of Rice Cultivars with High Yield and High Eating Quality. Jpn. J. Crop Sci. 2020, 89, 102–109. [Google Scholar] [CrossRef]
  40. Azuma, S.; Takeuchi, A.; Sato, T. Basal-white kernels occurrences after the maturing stage in rice cultivar “Koshihikari” under high temperature condition. In Proceedings of the Abstracts of 234th Meeting of the CSSJ, Sendai, Japan, 9–10 September 2012; p. 292. [Google Scholar]
  41. Saida, N.; Kameshima, M.; Sakata, M. Evaluation of sterility tolerance to high temperature treatment at the flowering stage of rice using an artificial weather machine. Shikoku J. Crop Sci. 2022, 59, 2–4. [Google Scholar]
  42. Kikkawa, S.; Shibata, S. Effect of high temperature to first half of ripening period on grain quality in 2019. Tohoku J. Crop Sci. 2020, 63, 19–20. [Google Scholar]
  43. Nakano, H. Effect of Early-Stage Shading of Direct Seeded Rice on Growth and Yield Components. Jpn. J. Crop Sci. 2000, 69, 182–188. [Google Scholar] [CrossRef]
  44. Morita, S. Prospect for Developing Measures to Prevent High-Temperature Damage to Rice Grain Ripening. Jpn. J. Crop Sci. 2008, 77, 1–12. [Google Scholar] [CrossRef]
  45. Kaneta, Y.; Tsumura, M.; Hatakeyama, K.; Kato, K.; Takakai, F.; Sato, T. Characteristics of the high-temperature-ripening Oryza sativa variety Fusaotome under high-temperature conditions. Jpn. J. Soil Sci. Plant Nutr. 2022, 93, 141–147. [Google Scholar]
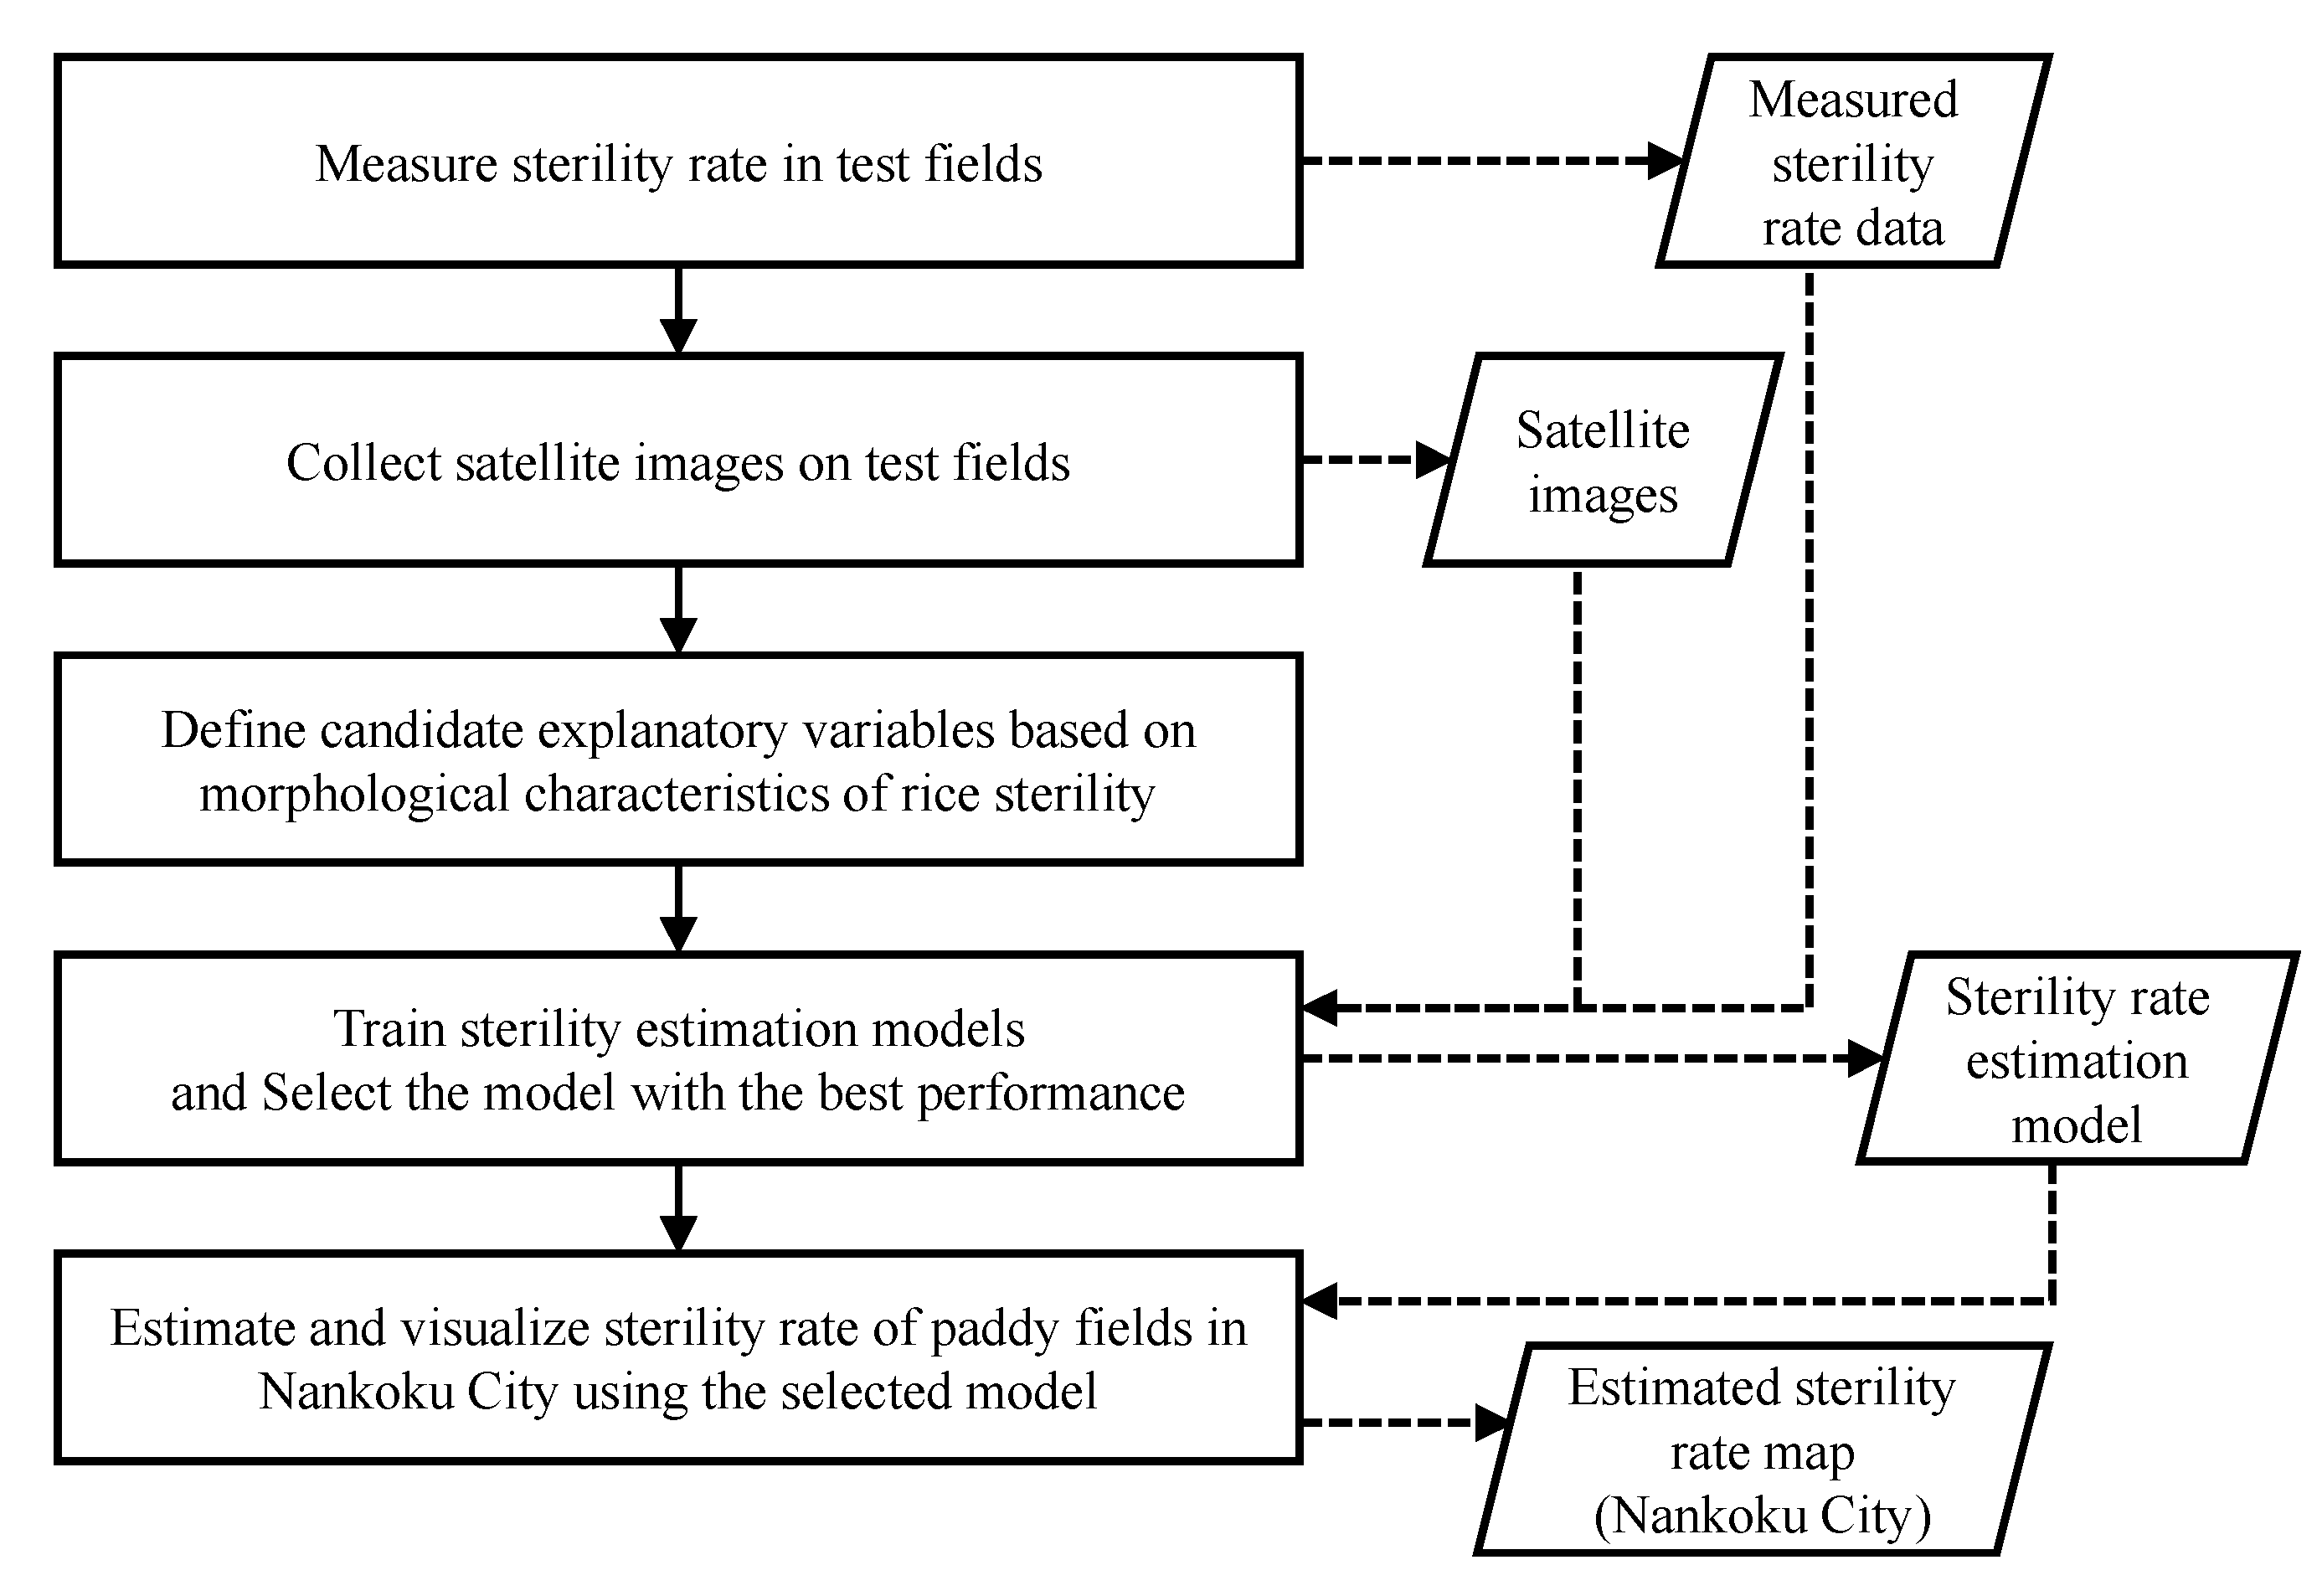
Figure 1. Procedure to map the paddy fields with high potential for sterility.
Agriengineering 07 00122 g001
Figure 4. Leaves of rice with low sterility (lower) and high sterility (upper) at the maturing stage. This photo was taken in July 2023 in a farmer’s field.
Agriengineering 07 00122 g004
Figure 5. Histogram of heading date estimated using the normalized difference vegetation index (NDVI). The vertical axis shows the number of fields that flowered in each period on the horizontal axis.
Agriengineering 07 00122 g005
Figure 6. Average of estimated sterility rate for each period. The sterility rate of each field was estimated by a model trained using the sterility rate measured in the field survey area, i.e., the rate of the number of unripe grains to the total number of grains (dimensionless quantity, range: 0 to 1), as training data. The vertical axis shows the average sterility rate in fields that flowered during each period on the horizontal axis. The bars in the figure indicate the standard deviation.
Agriengineering 07 00122 g006
Figure 7. Estimated sterility rate (sr) map for central to southern Nankoku City in (a) 2022, (b) 2023, and (c) 2024. The sterility rate on the map was estimated by a model trained using the sterility rate measured in the field survey area, i.e., the rate of the number of unripe grains to the total number of grains (dimensionless quantity, range: 0 to 1), as training data. For (ac), light green, yellow, and red colors indicate sterility rates of 0 ≤ sr ≤ 0.2, 0.2 < sr ≤ 0.3, and 0.3 < sr ≤ 0.5. For (d), blue, light green, yellow, pink, and red colors indicate sterility rates of 0 ≤ sr ≤ 0.15, 0.15 < sr ≤ 0.2, 0.2 <sr ≤ 0.25, 0.25 < sr ≤ 0.3, and 0.3 < sr ≤ 0.5. The white rectangle indicates the field survey area (the bottom figure in Figure 1).
Agriengineering 07 00122 g007
Figure 8. Number of fields displayed in Figure 7 for the three years.
Agriengineering 07 00122 g008
Figure 9. Three-year average and standard deviation of the sterility rate. The sterility rate of each field was estimated by a model trained using the sterility rate measured in the field survey area, i.e., the rate of the number of unripe grains to the total number of grains (dimensionless quantity, range: 0 to 1), as training data.
Agriengineering 07 00122 g009
Table 1. Cultivation history of paddy fields in 2022 and 2023.
YearFieldCultivarTest Plot NumberBasal Fertilizer Application
(kg per 1000 m2)
Transplanting DateHeading DateHarvesting Date
2022(a)Nangokusodachi3238 131 March23 June21 July
(c)Yosakoibijin3032 14 April23 June24 July
(b)Koshihikari
(early-season cultivation)
1633 210 April1 July5 August
(d), (e)Koshihikari
(normal-season cultivation)
3025 325 May29 July29 August
2023(d), (f)Fukuhikari20150 4, 30 224 April8, 9 July11 August
(e), (g), (h)Koshihikari
(normal-season cultivation)
50150 4, 30 213, 14 May21 July21 August
1 Yukoto 200 (N:P:K = 20:10:10; MC FERTICOM Co., Ltd.). 2 Tosasuitouippatsu746 (N:P:K = 17:14:16; i-Agri Corp.). 3 Inekouchan (N:P:K = 14:12:12; Tokushimaken-KyoudouHiryou). 4 Chicken manure.
Table 2. Mean sterility rate and standard deviation in surveyed paddy fields.
YearCultivarMean Sterility Rate
(Standard Deviation)
2022Nangokusodachi0.08 (±0.060)
Yosakoibijin0.15 (±0.031)
Koshihikari (early-season cultivation)0.15 (±0.050)
Koshihikari (normal-season cultivation)0.35 (±0.066)
2023Fukuhikari0.09 (±0.035)
Koshihikari (normal-season cultivation)0.31 (±0.079)
Disclaimer/Publisher’s Note: The statements, opinions and data contained in all publications are solely those of the individual author(s) and contributor(s) and not of MDPI and/or the editor(s). MDPI and/or the editor(s) disclaim responsibility for any injury to people or property resulting from any ideas, methods, instructions or products referred to in the content.