Article

Crop Water Productivity: Within-Field Spatial Variation in Irrigated Alfalfa (Medicago sativa L.)

by
Keegan Hammond
1,*,
Ruth Kerry
2,*,
Ross Spackman
3,
April Hulet
4,
Bryan G. Hopkins
4,
Matt A. Yost
5 and
Neil C. Hansen
4
1
School of Life Sciences, University of Nevada Las Vegas, Las Vegas, NV 89154, USA
2
Department of Geography, Brigham Young University, Provo, UT 84602, USA
3
Department of Applied Plant Science, Brigham Young University-Idaho, Rexburg, ID 83460, USA
4
Department of Plant and Wildlife Sciences, Brigham Young University, Provo, UT 84602, USA
5
Department of Plants, Soils, & Climate, Utah State University, Logan, UT 84322, USA
*
Authors to whom correspondence should be addressed.
AgriEngineering 2025, 7(4), 115; https://doi.org/10.3390/agriengineering7040115
Submission received: 13 February 2025 / Revised: 18 March 2025 / Accepted: 6 April 2025 / Published: 10 April 2025

Abstract

:
In this study, alfalfa (Medicago sativa L.) is evaluated for suitability of variable rate irrigation (VRI) by analyzing within-field variation in crop water productivity (CWP) under uniform irrigation. The objectives were to (1) measure within-field variation in crop evapotranspiration (ET), (2) quantify spatial variability of alfalfa biomass yield, and (3) assess whether a bivariate analysis of CWP and yield could inform VRI management zones. Research was conducted on a 22.6 ha center-pivot irrigated alfalfa field near Rexburg, Idaho, USA, over three harvest intervals (HIs) in 2021 and 2022. Using a water balance method at 66 field points, ET exhibited significant spatial clustering for each HI (p < 0.001 for all HIs), though spatial patterns varied among HIs. Biomass yield, measured via the quadrat method, ranged from 2.1 to 9.7 Mg ha−1, with significant spatial clustering (p < 0.001 for all HIs). The CWP ranged from 0.07 to 0.54 Mg ha−1 cm−1, also showing significant spatial clustering (p < 0.001 for all HIs). Bivariate cluster analysis indicated 12–18% more area of the field was over-watered than under-watered, suggesting potential for optimizing irrigation with VRI. Reducing irrigation in these over-watered zones could improve CWP, supporting alfalfa as a viable candidate for VRI.

1. Introduction

Irrigated agriculture is the largest consumer of freshwater resources throughout the world [1]. Rising water demands driven by population growth, increasing food production needs [2,3], and prolonged drought events [4] highlight the need for improved water management practices [5,6]. One approach to improve irrigation water management is variable rate irrigation (VRI) [6,7,8,9,10]. A VRI system has the potential to improve crop water productivity (CWP) by spatially matching irrigation rates to crop water demands, thus reducing areas of over- or under-irrigation within a field [11]. The CWP is an expression of crop biomass yield (or grain yield) produced per unit volume of water consumed, usually expressed as the evapotranspiration (ET) rate [12,13]. How the CWP varies within a single field depends on variation in yield and ET, both of which are affected by factors such as topography [14], soil physical and chemical properties, and pest pressure [11,13]. The majority of studies evaluating VRI have been conducted on cotton (Gossypium hirsutum L.) [15], grain crops [9,16,17], or potato (Solanum tuberosum L.) [18,19], but few have examined whether a high-water-use, perennial forage crop such as alfalfa (Medicago sativa L.) is a suitable candidate for VRI.
Alfalfa is one of the most widely cultivated and irrigated crops worldwide [20,21,22]. Alfalfa traditionally requires more water than other forage crops due to its long growing season [22,23], deep root system [21], and multiple harvests per year [20]. In the Intermountain West of the United States, alfalfa requires an average of 500 mm to 1150 mm of water annually, compared to 375 mm for winter wheat (Triticum aestivum spp.) and 450 mm for maize (Zea mays L.) [23,24]. A common challenge in irrigated alfalfa is the depletion of plant-available soil water to the point that biomass yield is reduced [2,6,20]. Under-watered plants are more susceptible to disease [25] and decreased yield [22,26]. Water supply and demand within a single field are influenced by soil type, soil depth [13], topography [2,11], nutrient availability [5,6], shading [20], plant density [5], and disease [25]. Given alfalfa’s high water requirements and the spatial variability of water supply and demand within a single field, we hypothesized that alfalfa is a good candidate crop for VRI.
Several studies report the CWP of irrigated alfalfa at the field scale, with values ranging from 0.08 to 0.33 Mg ha−1 cm−1 [1,3,12,26,27]. Other studies detail the temporal variation in alfalfa CWP at the field scale between successive harvests within the year [2,5,12,21]. However, to date, no studies report the within-field spatial variation in alfalfa CWP and temporal change over multiple alfalfa harvests for irrigated alfalfa [11].
Evaluating the within-field spatiotemporal variation in CWP for alfalfa can inform the potential benefit of VRI. Moreover, an evaluation of the spatial patterns of biomass yield and CWP may serve as an effective approach to delineate VRI management zones for alfalfa and guide decisions on whether these zones should receive irrigation rates above or below the mean irrigation rate [14]. The concept of using CWP as a means of delineating VRI zones was proposed by Svedin et al. [13] for winter wheat (Triticum spp.). They suggested that areas of a uniformly irrigated field with a bivariate classification of low yield and low CWP are over-watered and can be managed in VRI zones with below-average irrigation rates. Conversely, they suggested that areas of a uniformly irrigated field with high yield and high CWP use water most efficiently and have the greatest probability to respond positively to above-average irrigation rates. The potential of spatially redistributing water across a single field using VRI technology to increase CWP has significant potential as a strategy for improved water use efficiency.
We hypothesize that significant within-field spatial variation in alfalfa CWP will exist under uniform irrigation across all alfalfa harvest intervals (HIs) and that distinct spatial patterns of CWP will cluster into VRI management zones. To test these hypotheses, this study aims to (1) measure the within-field variation in crop ET in alfalfa under uniform irrigation, (2) quantify the within-field spatial variation in alfalfa biomass yield under uniform irrigation, and (3) describe the within-field spatial variability of CWP and whether a bivariate analysis with biomass yield is a potential means for creating VRI management zones.

2. Materials and Methods

2.1. Description of Study Site

The study was conducted on a uniformly irrigated alfalfa field (22.6 ha) located in Rexburg, Idaho, USA (43.800966 N, −111.79014 W) (Figure 1) during 2021 and 2022 (Table 1). The soil type is silt loam and classified as coarse-silty, mixed, calcareous, frigid, Typic Xerorthents [28]. The 30-year mean precipitation at this site is 33.9 cm, with most occurring as snow in the winter and early spring. The 30-year mean growing season temperature (April–September) is 13.9 °C, with a frost-free period of 80 to 100 days constituting the growing season [28].
Irrigation was uniformly applied using a 370 m center-pivot sprinkler with drop nozzles every 5 m during the study. There were sixteen irrigation events during the two HIs evaluated in 2021 (Table 2), occurring approximately every three days, with irrigation stopping five days before each of the alfalfa harvests. There were seven irrigation events during the one HI studied in 2022, occurring approximately every three days. The irrigation rate per event was 1.5 cm for 2021 and 1.8 cm for 2022, with the higher rate in 2022 due to initially drier soil conditions [29]. Each of the three HIs had the same total irrigation, 12 cm (Table 2).

2.2. Measurement of Soil Water Content

A gas-powered hammer probe (AMS, Inc., American Falls, ID, USA) was used to collect soil samples to a depth of 0.9 m. Variograms of bare soil imagery for the field indicated ranges of 250–300 m. According to Kerry and Oliver [30], the sampling interval should be less than half the variogram range to maintain spatial structure in the data for successful kriging of observations. To meet this requirement, soil sampling was conducted on a nested grid, consisting of a primary 60 m grid with an additional offset grid of 75 m [29], resulting in 66 sampling points across the field (Figure 1A). The sampling intervals of both grids were markedly less than the recommended maximum interval of 125–150 m based on the variogram range. This ensured adequate spatial resolution in the data collected. This sampling scheme was designed to capture spatial variability by incorporating both small and large separation distances, increasing the likelihood of detecting spatial structure in the observations. Soil cores were divided into three depth intervals: 0–0.3 m, 0.3–0.6 m, and 0.6–0.9 m. Wet soil mass was recorded for each sample, and the samples were dried at 105 °C for at least 24 h to determine dry soil mass. Wet and dry soil mass measurements were used to calculate gravimetric water content (GWC) for each sample.
GWC = Wet   mass g dry   mass   ( g ) dry   mass   ( g ) .
Soil samples were collected at the beginning of each HI and before each alfalfa harvest to estimate the change in soil water content ( Θ ) (Table 1).
Bulk density (BD) was determined at representative locations and depths across the field by collecting intact soil cores in an 8 cm diameter metal ring that was 5 cm tall. The soil core samples were dried in a 105 °C oven for at least 24 h to obtain dry mass. The dry mass divided by the volume of soil was used to calculate BD.
BD = dry   mass   of   soil   ( g ) volume   of   soil   ( cm 3 ) .
The BD ranged from 1.40 g cm−3 to 1.50 g cm−3 with a mean of 1.46 g cm−3; the mean was used to calculate volumetric water content (VWC).
VWC =   BD   ( g   cm - 3 ) Water   density   ( g   cm - 3 )   ×   GWC .
Measured water content was expressed on a depth basis by multiplying VWC by each 0.3 m sample depth increment for the total 0.9 m soil profile. As one component of a soil water balance equation, the Θ was calculated from the beginning to the end of each HI.

2.3. Crop Evapotranspiration

Crop ET for each HI was calculated at each of the 66 sample points in the field using the following water balance equation:
ET = I + P     D     R     Θ ,
where ET is crop evapotranspiration for the HI, I is total irrigation, P is total precipitation, D is total drainage, R is runoff, and Θ is the change in soil water depth within the 0.9 m soil profile, calculated between the soil sampling dates (Table 1) at the start and the end of the HI [2,31]. To assess potential drainage below the root zone, a daily ET estimate was independently conducted using the reference ET and crop coefficient method [32], combined with a daily water balance to determine whether precipitation or irrigation would exceed the soil’s water holding capacity within the 0.9 m depth, leading to drainage. Crop coefficients used were derived for Idaho conditions [32]. Drainage was found to be an inconsequential component of the water balance (Equation (4)). Runoff was assumed to be zero. The soil’s saturated hydraulic conductivity (25 mm h−1) far exceeded the maximum observed hourly precipitation rate (6.0 mm h−1), supporting the assumption of zero runoff. Further supporting the zero runoff assumption, irrigation was applied at rates lower than the soil’s infiltration capacity, and no visual evidence of surface runoff was observed. Capillary rise from the groundwater to the root zone is not included in the water balance, as the depth to groundwater at this field is >20 m. Irrigation totals are presented in Table 2, while precipitation totals for each HI were recorded at the nearest weather station, located 4.7 km north of the study site [33]. Both total precipitation and Θ varied among each HI (Table 2).
It is recognized that alfalfa can utilize soil water from deeper than 0.9 m; however, sampling beyond this depth was not feasible due to rocky conditions. To account for potential water uptake from deeper soil layers, we applied a correction to Θ based on a previous study of alfalfa grown in a similar soil type in southern Idaho. Kohl reported that 80% of the total soil water utilized by irrigated alfalfa is from the top 1 m [34,35]. Therefore, the HI Θ values were adjusted by dividing by 80% to estimate total water uptake. Since this correction was applied uniformly across all treatments, it did not impact the primary objective of evaluating spatial variation in ET. Without this adjustment, CWP values exceeded the range reported in other studies, 0.08 Mg ha−1 cm−1 to 0.33 Mg ha−1 cm−1 [21,26,27], but with the correction CWP values were within this range.

2.4. Alfalfa Biomass Yield

One day prior to the grower’s harvest, the alfalfa was clipped in square quadrats (0.5 m by 0.5 m) to 8 cm above the ground at all 66 sample points (Figure 1A), placed into paper bags, and wet biomass was determined. The samples were oven-dried at 60 °C until they reached a constant mass (≥48 h), and dry biomass was recorded [36]. Following the manual sampling, the alfalfa field was mechanically harvested to a height of 8 cm.

2.5. Crop Water Productivity

Site-specific ET between each HI and the corresponding measured dry biomass yields were used to calculate CWP for each sample point, which was calculated as follows:
CWP = Dry   biomass   yield   ( Mg   ha - 1 ) ET   ( cm )

2.6. Spatial Statistical Analysis

Crop ET, dry biomass yield, and CWP values were imported into SpaceStat (BioMedware, SpaceStat desktop: Release 4.0.21, Ann Arbor, MI, USA) for spatial analysis. Each variable was kriged to a 1 m grid across the field for each HI using the associated semi-variograms. The degree of spatial clustering for each kriged dataset was evaluated using the univariate Global and Local Moran’s I tests with a spatial weight set of the nearest 24 points in the 1 m grid; this is equivalent to using second-order queen neighbors. Bivariate Global and Local Moran’s I tests were performed between biomass yield and CWP for each HI to identify areas of the field that were over-watered or under-watered to generate potential VRI management zones.

3. Results

3.1. Daily Evapotranspiration and Mean Temperature

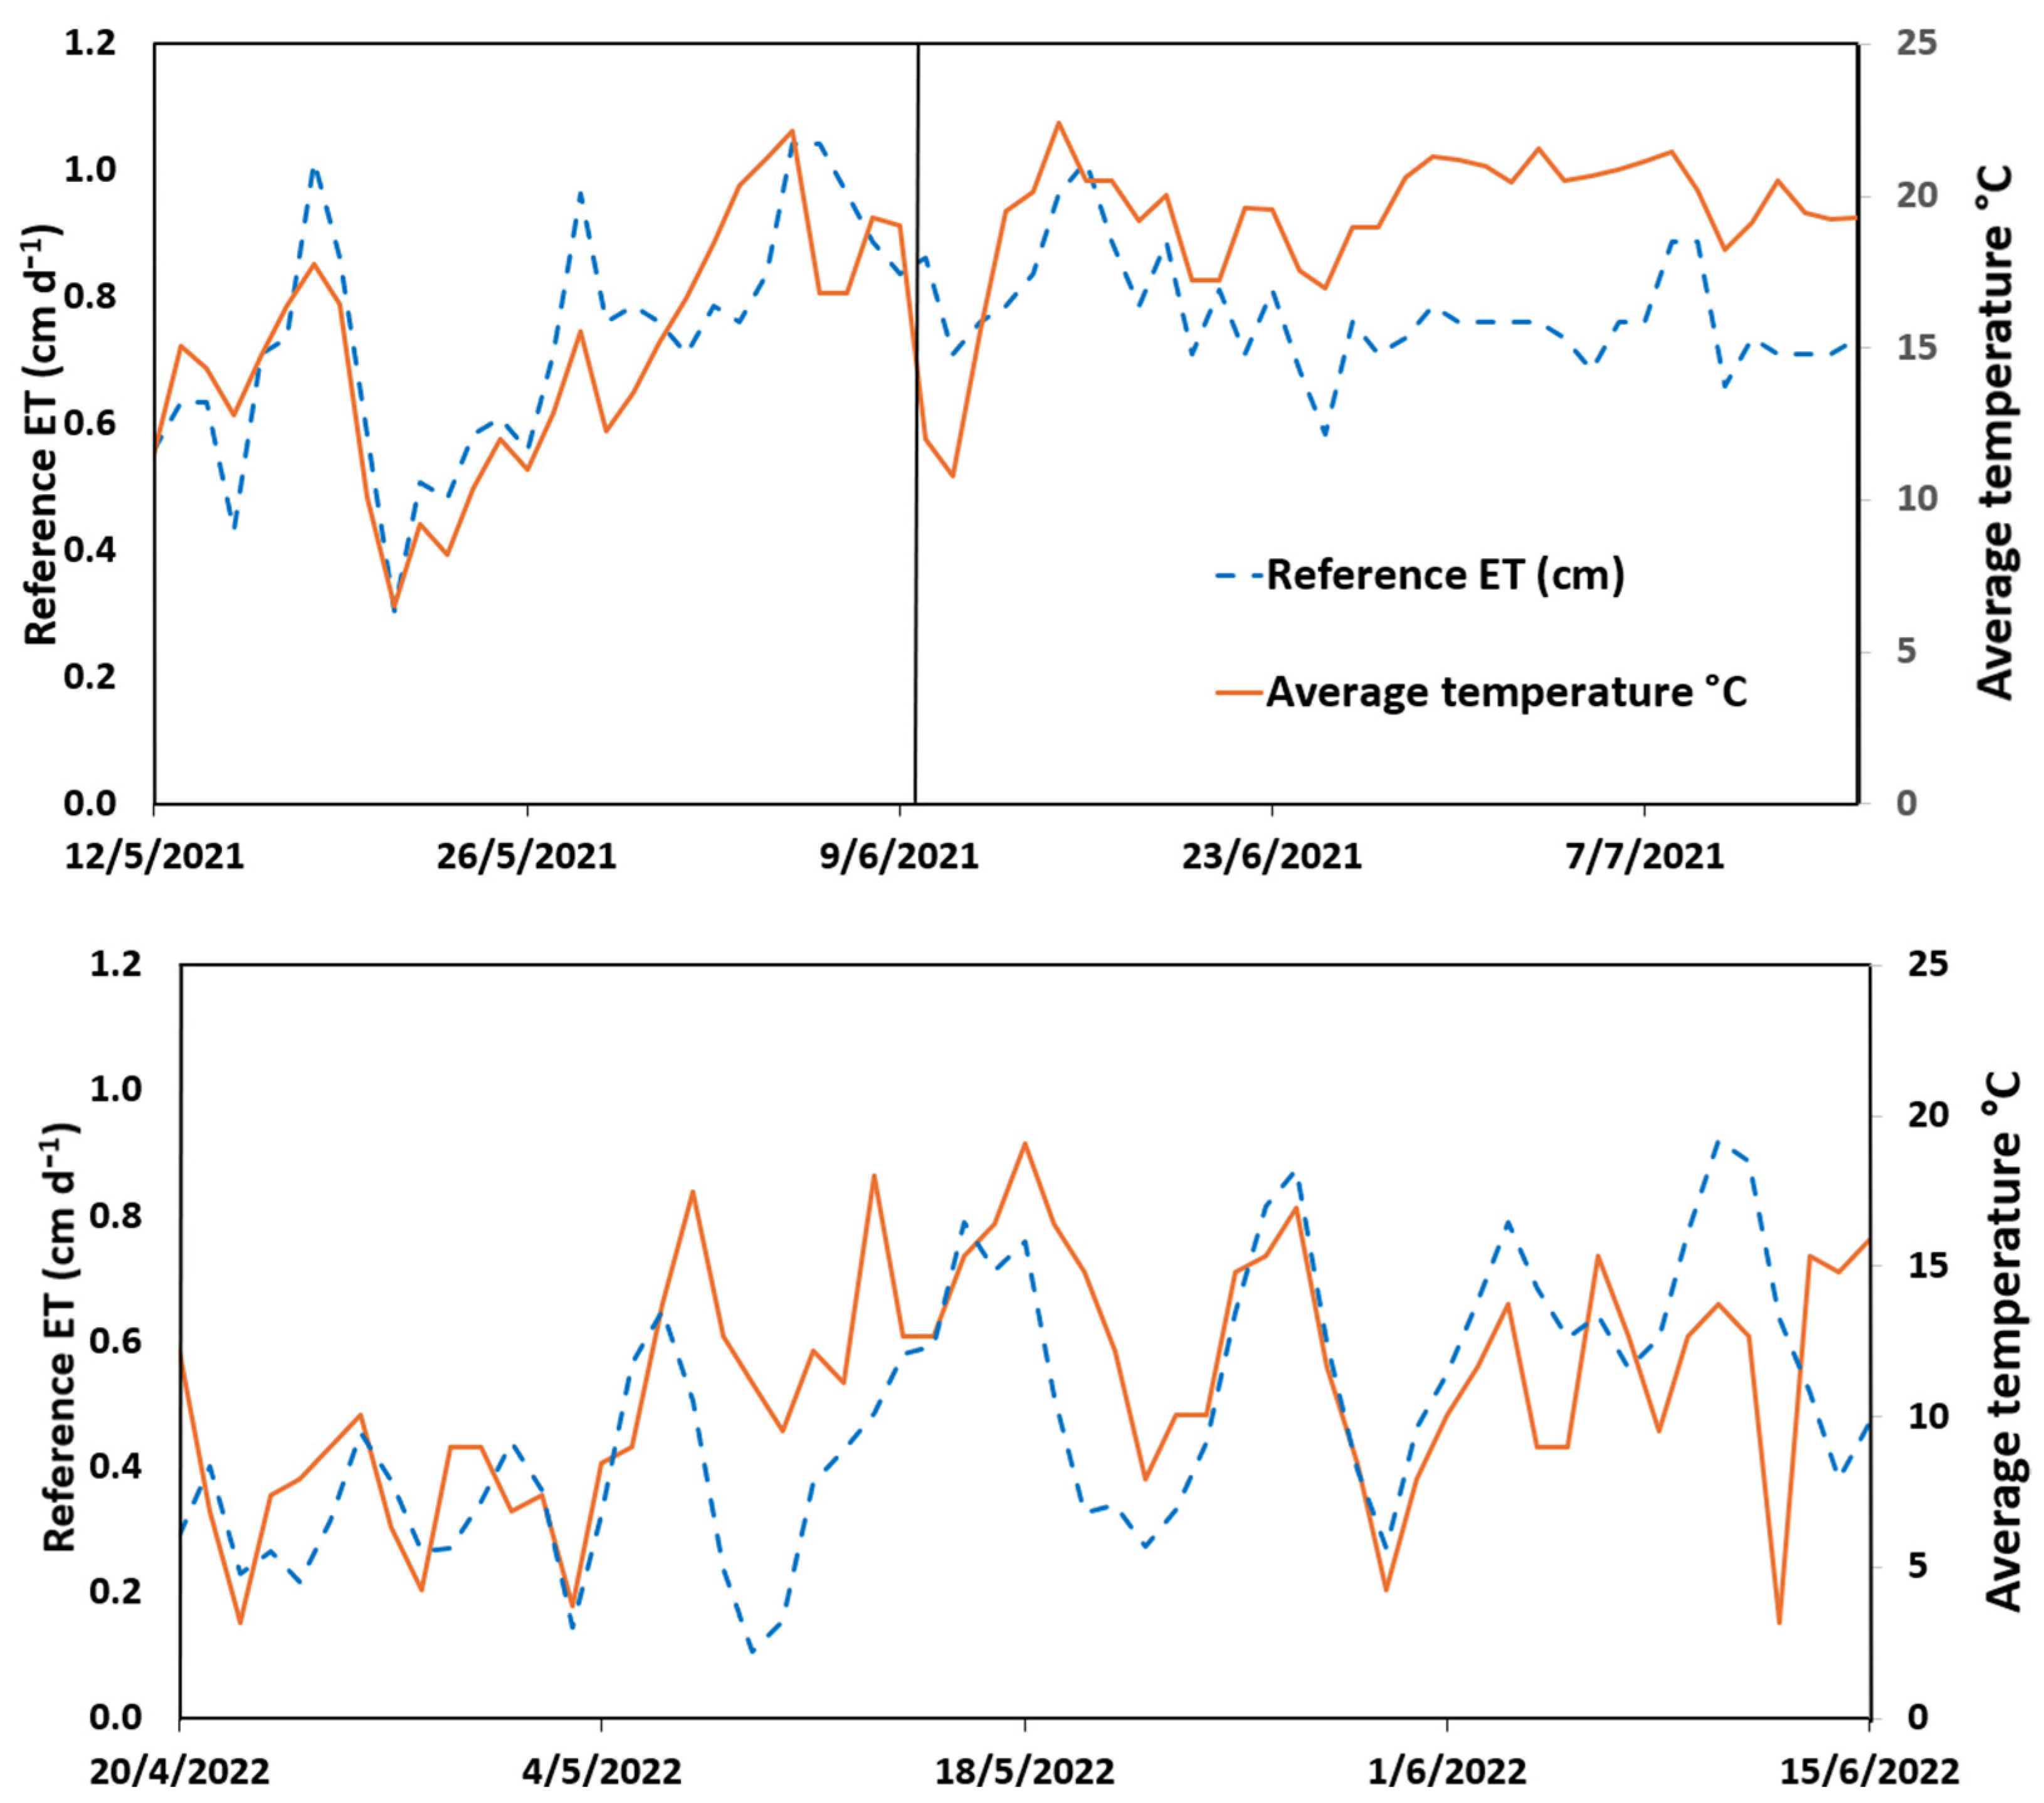
Mean daily air temperature varied across the three HIs from 2.2 °C to 22 °C (Figure 2). Alfalfa reference daily ET varied from 0.10 to 1.1 cm d−1 across the three HIs. The reference ET is the potential ET calculated from temperature, solar radiation, humidity, and wind speed data using the Penman-Monteith equation [32]. Total annual precipitation was 32 cm for 2021 and 30 cm for 2022. Precipitation during the alfalfa HIs was 3.6 cm, 0.2 cm, and 6.5 cm, respectively (Table 2). Mean temperature during the alfalfa HIs was 14.7 °C, 19.3 °C, and 10.1 °C, respectively (Figure 2).

3.2. Spatial Variation in Crop Evapotranspiration

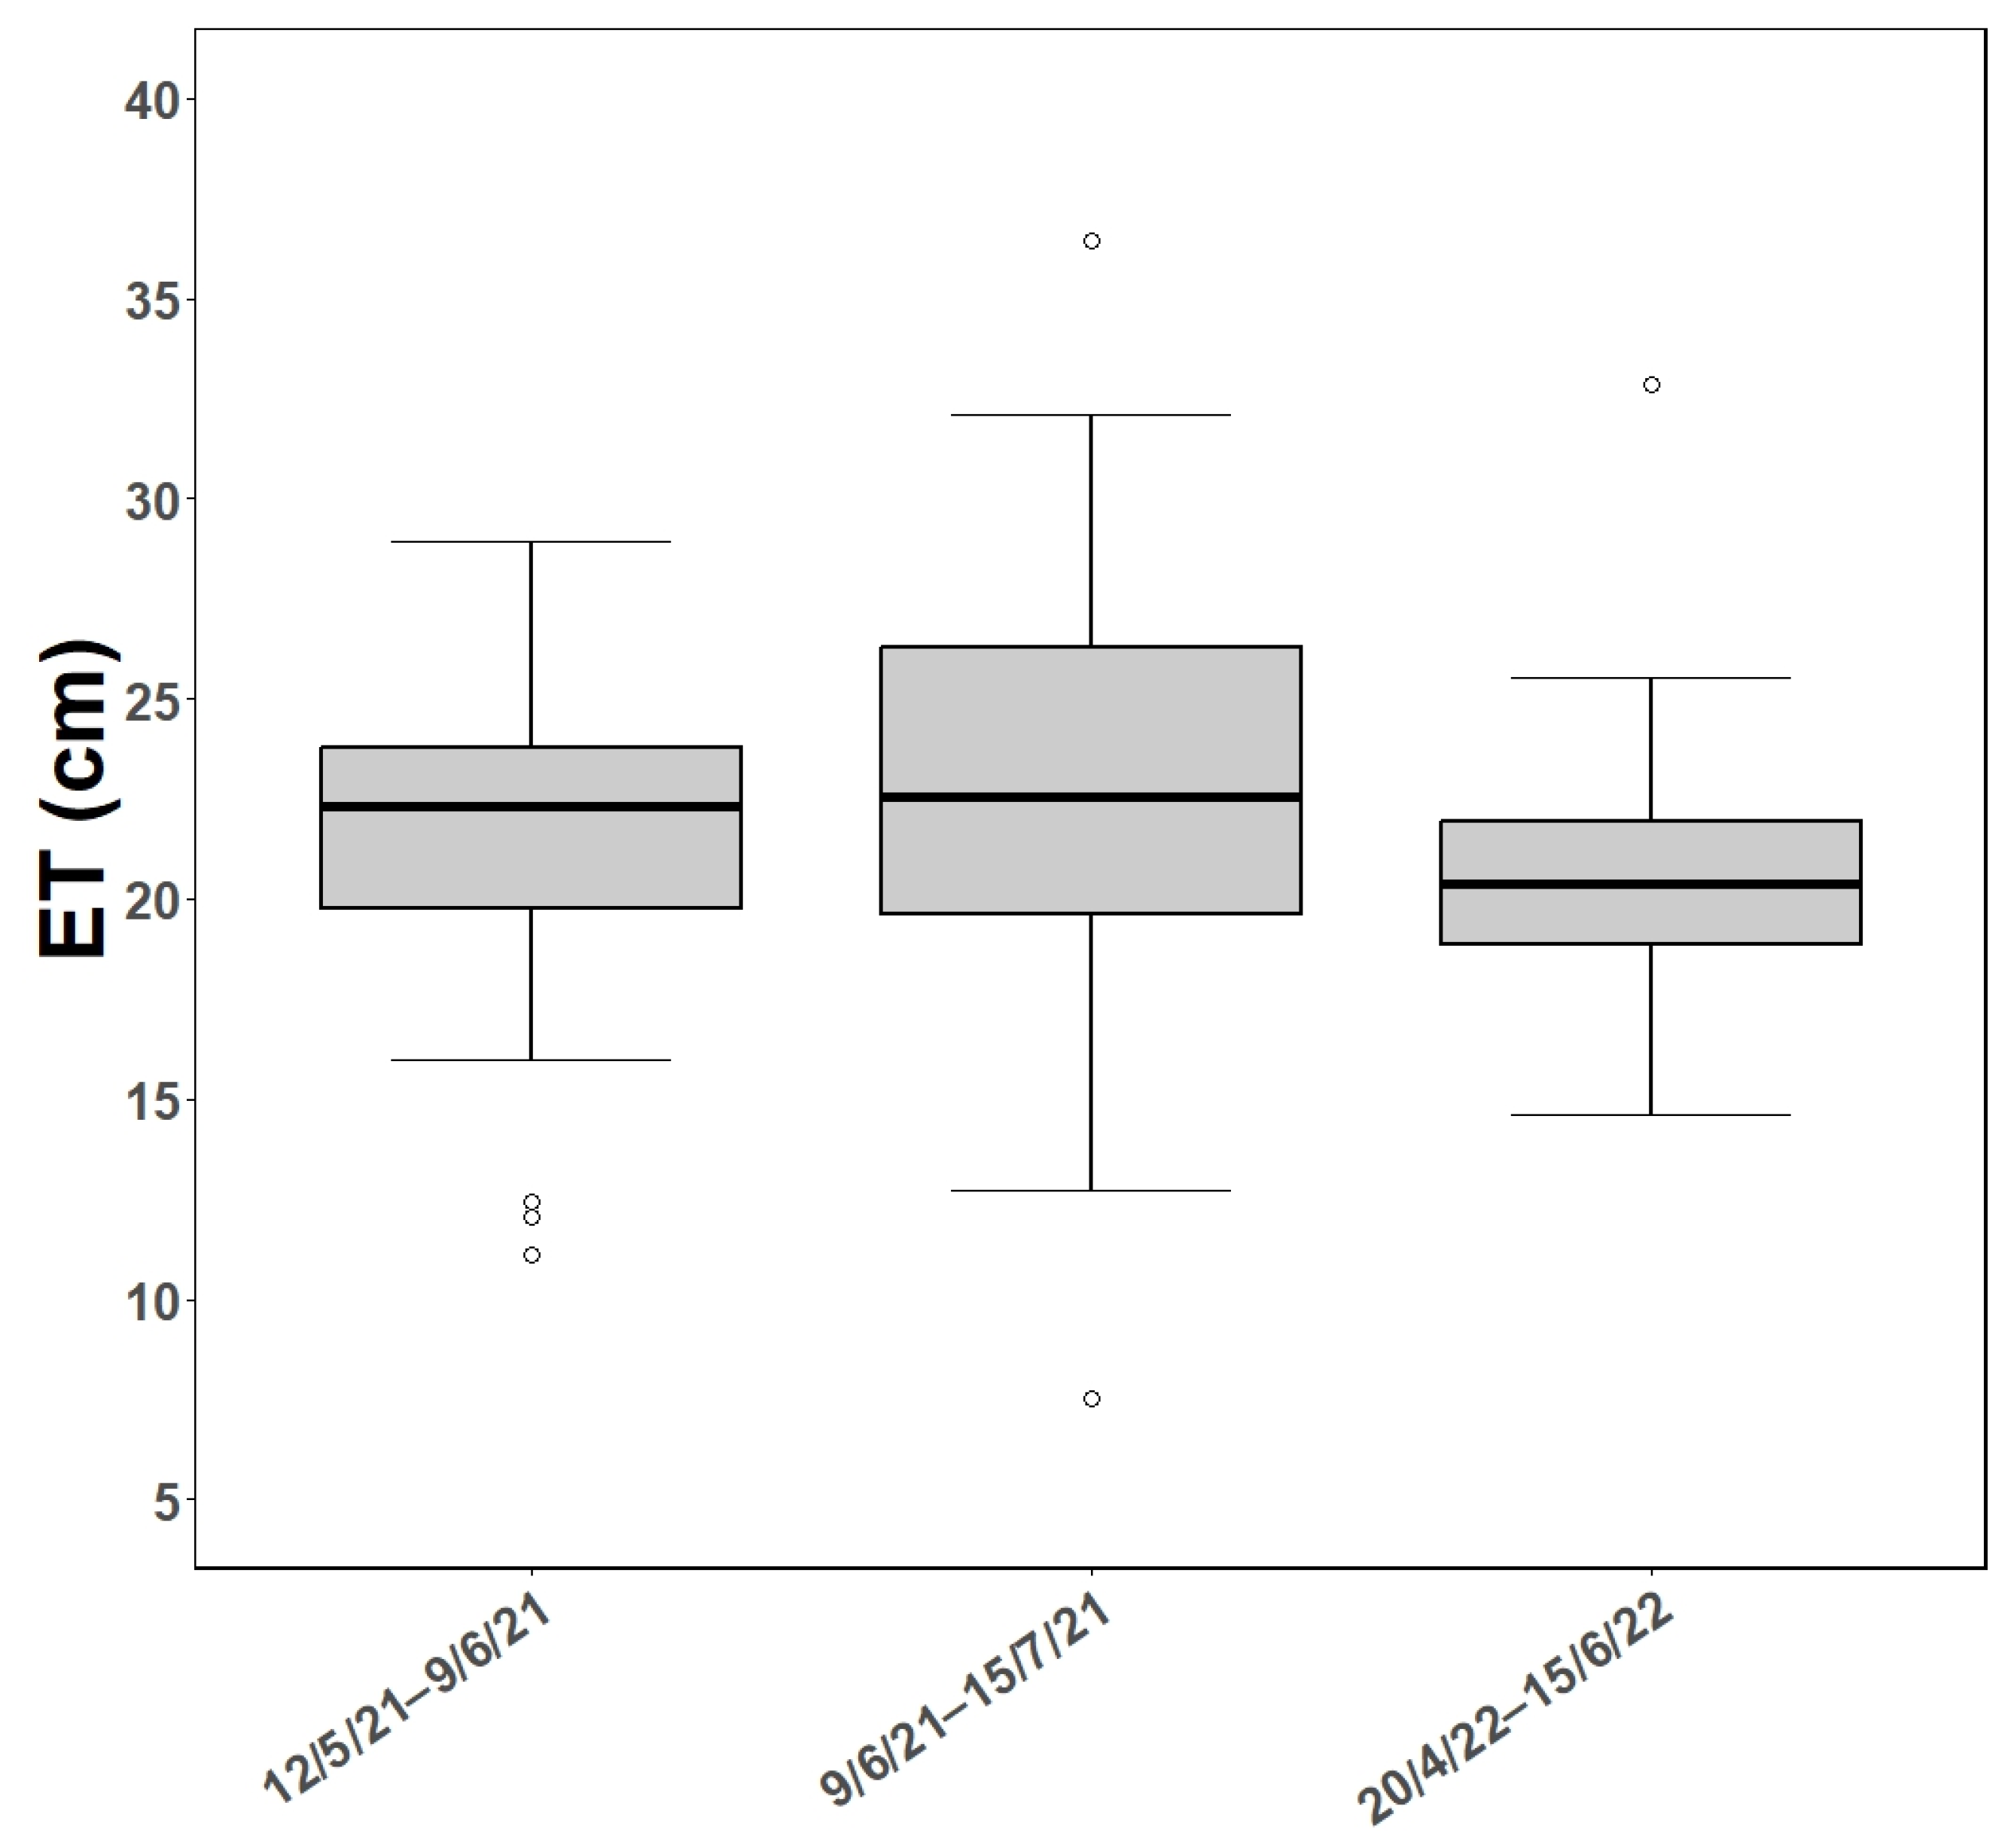
The first objective of the study was to evaluate the within-field spatial variation in crop ET using a water balance approach. During the 12/5/2021–9/6/2021 HI, total ET ranged from 11 to 29 cm, with a mean of 22 cm and a mean daily ET of 0.78 cm d−1 (Figure 3). The mean daily ET was 8.3% higher than the reference ET of 0.72 cm d−1 (Figure 2). During the 9/6/2021–15/7/2021 HI, total ET ranged from 7.5 to 36 cm, with a mean of 23 cm and a mean daily ET of 0.63 cm d−1. The mean daily ET value was 13% lower than the reference ET of 0.72 cm d−1. During the 20/4/2022–15/6/2022 HI, total ET ranged from 14 to 36 cm, with a mean of 21 cm and a mean daily ET of 0.37 cm d−1 (Figure 3). The mean daily ET value was 29% lower than the reference ET of 0.52 cm d−1. The differences between mean daily ET and reference ET arise due to variations in environmental conditions, crop characteristics, and management practices that deviate from the ideal conditions assumed for reference ET [32].
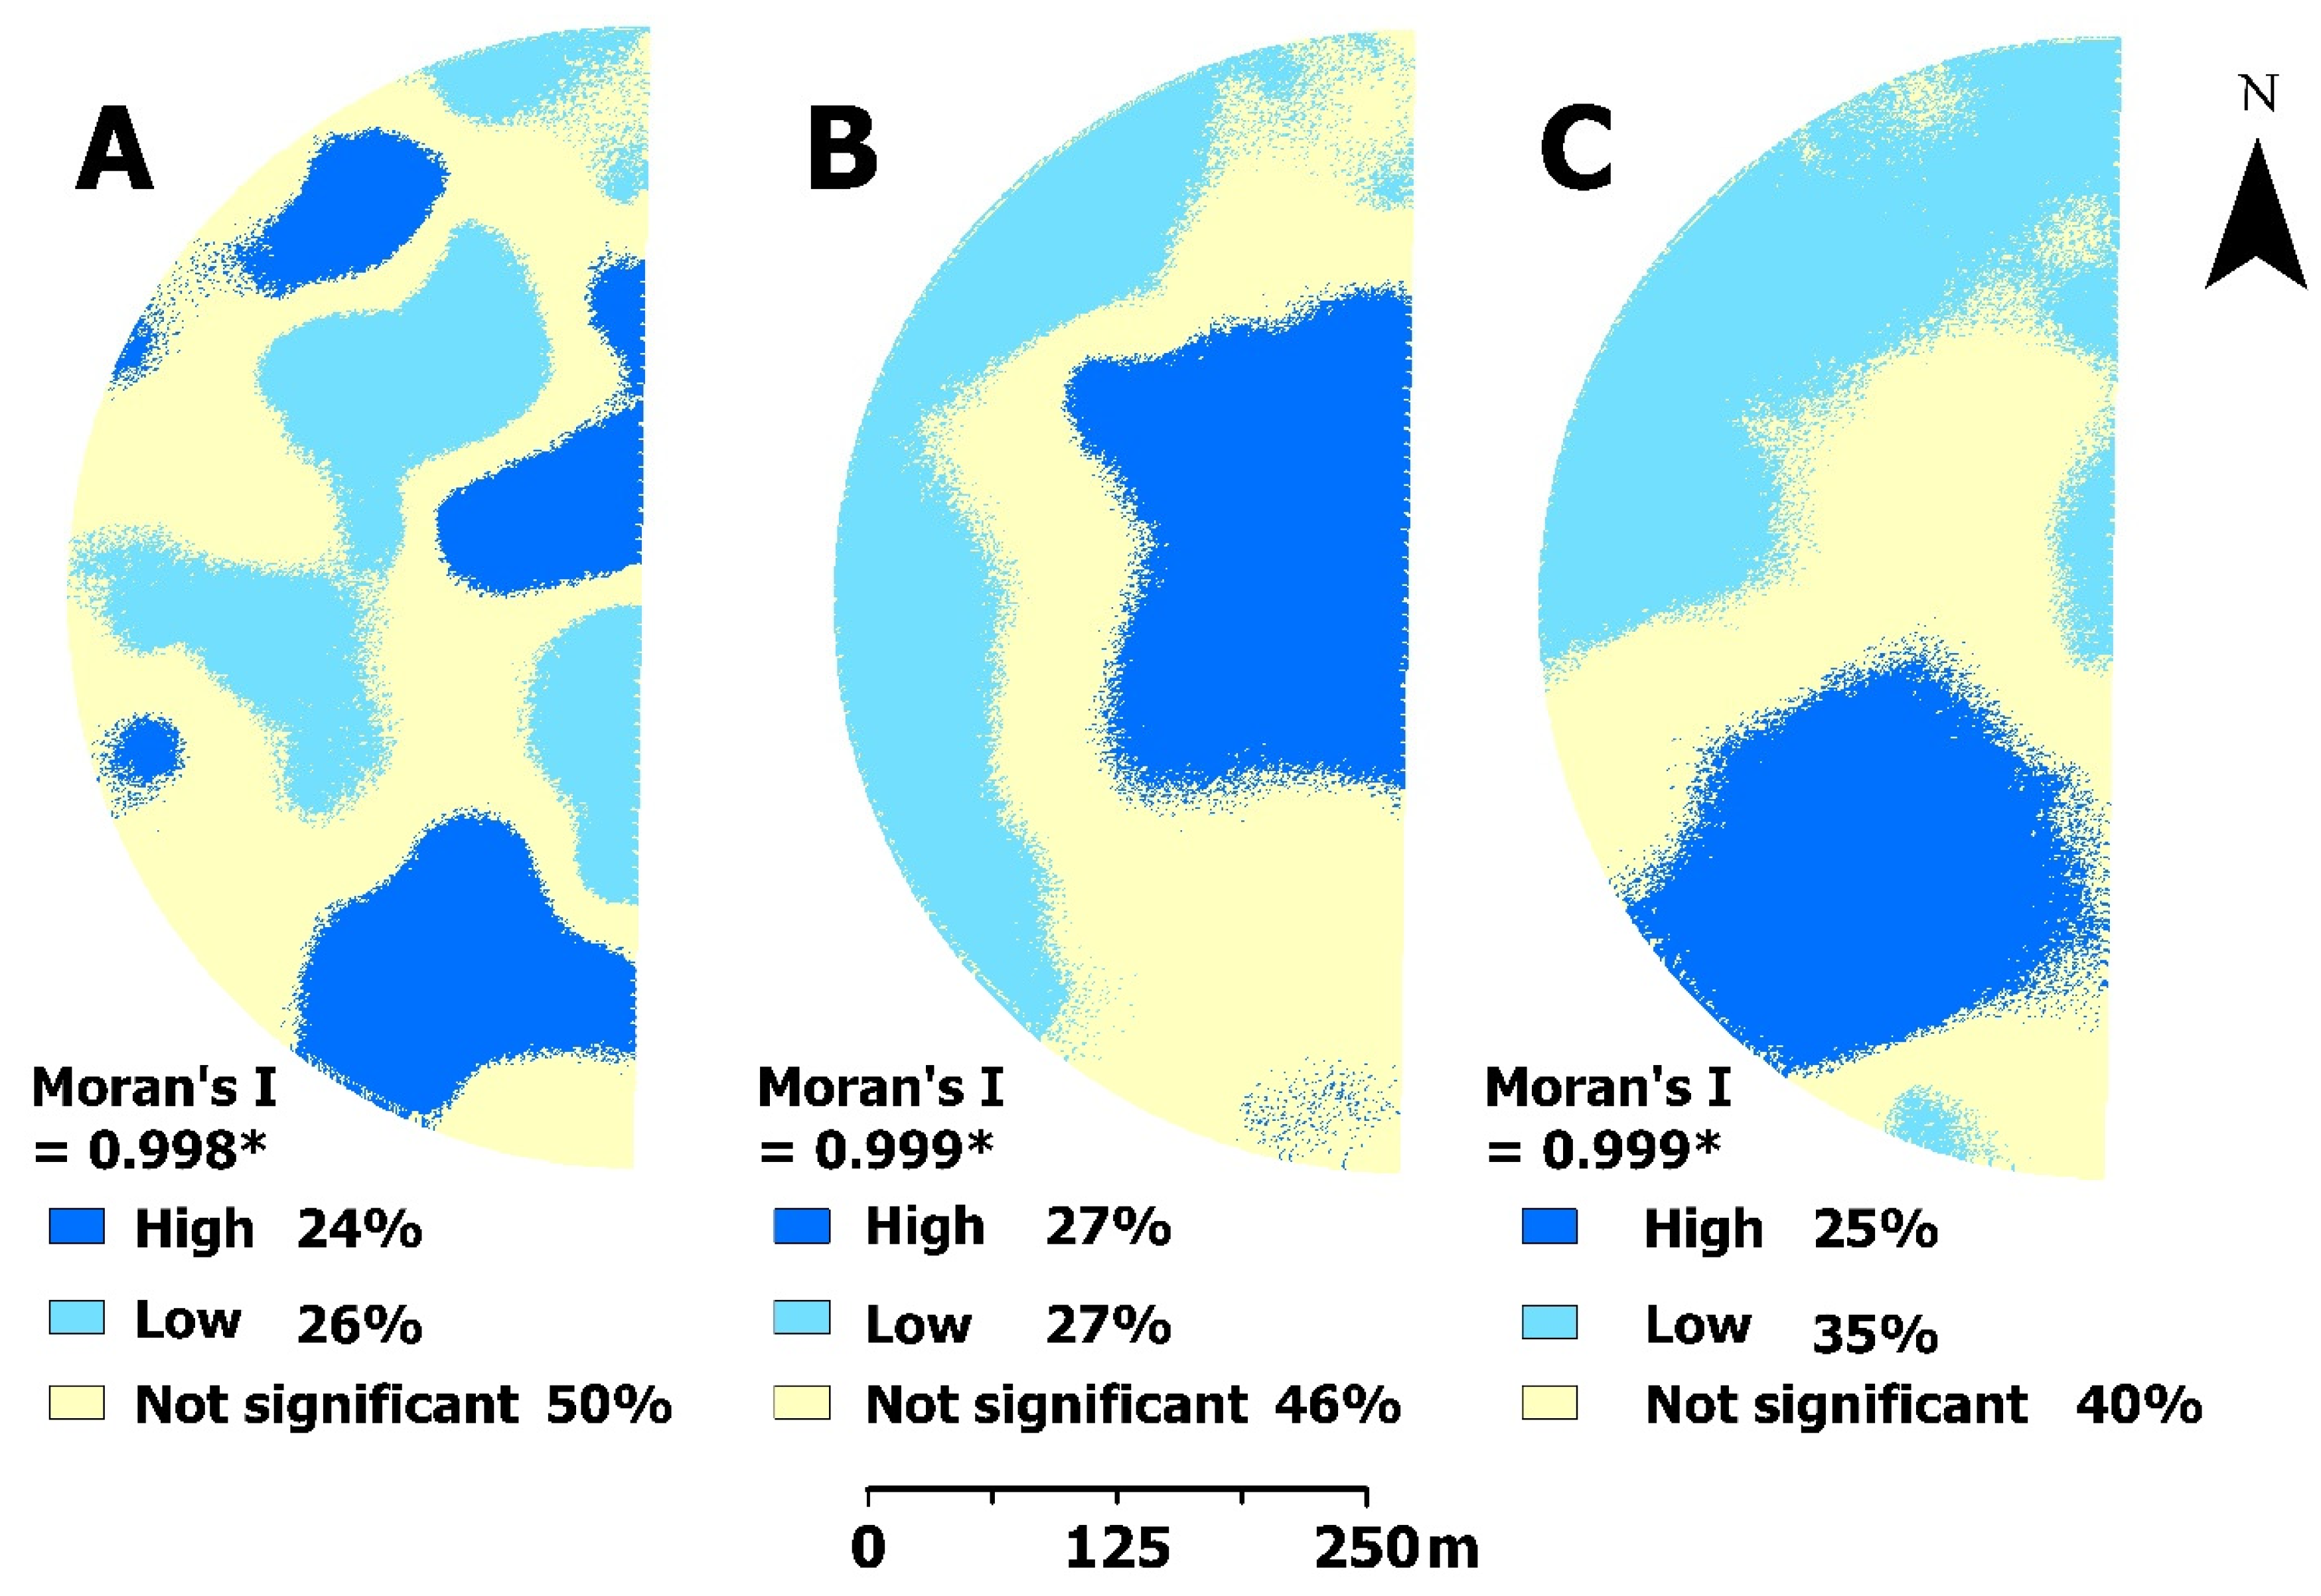
There is significant clustering and strong spatial autocorrelation in the estimated ET values for each of the three alfalfa HIs, as indicated by positive Global Moran’s I values close to 1 (p < 0.001 for all HIs). While the Local Moran’s I approach does not use specific thresholds to determine the magnitude of clustered values, high clusters generally coincided with ET z-score values > 1, while low clusters coincided with ET z-score values of <−1. This means that the significant clusters in the maps represent the highest or lowest 15% of ET values in the field. Although the percentage of the field classified as significant (p < 0.05) high and low ET clusters were similar among harvests, the spatial patterns were unique for each HI (Figure 4). The smaller patches of similar ET values for the 12/5/2021 to 9/6/2021 HI likely relate to moisture patterns related to snowmelt at the beginning of the season [37]. The larger patches of similar ET values for the 9/6/2021 to 15/7/2021 HI likely result from the uniform irrigation applied to the field later in the season, which resulted in larger patches.

3.3. Spatial Variation in Biomass Yield

The second objective of the study was to describe the within-field spatial variation in alfalfa biomass yield under uniform irrigation. For the 12/5/2021–9/6/2021 HI, biomass yield ranged from 3.5 Mg ha−1 to 7.5 Mg ha−1 with a mean of 5.2 Mg ha−1 (Figure 5). For the 9/6/2021–15/7/2021 HI, biomass yield ranged from 2.1 Mg ha−1 to 4.6 Mg ha−1 with a mean of 3.6 Mg ha−1. For the 20/4/2022–15/6/2022 HI, biomass yield ranged from 3.8 Mg ha−1 to 9.7 Mg ha−1 with a mean of 6.6 Mg ha−1.
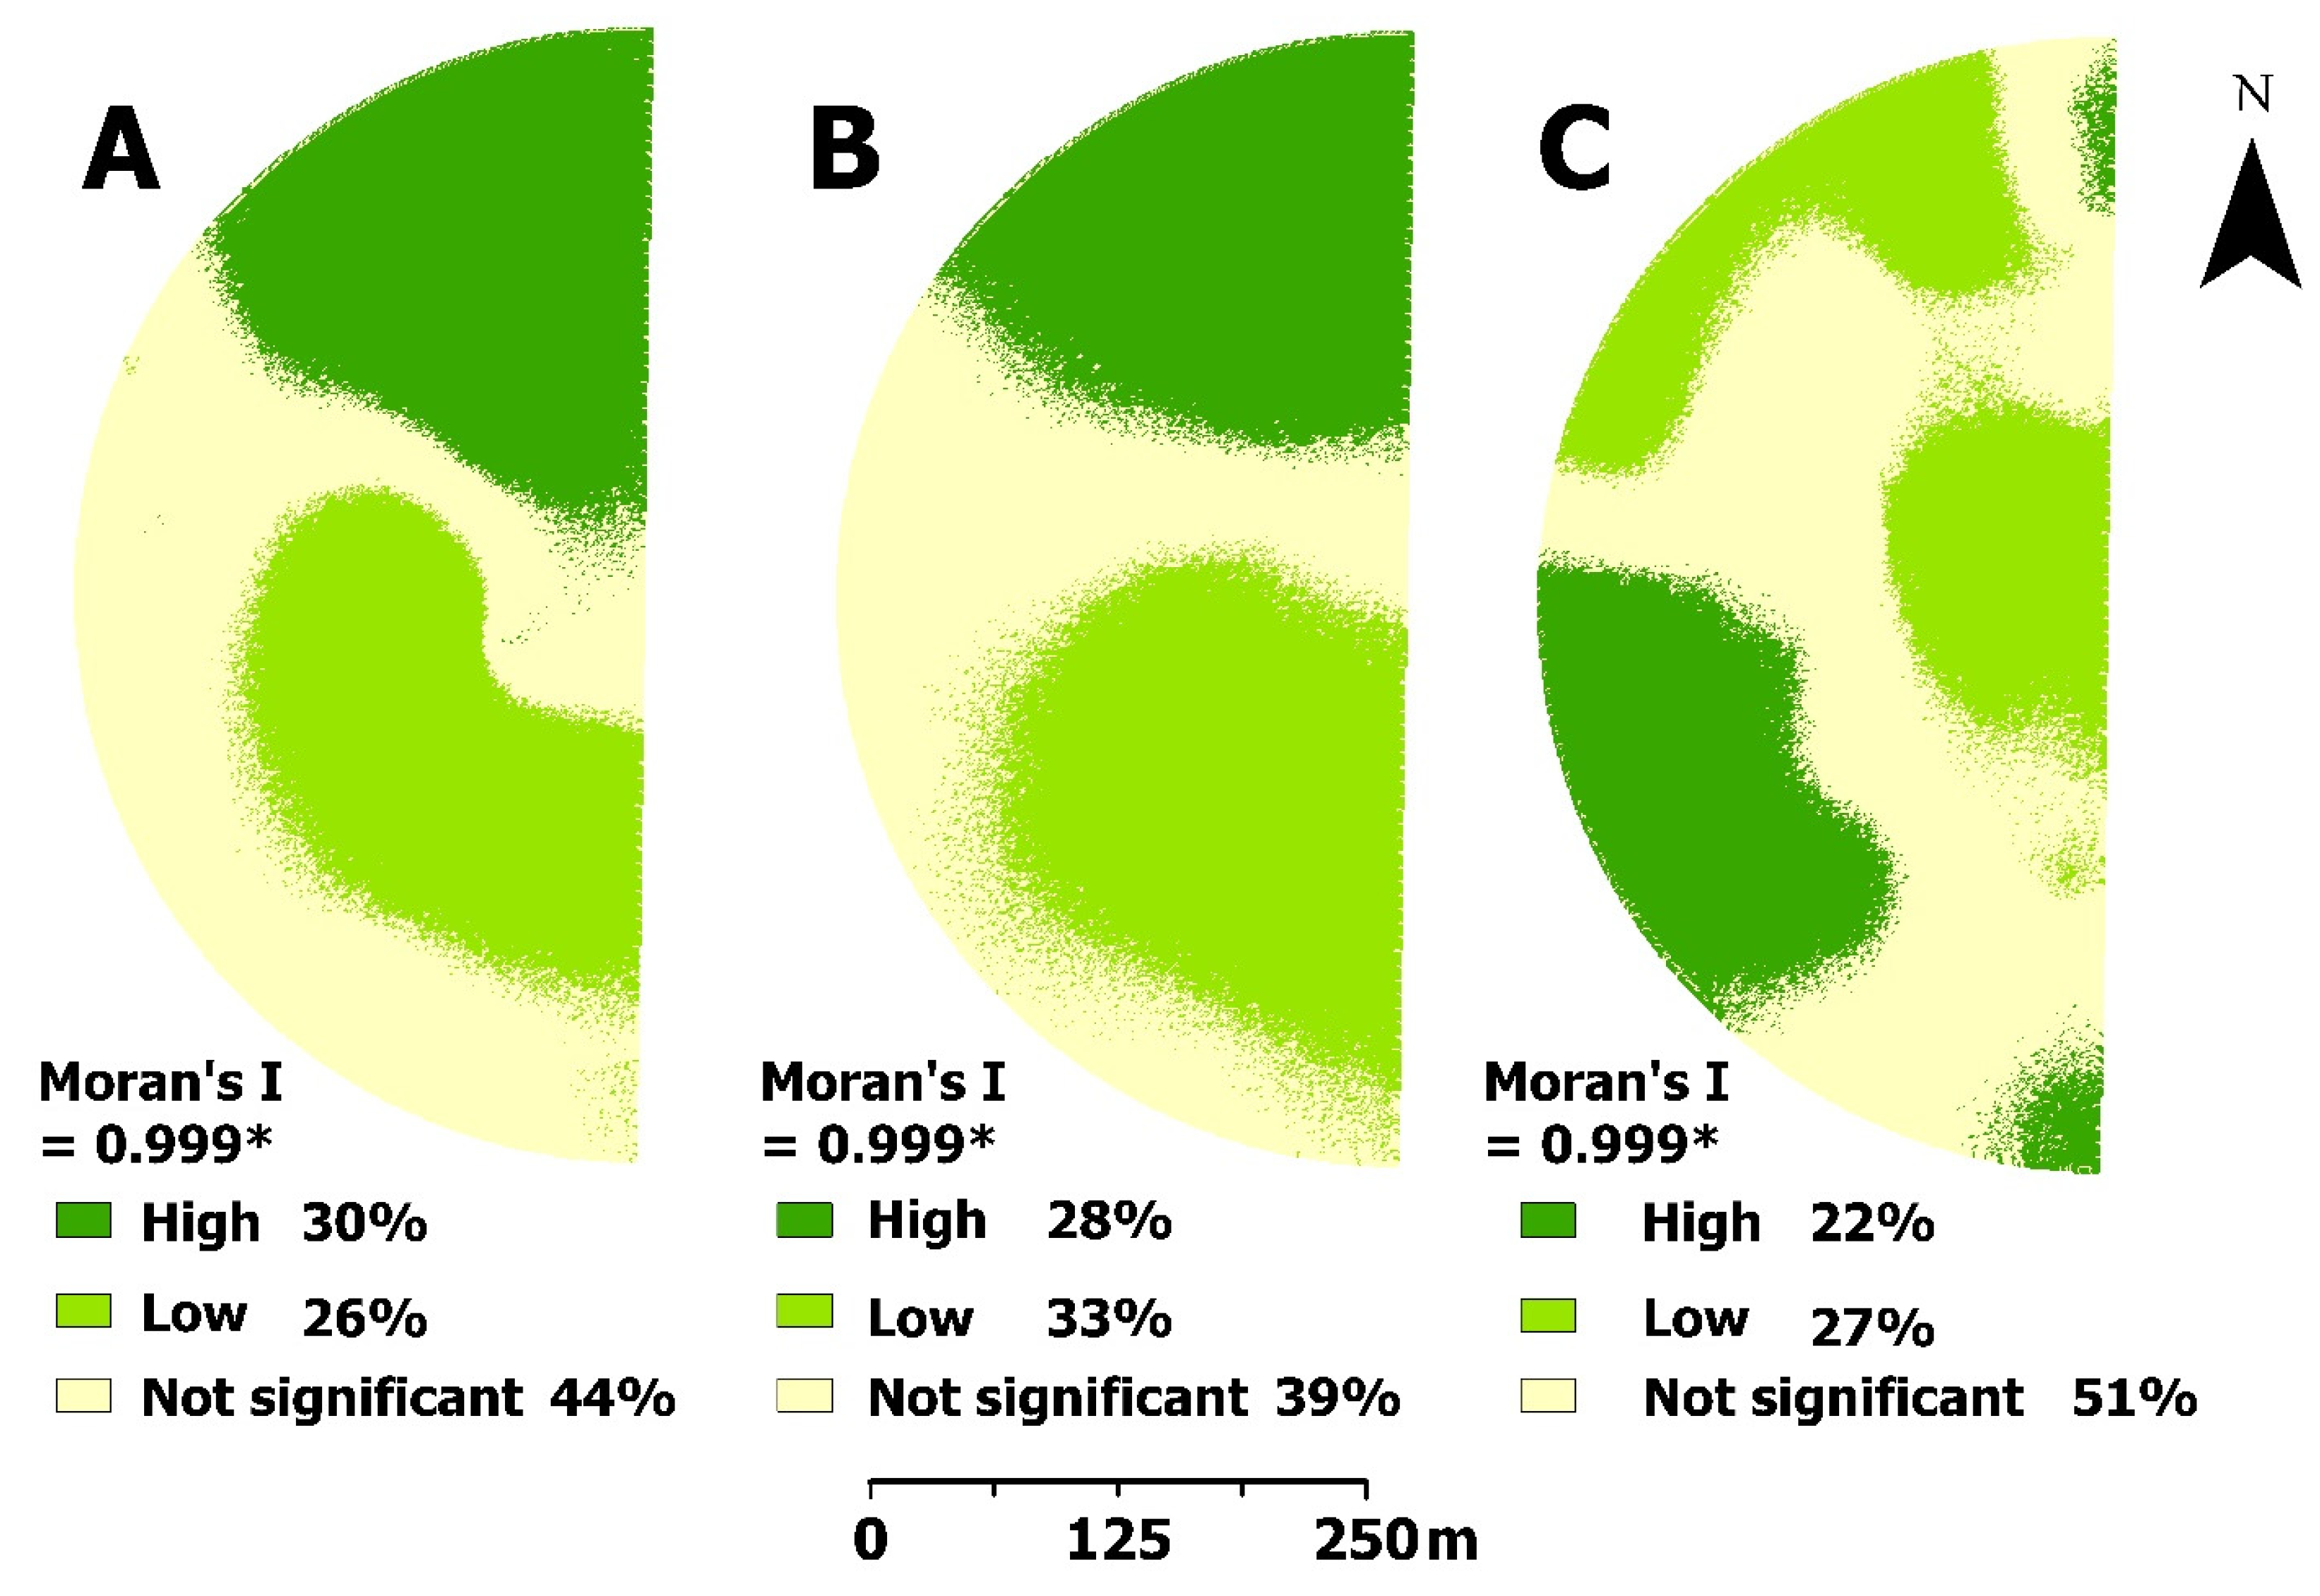
There is significant clustering and strong autocorrelation of alfalfa biomass yield for each of the three alfalfa HI, as indicated by positive Global Moran’s I value close to 1 (p < 0.001 for all HIs). While the Local Moran’s I approach does not use specific thresholds to determine the magnitude of clustered values, the high clusters generally coincided with biomass yield z-score values > 1, while low clusters coincided with biomass yield z-score values of <−1. Thus, clusters represent the highest 15% and lowest 15% of values for the variables being investigated with the Local Moran’s I. Similarity in spatial patterns for HIs within 2021 (Figure 6A,B) are evident but a different spatial pattern was observed in 2022 (Figure 6C).

3.4. Spatial Variability of Crop Water Productivity

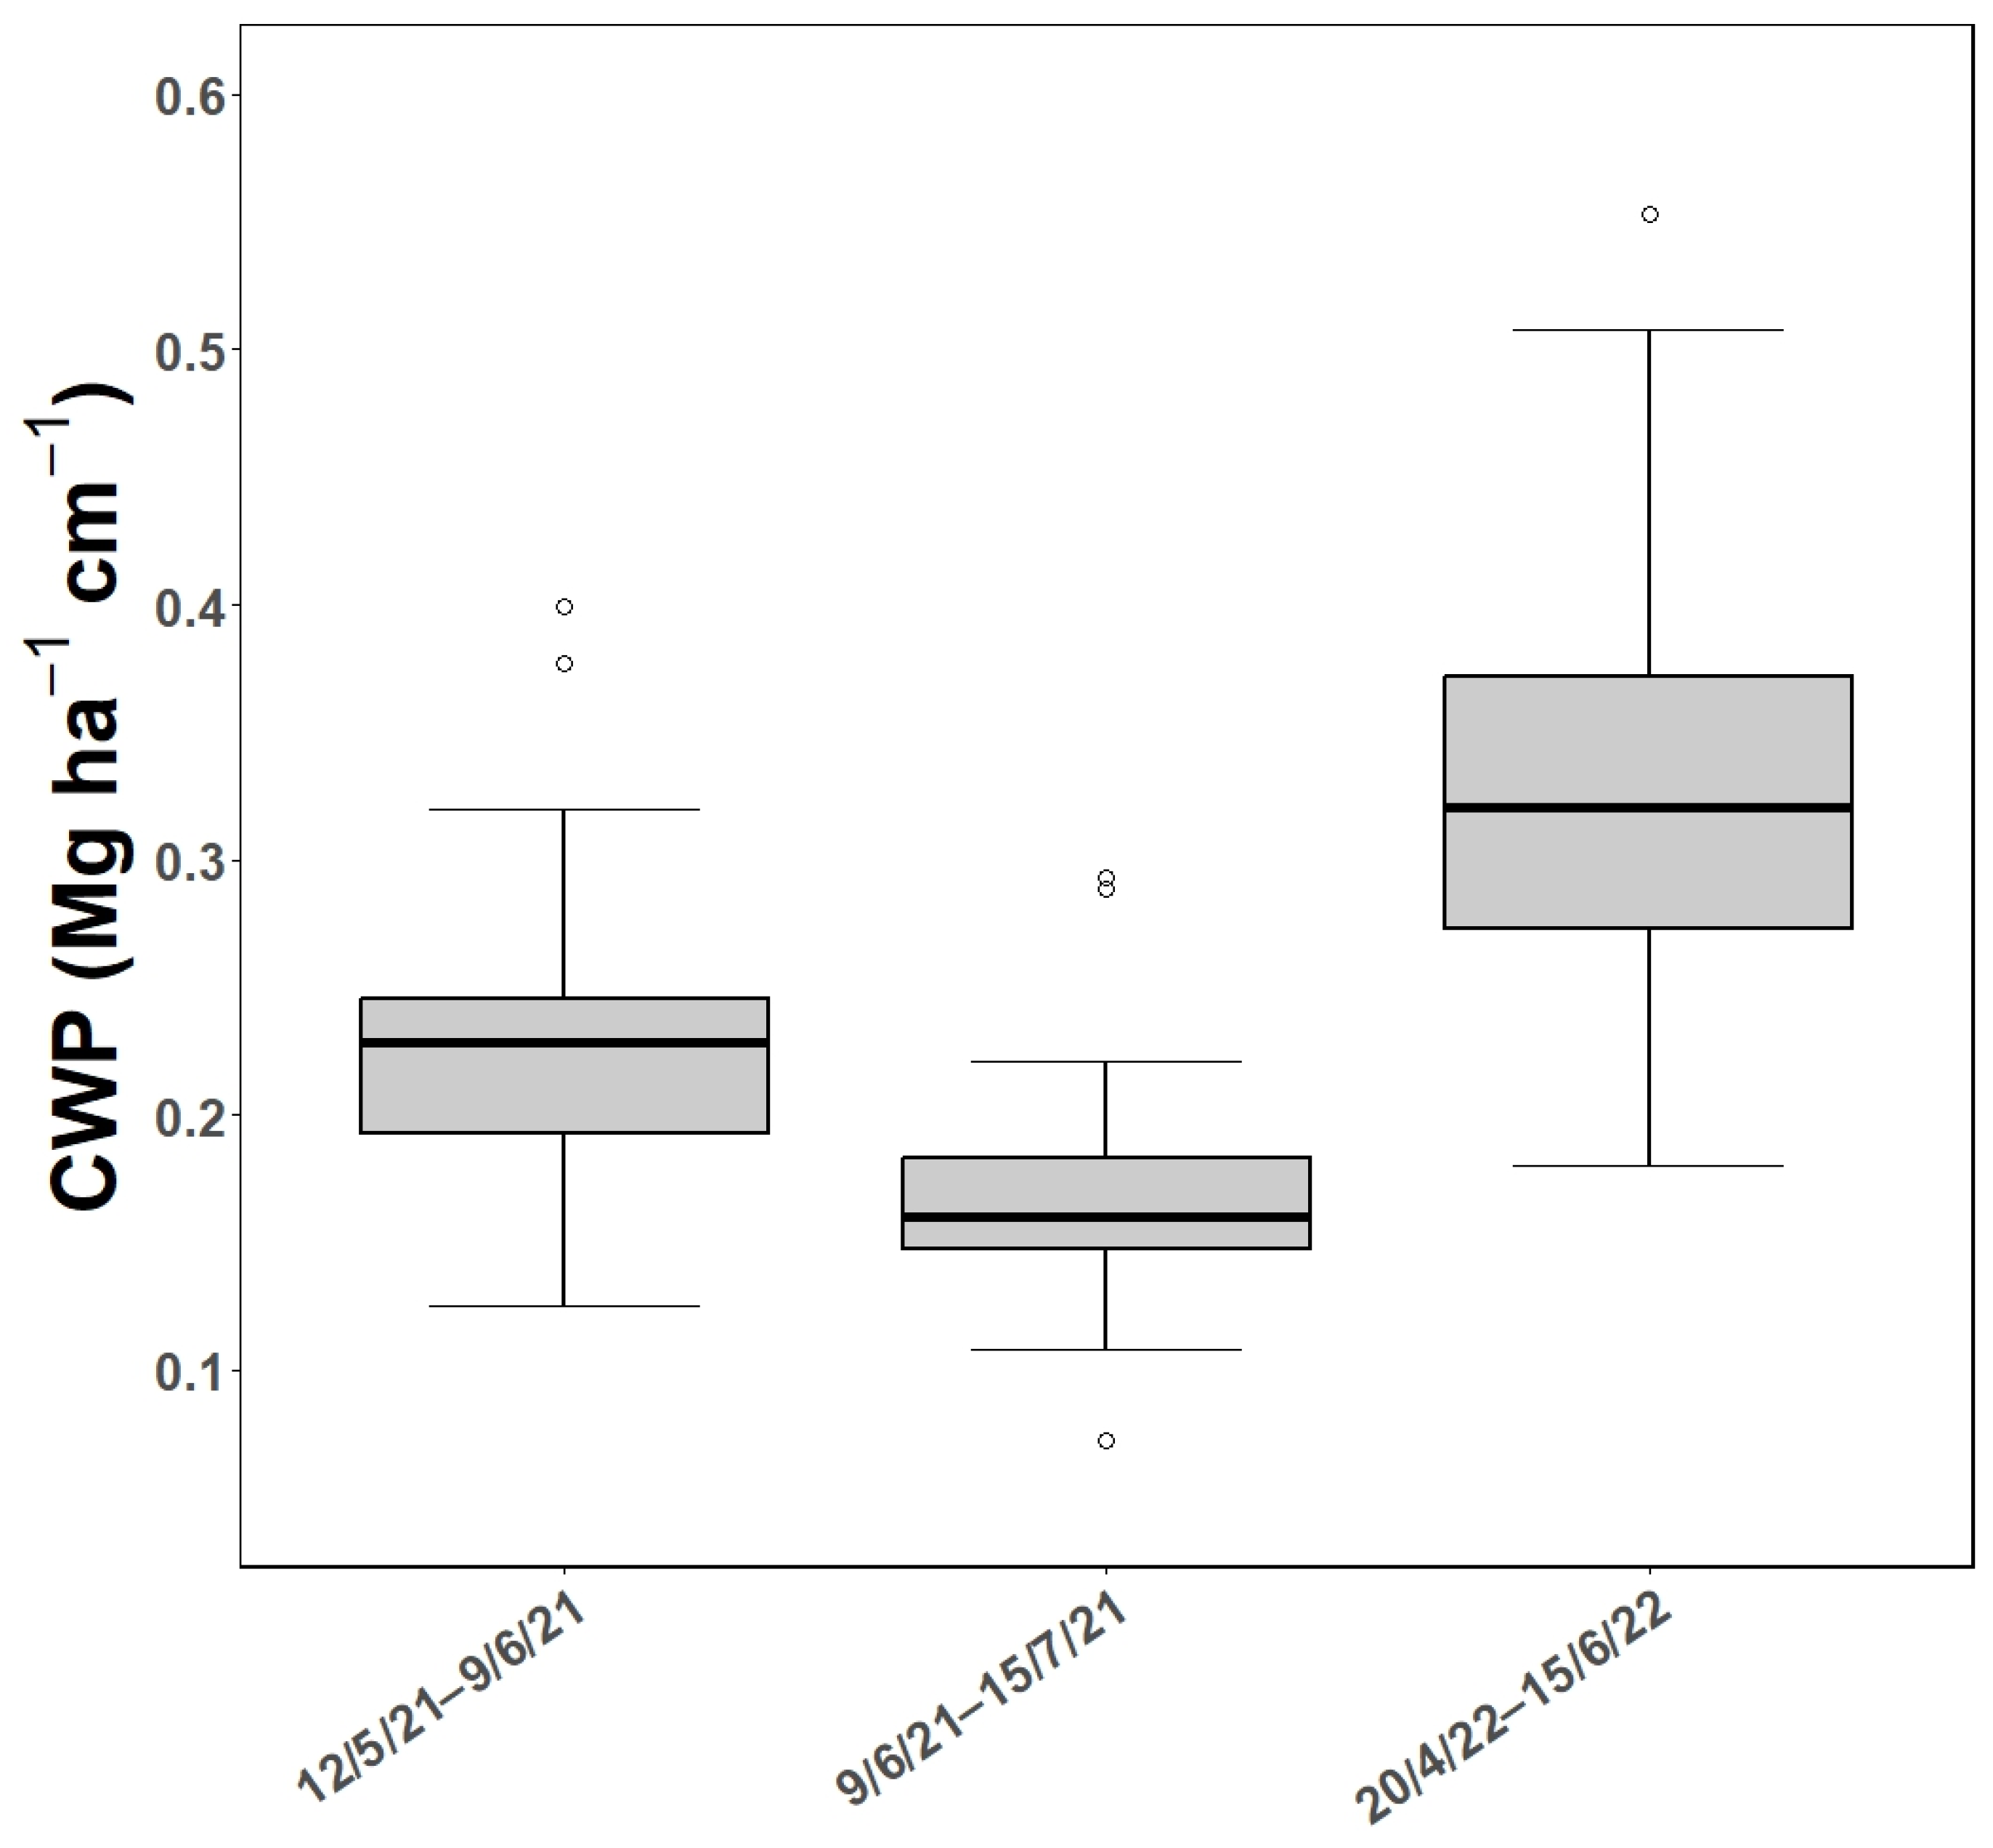
The third objective of this study was to describe the within-field spatial variability of CWP and whether a bivariate analysis of CWP and yield has potential as a means for creating VRI management zones. For the 12/5/21–9/6/21 HI, CWP ranged from 0.12 to 0.45 Mg ha−1 cm−1 with a mean of 0.23 Mg ha−1 cm−1 (Figure 7). For the 9/6/21–15/7/21 HI, CWP ranged from 0.07 to 0.30 Mg ha−1 cm−1 with a mean of 0.17 Mg ha−1 cm−1. For the 20/4/22–15/6/22 HI, CWP ranged from 0.20 to 0.54 Mg ha−1 cm−1 with a mean of 0.33 Mg ha−1 cm−1.
The spatial patterns of CWP were evaluated with biomass yield using bivariate Global and Local Moran’s I tests for each HI. This bivariate approach enhances understanding of where and why VRI zones need different irrigation rates. For each HI, the calculated bivariate Global Moran’s I test showed significant clustering (Figure 8) with strong spatial autocorrelation between biomass yield and CWP, as indicated by values close to 1 (p < 0.001 for all HIs). Biomass yield is listed as the first variable and CWP as the second, meaning that ‘high–low’ areas represent regions with high biomass yield and low CWP. While the bivariate Local Moran’s I test does not use specific thresholds to determine cluster magnitude, high–high clusters generally coincided with biomass yield and CWP z-score values > 1, while low–low clusters coincided with biomass yield and CWP z-score values of < −1. Among the three HIs, the 12/5/21–9/6/21 HI exhibited the highest Global Moran’s I value, indicating the strongest clustering. In this harvest, high–high (26%) and low–low (35%) areas were the majority of the field, with minimal high–low and low–high areas (Figure 8A). In contrast, the 9/6/21–15/7/21 HI had a higher percentage of low–high areas (13%) and a lower percent of high–high areas (13%), leading to a decrease in the Global Moran’s I value (Figure 8B). For the 20/4/22–15/6/22 HI, the proportion of high–high (17%) and not significant (47%) areas increased compared to the 9/6/21–15/7/21 HI, resulting in a higher Global Moran’s I value (Figure 8C).

4. Discussion

4.1. Within-Field Variation in Crop Evapotranspiration

The within-field variation in ET under uniform irrigation was extensive, with more than a two-fold difference between areas of high and low ET (Figure 3). The mean ET rates for the first irrigated alfalfa harvests of the year were 22 cm in 2021 and 21 cm in 2022, which are comparable to the ET rates of 22 and 24 cm reported in arid regions in other studies [2]. Although our study did not investigate the specific causes of ET variation, several factors may contribute to these differences. Potential influences include variations in plant density [5], water redistribution due to lateral flow [27], differences in soil layering and its effect on water availability at deeper depths [20], and variation in snow accumulation and melting patterns [37]. Snow accumulation and melting patterns, in particular, play a crucial role in the first sampling period of the year, potentially driving temporal variation between harvests. If ET variation were primarily driven by permanent topographic or soil properties, we would expect more consistent spatial patterns across multiple harvests. However, the observed ET patterns varied considerably among the three HIs, even under uniform irrigation (Figure 4). The significant within-field ET variation (Figure 3) suggests that VRI could be beneficial for irrigated alfalfa. However, because ET spatial patterns were inconsistent across HIs, VRI zones based on ET would need to be adjusted for each HI to maximize CWP [8,38].
The application of temporally dynamic VRI zones could be feasible with the use of emerging technology. For example, remote sensing has recently emerged as a valuable approach for estimating the spatiotemporal variation in ET in alfalfa [39,40,41]. Tools such as OpenET, a web-based platform, utilize satellite imagery and climate data to calculate ET, providing ET estimates within ±10% of in situ measurements [40]. Satellite-derived vegetation indices, such as the Normalized Difference Vegetation Index (NDVI), processed in Google Earth Engine and daily reference crop ET, have proven effective in mapping alfalfa ET [39]. Model approaches like the Mapping EvapoTranspiration at High Resolution with Internalized Calibration (METRIC) and the Simplified Surface Energy Balance approach (SSEBop) have been compared to reference ET estimates, showing strong correlations: METRIC explained 93.07% of alfalfa ET variability, while SSEBop explained 86.01% of alfalfa ET across the full growing season in New Mexico [41]. These approaches, combining remotely sensed vegetation indices with reference ET conditions, enable the creation of spatial ET maps that support irrigation management decisions within the season [38].

4.2. Spatial Variability of Biomass Yield

The spatial variation in alfalfa biomass was extensive, with two-fold differences between low- and high-yielding areas in each HI (Figure 5). Several authors have reported similar occurrences of low- and high-yielding areas within the same alfalfa field. For instance, Kayad et al. [42] observed alfalfa biomass yields ranging from 2.0 Mg ha−1 to 7.0 Mg ha−1 within a single harvest, while Madugundu et al., [11] found that 49% of their alfalfa yields were between 4 and 6 Mg ha−1, with 34% exceeding 6 Mg ha−1 and 17% falling below 4 Mg ha−1. The high variability of biomass yield has been attributed to factors such as differences in plant-available soil water [13,38], nutrients [5,6], slope [2], plant density [5], and the presence of weeds [43]. The strong clustering of similar yield values in this study suggests that VRI could be beneficial for irrigated alfalfa. While similar spatial patterns of biomass yield were observed between the two harvests in 2021 (Figure 6A,B), the 2022 harvest showed a different pattern (Figure 6C). This further supports the need for dynamic management zones that can be adapted to changing conditions during the growing season.
Recent studies have highlighted the potential of dynamic VRI management zones to improve yield in cotton and maize (Zea mays L). Lacerda et al. [8] demonstrated that implementing dynamic VRI zones increased cotton yield by 4.6% compared to uniform irrigation while reducing irrigation water use by 14%. These zones were initially delineated based on soil texture, apparent soil electrical conductivity, and historical yield maps. Similarly, Fontanet et al. [44] utilized satellite-derived NDVI with soil moisture sensors to inform irrigation rates, reducing irrigation by up to 28%. Their study utilized the HYDRUS-1D model to simulate water flow and root water uptake in maize, demonstrating that the number and configuration of management zones changed dynamically throughout the growing season. They recommend integrating NDVI data and soil moisture sensors to manage irrigation zones effectively. Dynamic VRI management zones, informed by yield estimates and tailored to specific hydrological intervals, could further maximize yield potential [8,44].

4.3. Spatiotemporal Variability of Crop Water Productivity

The within-field variation in CWP was extensive, with more than a two-fold difference between high and low CWP areas across the three HIs (Figure 7). The distinct spatial patterns observed in each HI (Figure 8) likely result from a combination of factors, including underlying topography [2], plant-available soil water [13,38], nutrient availability [5,6], and soil depth [20]. However, if permanent topographic or soil properties were the primary drivers of these patterns, a more consistent spatial distribution across harvests would be expected. Instead, the highly variable patterns observed in this study under uniform irrigation (Figure 8) suggest that other dynamic factors may be influencing CWP variation.
The mean CWP values for the three HIs were 0.23 Mg ha−1 cm−1, 0.17 Mg ha−1 cm−1, and 0.33 Mg ha−1 cm−1, respectively, falling within the range reported in previous studies (0.08 Mg ha−1 cm−1 to 0.33 Mg ha−1 cm−1; [21,26,27]. The mean CWP for the 9/6/21–15/7/21 HI decreased compared to the 12/5/21–9/6/21 HI (Figure 7). This trend aligns with findings from other studies, which indicate that CWP is typically lower for alfalfa harvested in warmer months and higher during cooler months [22]. Additionally, CWP tends to decline with each successive harvest throughout the year [2,5,21,27].
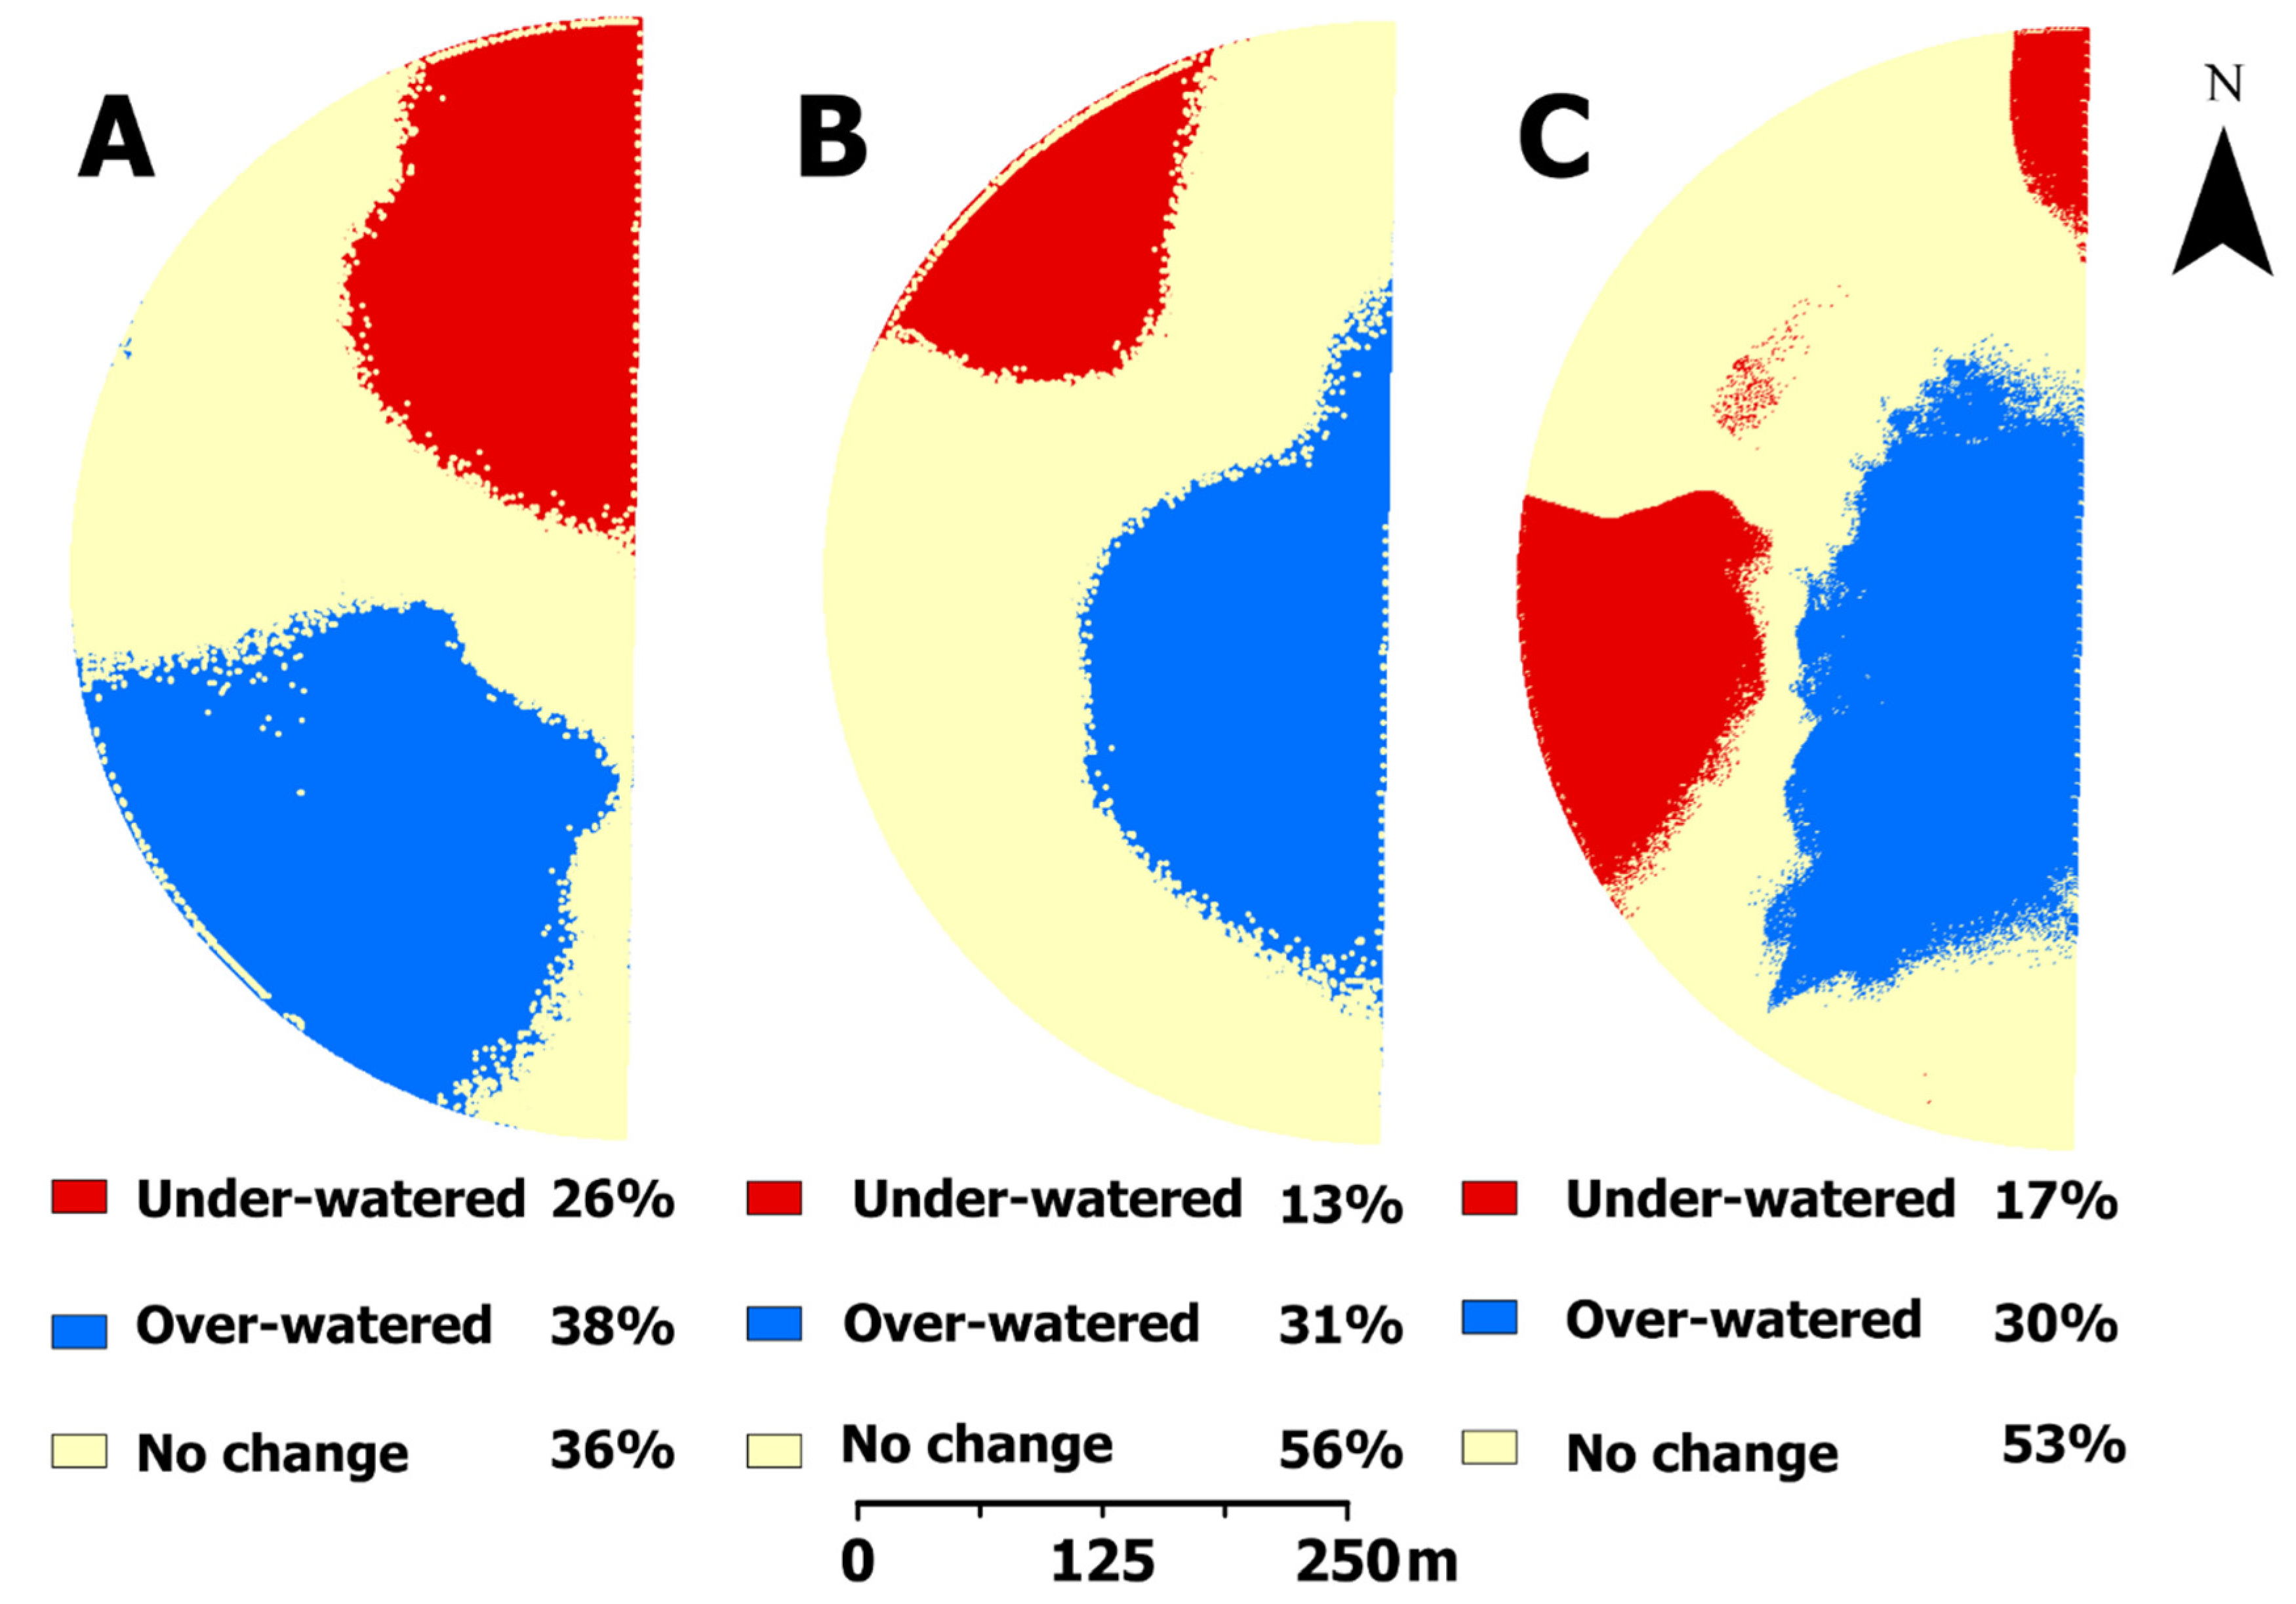
A key principle of VRI management is that CWP can be improved by reducing irrigation in over-watered zones and redirecting water to under-watered zones [45]. The bivariate biomass yield CWP Local Moran’s I results (Figure 8) provide a framework for delineating management zones for VRI [13]. To illustrate potential within-field irrigation redistribution, the bivariate biomass yield CWP Local Moran’s I results were reclassified into three categories: under-watered, over-watered, and no change. High biomass yield high CWP areas are classified as under-watered because they are potentially water-limited and most likely to respond positively to increased irrigation. High biomass yield low CWP areas indicate inefficient water use, likely due to excess irrigation, and are classified as over-watered. Similarly, low biomass yield low CWP areas are also classified as over-watered, as their limited productivity is likely caused by factors other than water availability, such as nutrient deficiencies [5,6], shallow soil profiles with root limiting horizons [13,20], and/or weed infestations [43]. Low biomass yield, high CWP areas, and areas classified as not significant require no irrigation adjustment, as they are already using water efficiently.
Using this classification, an adjusted irrigation map (Figure 9) was created. For the 12/5/21–9/6/21 HI, there is 12% more over-watered than under-watered area of the field (Figure 9A). For the 9/6/21–15/7/21 HI, there is 18% more over-watered than under-watered area of the field. For the 20/4/22–15/6/22 HI, there is 13% more over-watered than under-watered area of the field. While the exact irrigation adjustment needed for specific management zones is uncertain, classifying the field into over-watered and under-watered zones provides a starting point for implementing VRI. This approach allows site-specific irrigation rates to be adjusted accordingly, optimizing water use efficiency and improving CWP.
The approach demonstrated in this study to delineate management zones for VRI was time- and labor-intensive, requiring soil and yield sample collection as well as extensive data analysis. While this method may not be practical for widespread application, its underlying principles remain valuable and can be implemented more efficiently through technological advancements. For instance, CWP estimation can be achieved using remotely sensed ET and biomass yield data [1,3,22,39,41,42,46]. Satellite-derived vegetation indices, combined with daily reference ET, have proven effective for mapping ET [39]. Similarly, biomass yield estimates can be obtained from satellite or Unmanned Aircraft System (UAS) multi-spectral imagery using vegetation indices such as NDVI [1,22,41]. UAS imagery, in particular, can be collected at higher spatial and temporal resolutions compared to satellite imagery, making it suitable for certain VRI applications [47,48]. Additionally, remotely sensed data can be used throughout the growing season to reassess and refine VRI zones, allowing for more adaptive and efficient irrigation management.

4.4. Water Conservation

Rising global temperatures [49], increasing drought frequency [4], and growing water demands present significant challenges to water availability and management [5,6]. Higher temperatures accelerate ET rates, increasing irrigation demands to sustain crop yields [4]. Prolonged droughts further threaten agricultural productivity and food security, highlighting the urgent need for effective water conservation strategies [38]. Additionally, population growth and the need for expanded food production intensify pressure on freshwater resources, necessitating improved water management practices [2,3]. To ensure future water security, proactive and adaptive water management strategies, such as VRI, are essential for mitigating these growing challenges. VRI has been shown to increase CWP while maintaining yield [45], and can reduce irrigation in alfalfa by 2% compared to uniform irrigation [10]. While a 2% reduction in irrigation may seem modest, it can translate to significant water savings for a globally cultivated crop like alfalfa [20,21,22]. Expanding the use of VRI will be essential for improving CWP, sustaining agricultural productivity, and ensuring long-term water security in the face of these growing challenges.

5. Conclusions

The potential value of VRI as an approach for more efficient irrigation lies in its ability to improve CWP by reducing areas of over- or under-irrigation within fields. This study highlights significant within-field variation in alfalfa ET, biomass yield, and CWP, with nearly two-fold differences observed between high and low values within each HI. These results suggest that dynamic VRI management zones, derived from bivariate Moran’s I clustering of biomass yield and CWP, could optimize water use efficiency. While the precise adjustments required for irrigation in specific zones remain uncertain, classifying the field into over-watered and under-watered zones provides a solid foundation for VRI implementation. Specifically, the bivariate Global Moran’s I analysis indicates that 12–18% more of the field was over-watered than under-watered in this study, suggesting that reducing irrigation in over-watered zones could enhance CWP. Overall, these results highlight the potential of alfalfa as a viable candidate crop for VRI, particularly as water conservation becomes increasingly critical. Additionally, remote sensing has proven to be a valuable tool for estimating spatio-temporal variation in ET and biomass yield of alfalfa, emphasizing the need for future research to integrate remotely sensed data in assessing the long-term benefits of VRI for improving alfalfa productivity and water management.

Author Contributions

Conceptualization, K.H., R.K. and N.C.H.; methodology, K.H., R.K., R.S., A.H., M.A.Y., B.G.H. and N.C.H.; software, K.H., R.K. and N.C.H.; validation, K.H. and N.C.H.; formal analysis, K.H. and R.K.; investigation, K.H.; resources, R.S., B.G.H. and N.C.H.; data curation, K.H. and N.C.H.; writing—original draft preparation, K.H., R.K. and N.C.H.; writing—review and editing, K.H., R.K., R.S., A.H., B.G.H., M.A.Y. and N.C.H.; visualization, K.H., R.K., and N.C.H.; supervision, R.K., R.S., and N.C.H.; project administration, R.S., B.G.H., M.A.Y. and N.C.H.; funding acquisition, R.K., R.S., B.G.H., M.A.Y. and N.C.H. All authors have read and agreed to the published version of the manuscript.

Funding

This research was funded by the US–Israel Agricultural Research and Development Fund, IS-5218-19, and the USDA Western Sustainable Agriculture Research and Education Program, SW19-909.

Institutional Review Board Statement

Not applicable.

Informed Consent Statement

Not applicable.

Data Availability Statement

Interested parties can contact the corresponding author regarding data availability.

Acknowledgments

Several people not listed as authors assisted with the field surveys: Alvin Lusk, Kaitlin Bair, Thomas Armstrong, Kayla Marion, Alton Campbell, Samantha Shumate, Caden Seely, Alexandra Olsen, Miria Barnes, Braxton Underwood, and William Burnett.

Conflicts of Interest

The authors declare no conflicts of interest. The funders had no role in the design of the study; in the collection, analyses, or interpretation of data; in the writing of the manuscript; or in the decision to publish the results.

Abbreviations

The following abbreviations are used in this manuscript:
BDbulk density
CWPcrop water productivity
Ddrainage
ETevapotranspiration
GWCgravimetric water content
HIharvest interval
Iirrigation
METRICMapping EvapoTranspiration at High Resolution with Internalized Calibration
NDVINormalized Difference Vegetation Index
Pprecipitation
Rrunoff
SSEBopSimplified Surface Energy Balance approach
UASUnmanned Aircraft System
VRIvariable rate irrigation
VWCvolumetric water content
∆Θchange in soil water

References

  1. Ghorbanpour, A.K.; Kisekka, I.; Afshar, A.; Hessels, T.; Taraghi, M.; Hessari, B.; Tourian, M.J.; Duan, Z. Crop Water Productivity Mapping and Benchmarking Using Remote Sensing and Google Earth Engine Cloud Computing. Remote Sens. 2022, 14, 4934. [Google Scholar] [CrossRef]
  2. Li, Y.; Su, D. Alfalfa Water Use and Yield under Different Sprinkler Irrigation Regimes in North Arid Regions of China. Sustainability 2017, 9, 1380. [Google Scholar] [CrossRef]
  3. Poudel, U.; Stephen, H.; Ahmad, S. Evaluating Irrigation Performance and Water Productivity Using EEFlux ET and NDVI. Sustainability 2021, 13, 7967. [Google Scholar] [CrossRef]
  4. Bodner, G.; Nakhforoosh, A.; Kaul, H.-P. Management of Crop Water under Drought: A Review. Agron. Sustain. Dev. 2015, 35, 401–442. [Google Scholar] [CrossRef]
  5. Djaman, K.; Smeal, D.; Koudahe, K.; Allen, S. Hay Yield and Water Use Efficiency of Alfalfa under Different Irrigation and Fungicide Regimes in a Semiarid Climate. Water 2020, 12, 1721. [Google Scholar] [CrossRef]
  6. Kang, J.; Hao, X.; Zhou, H.; Ding, R. An Integrated Strategy for Improving Water Use Efficiency by Understanding Physiological Mechanisms of Crops Responding to Water Deficit: Present and Prospect. Agric. Water Manag. 2021, 255, 107008. [Google Scholar] [CrossRef]
  7. Kaivosoja, J.; Hautsalo, J.; Heikkinen, J.; Hiltunen, L.; Ruuttunen, P.; Näsi, R.; Niemeläinen, O.; Lemsalu, M.; Honkavaara, E.; Salonen, J. Reference Measurements in Developing UAV Systems for Detecting Pests, Weeds, and Diseases. Remote Sens. 2021, 13, 1238. [Google Scholar] [CrossRef]
  8. Lacerda, L.; Snider, J.; Cohen, Y.; Liakos, V.; Levi, M.; Vellidis, G. Correlation of UAV and Satellite-Derived Vegetation Indices with Cotton Physiological Parameters and Their Use as a Tool for Scheduling Variable Rate Irrigation in Cotton. Precis. Agric. 2022, 23, 2089–2114. [Google Scholar] [CrossRef]
  9. Flint, E.A.; Hopkins, B.G.; Svedin, J.D.; Kerry, R.; Heaton, M.J.; Jensen, R.R.; Campbell, C.S.; Yost, M.A.; Hansen, N.C. Irrigation Zone Delineation and Management with a Field-Scale Variable Rate Irrigation System in Winter Wheat. Agronomy 2023, 13, 1125. [Google Scholar] [CrossRef]
  10. Li, M.; Wang, Y.; Guo, H.; Ding, F.; Yan, H. Evaluation of Variable Rate Irrigation Management in Forage Crops: Saving Water and Increasing Water Productivity. Agric. Water Manag. 2023, 275, 108020. [Google Scholar] [CrossRef]
  11. Madugundu, R.; Al-Gaadi, K.A.; Tola, E.; Zeyada, A.M.; Alameen, A.A.; Edrris, M.K.; Edrees, H.F.; Mahjoop, O. Impact of Field Topography and Soil Characteristics on the Productivity of Alfalfa and Rhodes Grass: RTK-GPS Survey and GIS Approach. Agronomy 2022, 12, 2918. [Google Scholar] [CrossRef]
  12. Patil, V.C.; Al-Gaadi, K.A.; Madugundu, R.; Tola, E.H.; Marey, S.; Aldosari, A.; Biradar, C.M.; Gowda, P.H. Assessing Agricultural Water Productivity in Desert Farming System of Saudi Arabia. IEEE J. Sel. Top. Appl. Earth Obs. Remote Sens. 2014, 8, 284–297. [Google Scholar] [CrossRef]
  13. Svedin, J.D. Characterizing the Spatial Variation of Crop Water Productivity for Variable-Rate Irrigation Management. Master’s Thesis, Brigham Young University, Provo, UT, USA, 2018. [Google Scholar]
  14. Hansen, N.; Flint, E.; Hopkins, A.; Larsen, I.; Kerry, R.; Hopkins, B.; Jensen, R.; Heaton, M. On-Farm Evaluation of Variable Rate Irrigation for Winter Wheat in Semi-Arid Western USA. In Precision Agriculture’23; Wageningen Academic Publishers: Wageningen, The Netherlands, 2023; pp. 269–276. [Google Scholar]
  15. O’Shaughnessy, S.; Evett, S.; Colaizzi, P. Dynamic Prescription Maps for Site-Specific Variable Rate Irrigation of Cotton. Agric. Water Manag. 2015, 159, 123–138. [Google Scholar] [CrossRef]
  16. Sui, R.; Fisher, D.K.; Reddy, K.N. Yield Response to Variable Rate Irrigation in Corn. J. Agric. Sci. 2015, 7, 11. [Google Scholar] [CrossRef]
  17. Sui, R.; Yan, H. Field Study of Variable Rate Irrigation Management in Humid Climates: Field Study of Variable Rate Irrigation Management. Irrig. Drain. 2017, 66, 327–339. [Google Scholar] [CrossRef]
  18. Crosby, T.W.; Wang, Y. Effects of Different Irrigation Management Practices on Potato (Solanum tuberosum L.). Sustainability 2021, 13, 10187. [Google Scholar] [CrossRef]
  19. Hedley, C.; Yule, I.; Tuohy, M.; Vogeler, I. Key Performance Indicators for Simulated Variable-Rate Irrigation of Variable Soils in Humid Regions. Trans. ASABE 2009, 52, 1575–1584. [Google Scholar] [CrossRef]
  20. Grimes, D.W.; Wiley, P.L.; Sheesley, W.R. Alfalfa Yield and Plant Water Relations with Variable Irrigation. Crop Sci. 1992, 32, 1381–1387. [Google Scholar] [CrossRef]
  21. Wang, L.; Xie, J.; Luo, Z.; Niu, Y.; Coulter, J.A.; Zhang, R.; Lingling, L. Forage Yield, Water Use Efficiency, and Soil Fertility Response to Alfalfa Growing Age in the Semiarid Loess Plateau of China. Agric. Water Manag. 2021, 243, 106415. [Google Scholar] [CrossRef]
  22. Al-Gaadi, K.A.; Patil, V.C.; Tola, E.H.; Madugundu, R.; Marey, S.A.; Al-Omran, A.; Al-Dosari, A. Variable Rate Application Technology for Optimizing Alfalfa Production in Arid Climate. Int. J. Agric. Biol. 2015, 17, 71–79. [Google Scholar]
  23. Shewmaker, G.E.; Allen, R.G.; Neibling, W.H. Alfalfa Irrigation and Drought; University of Idaho, College of Agricultural and Life Sciences: Moscow, ID, USA, 2011. [Google Scholar]
  24. Hill, R.; Barker, J.; Lewis, C. Updated Consumptive Use Estimates at EWS Sites. In Crop and Wetland Consumptive Use and Open Water Surface Evaporation for Utah, 1st ed.; Utah State University: Logan, UT, USA, 2011; Appendix J; pp. 6–101. [Google Scholar]
  25. Zhang, Q.; Liu, X.; Zhang, Z.; Liu, N.; Li, D.; Hu, L. Melatonin Improved Waterlogging Tolerance in Alfalfa (Medicago Sativa) by Reprogramming Polyamine and Ethylene Metabolism. Front. Plant Sci. 2019, 10, 44. [Google Scholar] [CrossRef] [PubMed]
  26. Fink, K.P.; Grassini, P.; Rocateli, A.; Bastos, L.M.; Kastens, J.; Ryan, L.P.; Lin, X.; Patrignani, A.; Lollato, R.P. Alfalfa Water Productivity and Yield Gaps in the US Central Great Plains. Field Crops Res. 2022, 289, 108728. [Google Scholar] [CrossRef]
  27. Lindenmayer, R.B.; Hansen, N.C.; Brummer, J.; Pritchett, J.G. Deficit Irrigation of Alfalfa for Water-savings in the Great Plains and Intermountain West: A Review and Analysis of the Literature. Agron. J. 2011, 103, 45–50. [Google Scholar] [CrossRef]
  28. NRCS Web Soil Survey. Available online: https://websoilsurvey.sc.egov.usda.gov/app/ (accessed on 1 June 2021).
  29. Hammond, K. Spatiotemporal Variation of Alfalfa Leaf Area Index and Crop Water Productivity in an Irrigated Alfalfa Field. Master’s Thesis, Brigham Young University, Provo, UT, USA, 2023. [Google Scholar]
  30. Kerry, R.; Oliver, M.A. Variograms of Ancillary Data to Aid Sampling for Soil Surveys. Precis. Agric. 2003, 4, 261–278. [Google Scholar] [CrossRef]
  31. Svedin, J.D.; Kerry, R.; Hansen, N.C.; Hopkins, B.G. Identifying Within-Field Spatial and Temporal Crop Water Stress to Conserve Irrigation Resources with Variable-Rate Irrigation. Agronomy 2021, 11, 1377. [Google Scholar] [CrossRef]
  32. Allen, R.G.; Pereira, L.S.; Raes, D.; Smith, M. Crop Evapotranspiration-Guidelines for Computing Crop Water Requirements-FAO Irrigation and Drainage Paper 56; FAO: Rome, Italy, 1998; p. D05109. [Google Scholar]
  33. Bureau of Reclamation AgriMet Columbia-Pacific Northwest Region. Available online: https://www.usbr.gov/pn/agrimet/webarcread.html (accessed on 7 April 2023).
  34. Abdul-Jabbar, A.; Sammis, T.; Lugg, D. Effect of Moisture Level on the Root Pattern of Alfalfa. Irrig. Sci. 1982, 3, 197–207. [Google Scholar] [CrossRef]
  35. Kohl, R.A.; Kolar, J.J. Soil Water Uptake by Alfalfa 1. Agron. J. 1976, 68, 536–538. [Google Scholar] [CrossRef]
  36. Hojilla-Evangelista, M.P.; Selling, G.W.; Hatfield, R.; Digman, M. Extraction, Composition, and Functional Properties of Dried Alfalfa (Medicago sativa L.) Leaf Protein. J. Sci. Food Agric. 2017, 97, 882–888. [Google Scholar] [CrossRef]
  37. Turner, I.; Kerry, R.; Jensen, R.R.; Flint, E.A.; Svedin, J.; Hansen, N.C.; Hopkins, B.; Hammond, K. Automated Analysis of Snowmelt from Sentinel-2 Imagery to Determine Variable Rate Irrigation Zones in the American Mountain West. Geocarto Int. 2023, 38, 2230939. [Google Scholar] [CrossRef]
  38. Smith, R.; Oyler, L.; Campbell, C.; Woolley, E.A.; Hopkins, B.G.; Kerry, R.; Hansen, N.C. A New Approach for Estimating and Delineating Within-Field Crop Water Stress Zones with Satellite Imagery. Int. J. Remote Sens. 2021, 42, 6003–6022. [Google Scholar] [CrossRef]
  39. French, A.N.; Sanchez, C.A.; Wirth, T.; Scott, A.; Shields, J.W.; Bautista, E.; Saber, M.N.; Wisniewski, E.; Gohardoust, M.R. Remote Sensing of Evapotranspiration for Irrigated Crops at Yuma, Arizona, USA. Agric. Water Manag. 2023, 290, 108582. [Google Scholar] [CrossRef]
  40. Sabiston, L.; Sabie, R.; Buenemann, M.; Stringam, B.; Fernald, A. Comparing Field-Scale Eddy Covariance Measurements and Crop Coefficient Estimates of Alfalfa Evapotranspiration to OpenET Model Estimates and Exploring Water Budget Implications in a Dryland Environment. Irrig. Sci. 2024, 1–18. [Google Scholar] [CrossRef]
  41. Tawalbeh, Z.M.; Bawazir, A.S.; Fernald, A.; Sabie, R. Spatiotemporal Variabilities in Evapotranspiration of Alfalfa: A Case Study Using Remote Sensing METRIC and SSEBop Models and Eddy Covariance. Remote Sens. 2024, 16, 2290. [Google Scholar] [CrossRef]
  42. Kayad, A.G.; Al-Gaadi, K.A.; Tola, E.; Madugundu, R.; Zeyada, A.M.; Kalaitzidis, C. Assessing the Spatial Variability of Alfalfa Yield Using Satellite Imagery and Ground-Based Data. PLoS ONE 2016, 11, e0157166. [Google Scholar] [CrossRef]
  43. Canevari, M.; Vargas, R.; Orloff, S. Weed Management in Alfalfa; University of California Division of Agriculture and Natural Resources: Davis, CA, USA, 2007; pp. 1–14. [Google Scholar]
  44. Fontanet, M.; Scudiero, E.; Skaggs, T.H.; Fernàndez-Garcia, D.; Ferrer, F.; Rodrigo, G.; Bellvert, J. Dynamic Management Zones for Irrigation Scheduling. Agric. Water Manag. 2020, 238, 106207. [Google Scholar] [CrossRef]
  45. O’Shaughnessy, S.A.; Evett, S.R.; Colaizzi, P.D.; Andrade, M.A.; Marek, T.H.; Heeren, D.M.; Lamm, F.R.; LaRue, J.L. Identifying Advantages and Disadvantages of Variable Rate Irrigation: An Updated Review. Appl. Eng. Agric. 2019, 35, 837–852. [Google Scholar] [CrossRef]
  46. Al-Gaadi, K.; Madugundu, R.; Tola, E. Temporal Dynamics of Alfalfa Water Use Efficiency under Hyper Arid Conditions of Saudi Arabia. Adv. Anim. Biosci. 2017, 8, 540–545. [Google Scholar] [CrossRef]
  47. Feng, L.; Zhang, Z.; Ma, Y.; Du, Q.; Williams, P.; Drewry, J.; Luck, B. Alfalfa Yield Prediction Using UAV-Based Hyperspectral Imagery and Ensemble Learning. Remote Sens. 2020, 12, 2028. [Google Scholar] [CrossRef]
  48. Hu, Q.; Yang, J.; Xu, B.; Huang, J.; Memon, M.S.; Yin, G.; Zeng, Y.; Zhao, J.; Liu, K. Evaluation of Global Decametric-Resolution LAI, FAPAR and FVC Estimates Derived from Sentinel-2 Imagery. Remote Sens. 2020, 12, 912. [Google Scholar] [CrossRef]
  49. Hansen, J.; Ruedy, R.; Sato, M.; Imhoff, M.; Lawrence, W.; Easterling, D.; Peterson, T.; Karl, T. A Closer Look at United States and Global Surface Temperature Change. J. Geophys. Res. Atmos. 2001, 106, 23947–23963. [Google Scholar] [CrossRef]
Figure 1. Unmanned Aircraft System (UAS) imagery of an alfalfa (Medicago sativa L.) field in Rexburg, Idaho, USA with 66 sampling locations (black dots) for measuring soil water content and biomass yield (A) and 1 m contour lines showing the topography of the field (B). The inset map shows the general location of the field within the state boundaries of Idaho, USA.
Agriengineering 07 00115 g001
Figure 2. Alfalfa (Medicago sativa L.) reference evapotranspiration (ET) and mean daily air temperature during each of the three alfalfa harvest intervals (HIs) in Rexburg, Idaho, USA in 2021 and 2022. The vertical black line represents the separation of HIs in 2021. The date format is d/m/yr.
Agriengineering 07 00115 g002
Figure 3. Crop evapotranspiration (ET) for 66 sample points and three harvest intervals (HIs) for an alfalfa (Medicago sativa L.) field in Rexburg, Idaho, USA. Because irrigation and precipitation were uniform, the variation in ET among sites resulted from changes in soil water within a 0.9 m soil profile from the start to the end of the HI. Solid lines in the center of the boxes represent the median. The outer limits of the boxes show the interquartile range, the whiskers represent 1.5 times the interquartile range, and hollow dots are outliers.
Agriengineering 07 00115 g003
Figure 4. Univariate Local Moran’s I reveals clustering of crop evapotranspiration values for an alfalfa (Medicago sativa L.) field in Rexburg, Idaho, USA over harvest intervals of 12/5/2021 to 9/6/2021 (A), 9/6/2021 to 15/7/2021 (B), and 20/4/2022 to 15/6/2022 (C). * indicates p < 0.05.
Agriengineering 07 00115 g004
Figure 5. Alfalfa (Medicago sativa L.) biomass yield for 66 sample points and three harvest intervals for an alfalfa field in Rexburg, Idaho, USA. Solid lines in the center of the boxes represent the median. The outer limits of the boxes show the interquartile range, the whiskers represent 1.5 times the interquartile range, and hollow dots are outliers.
Agriengineering 07 00115 g005
Figure 6. Univariate Local Moran’s I reveals clustering of alfalfa (Medicago sativa L.) biomass yield values for the Rexburg, Idaho, USA alfalfa field over harvest intervals of 12/5/2021 to 9/6/2021 (A), 9/6/2021 to 15/7/2021 (B), and 20/4/2022 to 15/6/2022 (C). * indicates p < 0.05.
Agriengineering 07 00115 g006
Figure 7. Crop water productivity (CWP) for three harvest intervals in an alfalfa (Medicago sativa L.) field in Rexburg, Idaho, USA. Solid lines in the center of the boxes represent the median. The outer limits of the boxes show the interquartile range, the whiskers represent 1.5 times the interquartile range, and hollow dots are outliers.
Agriengineering 07 00115 g007
Figure 8. Bivariate Local Moran’s I clustering of biomass yield and crop water productivity for an alfalfa (Medicago sativa L.) field in Rexburg, Idaho, USA over harvest intervals of 12/5/2021 to 9/6/2021 (A), 9/6/2021 to 15/7/2021 (B), and 20/4/2022 to 15/6/2022 (C). Biomass yield is listed as the first variable and crop water productivity as the second variable in the legends. For example, ‘high–low’ indicates areas classified as high biomass yield and low crop water productivity. * indicates p < 0.05.
Agriengineering 07 00115 g008
Figure 9. Bivariate Local Moran’s I values reveal the clustering of biomass yield and crop water productivity for an alfalfa (Medicago sativa L.) field in Rexburg, Idaho, USA, over harvest intervals of 12/5/2021 to 9/6/2021 (A), 9/6/2021 to 15/7/2021 (B), and 20/4/2022 to 15/6/2022 (C). Under-watered areas of the field would receive higher than average irrigation rates, and over-watered areas would receive lower than average irrigation rates to maximize crop water productivity.
Agriengineering 07 00115 g009
Table 1. Soil sampling dates, harvest intervals (HIs; numbered as #), and days prior to harvest at the alfalfa (Medicago sativa L.) field in Rexburg, Idaho, USA, during 2021 and 2022, for minimum (Min.), maximum (Max.), and mean volumetric water content (VWC), expressed as a depth of water in a 0.9 m deep soil profile.
VWC (cm)
Date (d/m/yr)Harvest Interval-#Days Prior to HarvestMin.Max.Mean
12/5/2021Start of HI-1279.92516
9/6/2021End HI-116.22012
9/6/2021Start of HI-2366.22012
15/7/2021End HI-210.13123.3
20/4/2022Start HI-356102214
15/6/2022End HI-317.22112
Table 2. The alfalfa (Medicago sativa L.) harvest intervals, number of irrigation events, irrigation rate per event, total irrigation, precipitation, and the mean change in the depth of soil water ( Θ ) within a 0.9 m deep soil profile, measured between the initial and final soil sampling for each harvest interval in an alfalfa field in Rexburg, Idaho, USA.
Harvest Interval Dates (d/m/yr)Irrigation EventsIrrigation Rate (cm)Total Irrigation (cm)Precipitation (cm) Mean   Change   Θ (cm)
12/5/2021–9/6/202181.5123.66.1
9/6/2021–15/7/202181.5120.210
20/4/2022–15/6/202271.8126.51.8
Disclaimer/Publisher’s Note: The statements, opinions and data contained in all publications are solely those of the individual author(s) and contributor(s) and not of MDPI and/or the editor(s). MDPI and/or the editor(s) disclaim responsibility for any injury to people or property resulting from any ideas, methods, instructions or products referred to in the content.