Article

Influence of Ballast and Tyre Inflation Pressure on Traction Performance of Agricultural Tractors Evaluated in Trials on Concrete Track

Department of Agricultural and Food Sciences, University of Bologna, Viale G. Fanin 50, 40127 Bologna, Italy
*
Author to whom correspondence should be addressed.
AgriEngineering 2025, 7(4), 109; https://doi.org/10.3390/agriengineering7040109
Submission received: 28 February 2025 / Revised: 2 April 2025 / Accepted: 2 April 2025 / Published: 7 April 2025
(This article belongs to the Collection Research Progress of Agricultural Machinery Testing)

Abstract

As agricultural tractors function under various soil and environmental conditions, optimising their design and paraameter settings for enhanced traction performance is essential for maximising their operational efficiency. This study aimed to assess the traction capabilities of standard tractors, ensuring effective operations even under highly demanding conditions. A traction load measurement system was refined to collect performance data, and standardised tests were conducted on a concrete track to evaluate key traction metrics. The analysis considered drawbar pull, traction force, travel reduction (slip), and net traction ratio. Two tractors from the same model series, featuring similar design characteristics but differing in engine power, were compared. Three primary parameters—tractor mass, tyre pressure, and engine power—were evaluated across six distinct operating conditions. Results recorded at forward speeds below 6 km/h indicated that lower tyre pressure led to an increased net traction ratio due to the enhanced drawbar pull. Additionally, an increase in tractor mass contributed to a higher drawbar pull, which, in turn, improved traction force across all speed ranges. The maximum traction force was not significantly affected between 66 kW and 86 kW tractors at speeds up to 4 km/h. Meanwhile, the traction force remained high up to velocities of 6 km/h in the 86 kW tractor. The efficiency (i.e., the ratio between measured and declared power) varied between 64% and 70% for the 66 kW tractor and between 70% and 74% for the 86 kW tractor. The travel reduction was mainly affected by the power of the tractor. The slip caused a reduction close to 4 and 6 km/h for the 66 kW and 86 kW agricultural tractors, respectively. Overall, the proper adjustment of tractor parameters significantly impacted their traction performance, and the findings provide valuable insights for improving tractor designs and field applications.

1. Introduction

The growing demand for food due to the increasing global population implies that productivity and efficiency need to be increased in the context of contemporary modern agriculture [1].
Agricultural tractors, which are used to power farming tools and implements, are key vehicles in modern agriculture [2]. Their tractive efficiency is a main performance parameter to be improved for field operations [3], and the performance of tractors has always been a subject of interest among the manufacturers and users of agricultural machinery. To assess the performance of tractors, different testing procedures have been developed in many countries, such as Europe and the United States [4]. In 1959, the Organization for Economic Co-operation and Development (OECD) published the first normalised test code for assessment of the performance of agricultural tractors; in particular, a standardised procedure for tractor performance was proposed, with the aim of obtaining comparable results across OECD countries [5]. Consequently, since 1959, tractor traction performance has been tested worldwide according to the standardised test procedure of the OECD Codes 1 and 2 (OECD Codes 1&2) [6]. Nevertheless, at present, only OECD Code 2 is available for tractor testing. In field operations, the power of the tractor engine is converted into pulling force through interaction between the tractor drive wheels and the soil [1]; however, several studies have shown that tractor power is wasted by percentages ranging between 20 and 55% [2,3], leading to a consequent decrease in tractive efficiency. During traction tests, the tractor mass affects the dynamic load and the traction force introduces slip (travel reduction) due to wheel–ground interactions. As described by Battiato and Diserens [7], the parameters affecting wheel–soil interaction can be divided into three categories: (1) tyre design parameters (e.g., diameter, width, height, inflation pressure and flexibility), (2) soil properties (e.g., soil type, soil moisture, and so on), and (3) tractor parameters (e.g., wheel load and speed). Experimental results focused on tractive performance demonstrated the advantages of correct inflation pressure in tractor tyres. Net traction and tractive efficiency both increased when the inflation pressure was correctly set according to the specifications of the tyre manufacturer [8]. Studies have demonstrated that the performance of tyres is a function of both dynamic load and travel reduction [9]. The influence of the tyre contact area has been demonstrated by Kim et al. [10], who considered four different tyre combinations in a paddy field. Wheel–soil interaction is a key subject associated with the evaluation of traction performance [11,12,13]. As studied by Kumar et al. [14], increasing ballast loads in tractors improves their pulling ability and tractive power efficiency. Increasing the tractor’s mass increases the net traction ratio (NTR) and affects the stability, improving the tractor’s safety in addition to its operating performance. Different ballasts and ballasting approaches for tractors are available; however, as described by Regazzi et al. [15], tractor front ballasting, compared to rear or ventral ballasts, decreases the risk of the vehicle wheelie phenomenon. A mechanical load (named the multiplier counterweight) that allows for mass distribution adjustment during normal tractor operations was studied; however, unfortunately, the adjustment of tractor mass distribution obtained with the mechanical tool did not have noticeable effects on tractive performance or fuel consumption [16]. It has been noted that, in Europe, the regulation on tractor road circulation currently requires at least 20% of the tractor’s total mass on the steering axle [17]. Tractor adhesion is defined in terms of the traction capacity, mainly related to the weight on the driving axle/axles and the features of the contact areas between the ground and the driving components. Reducing the inflation pressure of the tyre or increasing the axial load of the wheel will affect the tyre–ground contact area. It has been demonstrated that, when reducing the tyre inflation pressure by 37% and increasing the tractor’s mass by 6 kN, the length of the tyre’s footprint on the ground increased by 26%, which increased up to 39% when adding a further 2 kN [18].
The aim of the present study was to evaluate the traction performance of two tractors that are identical in terms of their design and main features, but differ in terms of power output. To evaluate how the engine power, tractor weight, and tyre inflation pressure affect the drawbar pull, six tractor configurations were studied: three configurations for a 66 kW tractor and three for an 86 kW tractor. These include two configurations with standard weight and standard tyre inflation pressure, two configurations with standard weight and low tyre inflation pressure, and two configurations with ballasted weight and standard tyre inflation pressure. For this scenario, the testing procedure in OECD Code 2 was considered. The traction performance of the tractors was evaluated in different gears, thus covering a speed range from 2 km/h to 11 km/h, reflecting the working speeds associated with most field operations. The best configuration of the tractor, in terms of the operation to be performed, was identified through maximisation of the traction performance.

2. Materials and Methods

2.1. Characteristics of the Tractors

Three tractors were considered: one braking tractor and two tested tractors.
The braking tractor was a John Deere 6620 (John Deere, Moline, IL, USA) weighing 55.72 kN, which was properly equipped with sensors and a load cell.
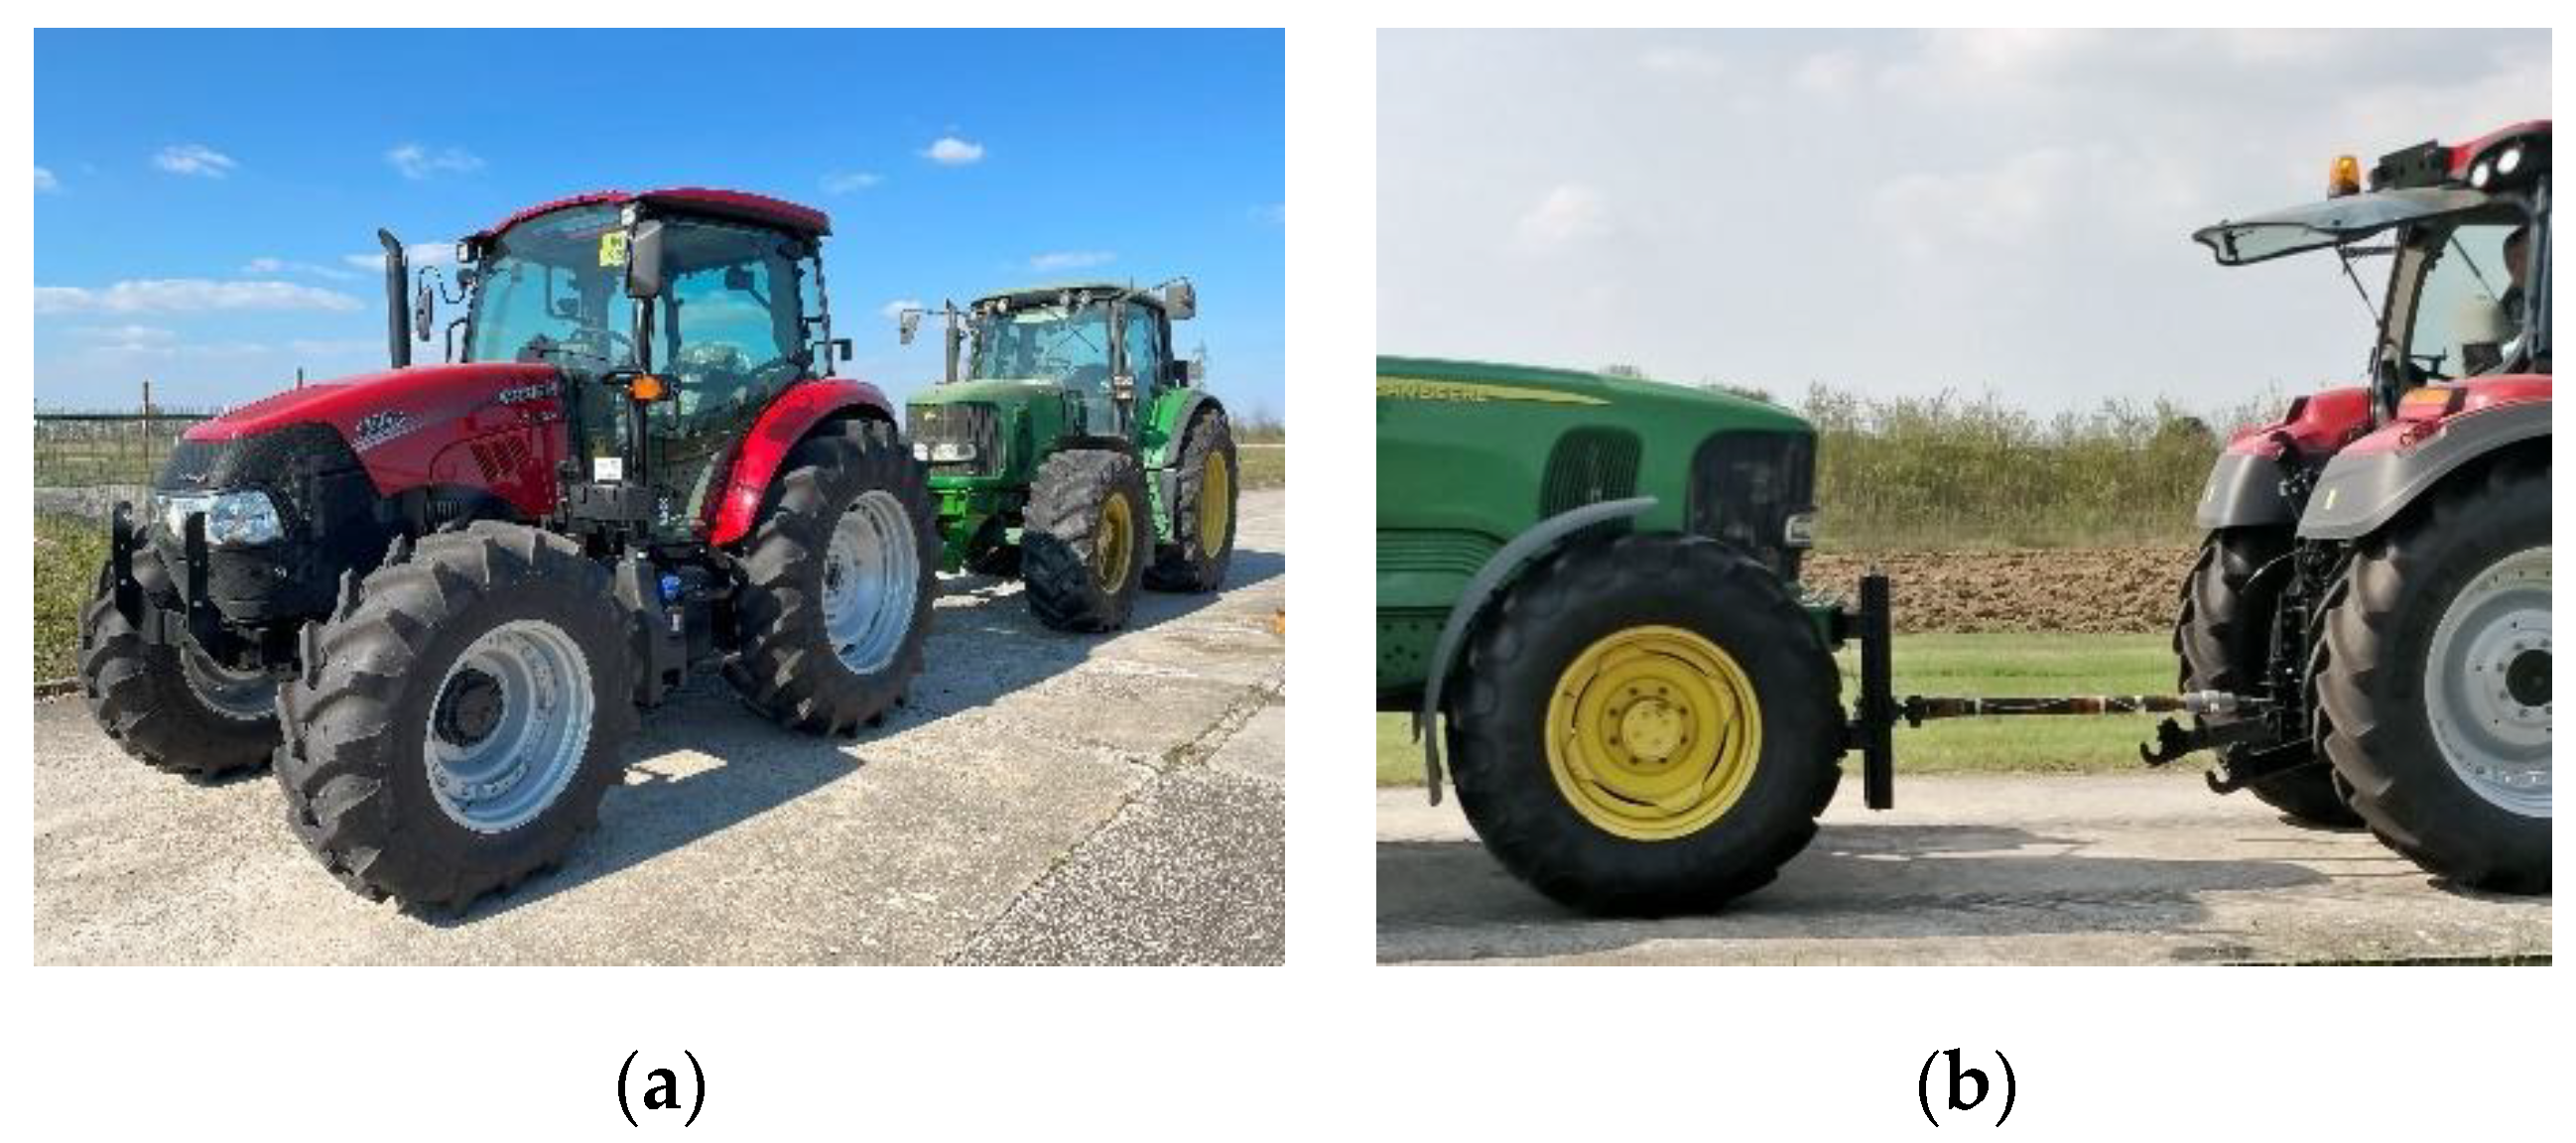
The tested tractors were manufactured by CNH Industrial Italia S.p.A. (Turin, Italy) and, being in the same family type and differentiated in terms of engine power output, were considered to be representative of low- and high-power tractors. The first tractor was a CASE IH Farmall 90 C (Figure 1a), with engine power declared by the manufacturer to be approximately 90 HP, corresponding to 66 kW @ 2300 rpm. The second tractor was a CASE IH Farmall 120 C (Figure 1b), with engine power of approximately 120 HP, corresponding to 86 kW @ 2300 rpm. Both tractors were four-wheel drive (4WD) with a maximum forward speed of 40 km/h. Both tractors were mounted with a mechanical transmission, a synchronised mechanical gearbox with three ranges and eight gears (24 × 24 Hi-Lo), and were tested at a weight of 40.17 kN.
The specifications of the tractors used in the traction tests are reported in Table 1.

2.2. Traction Performance

Tests were performed at the official OECD Testing Station in the “Meccanica Agraria” Laboratory at the Alma Mater Studiorum University of Bologna (UNIBO). The Tractor drawbar power tests were carried out according to the OECD Code 2 procedure.
The test procedure required at least seven gear/speed settings, ranging from 2.5 km/h to 17.5 km/h. During all tests at the drawbar, the tractor governor control was set for the maximum power and the performance values were recorded only up to 15% mean wheel slip, as suggested in Code 2. This limit has been discussed by Smerda and Cupera [3], explaining that a wheel slip exceeding 15% decreases the engine power’s efficiency in being transmitted to the ground. Tests were performed in those gear/speed settings, from one giving a travel speed immediately faster than in the gear/speed setting in which the greatest maximum power was developed, down to one immediately slower than the gear/speed setting, allowing the maximum pull to be developed [6].
Traction performance is determined in terms of the traction force available at the tractor drawbar (drawbar pull) or, alternatively, in terms of the net traction ratio (NTR), defined as the ratio of Traction Force (TF) to Tractor Weight (W):
N T R = T F W = T F W a + W b
where W a and W b are the static weights at the front and rear wheels on the ground, respectively (Figure 2).
TF is affected by the tractive coefficient between the ground and the driven wheel, as well as the normal load on the drive wheel. The drawbar pull is equal to the tractive effort at the outer part of the drive wheel, subtracting the resistance to motion. Finally, the maximum drawbar pull exerted is a function of the ground type and condition, tyre features, wheel slip, motion resistance, and the total load on the driven wheels. The total load on the wheels is influenced by the distribution of static loads between the axles (related to the weight and the position of the Centre of Gravity, CoG):
W a = W · a a + b
where a is the horizontal distance between the CoG and the rear axle and b is the horizontal distance between the CoG and front axle. Considering the dynamic load, related to the static height of the line of draught H with respect to wheelbase Z = a + b above the ground, as well as the horizontal pull force value, the dynamic axle load is:
W d y n = W · a T F · H a + b
where the distance between the vertical ground reactions on the wheels (influenced by rolling resistance) and the centres of the wheels is considered negligible with respect to lengths a and b, assuming the simplification of a solid wheel on a hard surface. The horizontal ground reactions on the wheels are defined as Ra and Rb.
The tractive effort at the outer part of the driven wheels is:
F m = T F + R a + R b = F a + F b
The traction force on the outer part of the driven wheel is limited by the traction force at the contact between the wheel and the supporting ground.
According to the OECD Code 2, the following relationship should be maintained:
T F · H 0.8 · W a · Z
Accordingly, from Equations (2) and (3):
W d y n = W a T F · H a + b
Introducing Equation (5), and noting that the tractor wheelbase Z can be expressed as a + b:
W d y n W a 0.8 · W a
the dynamic axle load limit can be defined as:
W d y n l i m = 0.2   · W a
In all tests at the drawbar, the governor control was set for the maximum power. Drawbar power tests allowed for recording the power available at the drawbar of the tractor over a range of gear/speed settings. The drawbar pull varied in the tests, increasing the speed while controlling the slip to remain below 15%. The layout of the traction test in steady-state motion in the ring track is depicted in Figure 3.

2.3. Drawbar Tests Performed

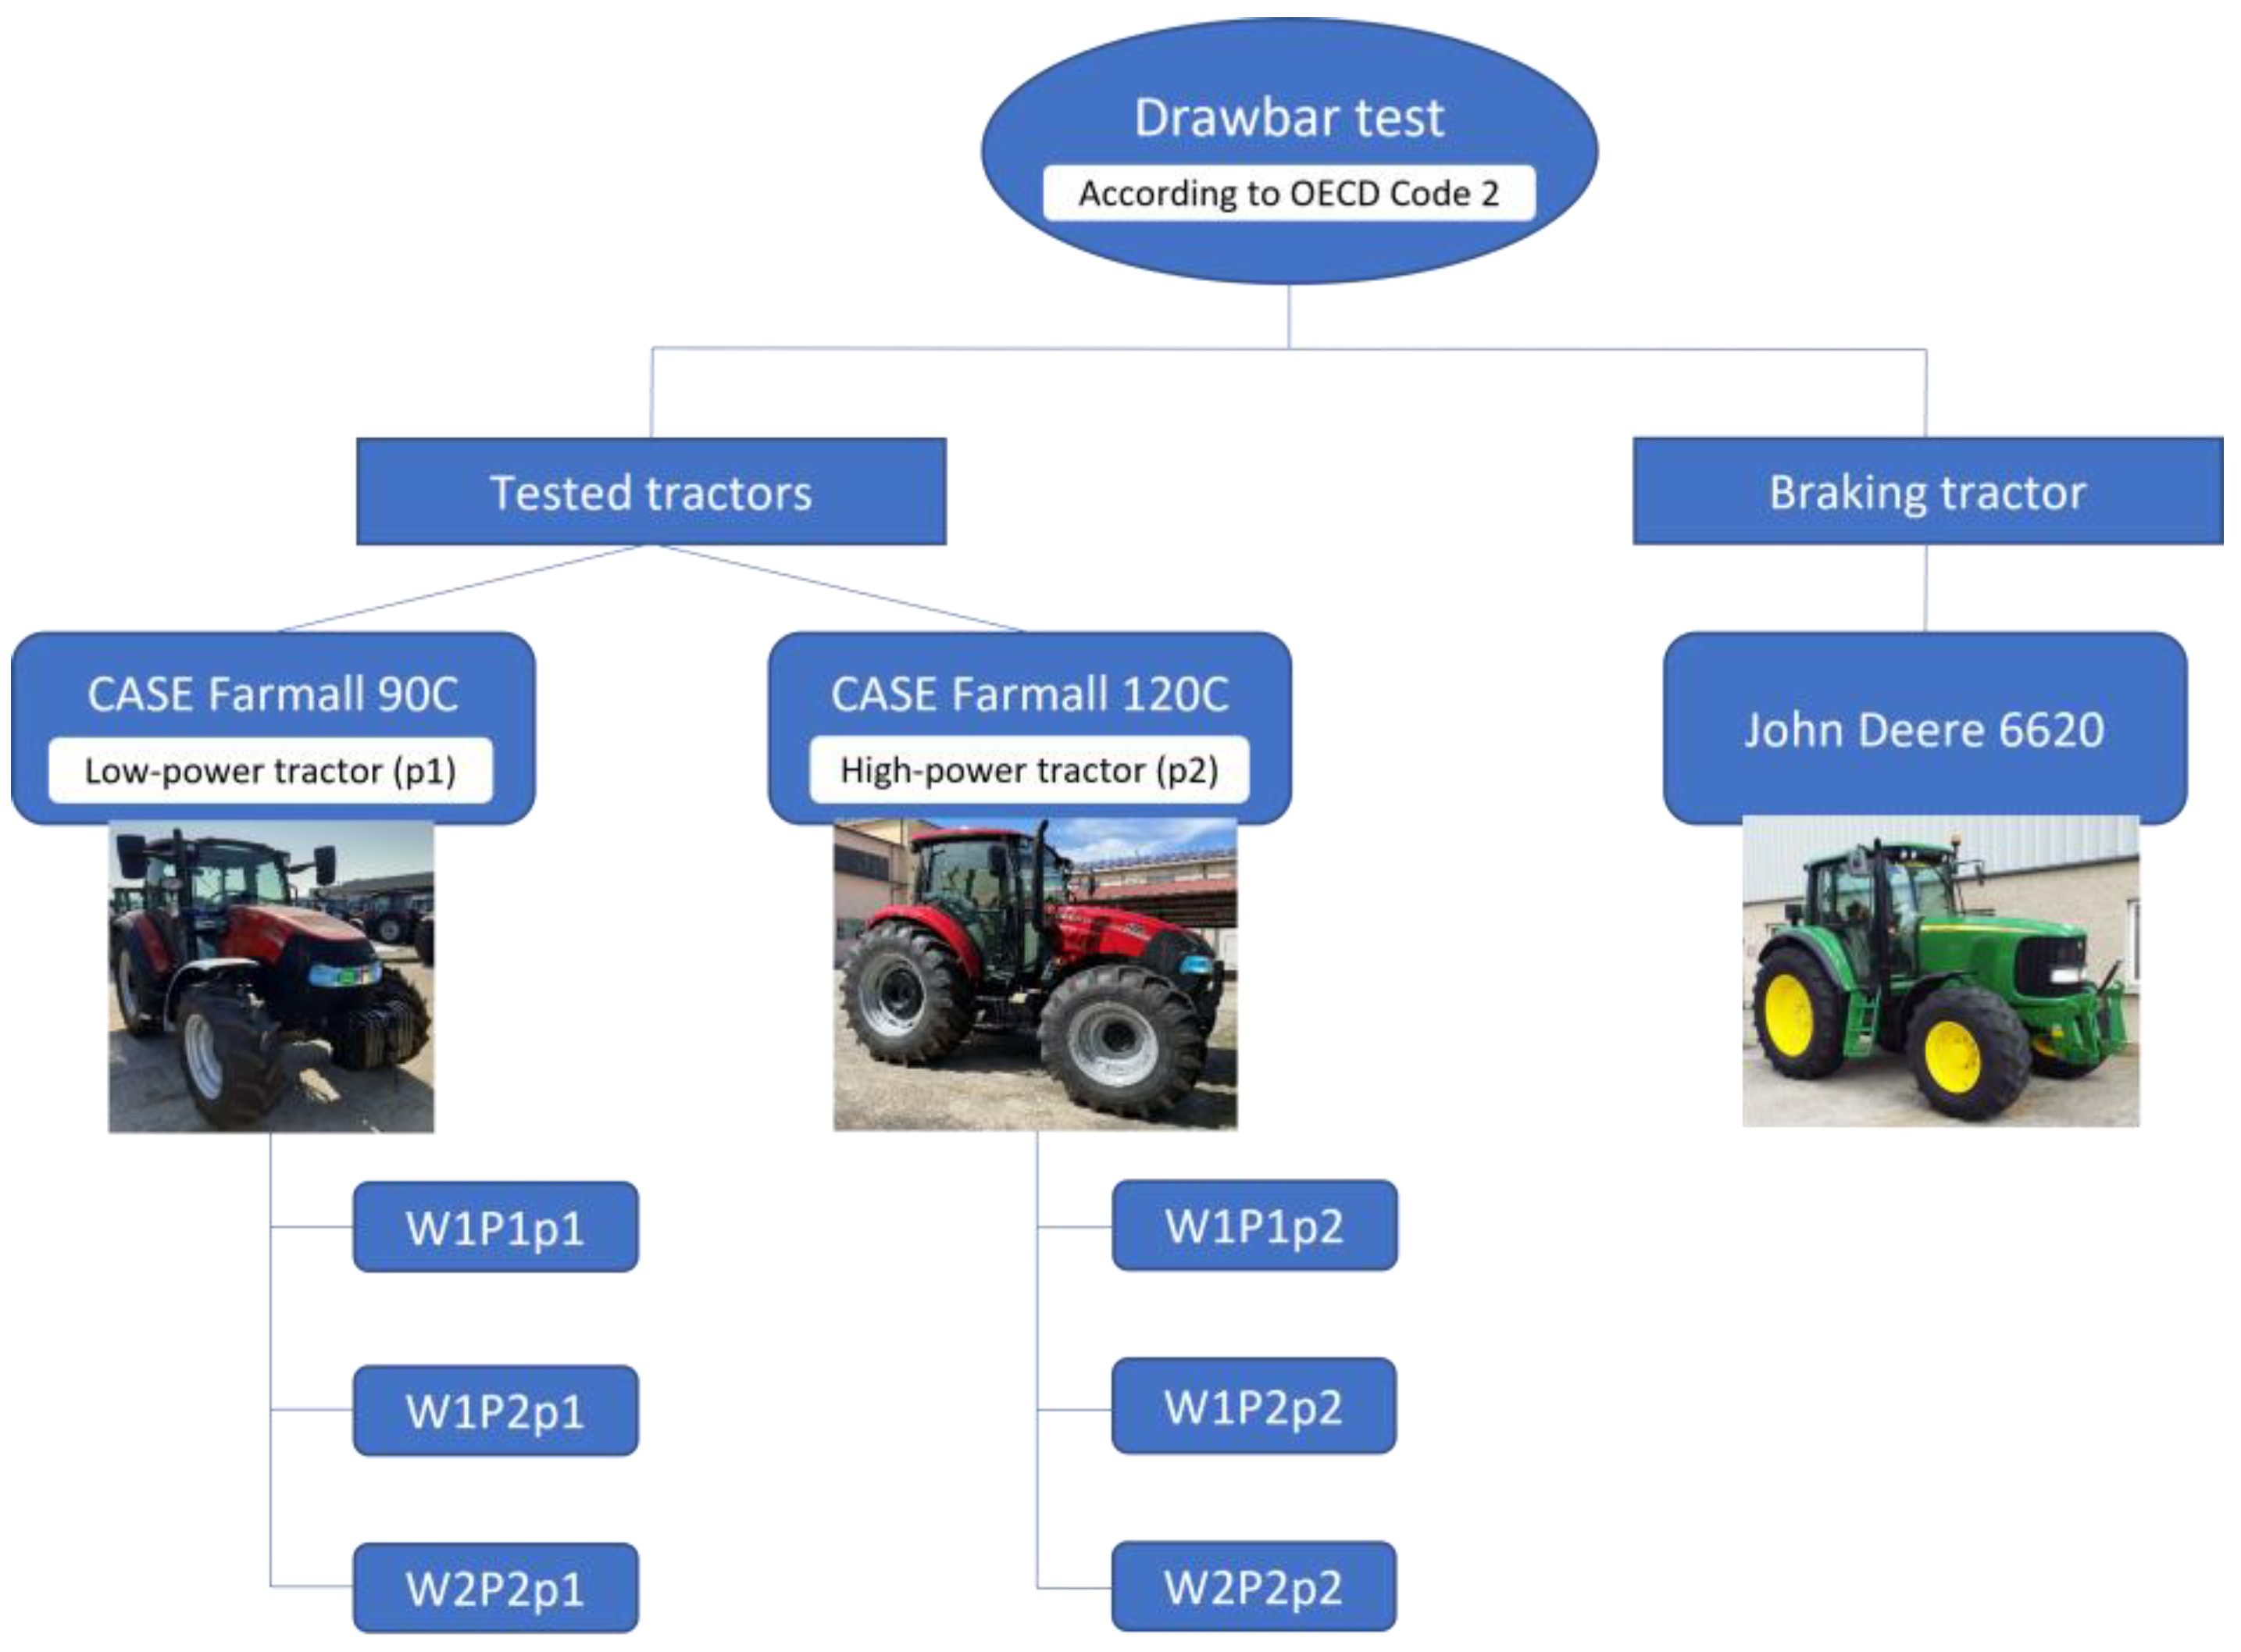
Based on the main features of the two tested tractors described in Section 2.1, ballasts and tyre inflation pressures were modified and drawbar tests were performed in three different configurations for each tractor, corresponding to a total of six configurations and, consequently, six different tests. The two tractors were categorised on the basis of engine power (p): p1 was considered a low-power tractor (66 kW), while p2 was a high-power tractor (86 kW). The weight (W) of each tractor, differing with the engine power, was increased from 40.17 kN (W1) to 42.87 kN (W2), while the tyre inflation pressure (P) was reduced from 160 kPa (P2) to 80 kPa (P1). The load on the tractors’ wheels in the stationary state was measured using four scales, one for each wheel (range 0.4 kN–60 kN). The pressure P2 was selected in accordance with the tyre manufacturer on the basis of the European Tyre and Rim Technical Organisation (ETRTO) [19]. The pressure P1 (i.e., the lowest pressure) was selected in accordance with the tractor manufacturer’s instructions. The six tested tractor configurations are detailed in Table 2, where the labels define the combinations of the main characteristics. In particular, W1P1p1 means that the configuration was the low-power tractor with 66 kW (p1), unballasted weight of 40.17 kN (W1), and tyre inflation pressure of 80 kPa (P1). W1P2p1 means that the configuration was the low-power tractor (p1), unballasted weight of 40.17 kN (W1), and tyre inflation pressure of 160 kPa (P2). W2P2p1 means that the configuration was the low-power tractor (p1), unballasted weight of 42.87 kN (W2), and tyre inflation pressure of 160 kPa (P2). W1P1p2 means that the configuration was the high-power tractor with 86 kW (p2), unballasted weight of 40.17 kN (W1), and tyre inflation pressure of 80 kPa (P1). W1P2p2 means that the configuration was the high-power tractor (p2), unballasted weight of 40.17 kN (W1), and tyre inflation pressure of 160 kPa (P2). W2P2p2 means that the configuration was the high-power tractor (p2), unballasted weight of 42.87 kN (W2), and tyre inflation pressure of 160 kPa (P2).
The tests were performed in a flat concrete ring track to compare the effects of tyre pressure and tractor mass on traction performance. Runs 5 m wide and 120 m long were marked out in the track. These runs were then travelled in steady-state motion, recording the drawbar pull via the dynamometer while braking the tested tractor with the second tractor (the braking or loading tractor). The measurements were carried out on the straight line of the track, such that the lateral force component due to drift could be considered negligible. Data recorded included the dynamic axle load (W) on the wheel, the drawbar pull, the actual velocity, and the theoretical velocity. A 100 kN load cell (TRQ 100 kN/1-A, sens. 1 mV/V)(Pavone Sistemi Srl, Concorezzo, Italy) between the tested tractor and the loading tractor measured the drawbar pull. The actual forward speed ( v a ) was measured using non-contact sensors with an integrated fibre-optic gyroscope (CORREVIT Sensor L-CE with Gyro).
The traction power was measured by multiplying the traction force (TF) value by the actual forward speed ( v a ) of the tractor:
T P = T F · v a
The efficiency ratio between the maximum power measured for each configuration and the power declared by the tractor’s manufacturer was calculated on the basis of the following equation:
e f f . ( % ) = T P d P   · 100
where dP is the power declared by the manufacturer.
The engine speed ( n e ), as the revolution speed of the engine crankshaft, was recorded using the CAN-BUS tractor signals. The number of engine revolutions for one revolution of the driving wheels for each gear selected ( τ ) was provided by the tractor’s manufacturer, being related to the transmission system mounted in the tractor. Based on the engine crankshaft revolutions per minute, the wheel revolutions per minute, and the engine speed obtained in real-time via CAN-BUS, the theoretical forward speed ( v t ) at the wheels was calculated:
v t = n e τ · 2 π 60 R I
where RI refers to the dynamic index radius of the tyres (ETRTO Standards Manual, [19]), which takes into account the tyre radius under dynamic operating conditions. The acquisition system in the braking tractor recorded and displayed all parameters. The tested tractor travelled in a straight direction with a locked differential, allowing the highest traction performance to be achieved. The governor control was set for maximum power at full throttle and the data analysed were restricted to 15% mean wheel slip. The actual forward speed, reduced by the wheel slip, was affected by the flexibility of the driven wheels and the features of the contact areas (e.g., rubber and concrete). The travel reduction (TR) was calculated as:
T R = 1 v a v t   · 100
The flowchart of the tractors involved in the research and related configurations considered are depicted in Figure 4.

3. Results

3.1. Drawbar Pull

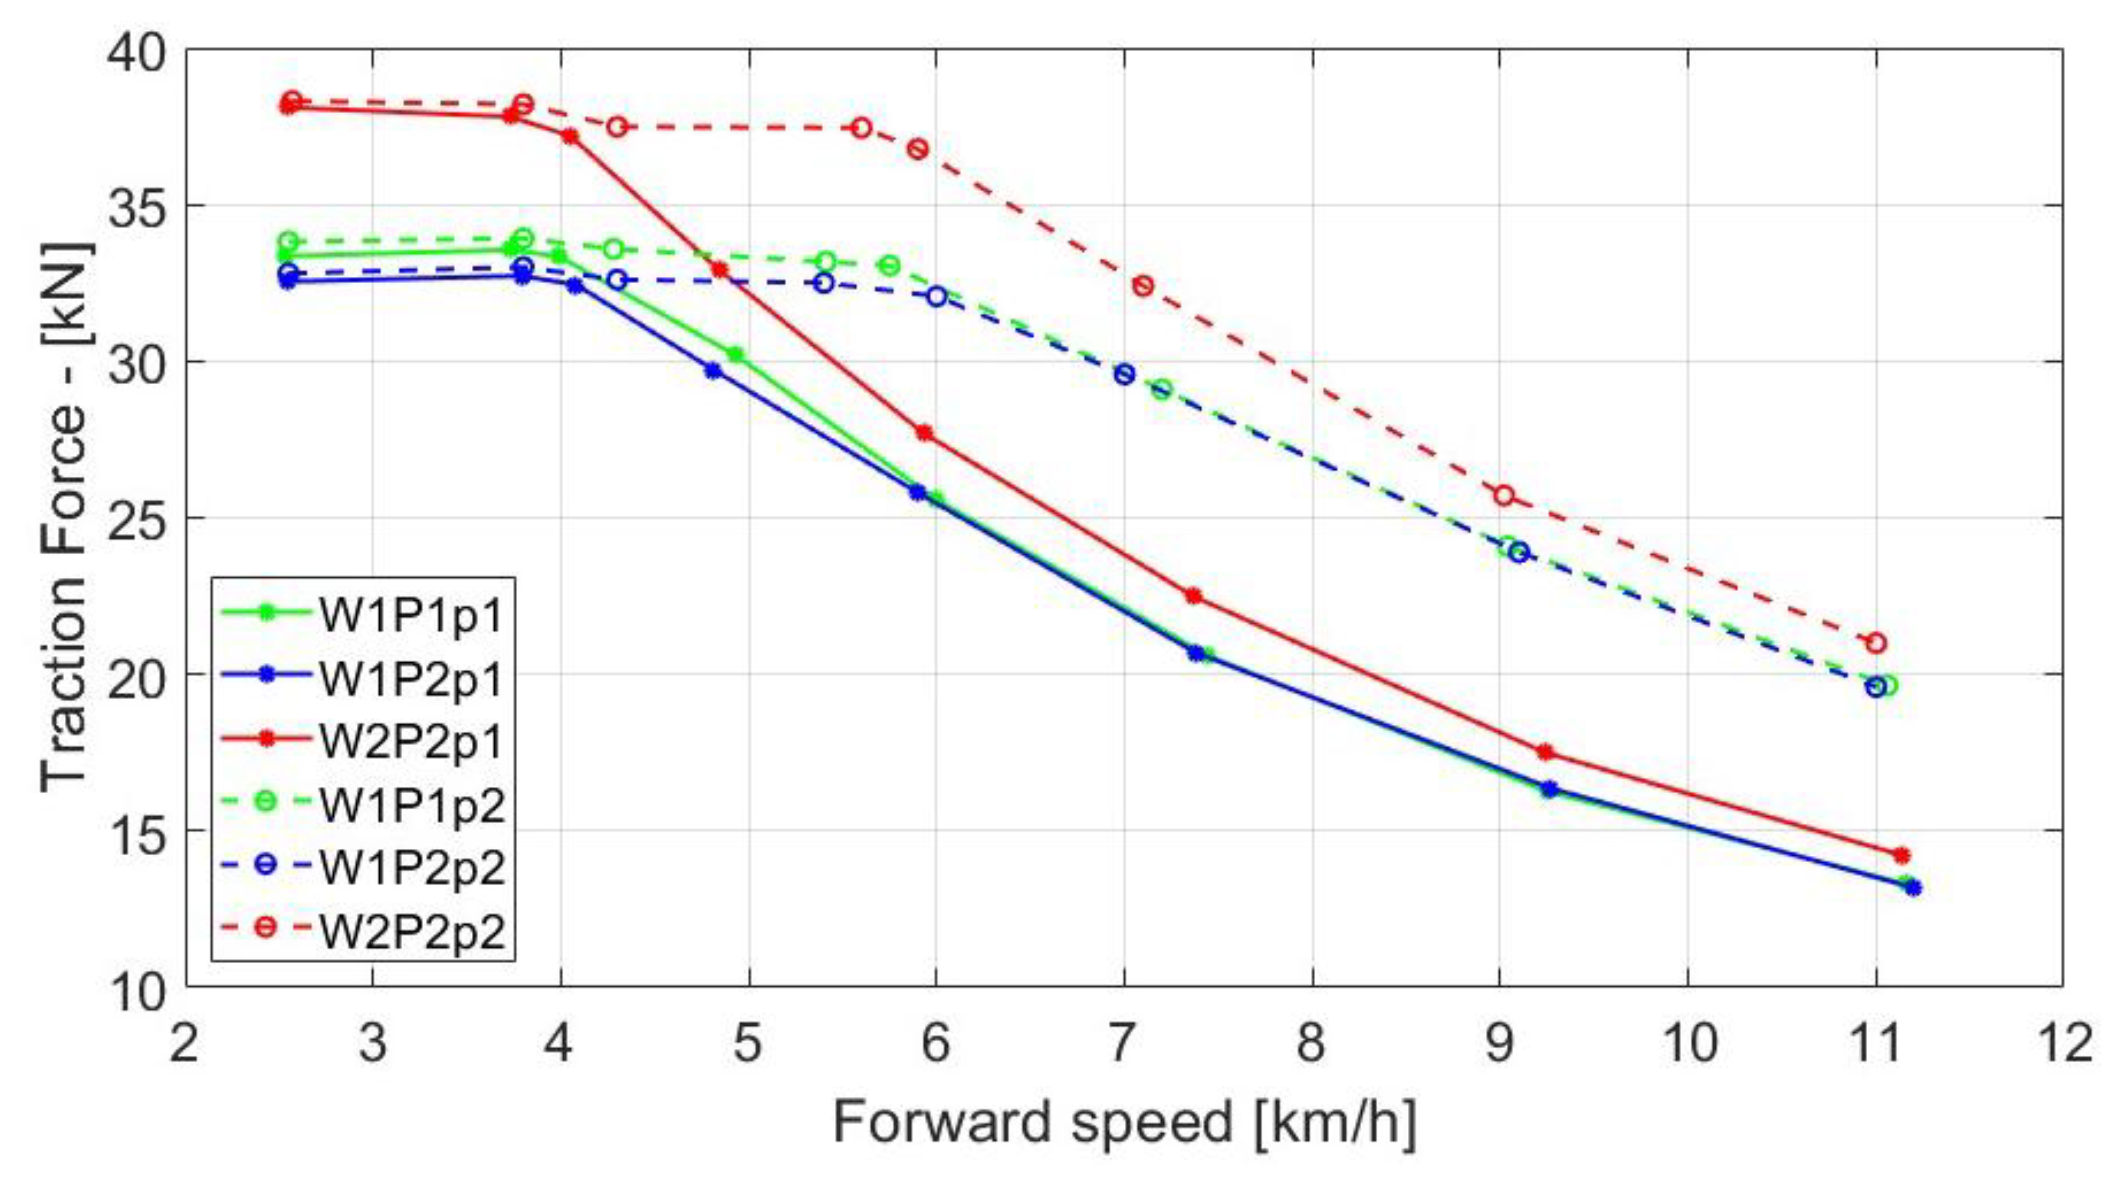
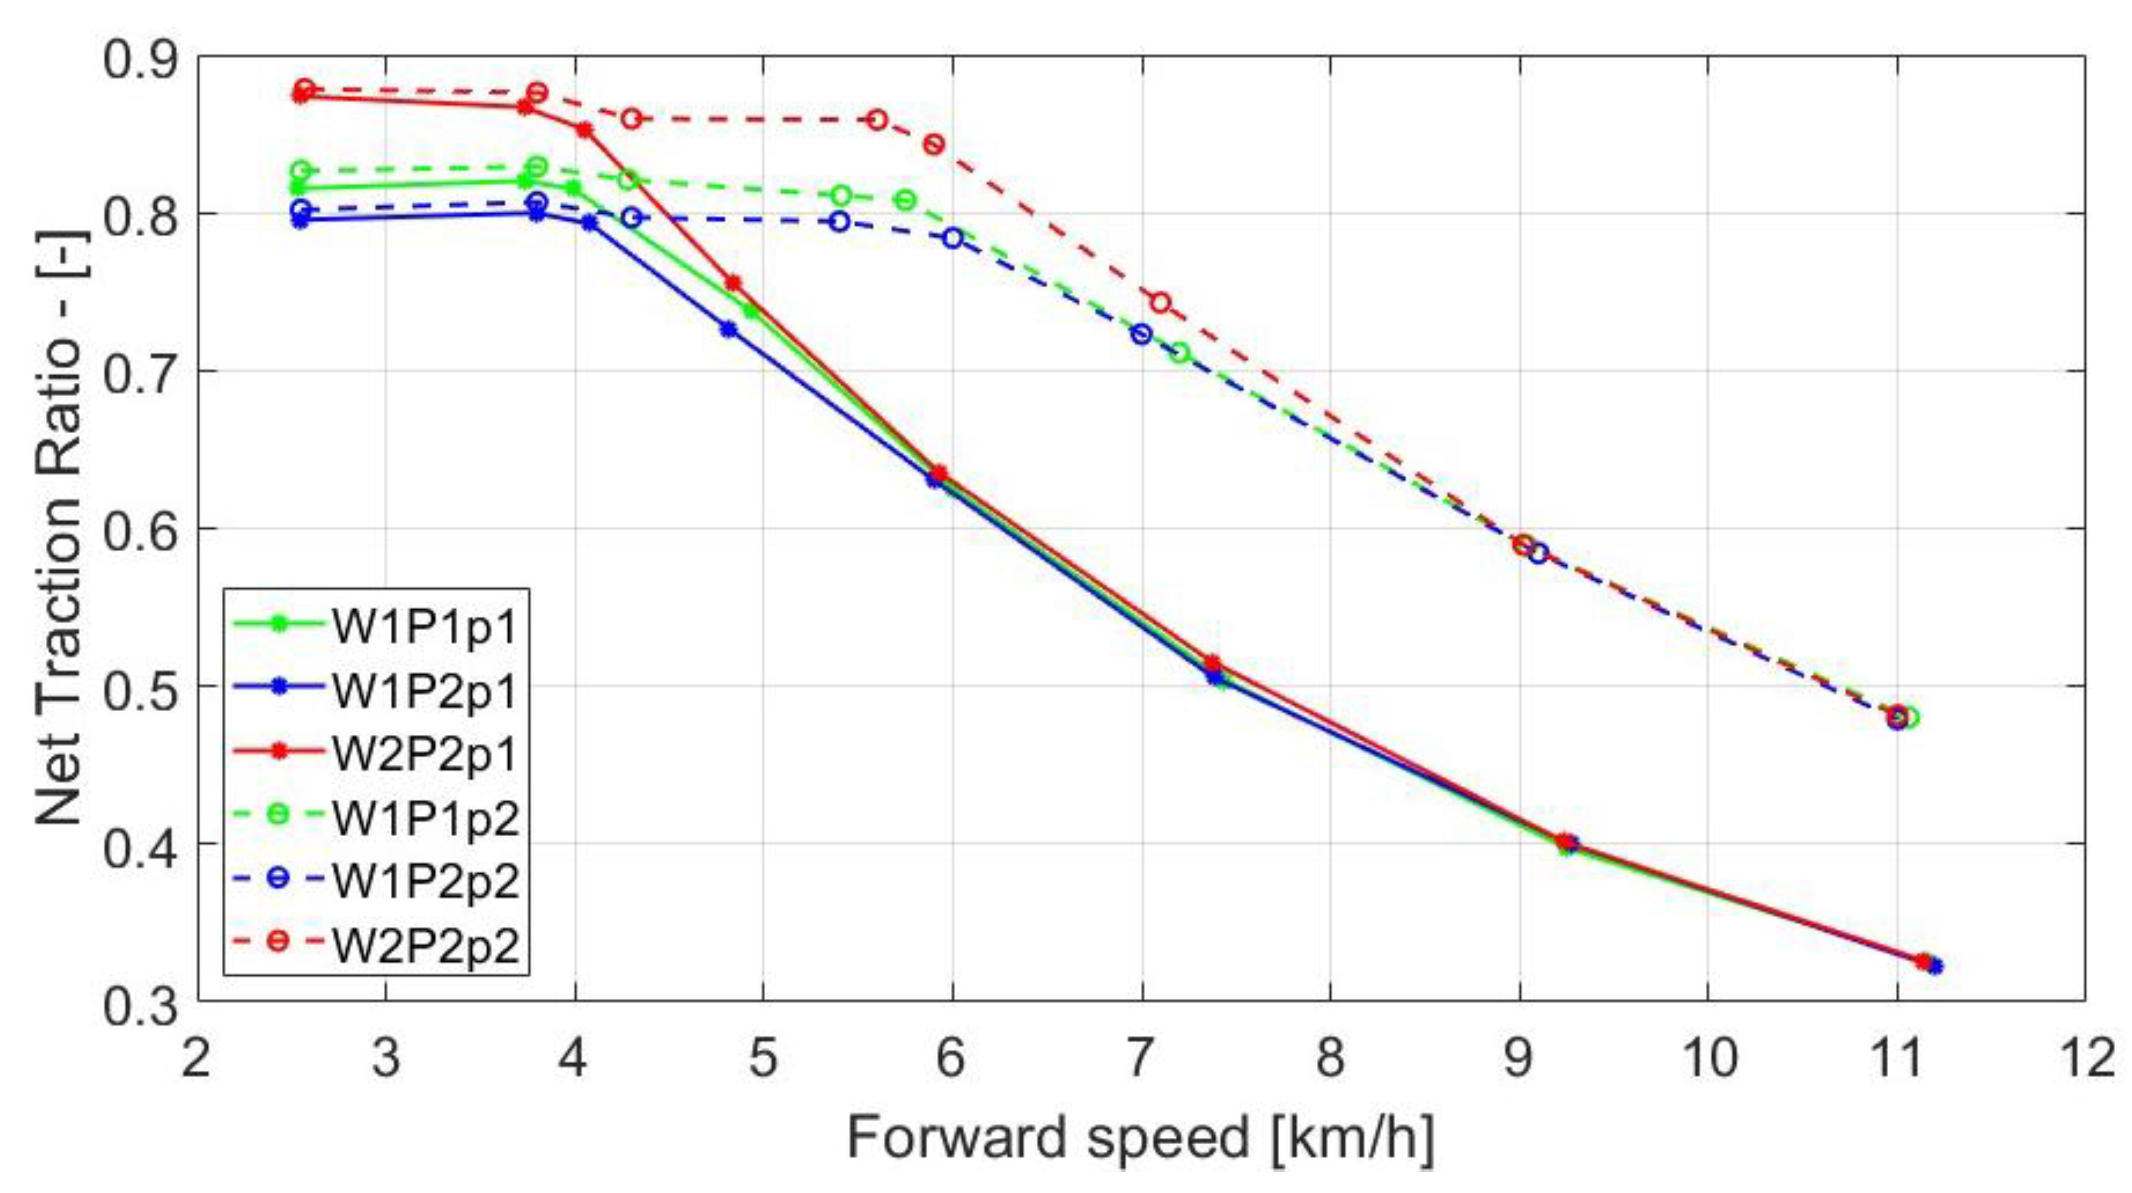
The drawbar pulling force results under the six test configurations are presented below. The net traction ratio was obtained according to Equation (1). The traction force (Figure 5) and net traction ratio (Figure 6) are presented with respect to the tractor’s forward speed. The results pertaining to the tractor with the lower-power engine are presented as solid lines, while the results for the tractor with the higher-power engine are shown as dotted lines.
Evaluation of the load on the front axle was performed considering the verification of the dynamic load, which should not be lower than the limit foreseen to ensure good driveability (Equation (5)). Therefore, the load was evaluated considering the limit derived in Equation (8)). In the unballasted tractor the lower value of the load on the front axle was 9 kN while, in the ballasted tractor, it reached 10.6 kN. The values were recorded at low speeds as the load was not influenced by the engine’s power output, whereas at high speeds, the tractor with lower power output demonstrated a higher weight on the front axle and, consequently, an increase in load. However, both values were lower than the limits of 3.25 kN and 3.78 kN calculated for the unballasted and ballasted tractors, respectively. The ratio of dynamic load limit to minimum dynamic load was 0.36 for both tractor configurations.

3.2. Travel Reduction and Traction Power

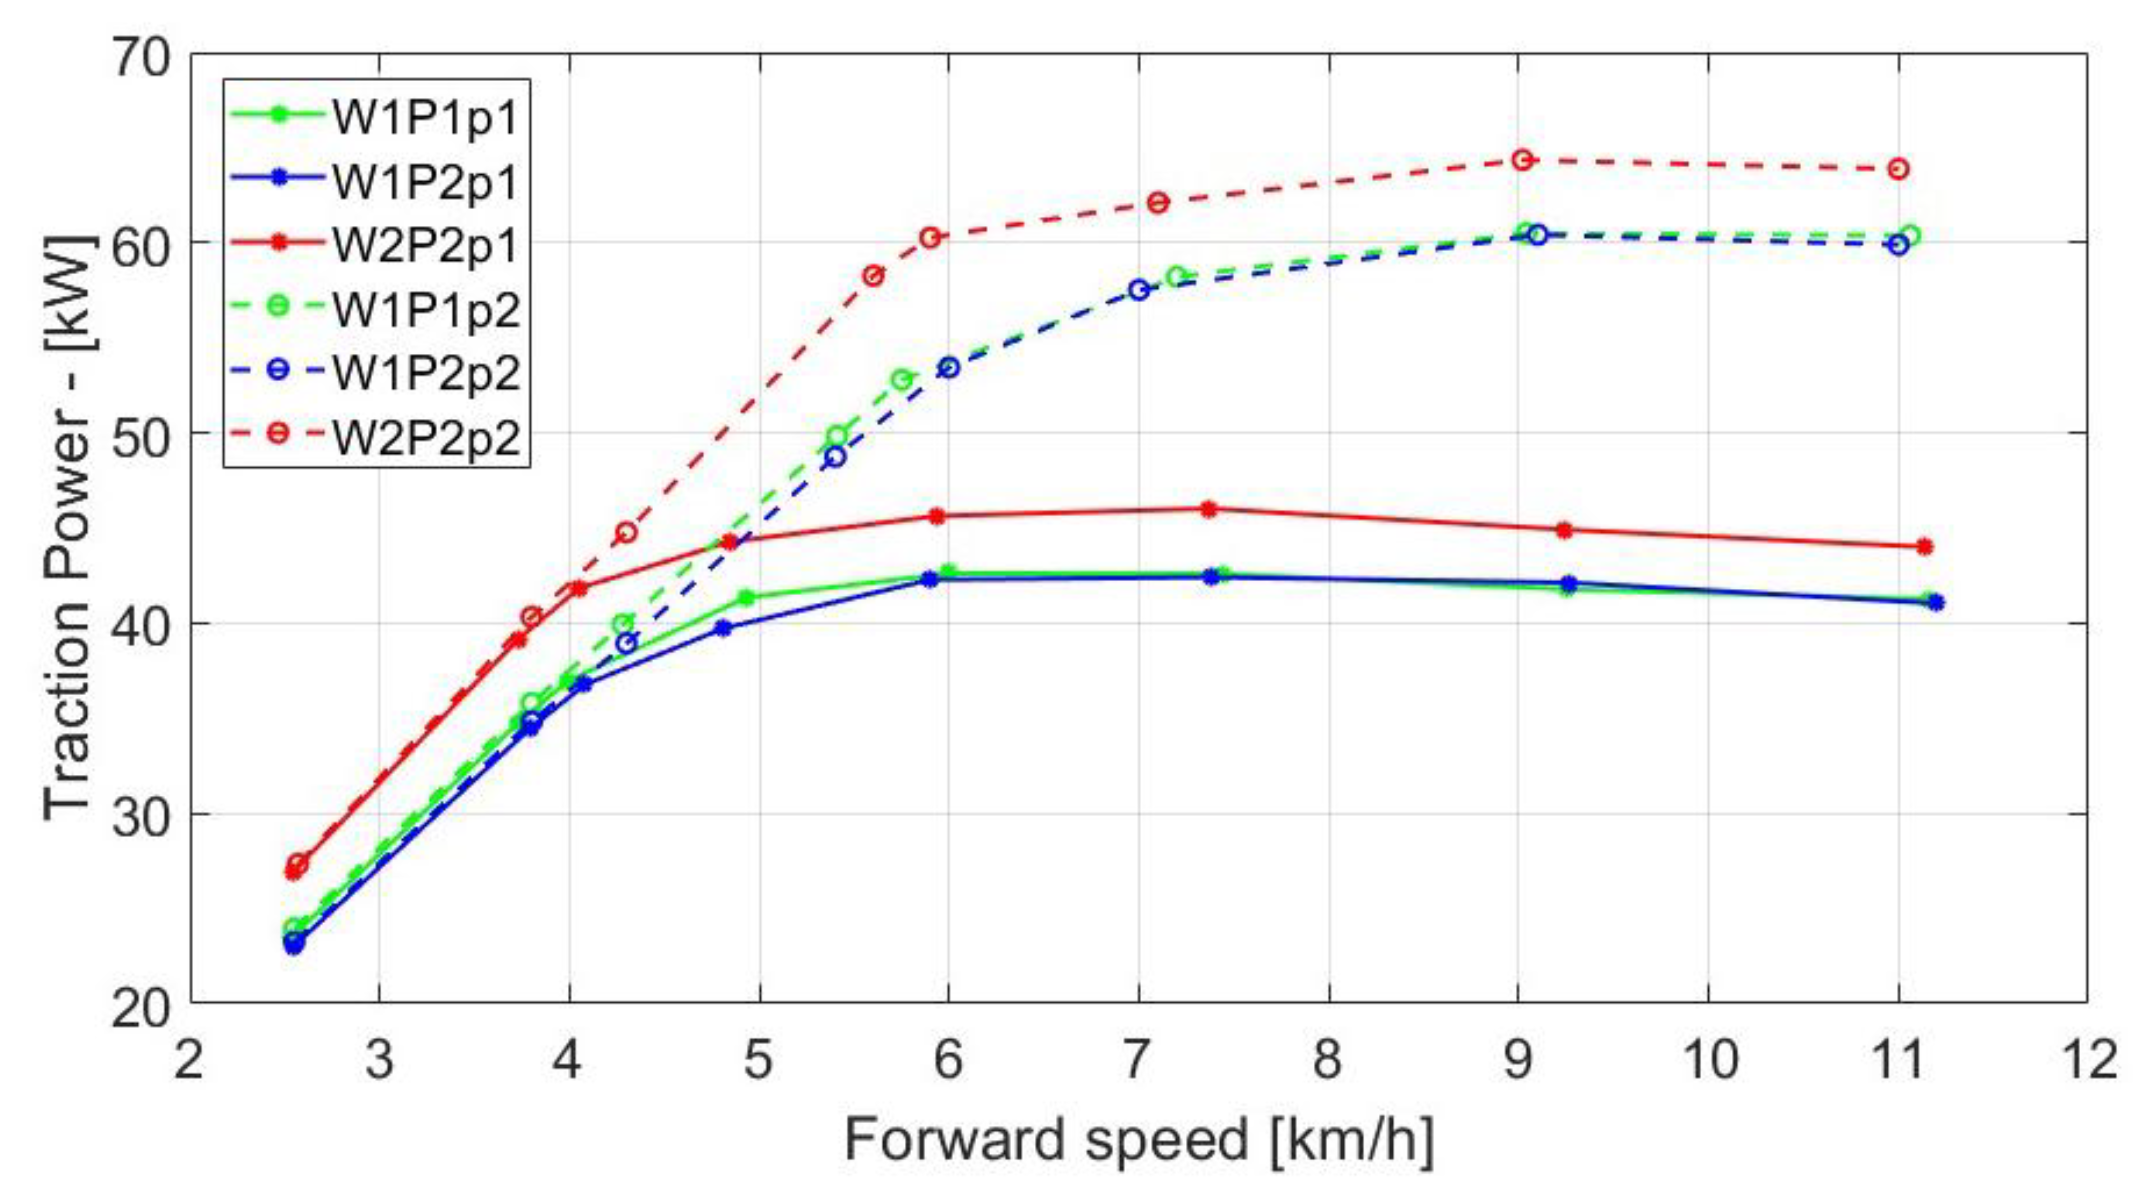
The drawbar power is reported for the six configurations in Figure 7. The considered forward speed is the effective speed, meaning that the wheel speed was reduced by the component ascribed to wheel slip.
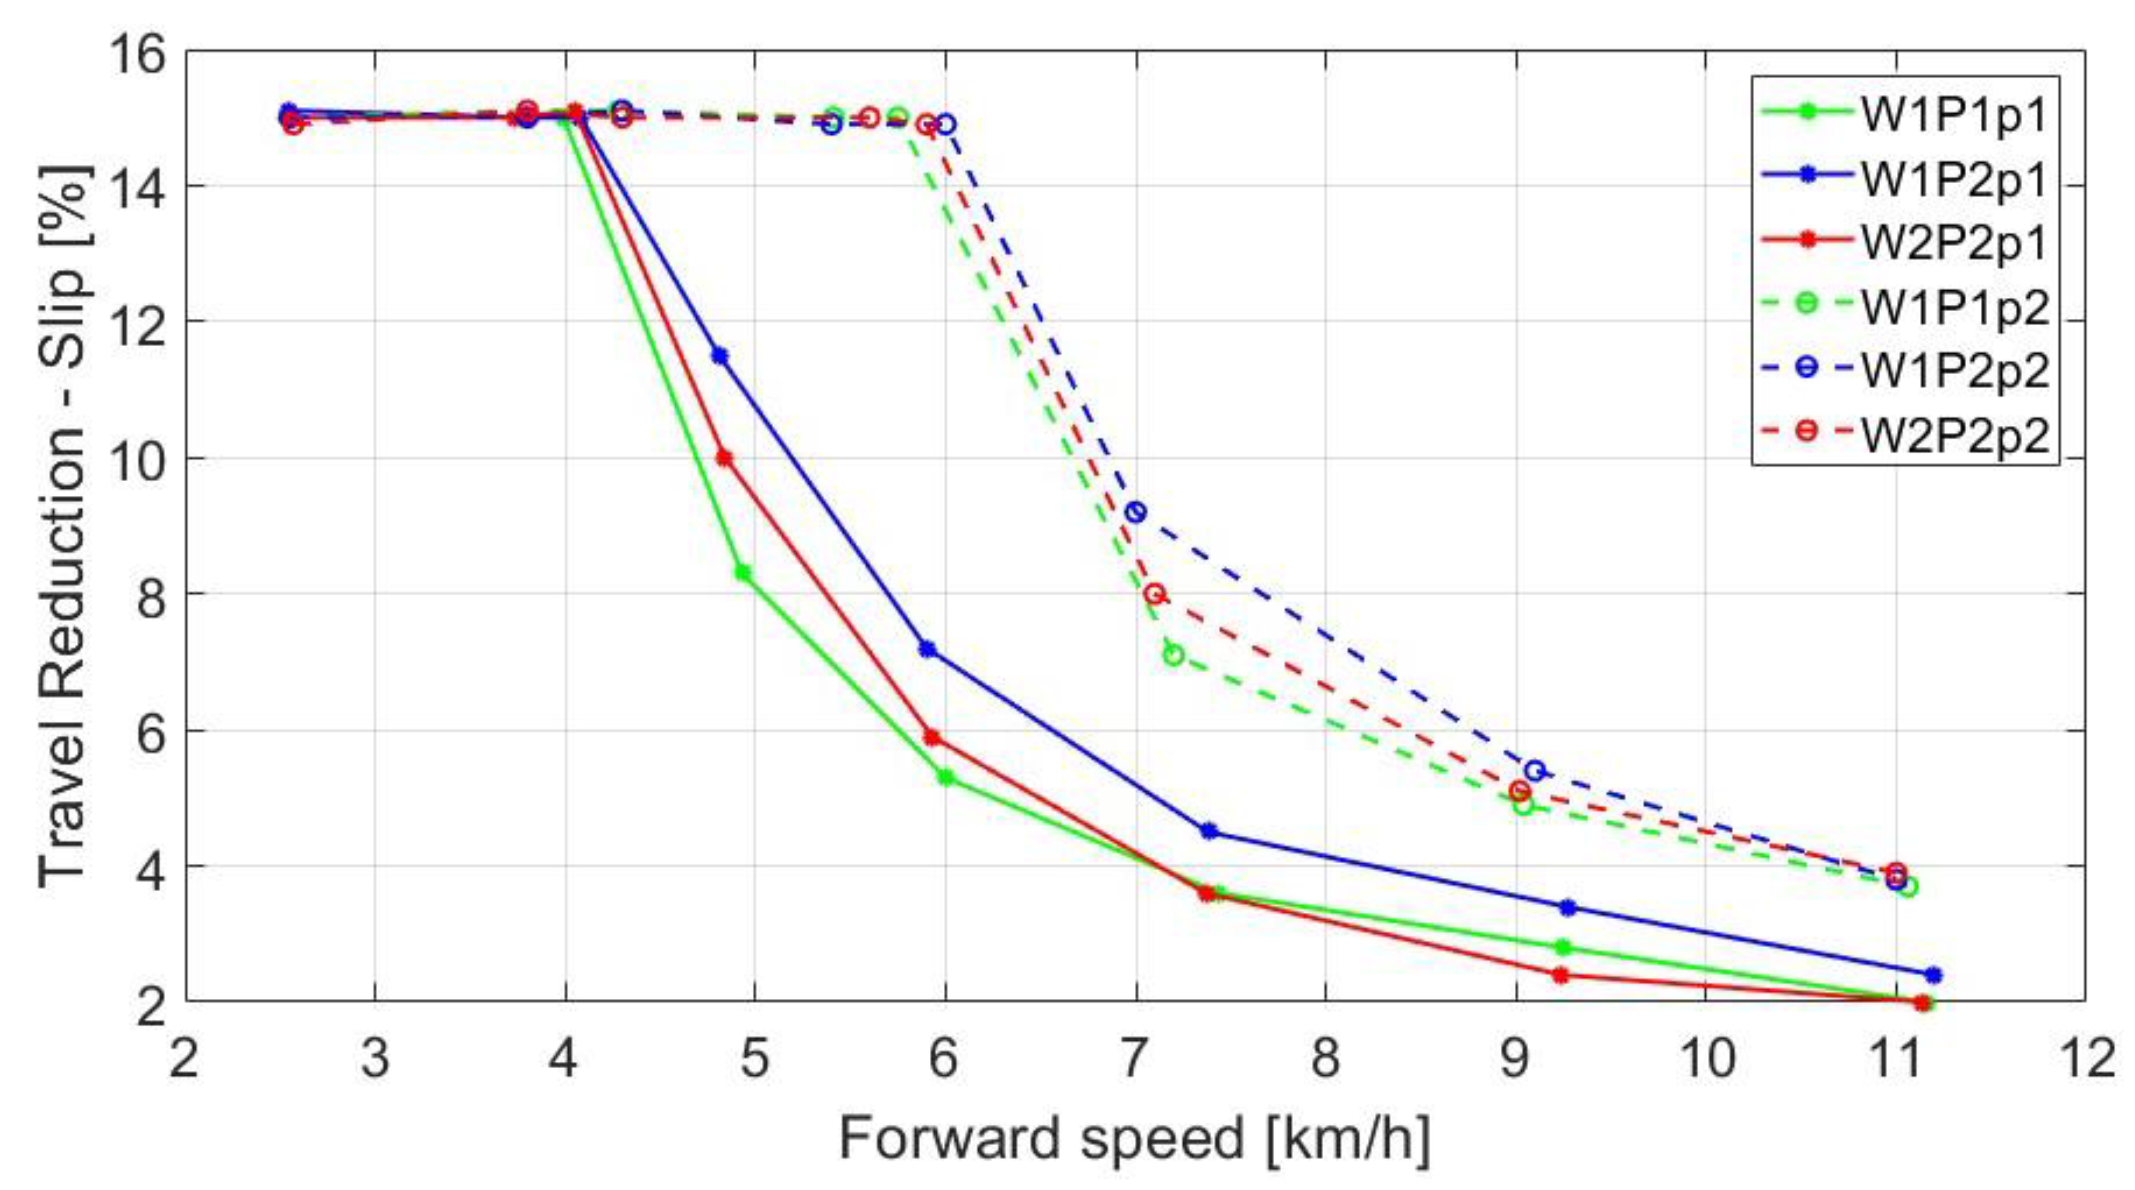
The trend of slip as a function of forward speed is shown in Figure 8. Slip at low speeds was constant at 15%, while the measured values decreased above 4 km/h for the low-power tractor and above 6 km/h for the high-power tractor. The same behaviour was verified for all six configurations tested for the two compared tractors.
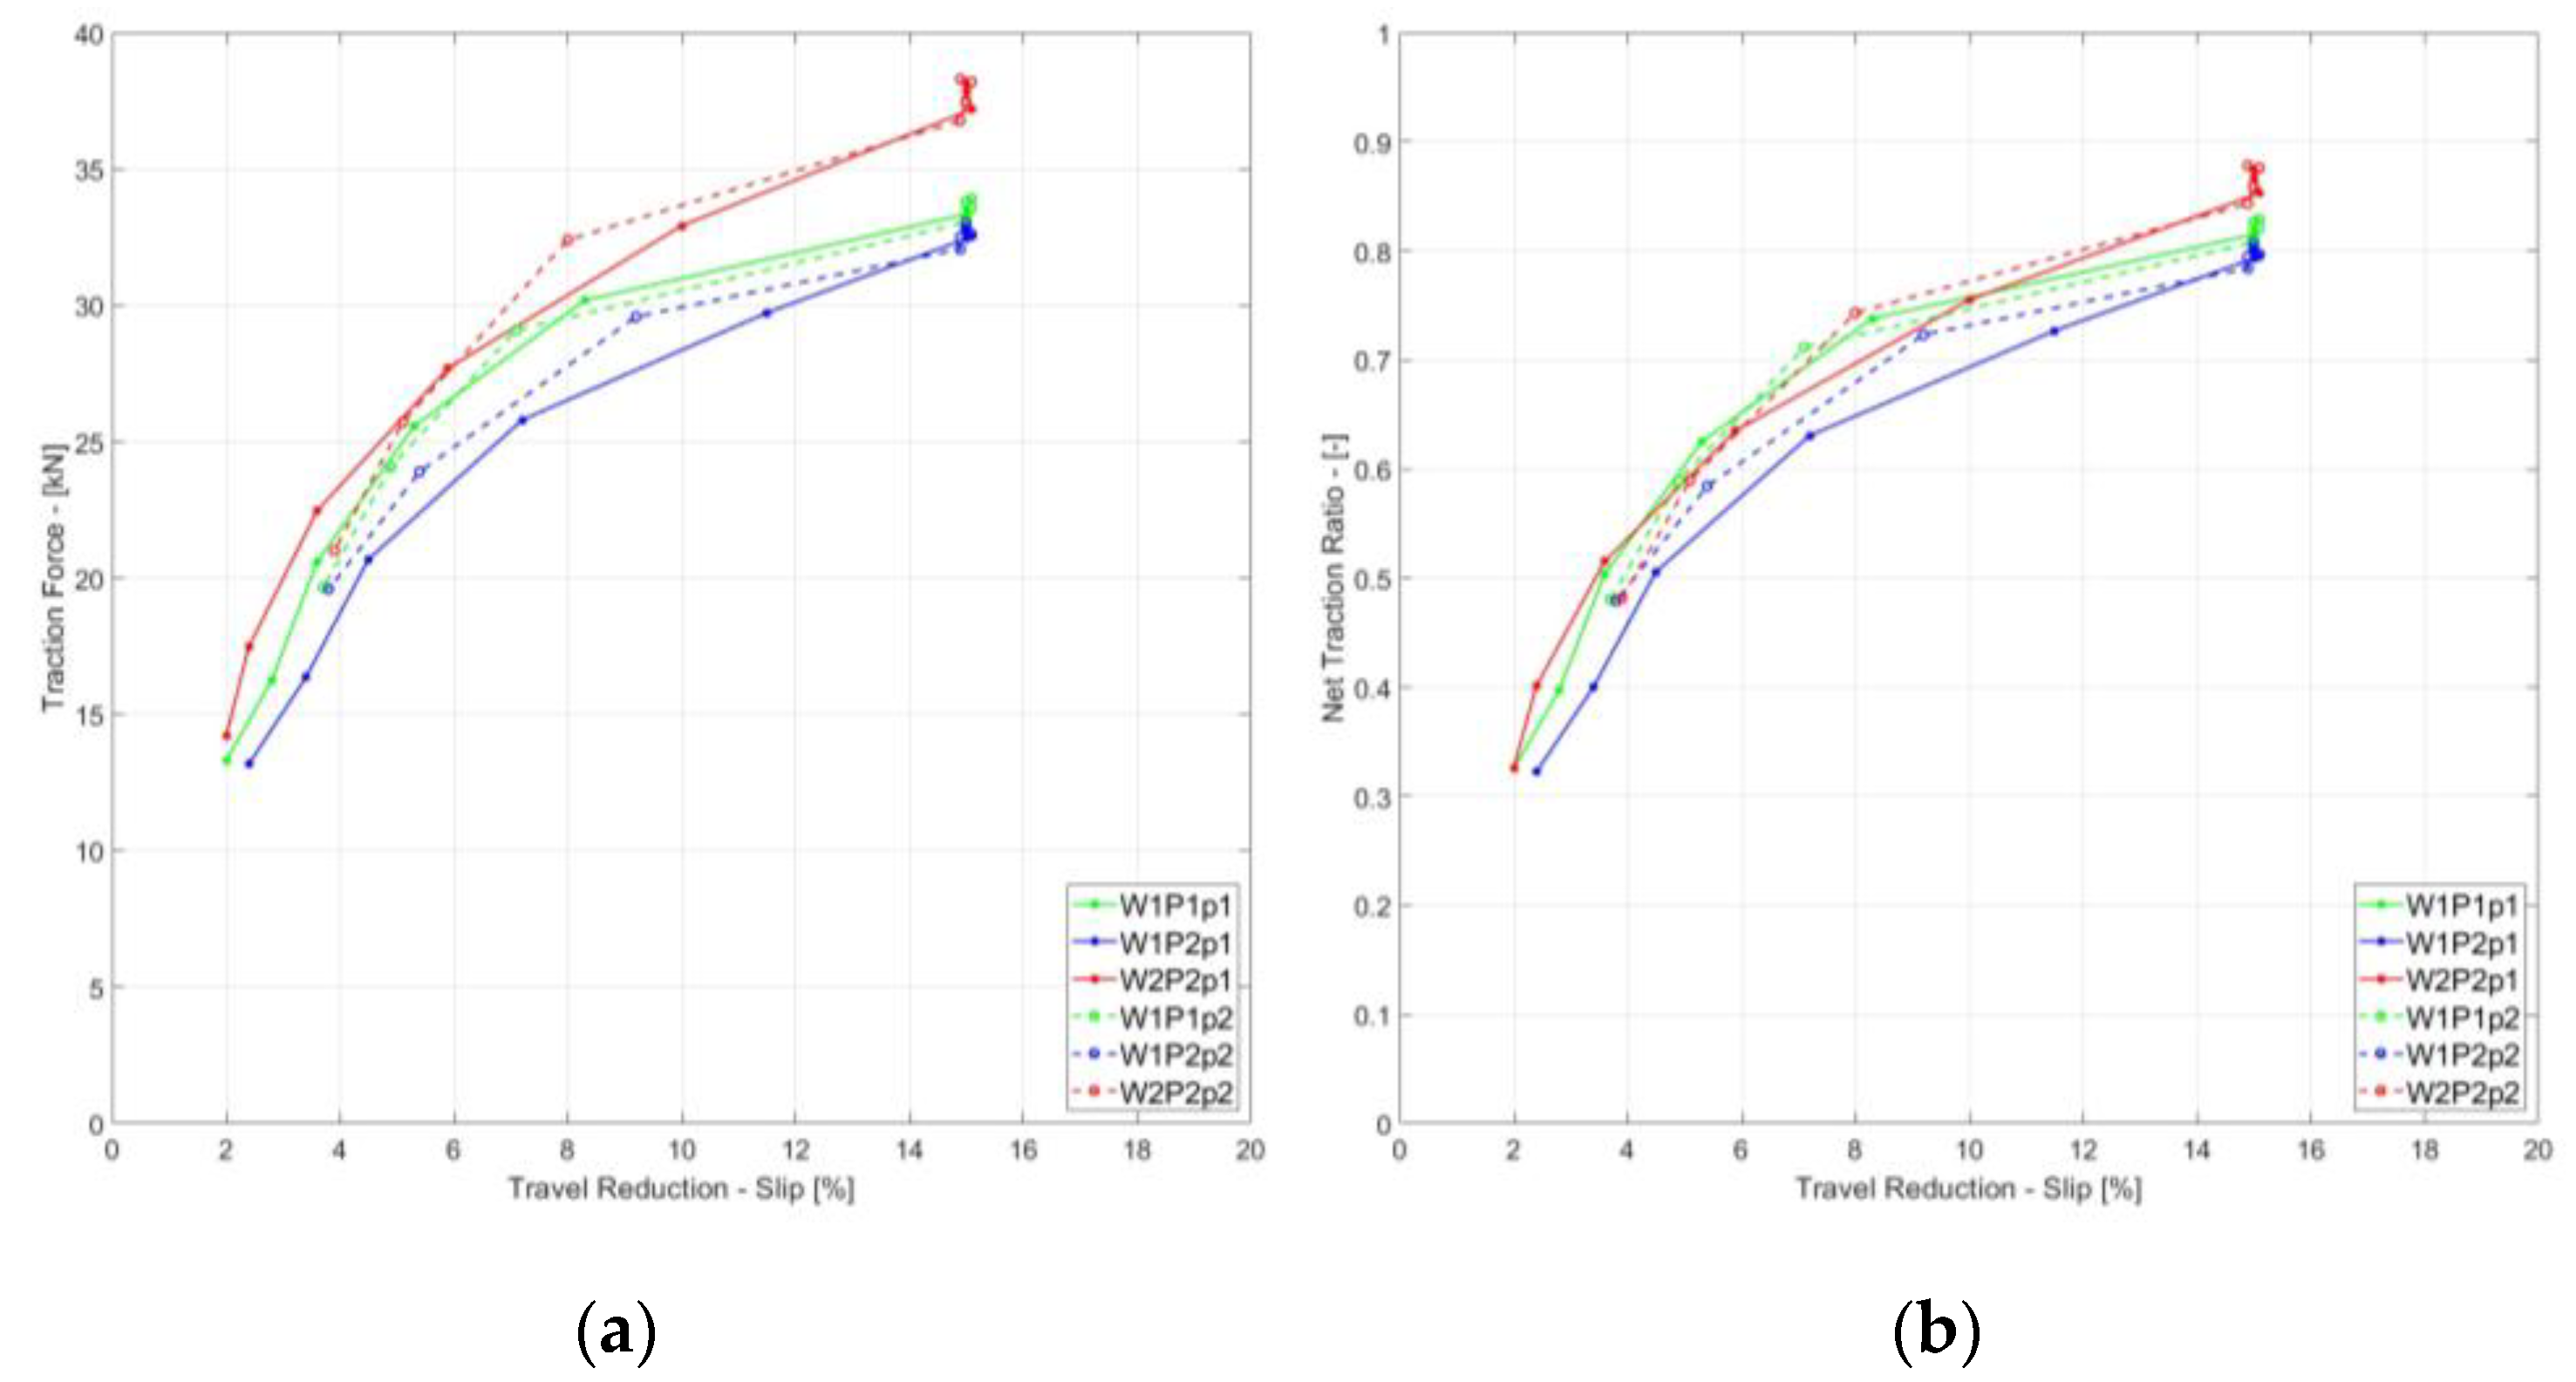
The relationship between traction force and travel reduction is shown in Figure 9a. An initial analysis of the slip behaviour plots indicated that the ballasted tractor outperformed the unballasted one; however, the ratio of traction force to the weight of the tractor provided the net traction ratio, demonstrating the effect of total weight on the driven wheels (Figure 9b).

4. Discussion

The results of the drawbar tests allowed for a performance evaluation of the tractors with respect to engine power and forward speed. The results highlight that tyre pressure and ballasting affect tractor performance, both in terms of TF and NTR. At low forward speeds (i.e., up to 4 km/h), TF strongly depends on the weight of the tractor (Figure 5). However, as the inflation pressure of the tyre decreases, the footprint on the ground increases. Thus, the behaviour of the tyre changes and, at the same speed, higher TF values are observed (Figure 5). As speed increases above 5–6 km/h, the force trends diverge, with TF becoming more dependent on the engine power supplied by the tractor (Figure 5). In terms of NTR, both ballasting and pressure changes have a positive effect at low speeds, as they modify wheel–ground interactions. In contrast, as speed increases, their influence on NTR is no longer observed (Figure 6). Analysis of the dynamic load revealed that the data were always consistent with the limits set for load in the coded procedure. The maximum force and maximum power for each configuration were evaluated with respect to forward speed. The ratio between maximum power and maximum force obtained for each test configuration provides a reference velocity, which is useful for defining two distinct operating domains. On one hand, high traction force is prioritised at low speeds while, on the other hand, maximum power output is favoured at higher speeds. Force and power increase from the standard to the low-pressure tyre and ballasted configurations, while velocity decreases. Efficiency, as the ratio between measured and declared power, was calculated using Equation (10) and was found to vary between 64% and 70% for the 66 kW tractor and between 70% and 74% for the 86 kW tractor. When comparing slip behaviour as the forward speed increased, lower pressure and ballasting allowed for an actual speed closer to the theoretical one, resulting in less wheel slippage (Figure 8). The slip value of 15% in the low-power tractor was maintained up to approximately 4 km/h while, in the high-power tractor, it was maintained until approximately 6 km/h. Although this behaviour could be seen as a negative effect, as the actual speed is lower due to slipping, it is actually positive for TF, considering that high slip values also result in higher TF (Figure 5). Nevertheless, the value of wheel slip that provides the maximum TF is directly influenced by vertical load and the grip conditions of the track (Figure 9a). The trend of NTR as a function of slip was approximately the same across the six configurations, confirming that both NTR and slip are parameters strictly related to wheel–ground interactions (Figure 9b).

5. Conclusions

Two tractors characterised by different power outputs were considered for performance evaluation, and were evaluated in three different configurations: standard tractor configuration, tractor adjusted with low tyre inflation pressure, and ballasted tractor. Analysing the performance results in terms of traction, the three parameters clearly affected pulling force and power while increasing forward speed. The results indicated that a decrease in tyre inflation pressure improved performance at the drawbar. Lower pressure in the tyres increased the contact area with the ground, resulting in load distribution over a wider surface area and lower soil compaction. The drawbar pull measured for the tractor with low tyre pressure was higher with respect to the standard tractor pressure adjustment up to speeds of 4 km/h and 6 km/h for the 66 and 86 kW tractors, respectively. Above these forward speeds, the drawbar pull data recorded were equivalent under both tractor pressure configurations. To better understand tyre–terrain interactions, an in-depth study should be carried out, as there is a lack of recent studies from 2000 to the present day [20].
When analysing the ballasted tractors, the measurement results demonstrated the effect of increasing tractor weight on the drawbar pull: it was higher within the evaluated range of speeds. Ballasting is a widespread, economical, and practical method for reducing wheel slip and consequently fuel consumption, improving traction capacity and tractor stability—key parameters for optimising tractor operations and increasing profitability, as previously evidenced in the literature [21,22]. The tractor’s power had a strong impact on the pulling force and pulling power above a speed of 4 km/h (i.e., when the low-power tractor was unable to sustain a sufficiently high slip). Analysing the net traction ratio, it is worth observing that, up to a forward speed of 4 km/h, tyre pressure and (even more so) ballast positively influenced the NTR. Between 4 and 6 km/h, the NTR was influenced by the power of the tractor engine and ballast only in the high-power tractor. NTR above 6 km/h was influenced only by the engine’s power output. Overall, the higher-powered tractor achieved greater efficiency results, compared to the lower-powered tractor. For a deeper investigation of the obtained results, further research—mainly with respect to the comparison between the drawbar power and the power at power take-off—is advisable. All tests were conducted on a concrete track to ensure the comparability of the results, as the surface maintained consistent adhesion properties with the wheels. However, future tests on agricultural soil could complement the results for the evaluation of tractor performance under real-world conditions. Fuel consumption would also be worth evaluating in future work.

Author Contributions

Conceptualization, F.B., P.G. and R.V.; methodology, F.B. and R.V.; software, F.B.; validation, F.B., F.L. and P.G.; formal analysis, F.B. and F.L.; investigation, F.L. and P.G.; resources, P.G. and R.V.; data curation, F.B.; writing—original draft preparation, F.B. and P.G.; writing—review and editing, F.B., P.G. and R.V.; visualization, F.B. and P.G.; supervision, R.V. All authors have read and agreed to the published version of the manuscript.

Funding

This research received no external funding.

Data Availability Statement

Data is unavailable due to privacy.

Acknowledgments

The authors acknowledge the support of the technical staff of the “Meccanica Agraria” Laboratory at the University of Bologna, and the support of CNH for information and making the tractors available.

Conflicts of Interest

The authors declare no conflicts of interest.

Abbreviations

The following abbreviations are used in this manuscript:
OECDOrganization for Economic Co-operation and Development
4WDFour-wheel drive
CoGCentre of gravity
NTRNet traction ratio
W a Static weights at the front wheels on the ground
W b Static weights at the rear wheels on the ground
TFTraction force
WTractor weight
aHorizontal distance between the CoG and rear axle
bHorizontal distance between the CoG and front axle
HStatic height above ground of the line of draught
RaHorizontal ground reactions on the front wheels
RbHorizontal ground reactions on the rear wheels
ZWheelbase
F a Tractive effort at the front axle of the tractor
F b Tractive effort at the rear axle of the tractor
F m Total tractive effort of the tractor
W d y n l i m Dynamic axle load limit
n e Engine speed
τ Transmission ratio
v t Theoretical forward speed
v a Actual forward speed
RIDynamic index radius
T R Travel reduction

References

  1. Moinfar, A.M.; Shahgholi, G.; Gilandeh, Y.A.; Gundoshmian, T.M. The Effect of the Tractor Driving System on Its Performance and Fuel Consumption. Energy 2020, 202, 117803. [Google Scholar] [CrossRef]
  2. Taghavifar, H.; Mardani, A. Evaluating the Effect of Tire Parameters on Required Drawbar Pull Energy Model Using Adaptive Neuro-Fuzzy Inference System. Energy 2015, 85, 586–593. [Google Scholar] [CrossRef]
  3. Šmerda, T.; Čupera, J. Tire Inflation and Its Influence on Drawbar Characteristics and Performance—Energetic Indicators of a Tractor Set. J. Terramechanics 2010, 47, 395–400. [Google Scholar] [CrossRef]
  4. Kabir, M.S.N.; Chung, S.-O.; Kim, Y.-J.; Shin, S.-H. Comparison of Test Standards for the Performance and Safety of Agricultural Tractors: A Review. J. Biosyst. Eng. 2014, 39, 158–165. [Google Scholar] [CrossRef]
  5. OECD Standard Codes. OECD Standard Code for the Official Testing of Agricultural and Forestry Tractors, Organisation for the Economic Co-Operation and Development. Available online: www.oecd.org/agriculture/tractor/codes (accessed on 1 April 2025).
  6. OECD Code 2. OECD Standard Code for the Official Testing of Agricultural and Forestry Tractor Performance, Organisation for the Economic Co-Operation and Development. Available online: www.oecd.org/agriculture/tractor/codes (accessed on 1 April 2025).
  7. Battiato, A.; Diserens, E. Influence of Tyre Inflation Pressure and Wheel Load on the Traction Performance of a 65 KW MFWD Tractor on a Cohesive Soil. J. Agric. Sci. 2013, 5, 197. [Google Scholar] [CrossRef]
  8. Raper, R.L.; Bailey, A.C.; Burt, E.C.; Way, T.R.; Liberatit, P. The effects of reduced inflation pressure on soil-tire interface stresses and soil strength. J. Terramechanics 1995, 32, 43–51. [Google Scholar] [CrossRef]
  9. Burt, E.C.; Bailey, A.C.; Patterson, R.M.; Taylor, J.H.; Asae, A. Combined Effects of Dynamic Load and Travel Reduction on Tire Performance. Trans. ASAE 1979, 22, 40–45. [Google Scholar]
  10. Kim, W.-S.; Kim, Y.-J.; Lee, N.-G.; Baek, S.-M.; Baek, S.-Y.; Kim, Y.-S. Influence of tire contact area on the traction performance of a 67-kw agricultural tractor in a paddy field. J. ASABE 2022, 65, 1421–1432. [Google Scholar] [CrossRef]
  11. Botta, G.F.; Jorajuria, D.; Draghi, L.M. Influence of the Axle Load, Tyre Size and Configuration on the Compaction of a Freshly Tilled Clayey Soil. J. Terramechanics 2002, 39, 47–54. [Google Scholar]
  12. Khalid, M.; Smith, J.L. Axle Torque Distribution in 4WD Tractors. J. Terramechanics 1981, 18, 157–167. [Google Scholar] [CrossRef]
  13. Spagnolo, R.T.; Volpato, C.E.S.; Barbosa, J.A.; Palma, M.A.Z.; De Barros, M.M. Fuel Consumption of a Tractor in Function of Wear, of Ballasting and Tire Inflation Pressure. Eng. Agrícola 2012, 32, 131–139. [Google Scholar] [CrossRef]
  14. Kumar, S.; Noori, M.T.; Pandey, K.P. Performance Characteristics of Mode of Ballast on Energy Efficiency Indices of Agricultural Tyre in Different Terrain Condition in Controlled Soil Bin Environment. Energy 2019, 182, 48–56. [Google Scholar] [CrossRef]
  15. Regazzi, N.; Mattetti, M.; Molari, G. Nuovi Sistemi Di Zavorramento per Trattori. Available online: https://terraevita.edagricole.it/macchine-agricole-trattori/nuovi-sistemi-zavorramento-per-trattori/ (accessed on 23 February 2024).
  16. Varani, M.; Mattetti, M.; Maraldi, M.; Molari, G. Mechanical Devices for Mass Distribution Adjustment: Are They Really Convenient? Agronomy 2020, 10, 1820. [Google Scholar] [CrossRef]
  17. Gazzetta Ufficiale. Available online: https://www.gazzettaufficiale.it/eli/id/1994/03/22/093A6158/sg (accessed on 23 February 2024).
  18. Alkhalifa, N.; Tekeste, M.Z.; Jjagwe, P.; Way, T.R. Effects of Vertical Load and Inflation Pressure on Tire-Soil Interaction on Artificial Soil. J. Terramechanics 2024, 112, 19–34. [Google Scholar] [CrossRef]
  19. European Tyre and Rim Technical Organisation (ETRTO). Standards Manual: ETRTO—The European Tyre and Rim Technical Organisation. 2025. Available online: https://www.etrto.org/Publications/Available/Standards-Manual (accessed on 1 April 2025).
  20. Swamy, V.S.; Pandit, R.; Yerro, A.; Sandu, C.; Rizzo, D.M.; Sebeck, K.; Gorsich, D. Review of Modeling and Validation Techniques for Tire-Deformable Soil Interactions. J. Terramechanics 2023, 109, 73–92. [Google Scholar]
  21. Gee-Clouch, D.; Pearson, G.; Mcallister, M. Ballasting Wheeled Tractors to Achieve Maximum Power Output in Frictional-Cohesive Soils. J. Agric. Eng. Res. 1982, 27, 1–19. [Google Scholar]
  22. Zhang, S.; Ren, W.; Xie, B.; Luo, Z.; Wen, C.; Chen, Z.; Zhu, Z.; Li, T. A Combined Control Method of Traction and Ballast for an Electric Tractor in Ploughing Based on Load Transfer. Comput. Electron. Agric. 2023, 207, 107750. [Google Scholar] [CrossRef]
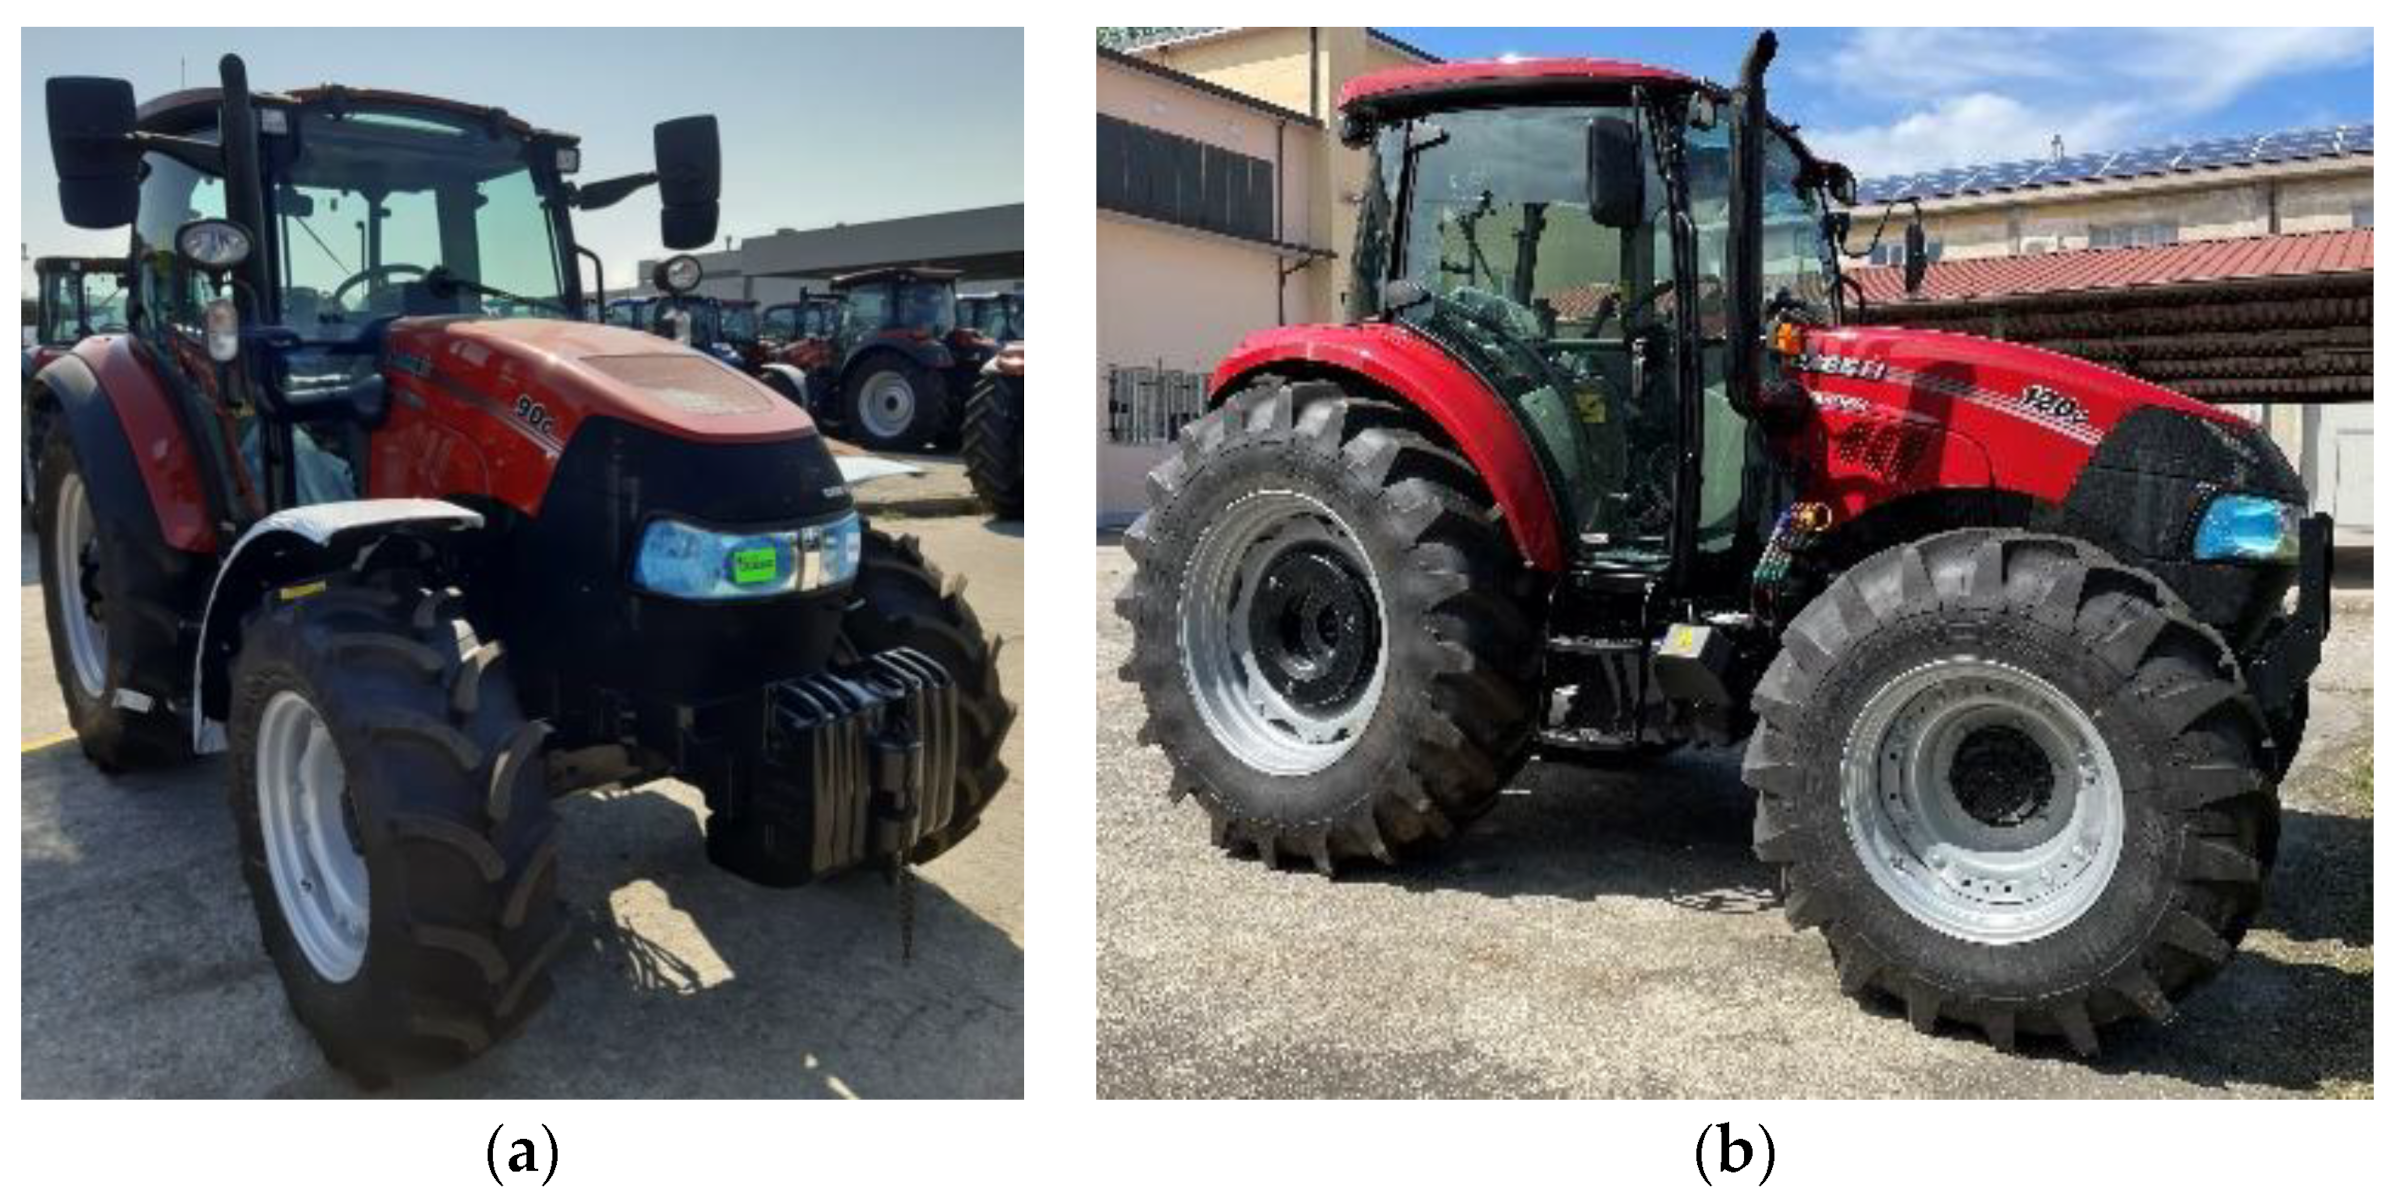
Figure 1. The tractors considered: (a) a low-power tractor and (b) a high-power tractor.
Agriengineering 07 00109 g001
Figure 2. Dynamic equilibrium of a 4WD tractor when the tractor applies a horizontal pull force.
Agriengineering 07 00109 g002
Figure 3. The traction test: (a) a pulling tractor with a braking tractor and (b) a load cell.
Agriengineering 07 00109 g003
Figure 4. Summary of the tractors involved in the research and relative configurations considered.
Agriengineering 07 00109 g004
Figure 5. Traction force vs. forward speed: pulling force available at the tractor drawbar.
Agriengineering 07 00109 g005
Figure 6. Net traction ratio vs. forward speed: traction force TF to tractor weight W ratio.
Agriengineering 07 00109 g006
Figure 7. Traction power vs. forward speed: blue, standard configuration; green, low-pressure configuration; red, ballasted configuration.
Agriengineering 07 00109 g007
Figure 8. Travel reduction vs. forward speed.
Agriengineering 07 00109 g008
Figure 9. Traction force and net traction ratio vs. travel reduction: (a) test drawbar pull comparison (ballasted and unballasted) and (b) test vehicle net traction ratio comparison (ballasted and unballasted).
Agriengineering 07 00109 g009
Table 1. Specifications of the tractors in the traction performance tests.
DescriptionUnit
Braking tractorJohn Deere 6620 (97 kW)
Weight (kN)55.72
Pulling tractorsCASE IH Farmall 90 (66 kW)
CASE IH Farmall 120 (86 kW)
Weight W (kN)40.17
Wheelbase Z (m)2.285
Tyre (front–rear) (m)14.9 R24–18.4 R34
Tyre width (front–rear) (m)0.378–0.467
Speed Radius Index RI (front–rear) (m)0.60–0.775
Rim diameter D (front–rear) (m)0.61–0.86
Tyre inflation pressure (front–rear) (kPa)160–160
Table 2. Tested tractor configurations.
ConfigurationPower (kW)Tyre Inflation Pressure (kPa)Height of the Drawbar (m)Total Weight (kN)Front Weight
(kN)
Rear Weight
(kN)
Distance from CoG to Front Wheels (m)Distance from CoG to Rear Wheels (m)
W1P1p166800.49540.1716.2323.941.3620.923
W1P2p1661600.49540.1716.2323.941.3620.923
W2P2p1661600.49042.8718.8823.991.2791.006
W1P1p286800.49540.1716.2323.941.3620.923
W1P2p2861600.49540.1716.2323.941.3620.923
W2P2p2861600.49042.8718.8823.991.2791.006
Disclaimer/Publisher’s Note: The statements, opinions and data contained in all publications are solely those of the individual author(s) and contributor(s) and not of MDPI and/or the editor(s). MDPI and/or the editor(s) disclaim responsibility for any injury to people or property resulting from any ideas, methods, instructions or products referred to in the content.