Article

From Simulation to Field Validation: A Digital Twin-Driven Sim2real Transfer Approach for Strawberry Fruit Detection and Sizing

1
Department of Agricultural and Biological Engineering, Gulf Coast Research and Education Center, Institute of Food and Agricultural Sciences, University of Florida, Wimauma, FL 33598, USA
2
Department of Mechanical and Aerospace Engineering, University of Florida, Gainesville, FL 32611, USA
*
Author to whom correspondence should be addressed.
AgriEngineering 2025, 7(3), 81; https://doi.org/10.3390/agriengineering7030081
Submission received: 6 February 2025 / Revised: 28 February 2025 / Accepted: 10 March 2025 / Published: 17 March 2025

Abstract

:
Typically, developing new digital agriculture technologies requires substantial on-site resources and data. However, the crop’s growth cycle provides only limited time windows for experiments and equipment validation. This study presents a photorealistic digital twin of a commercial-scale strawberry farm, coupled with a simulated ground vehicle, to address these constraints by generating high-fidelity synthetic RGB and LiDAR data. These data enable the rapid development and evaluation of a deep learning-based machine vision pipeline for fruit detection and sizing without continuously relying on real-field access. Traditional simulators often lack visual realism, leading many studies to mix real images or adopt domain adaptation methods to address the reality gap. In contrast, this work relies solely on photorealistic simulation outputs for training, eliminating the need for real images or specialized adaptation approaches. After training exclusively on images captured in the virtual environment, the model was tested on a commercial-scale strawberry farm using a physical ground vehicle. Two separate trials with field images resulted in F1-scores of 0.92 and 0.81 for detection and a sizing error of 1.4 mm (R2 = 0.92) when comparing image-derived diameters against caliper measurements. These findings indicate that a digital twin-driven sim2real transfer can offer substantial time and cost savings by refining crucial tasks such as stereo sensor calibration and machine learning model development before extensive real-field deployments. In addition, the study examined geometric accuracy and visual fidelity through systematic comparisons of LiDAR and RGB sensor outputs from the virtual and real farms. Results demonstrated close alignment in both topography and textural details, validating the digital twin’s ability to replicate intricate field characteristics, including raised bed geometry and strawberry plant distribution. The techniques developed and validated in this strawberry project have broad applicability across agricultural commodities, particularly for fruit and vegetable production systems. This study demonstrates that integrating digital twins with simulation tools can significantly reduce the need for resource-intensive field data collection while accelerating the development and refinement of agricultural robotics algorithms and hardware.

Graphical Abstract

1. Introduction

Smart technologies in agriculture will play a crucial role in ensuring future food security amidst growing economic pressures, including population growth, labor shortages, climate change, and evolving consumer demands. Even though investment in agricultural technologies by both government institutions [1] and venture capitalists [2] has been on the rise in the past decade to meet this demand, the development of agritech equipment for adoption by farmers still requires significant capital with many risks. One reason is that research and development for smart agricultural systems requires field data collection and testing of systems that, depending on the crop, may not be readily accessible. For example, field testing of autonomous harvesters can only occur during a limited timeframe out of an entire year. In recent years, a new focus on combining digital twin technology with deep learning algorithms has expanded opportunities for precision agriculture and smart farming [3,4,5]. Digital twins are virtual replicas of physical objects, systems, or processes that are updated as they interact in a simulated environment [6]. Researchers have introduced digital twin environments that incorporate neural network-driven feedback loops, enabling more robust sim-to-real deployment. Their applications in agriculture have been diverse, from optimizing irrigation systems [7] to crop health assessment [8,9] and simulating sensor data to help in the development of robotic systems [10]. Studies have also demonstrated the use of computer graphics software for 3D modeling of plant growth behavior [11] or estimating light interception according to modeled leaf structures [12]. The use of 3D modeling of crops in a simulated agricultural environment interacting with virtual sensors and robotic platforms demonstrates the potential of how digital twins can help migrate research and development off the farm and into the virtual domain.
Fruit detection and size evaluation are pivotal tasks in precision agriculture applications, enabling yield estimation, selective harvesting, and postharvest handling decisions [13,14]. Deep learning has become the dominant approach for fruit detection in the past decade. One-stage object detectors (e.g., YOLO-based detectors) are widely applied for their speed and accuracy [15,16]. Researchers often customize YOLO to handle orchard conditions (e.g., cluttered foliage and varying lighting). For example, Sun et al. [17] developed YOLO-P for pear detection, using lightweight shuffle-block backbones and attention modules. Similarly, Ang et al. [18] improved YOLOv8n for young citrus fruit by integrating pointwise convolutions and attention. Two-stage CNN detectors such as Mask R-CNN remain popular, especially when accurate instance segmentation is needed [19,20]. Mask R-CNN has been applied successfully to segment and count fruits in challenging settings [21]. For example, Chen et al. [22] compared a two-stage Mask R-CNN with one-stage methods for per-berry segmentation. Mask R-CNN obtained the best result in accurately segmenting each grape berry, enabling the counting of individual berries in a cluster. Huang et al. [23] collected images of grape clusters from eight varieties under different lighting and occlusion conditions. They used an attention-enhanced Mask R-CNN to perform instance segmentation of entire grape clusters on this dataset.
Accurate fruit size and volume estimation are crucial for yield forecasting, grading, and harvest planning. Traditional 2D images can be used for sizing if the scale (distance) is known, but 3D vision provides direct depth information for more reliable measurements. Recent studies leverage stereo cameras or RGB-D sensors to measure fruit dimensions on the plant. Stereo vision, structured light, and ToF cameras provide both color images and depth maps, enabling the calculation of fruit diameters in real-world units. An example pipeline described by Neupane et al. [24] developed a system to detect fruit in RGB images and fit an ellipse to each fruit’s outline. Using the camera’s calibration, pixel dimensions were converted to metric units via the pinhole camera model. A similar study was conducted to measure the size of non-occluded mango fruit through image segmentation, utilizing both RGB and depth images of tree canopies [25].
However, designing and refining computer vision solutions for these tasks depends on large, well-annotated datasets with accurate ground truth that capture the wide variability of fruit appearances and field conditions. Digital twin environments are mitigating this data bottleneck by generating synthetic, photorealistic images for model training. For example, Mirbod and Choi [26] recreated a strawberry field in simulation using detailed 3D strawberry plant models, allowing them to capture a large set of synthetic 2D images as training data. A CNN-based fruit detector trained solely on these simulated images achieved an F1-score of 0.80 on real-field photos, and performance jumped to an F1-score of 0.93 when a mixture of synthetic and real images was used. This demonstrated that synthetic data can substantially reduce the amount of real-world imagery needed to train reliable detectors. A 2024 study by Rajeswari et al. [27] introduced a digital twin-empowered drone system that continuously fused data from IoT sensors and drone imagery into a crop’s digital twin for real-time yield forecasting. The system achieved a yield prediction accuracy of 91.69% in trials.
However, developing high-fidelity and photorealistic rendering for virtual environments is not a trivial problem. Traditional robot simulators like Gazebo, while useful for physics, lack visual realism and thus can leave a gap when transitioning vision models to the real world. This obstacle is called domain shift or reality gap, where the training dataset distribution (artificial data) is significantly different from the test dataset (real-world data). In the past, many studies have found that mixing a portion of real images with a simplified synthetic dataset is an effective approach to bridge this reality gap. For example, Goondram et al. [28] found that using a combination of synthetic strawberry plant images mixed with real strawberry images produced the best fruit detection result (F-1 score of 98.3%), while training purely on synthetic images resulted in a much lower detection accuracy (F-1 score of 7.7%). A recent study by Singh et al. [10] developed a virtual strawberry field environment for simulated robotic harvesting. They combined real and synthetic data to train a fruit detector, achieving an F1-score of 0.99 on their test image datasets.
To further close this reality gap, domain adaptation techniques through generative and adversarial network approaches such as CycleGAN [29] have become more widely used in precision agriculture, plant phenotyping, and postharvest quality assessment [30]. Rendered images from 3D modeling software have been used along with CycleGAN for the adaptation of plant image features, such as improving color correlation. For example, Fei et al. [31] used 3D vine models with a semantically constrained GAN for style transfer. They reported a 61.7% AP score; however, even after implementing further adaptations, such as maintaining fruit size and position, they achieved only modest improvements in fruit detection for field images. Zhang et al. [32] introduced an “easy domain adaptation” method for fruit detection across species. They used CycleGAN to transform labeled orange images into the style of apples and tomatoes, generating “fake” target images that look like the new fruit species. In a wheat leaf segmentation/counting scenario, Li et al. [33] translated rendered images to real style using CycleGAN to reduce feature distribution disparity dramatically. The adapted model’s error (RMSE 8.7) was similar to a model trained on real data, whereas a model without adaptation would fail to generalize. Despite these advancements in domain adaptation techniques, incorporating in real images with synthetic images for training models has still produced a more acceptable fruit detection accuracy [26,28,34]. In addition, integrating domain adaptation strategies into fruit detection pipelines indeed introduces additional complexity. Techniques such as CycleGAN-based style transfer, semantically constrained GANs, or feature alignment modules often require extra training stages, heavy computational cost, and careful hyperparameter tuning to converge. In practice, these steps can increase computational overhead and lengthen development cycles.
The current literature has shown promising results on the usage of digital twins and synthetic data for applications related to digital agriculture. However, a comprehensive approach to developing agricultural systems in a virtual environment that can be readily transferrable to field use without additional domain adaptation techniques has been limited. For example, the optimization of irrigation systems using digital twins is still confined mostly to simulated data rather than field conditions. Simulated farming environments, integrated with 3D crop models, exhibit visual deficiencies that reduce the efficacy of synthetic data in accurately representing actual farm environments. For fruit detection tasks in the field, generative adversarial networks have been used as an intermediary step to narrow the gap between synthetic and real data; however, an acceptable performance for field application still requires a mixture of real images to train models on. To maximize the potential of digital twins, developed algorithms based on simulated interactions with the digital replica should readily transfer to real-world data usage and tasks. Ideally, minimal adaptation techniques should be implemented to ensure that the digital twin can be generalized to numerous tasks. With these considerations in mind, the goal of this study was to create a virtual replica of a strawberry farm to assist with the development of machine vision tasks for strawberry crop management using only synthetic data derived from the digital twin. Specific objectives were to:
  • Develop a virtual representation of a plasticulture strawberry farm containing beds, plants, and environment for robotic sensing applications.
  • Gather RGB stereo imaging data in the virtual and physical domains for the tasks of fruit count and fruit size.
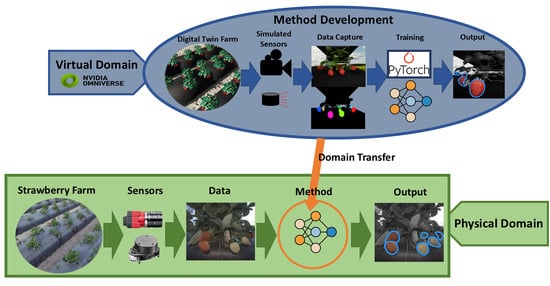
  • Implement fruit detection and sizing algorithms in simulation using the digital twin and apply them to field data.
The novelty of this work lies in demonstrating a robust sim-to-real transfer for fruit detection and sizing without relying on additional domain adaptation or real imagery. By recreating a realistic agricultural environment in a digital twin, this research aims to show how rapid development and testing of machine vision and robotic systems can be accomplished for both 2D and 3D tasks in strawberry production. Through automated data collection, synthetic image labeling, and neural network model training, the approach offers a foundation for broader applications in precision agriculture, reducing the temporal and logistical barriers inherent to real-field data collection.

2. Materials and Methods

Figure 1 illustrates the relationship between a strawberry farm at the University of Florida Gulf Coast Research and Education Center (Wimauma, FL, USA) and its digital replica, showing the sequential steps taken to train a neural network model within the virtual environment and subsequently importing it into the physical world. First, the farm environment and its assets were modeled, and a modeled ground vehicle for collecting data was imported onto the scene. A sample of the strawberry plant replicas was then used to train a fruit detection and segmentation model, which would be applied to the simulated field for fruit counting and fruit sizing. Finally, once the methods for fruit counting and sizing were tested in the simulated environment, they were applied to real strawberry images collected by the ground vehicle in the field.
The goal was to replicate the real strawberry field as closely as possible, in both spatial representation accuracy and visual fidelity, such that sensor readings gathered from both domains would be as similar as possible. The intention of this approach was to rely exclusively on synthetic data acquired from the digital twin to train neural network models and test robotic system sensors that would be used in the field. All simulations and model training were conducted using a Dell Precision 7920 Workstation running Ubuntu 20.04 with a dual Intel Xeon Gold 6226R Processor, 128 GB RAM, and NVidia RTX A6000 graphics card (NVIDIA, Santa Clara, CA, USA). Simulations for sensor data collection on the virtual farm were conducted using Nvidia’s Omniverse platform (Version 2022.2.1, NVIDIA, Santa Clara, CA, USA), specifically employing the Isaac Sim robotic simulator (Version 2022.2.1, NVIDIA, Santa Clara, CA, USA).

2.1. Field Data Collection

A ground platform was developed to traverse the strawberry beds, taking images of strawberry plants (Figure 2). Three pairs of stereo cameras were mounted on the sides and top of the vehicle facing the bed to capture images of strawberry plants from different viewpoints. Two side-view stereo pairs were positioned 35 cm above the ground and 10 cm from the plastic beds (plant base). The top cameras were placed 77 cm above the ground and 52 cm from the bed. All cameras captured images at a resolution of 1936 (H) × 1216 (V) pixels. A stereo camera pair consisted of two global shutter 2.4-megapixel cameras from Allied Vision (model Alvium 1800 C-240, Allied Vision, Stadtroda, Germany) with 3 mm focal length M12 lenses.
The stereo pair cameras had a short baseline (30 mm) due to the close proximity of the cameras to the side of the beds. The top of the platform was covered with a tarp to reduce the effect of lighting variability from the sun on the images, and an active light source using light-emitting diodes (LEDs) was placed near each stereo camera pair to better expose the strawberry plants during imaging. The light source for each stereo camera consisted of four LEDs from Cree (model XLamp CMA3090, Cree Inc., Durham, NC, USA), each outputting 86.4 Watts of power, with a color temperature of 4000 degrees Kelvin and a luminous flux of 12,372 lumens. Each camera pair ran on a Raspberry Pi 4 with Ubuntu version 18.04. The Robot Operating System 1 (ROS1) was used to interface with the cameras and capture images. All six cameras were simultaneously triggered using an Arduino Mega microcontroller board at a rate of 3 Hz as the vehicle moved over the beds using a remote control at a speed of approximately 1 m per second. On two separate trials, data were collected from two rows of the ‘Florida Brilliance’ strawberry variety at the University of Florida Gulf Coast Research and Education Center (Wimauma, FL, USA), as summarized in Table 1. The first trial was conducted two days before ripe fruits were harvested, and the second trial was conducted two days after the harvest. Comparisons before and after harvest make it possible to observe how fruit distribution, ripeness, and overall plant architecture shift between these two stages. Pre-harvest conditions generally include a higher density of large, fully ripe fruit, whereas the postharvest period often comprises fewer or less mature berries and altered foliage. Evaluating detection performance under both scenarios demonstrates whether the pipeline can adapt to different fruit densities and visual cues, ultimately providing a more comprehensive assessment of its reliability across the harvest cycle. Fifty strawberry plants in sequence from each row were selected, and images of the side and top views of the plants were captured as the vehicle traversed over the beds.
Figure 3 illustrates the procedure for collecting ground-truth fruit diameters in the field. In Figure 3A, each strawberry was tagged at the stem to ensure that individual fruits could be accurately tracked in the images. In Figure 3B, two perpendicular diameters, labeled “Diameter 1” and “Diameter 2”, were then recorded using calipers, with the calipers oriented along axes that best approximate orthogonal cross-sections of the berry. A representative “mean diameter” was calculated by averaging these measurements in order to mitigate potential errors arising from asymmetrical fruit shapes. This methodology offers a millimeter-scale reference for each fruit’s size and serves as a benchmark against which computer-vision diameter estimates can be validated.

2.2. Virtual Strawberry Farm Implementation

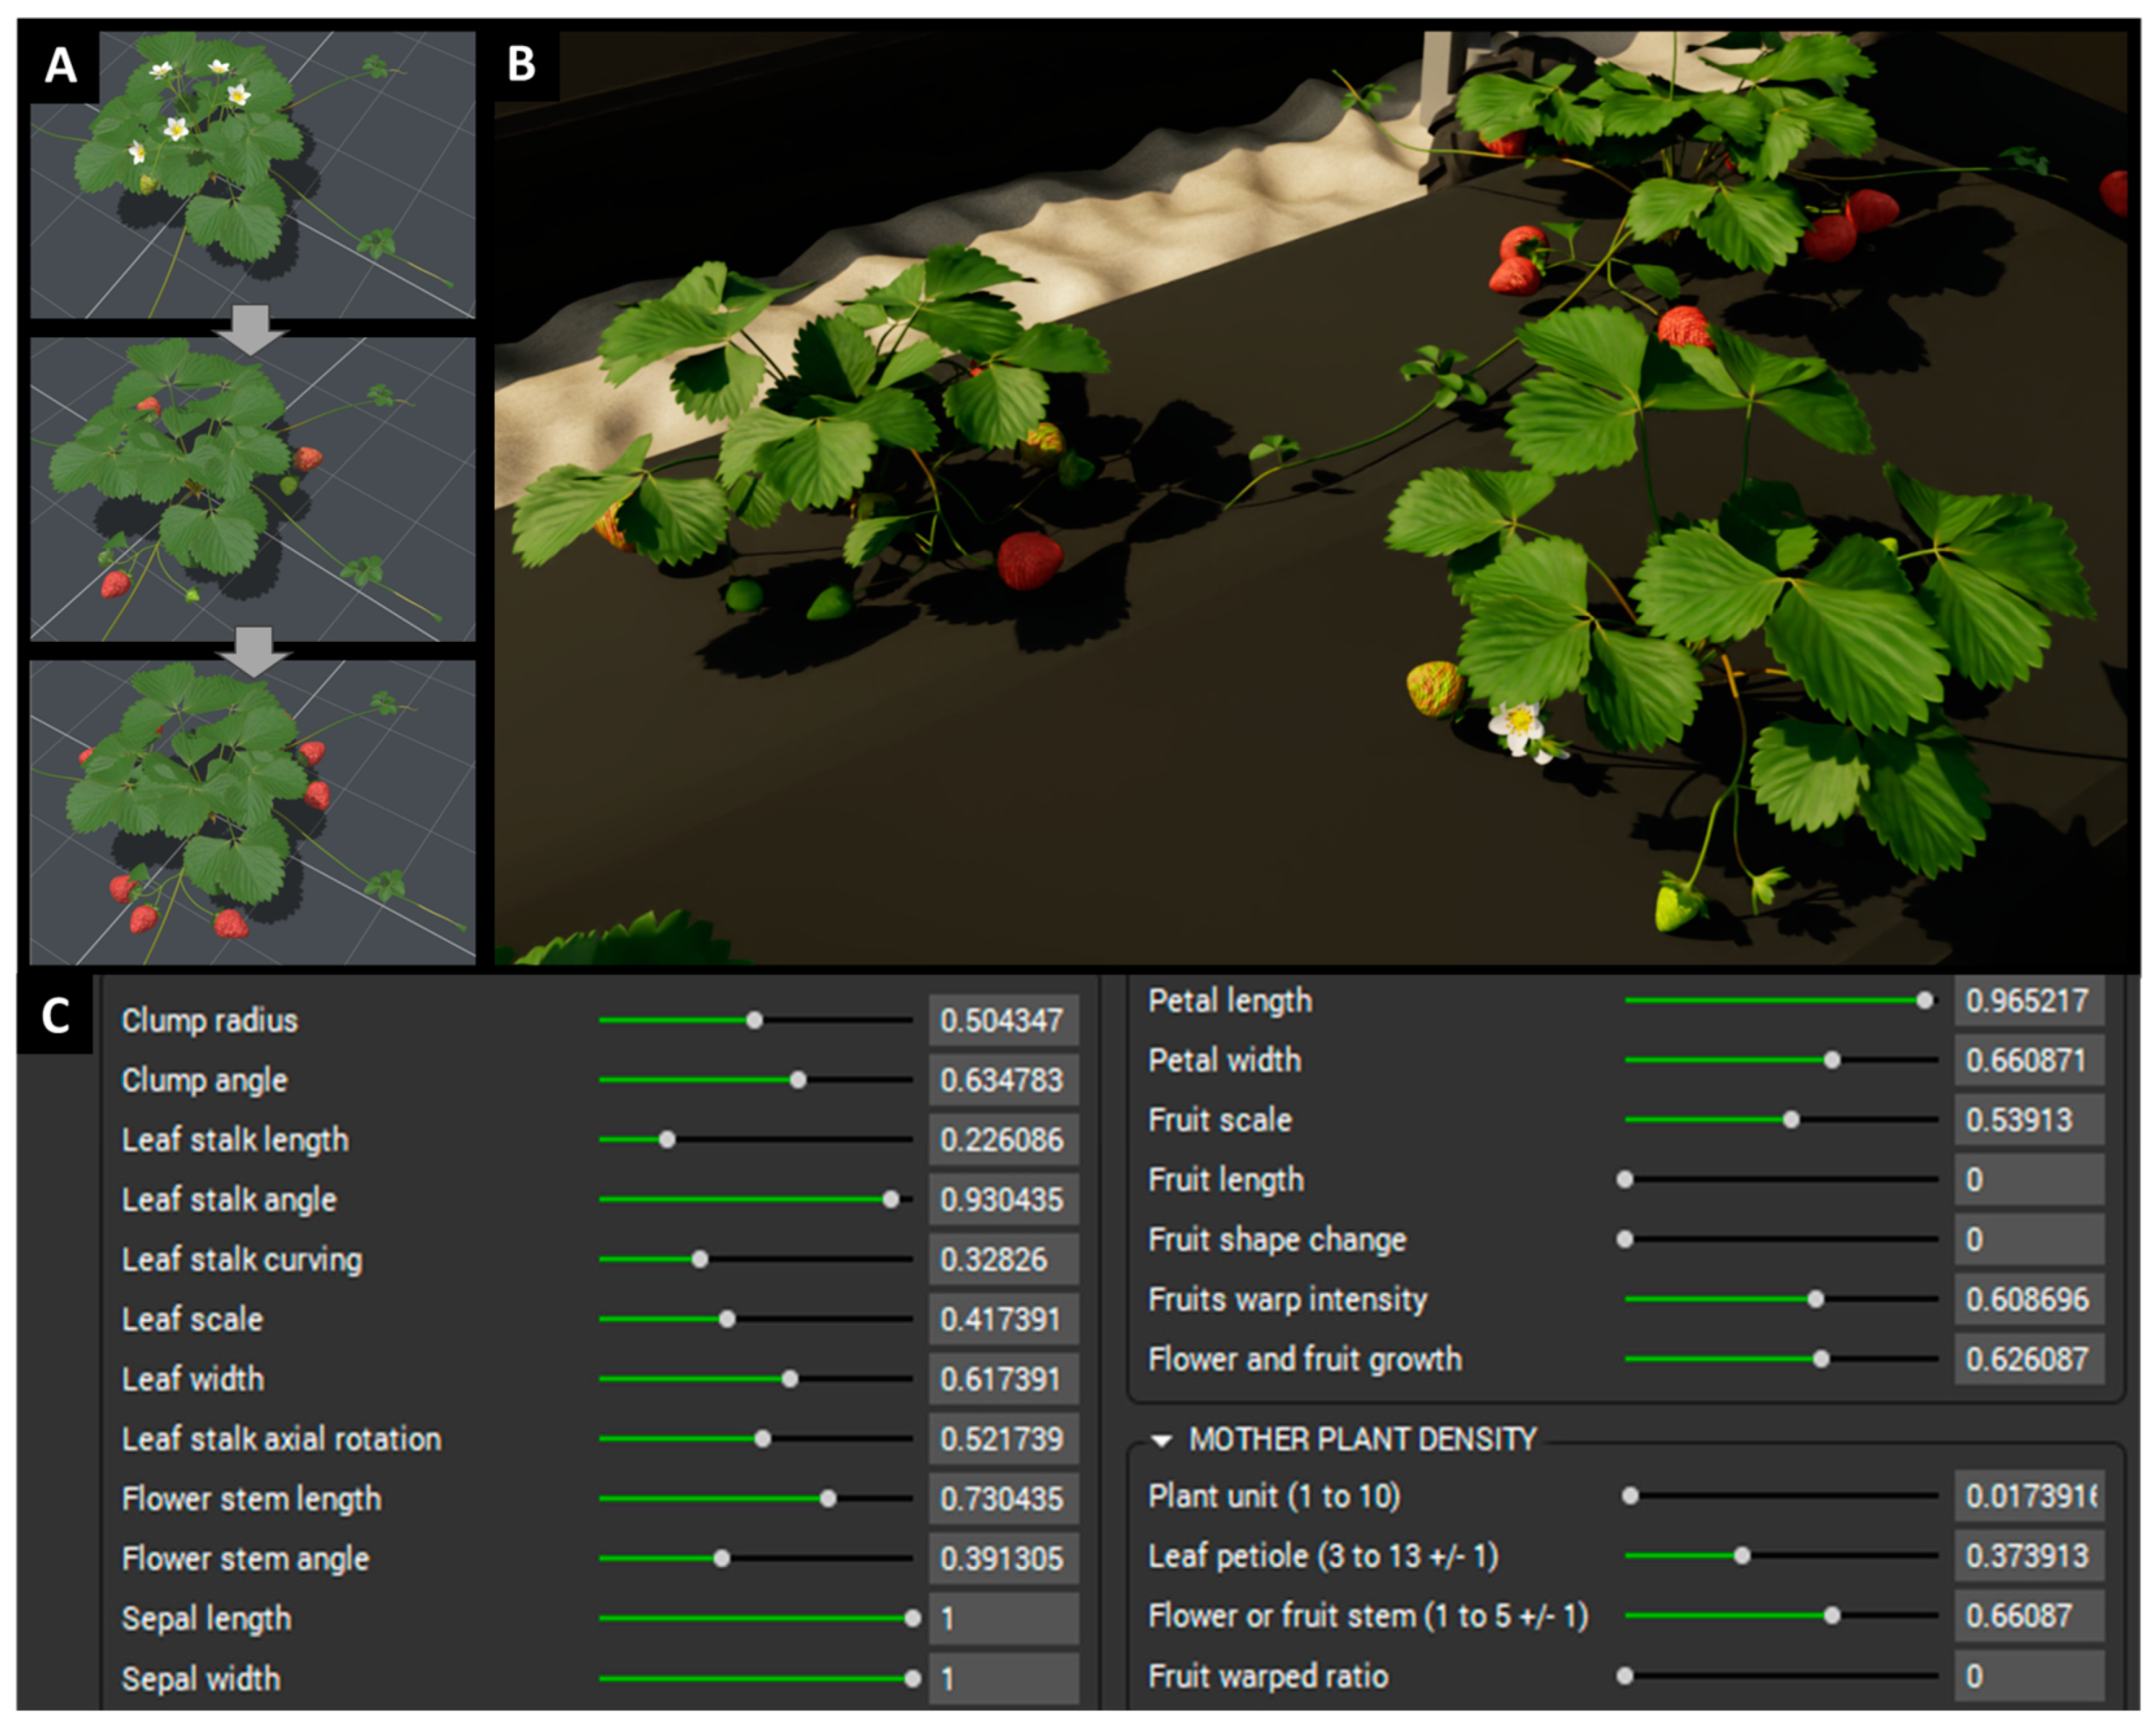
2.2.1. Strawberry Farm Scene

The strawberry beds were measured in the field and modeled using SolidWorks (Version 31, Dassault Systèmes, Vélizy-Villacoublay, France). The sandy soil terrain model was obtained from the TurboSquid catalog (Product ID: 1758506, TurboSquid, New Orleans, LA, USA). The 3D strawberry plant model was custom-built by E-on Software PlantFactory 2023 (Bentley Systems Inc., Exton, PA, USA). The plant was developed using procedural modeling, a technique used in computer graphics that employs predefined rules and algorithms to generate the structure, texture, and intricate details of a model. This method contrasts with traditional manual creation, providing a more systematic and flexible approach to recreating individual elements. It enables the construction of complex details without the need for the tedious manual design of each component. A 3D strawberry plant developed under procedural modeling offers the end-user the flexibility to modify various plant characteristics with ease, such as fruit maturity stage, canopy size, or fruit count, as well as allows generating randomized variations in the model once desired plant characteristics are chosen (Figure 4). For example, Figure 4C illustrates the procedural modeling interface used to customize and generate a wide range of strawberry plant variations. Each slider corresponds to a morphological parameter such as leaf stalk length, leaf width, fruit scale, or petal dimensions and can be dynamically adjusted to alter the plant’s geometry, structure, and growth stages. For instance, increasing the ‘fruit shape change’ or ‘fruit warp intensity’ sliders modifies berry contours to simulate different cultivars or growth anomalies while adjusting the ‘leaf scale’ or ‘flower stem angle’ to create realistic canopy and blossom arrangements. This approach allows users to efficiently produce numerous high-fidelity 3D plant models without manually sculpting each plant, supporting more comprehensive and diverse synthetic image generation for training and validating fruit detection algorithms. The appropriate range of critical parameters (e.g., fruit size, leaf shape, canopy density) was determined in consultation with experienced strawberry breeding experts in order to simulate biologically plausible plant features for real-world conditions.

2.2.2. Ground Vehicle and Camera System

To import the ground vehicle into the simulator, the SolidWorks assembly model of the vehicle was converted into Unified Robot Description Format (URDF) using the SolidWorks to URDF Exporter tool [35]. This tool generates a hierarchical tree structure of the model and assigns the appropriate links and joint types. For instance, revolute joints were used to represent the chassis connection to the wheels. The model was then imported into the strawberry farm scene using the Isaac Sim URDF import feature. The vehicle was given a constant velocity to traverse over the beds for data collection.
To match the stereo camera setup in the field, the appropriate parameters were given to the simulated camera sensors, including the focal length of the lens (3 mm), camera sensor width and height (6.69 × 4.20 mm), and image width and height (1936 × 1216 pixels). The active lighting was also simulated by inputting parameters such as the shape of the light source and intensity to ensure a close match with the real-world camera setup.

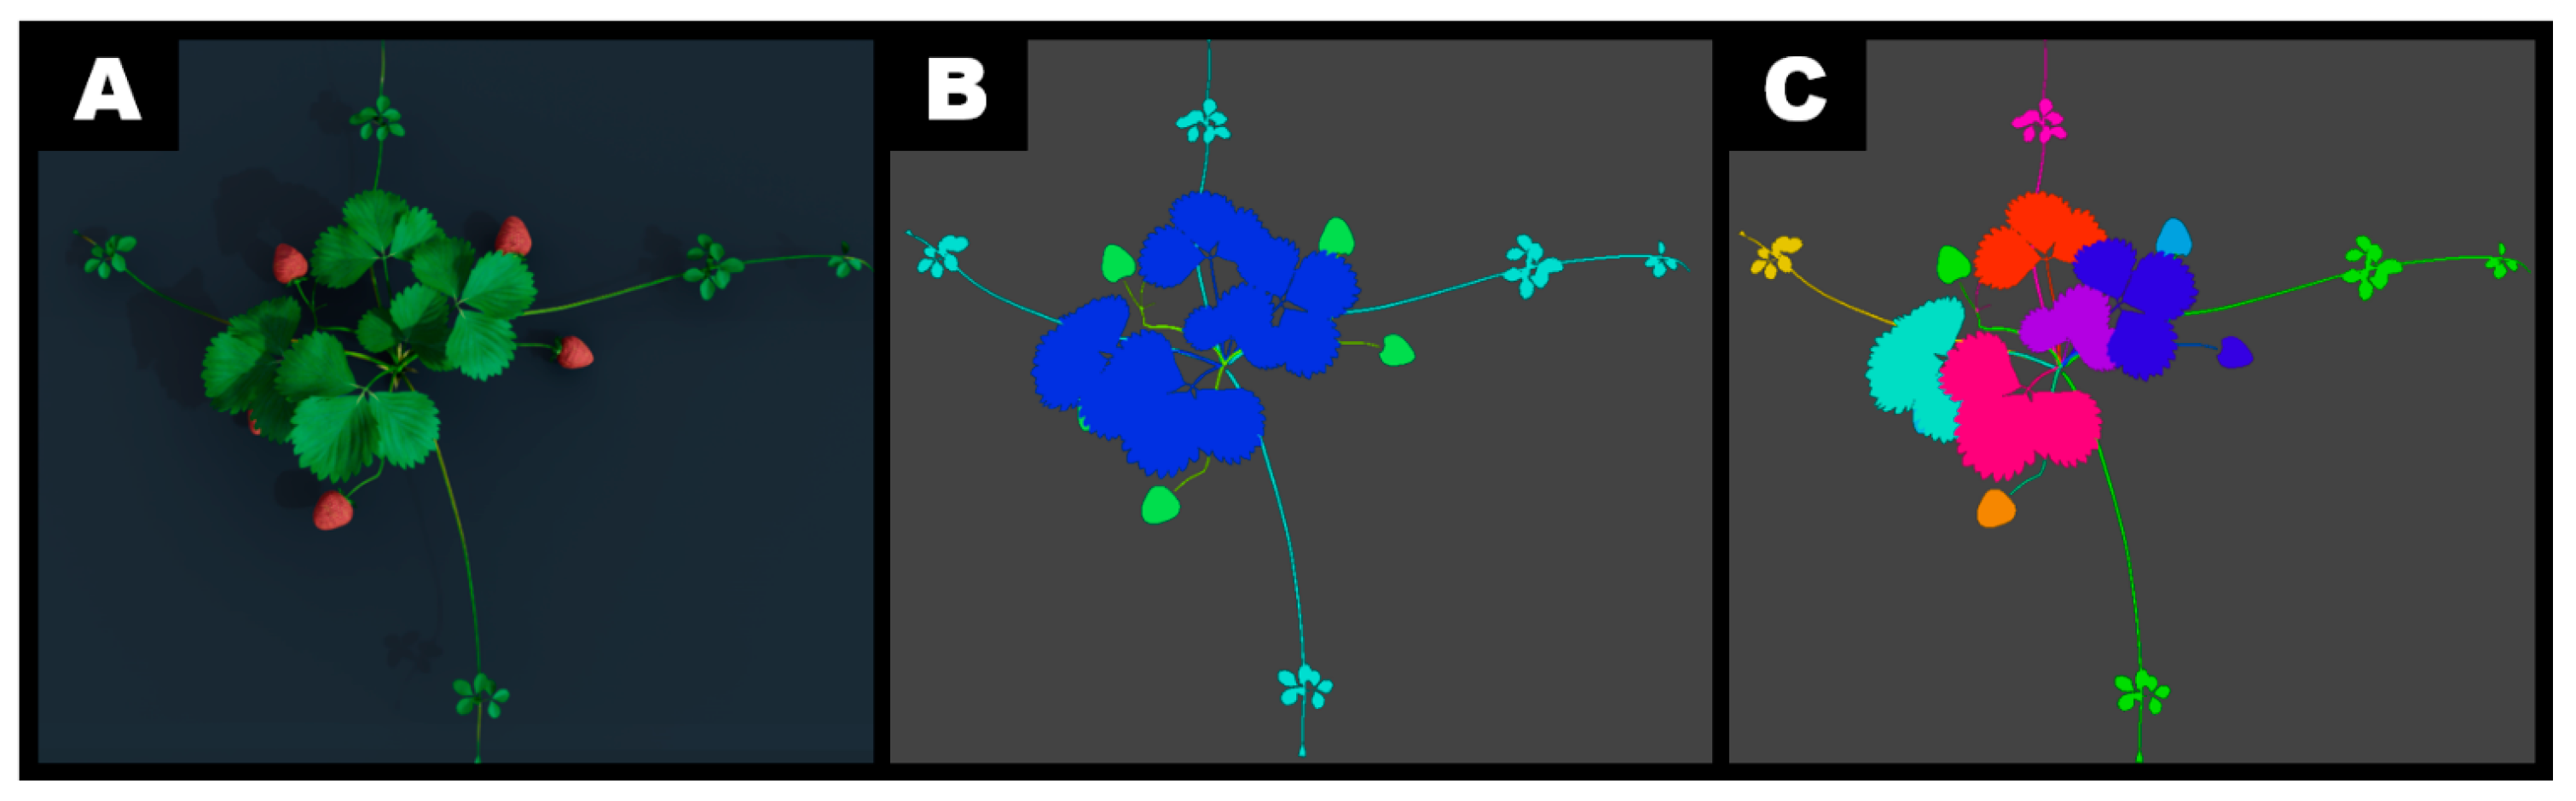
2.3. Fruit Detection Model Training Using Synthetic Data

The strawberry plant model consisted of various interconnected mesh components. Data labeling was accomplished by assigning a class label directly to the desired plant mesh component instead of creating bounding boxes or tracing object boundaries manually. This approach offered an efficient method to accurately label different plant segments without the need for manual annotation techniques on 2D images. Labeling can be achieved through two methods: using the Omniverse API library to identify the desired mesh components in the scene programmatically or by manually selecting the mesh component to assign a class label using the Isaac Sim graphical user interface. Omniverse Replicator (Version 2022.2.1, NVIDIA, Santa Clara, CA, USA) was then used to record data from one of the simulated camera sensors. Figure 5A shows an image of a strawberry plant from one of the simulated cameras. In Figure 5B, semantic segmentation was generated by Omniverse Replicator, and Figure 5C shows instance segmentation. A text file was also generated, which correlates each color code mask with a class label.
Images were collected from three strawberry maturity stages: red, white, and green, with varying sizes (Figure 6). To capture diverse viewpoints, plants were placed on a bed and rotated or translated into the camera’s field of view. Adjusting the distance between the camera and the plants introduced additional variability, allowing the fruit to appear both in and out of focus.
In total, 315 Red–Green–Blue (RGB) images were captured. Each image was paired with automatically generated 2D instance segmentation masks and a text file containing the tight bounding box coordinates of each fruit. A fruit was considered valid for detection if more than half of its surface was visible to the camera and its maturity was past the flowering stage; hence, any fruit from the immature green color stage to the ripe red color stage was included. These annotated images were then used to train a Mask R-CNN model, implemented via the TorchVision library (Version 0.15) within PyTorch (Version 2.0). Mask R-CNN was chosen for its high instance segmentation accuracy [19]. While Mask R-CNN can be computationally demanding and data-intensive [20], synthetic data with automated labeling helps mitigate these challenges. The model was trained for 15 epochs with a batch size of 10, keeping all other hyperparameters at their default settings. Training was halted at epoch 15 when no further improvement in the loss function was observed in order to prevent overfitting (Figure 7). Additional details on the datasets used for training, validation, and testing can be found in Table 2. A total of 315 synthetic images were used for training the fruit detection neural network, containing a diverse range of simulated scenarios. A total of 50 synthetic images served as validation for tuning hyperparameters and preventing overfitting during model development. A total of 135 real images formed the test set to evaluate real-world performance after final model selection.
The performance of the detection algorithm was measured using Precision, Recall, and F1-scores. Precision (Equation (1)) measures how many of the predicted positives (e.g., detected fruits) are actually correct, as given by
P r e c i s i o n = T P T P + F P
Recall (Equation (2)) indicates how many of the actual positives (actual fruits present) were correctly identified, defined by
R e c a l l = T P T P + F N
F1 is the harmonic mean of Precision and Recall, offering a single measure that balances both,
F 1 = 2 × P r e c i s i o n × R e c a l l P r e c i s i o n + R e c a l l
In these equations, TP (true positives) are correctly detected fruits, FP (false positives) are instances incorrectly identified as fruits when none exist, and FN (false negatives) are missed detections (i.e., fruits present but not detected).

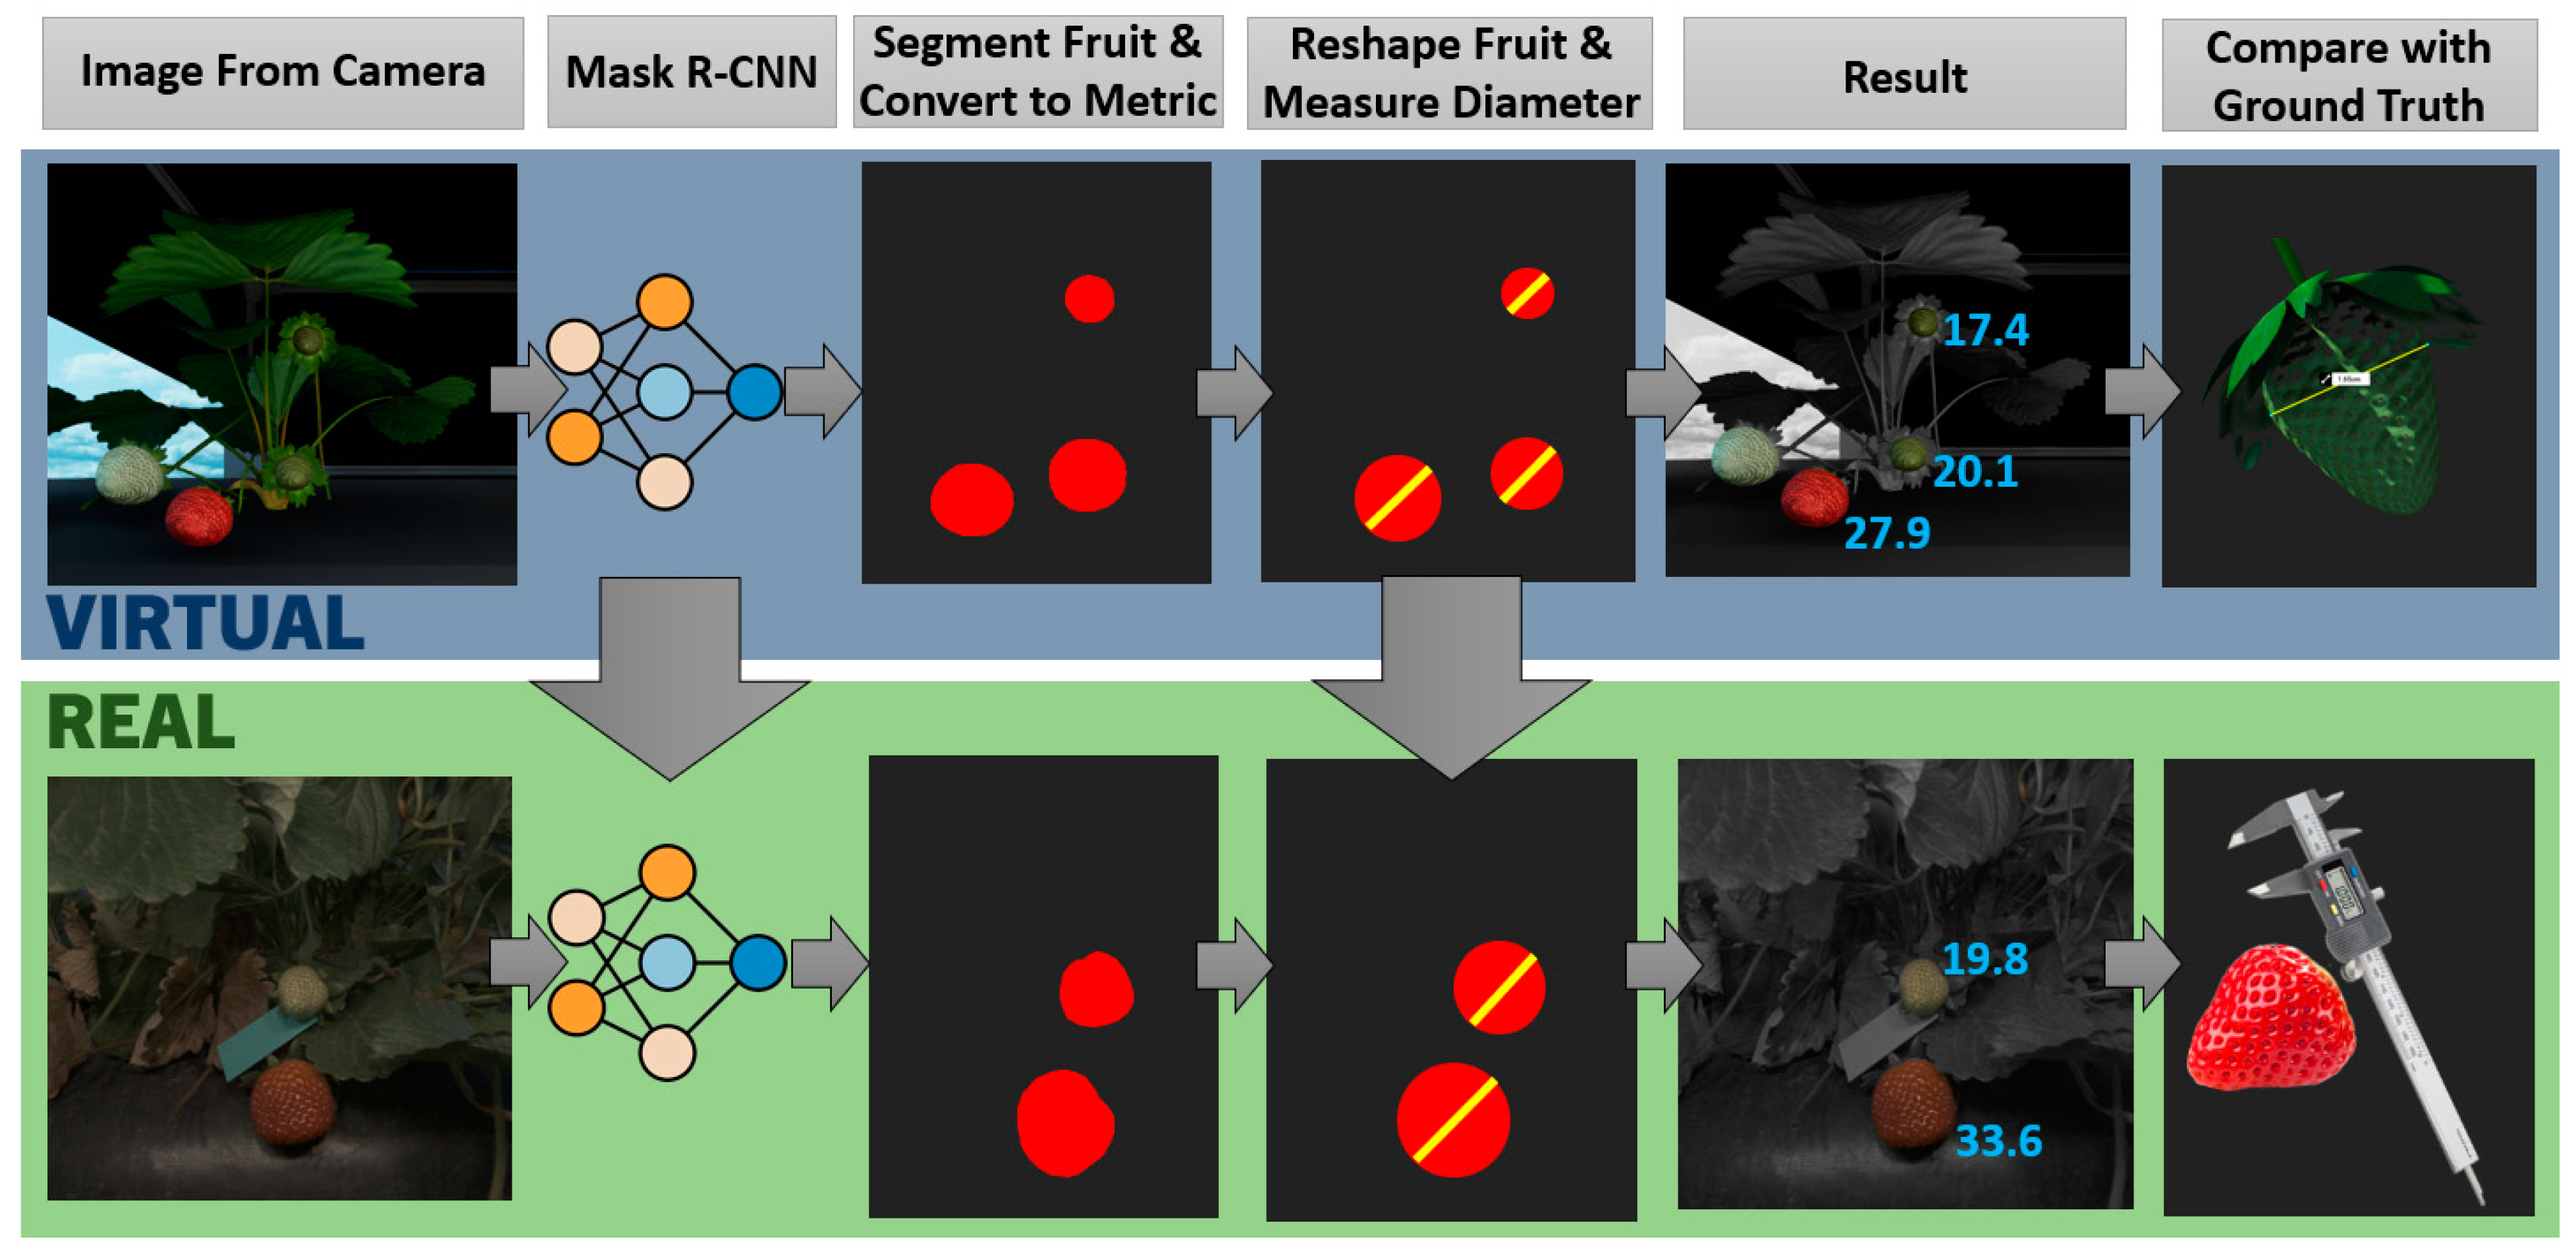
2.4. Validating Strawberry Fruit Sizing Pipeline with Synthetic Data

This fruit sizing pipeline builds on the authors’ previous deep learning-based fruit size estimation [36], adapting it to the specific geometry of a strawberry bed and the distance between the camera and plants. The pipeline begins by segmenting each strawberry in an image with a Mask R-CNN model. The real-world equivalent of each pixel was then calculated using the intrinsic parameters of the simulated camera (based on the Alvium camera sensor and lens). Summing across all masked pixels yielded a total surface area, which was approximated as a circular cross-section to obtain a diameter measurement (Figure 8). In this study, the method was adapted by focusing on strawberries oriented with the calyx (base) facing the camera by excluding strawberries with angled views, thereby capturing a near-circular cross-section at the widest point of each berry and avoiding angular distortion. This orientation reduces the likelihood of partial occlusion or elongated, angular distortions and enables more consistent diameter measurements once the Mask R-CNN model has generated segmentation masks. For the fruit-sizing method, we similarly used 50 synthetic images for validation and 50 real images for testing, focusing on measuring diameter accuracy.
A digital measuring tool within the simulation software recorded the major and minor diameters of the 3D strawberry meshes, mirroring the protocol used during field-based ground-truth data collection. For validation, the average of these two diameters is used as the reference diameter when compared to pipeline estimations. A set of 50 images was first collected from a simulated strawberry farm to validate a fruit size estimation method. After the pipeline was verified in the simulated environment, the same method was applied to real-field images and evaluated against physical measurements, demonstrating the benefit of using synthetic data to refine and test agricultural computer vision algorithms prior to field deployment.

3. Results and Discussions

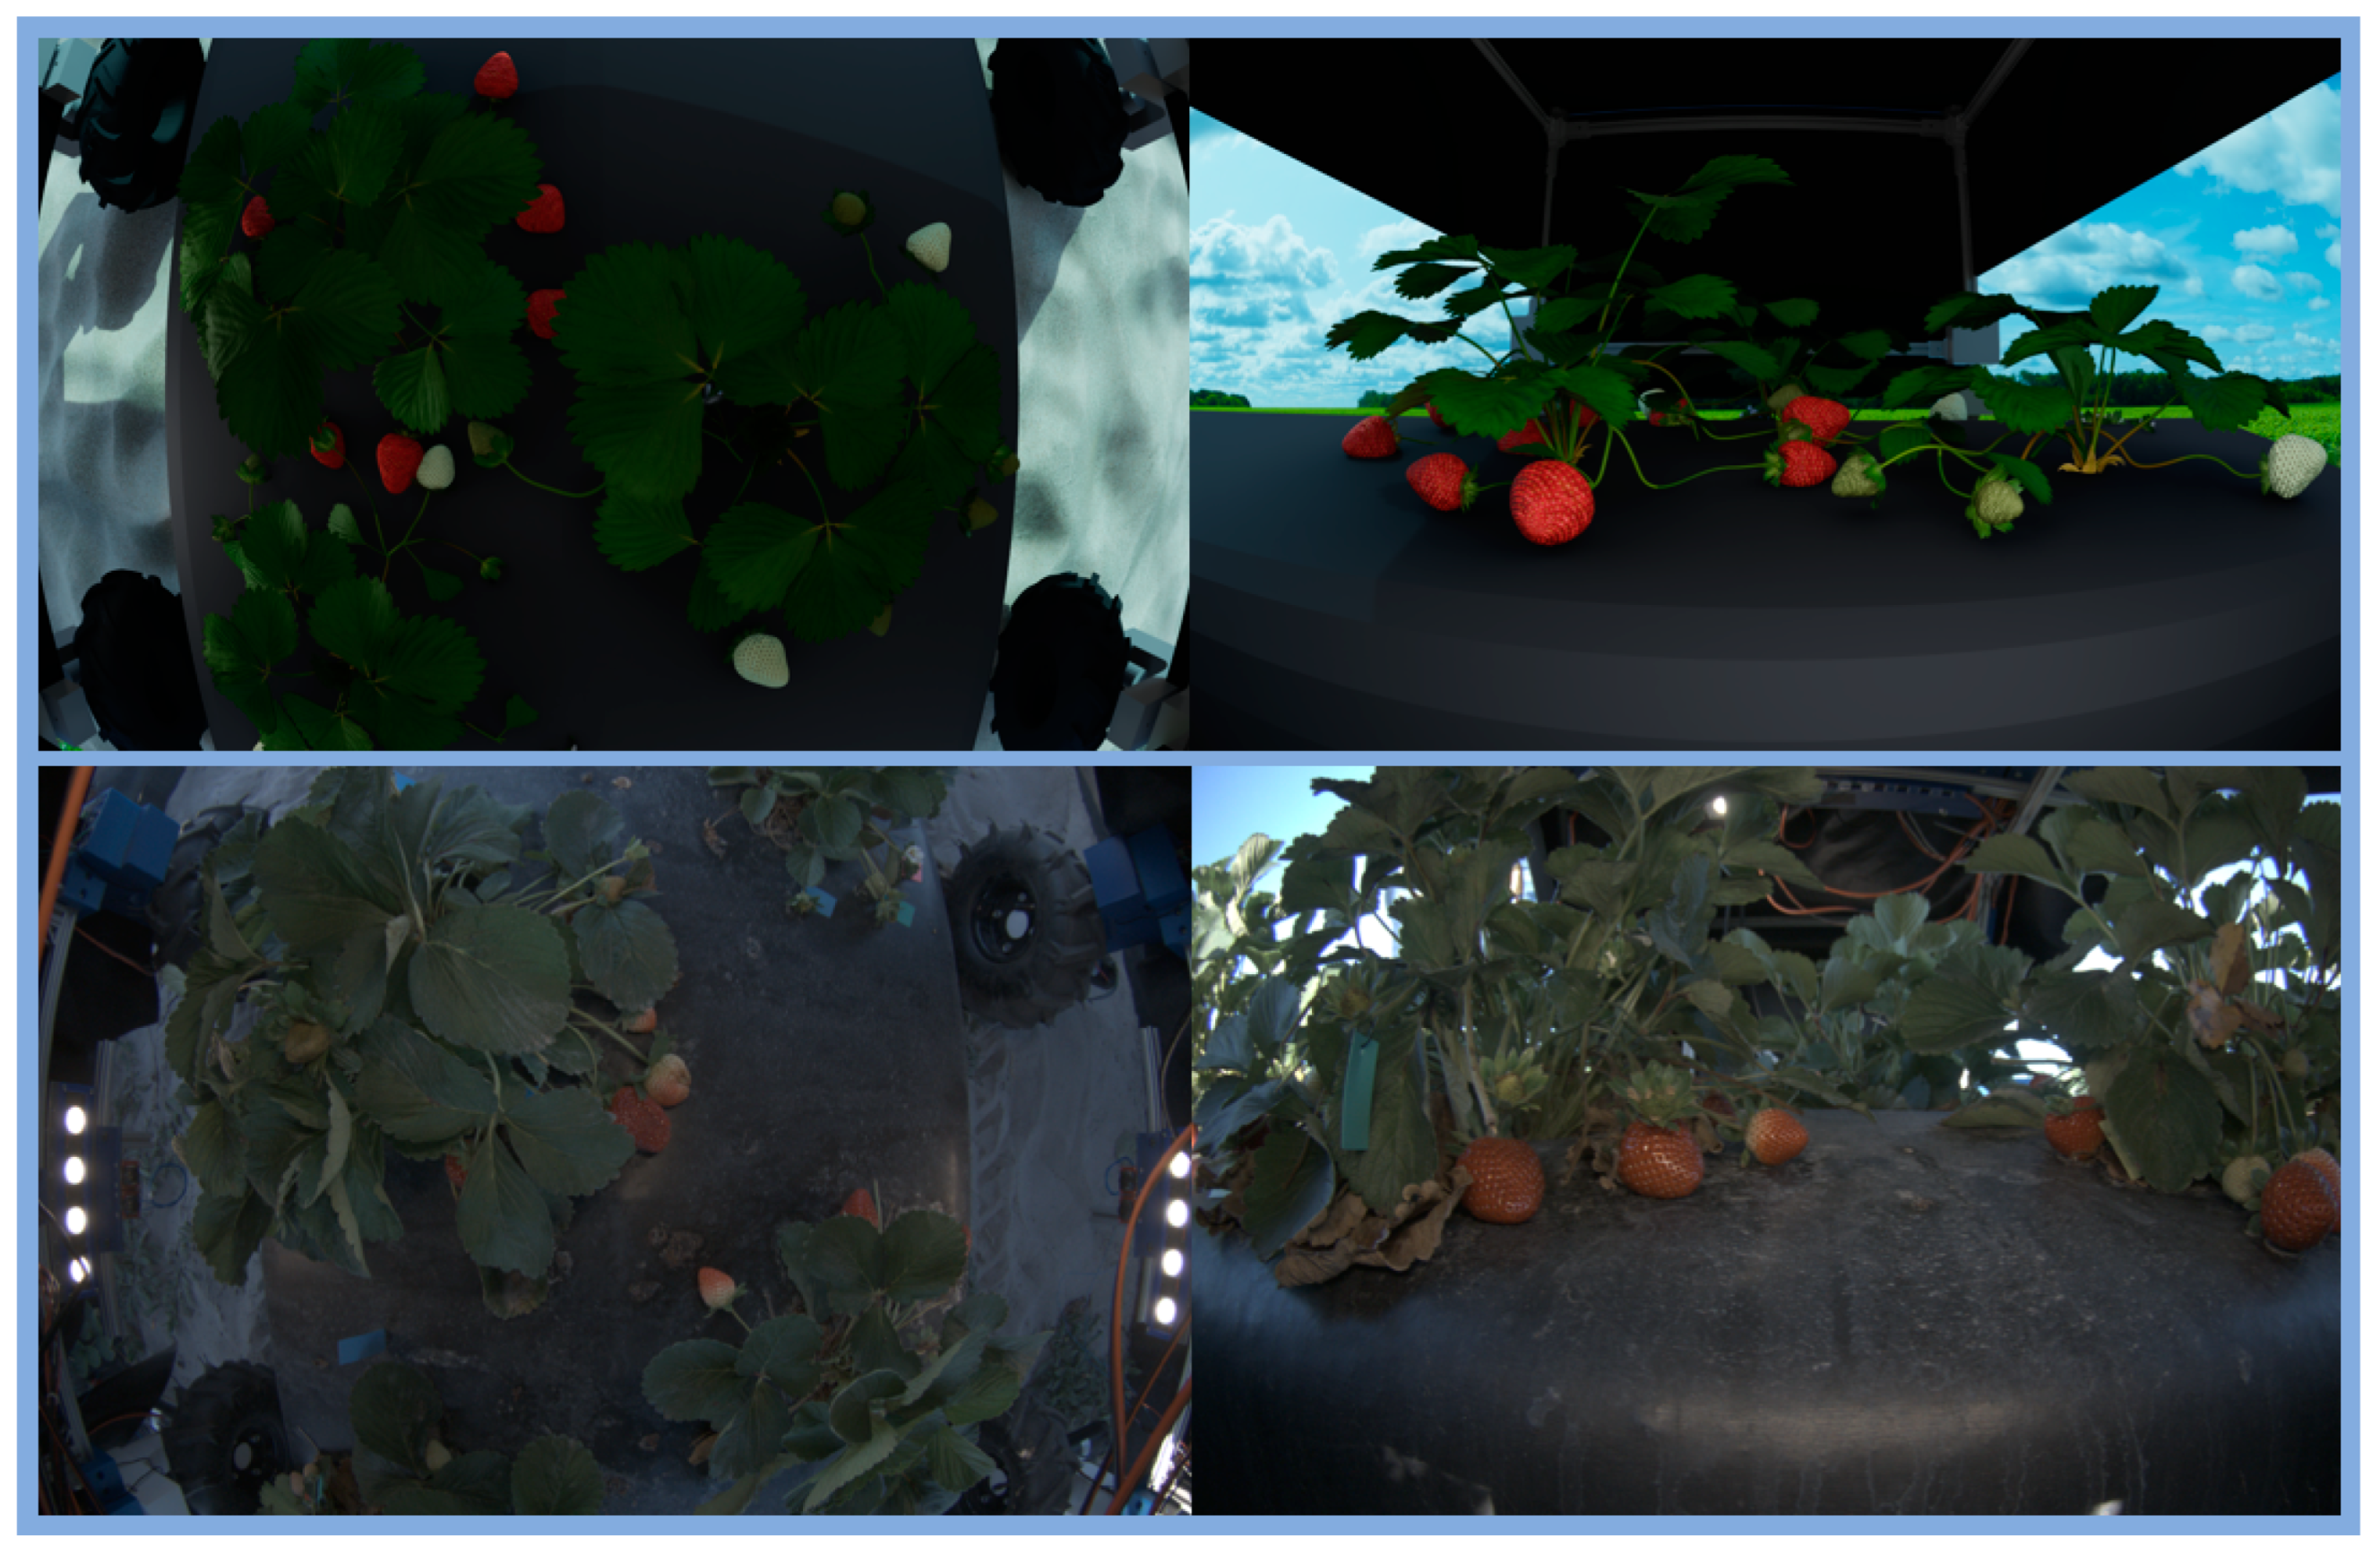
3.1. Comparison of Virtual and Real Strawberry Farms

One approach to evaluating the fidelity of our virtual farm is to directly compare sensor data from the digital twin and the real-field environment. We used ROS as a unified interface to ensure that LiDAR outputs from both domains could be processed in an identical manner, enabling a clear, point-by-point assessment of how accurately the simulated terrain mirrors real-world conditions. Figure 9 illustrates side-by-side LiDAR scans from (A) the simulated sensor in the digital twin farm and (B) the real sensor deployed in the field. Labels (W), (X), and (Y) indicate bed spacing, bed width, and bed height, respectively, while (Z) captures the front-wheel returns caused by sensor proximity effects and artifacts caused by the sensor being positioned too close to the wheels. Table 3 shows that (W) (bed spacing) in the digital twin measured 0.50 m, closely matching the 0.53 m captured by the real LiDAR and the 0.51 m ground-truth measurement. This shows the simulator’s fidelity in reproducing row-to-row distances, a critical factor for robot navigation between plant rows. Minor discrepancies (±0.03 m) likely stem from GPS odometry drift, platform vibrations, and slight variations in how each LiDAR sensor perceives bed edges. For (X) (bed width), the simulator yielded 0.72 m compared to 0.71 m in the field LiDAR data and 0.74 m from manual ground-truth measurements. The small discrepancy within a few centimeters implies that bed contours in the digital twin accurately reflect real-world plant rows. Such consistency proves that algorithms developed for row-following or plant detection in simulation can reliably transfer to the field. Bed height (Y) remained within 0.03 m of ground truth, confirming the digital twin replicates vertical dimensions effectively. Accurate height modeling is especially important for automated sprayers, fruit pickers, or any sensor aiming to detect crop canopy. Even modest deviations can translate to misalignment in the sensor’s perspective; hence, seeing a tight correlation supports the potential reliability of the digital twin in canopy-focused tasks. Label (Z) displays LiDAR beams reflected off the front wheels in both simulation and real-world trials. This observation shows the importance of carefully evaluating sensor placement prior to field trials, a process that can be significantly enhanced by a digital twin. In the virtual environment, any misalignment or mounting configuration can be systematically tested to reveal interference patterns, blind spots, or wheel reflections before they become problematic in actual field operations. By replicating these errors in simulation, researchers can refine equipment designs and sensor positions early on, reducing costly trial-and-error once the system is deployed outdoors.
The second sensor used for evaluation was the RGB camera, offering a direct visual comparison between simulated imagery and real-world photographs (Figure 10). The simulated camera reproduces several key aspects of the real setup, including the approximate lens distortion, field of view, and geometric representation of major objects, such as strawberry plants and bed contours. The reflections from the LED lights are also captured on the plastic bed surface in both images, indicating that light sources and materials in the digital twin are configured to mimic realistic conditions. This level of replication is significant for applications where color, reflection, and object geometry play a crucial role, such as fruit detection or phenotyping algorithms that rely on precise visual information. However, certain discrepancies highlight the inherent reality gap. One prominent difference is the image contrast, particularly around the leaves, which in real-world images exhibit more pronounced texture variations and subtle shadows. Additionally, clutter, dirt, and dry vegetation accumulate naturally in the physical field environment, creating unpredictable elements ranging from small debris to leaf litter that are not fully replicated in the synthetic scene. Such visual noise impacts color tones and overall brightness, thus revealing fine details absent in the cleaner, more controlled simulation. Despite these differences, the general alignment in camera geometry, basic material reflections, and fruit positioning indicates that the simulated camera remains a robust tool for initial model testing and methodological validation before deploying camera-dependent systems in real strawberry fields.

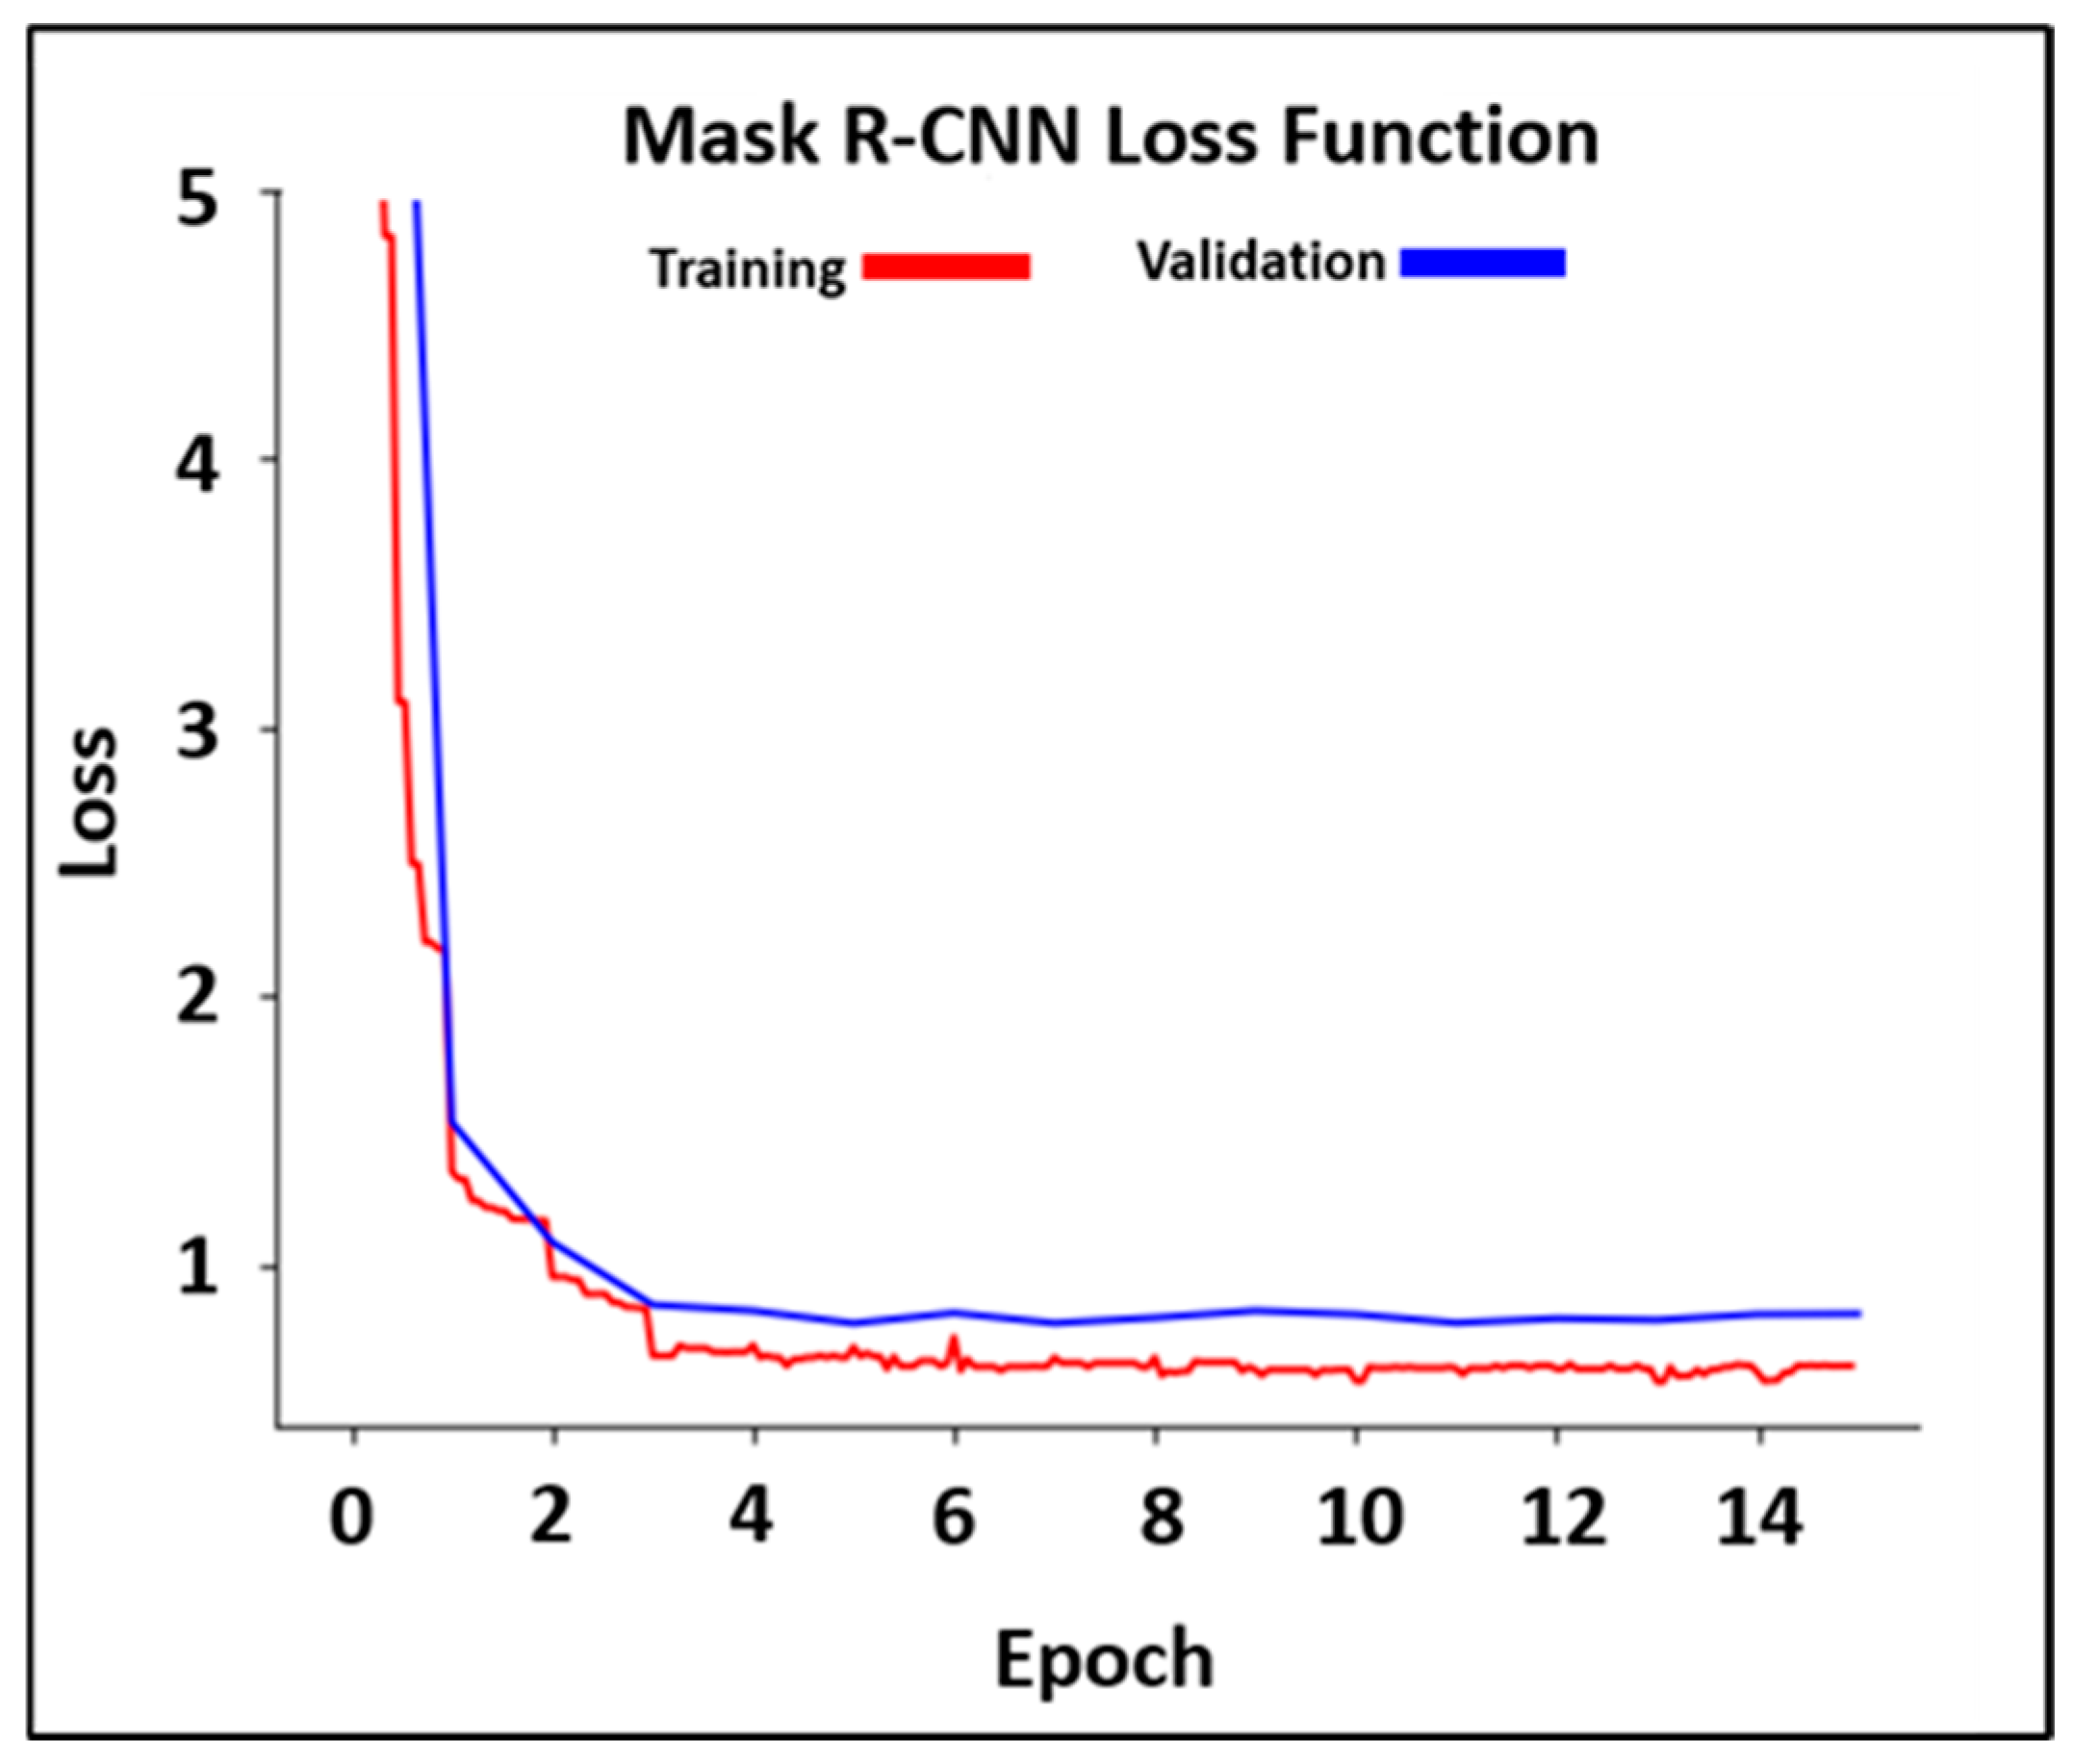
3.2. Fruit Detection Model Performance Using Synthetic Data

The Mask R-CNN model was able to transfer inferences from simulated images to real-field images (Figure 11). However, the detection performance on field images varied depending on the fruit growth stage and image quality.
The results from Table 4 show that in both field trials, the red/ripe fruit stage had the highest detection rate, followed by the white fruit stage and, finally, the green fruit stage. Some of the performance drops for the green fruit detection are likely due to the 3D plant model not accurately capturing the photorealism of the green fruit stage. However, green fruit was detected more often in images where the camera was closest to the bed, which enhanced the size, lighting, and saliency of the fruit in the images. The further the green fruit was from the camera, the more out of focus and blended with the background it would appear. Similar behaviors were observed in the synthetic image dataset when green fruit was either out of focus or positioned farther from the light source, occasionally causing the model to misidentify leaf regions as fruit. This finding shows the multifaceted challenges of replicating real-field conditions in simulation, especially for immature fruits that do not exhibit strong color contrast. A further in-depth study is needed to identify the variables most influential for detection performance. For example, in a separate scenario where training was based solely on red fruit, the model still detected some fruit at the white and green stages, indicating some cross-stage generalization.
One conclusion is that image quality remains a key factor, as higher fruit saliency generally increases the probability of detection. For example, images captured on March 16 benefited from ample daylight and background lighting, whereas those taken on March 20 were near sunset, resulting in lower light conditions. This may have been an influential factor as Precision and Recall were higher for all fruit stages in the Trial 1 dataset compared to Trial 2. However, as shown in Table 4, the F1-score for red fruit remained relatively high on March 20 (0.91), while immature fruits (white and green) exhibited the largest performance decline (green fruit F1 dropped from 0.82 to 0.68). Although our synthetic dataset included variations of immature fruit and plant leaves, replicating fine-grained textures such as subtle leaf veins or unripe berry surfaces in photorealistic detail is challenging. Consequently, when real-world conditions include lower ambient light, the model struggles to detect low-contrast targets that lack the vibrant color cues of ripe strawberries. This discrepancy leads to a ‘domain shift,’ where the distribution of pixel intensities, color channels, and shading diverges from synthetic training data, increasing the risk of false negatives or false positives.
Overall, our experiments yielded F1-scores of 0.92 and 0.81 on two separate trials for strawberry fruit detection using only simulated images for training. These results demonstrate strong detection performance, particularly compared to other synthetic-based or digital twin approaches. For instance, Goondram et al. [28] achieved an F1-score of 0.98 by combining simulated and real strawberry images, but when trained exclusively on simulated data, their F1-score dropped to 0.08. This contrast highlights that a pure simulation pipeline can still excel if the generated images closely match real-field conditions. Another example is Rahnemoonfar and Sheppard [37], who trained a deep network entirely on simulated fruit images, observing 91% average accuracy on 100 real images for counting ripe tomatoes. However, their work focused on counting (a regression task) rather than object-level detection.
In the realm of synthetic images from 3D modeling, Fei et al. [31] integrated 3D vine grape models with a generative adversarial network (GAN) for style transfer. They rendered synthetic vineyard scenes and then applied a semantically constrained GAN to translate these into realistic images while preserving fruit positions and geometry. This approach produced highly realistic training images, resulting in a 61.7% average Precision for mature grape detection with 15 testing images. In comparison, our approach relies on a realistic digital twin to generate synthetic images without a dedicated GAN for image-style translation, suggesting that robust simulation alone can narrow the gap between synthetic and real data.
We found no recent studies that rely exclusively on 100% synthetic data from a fully 3D-modeled or digital twin environment and validate their models entirely on real-field images. Nonetheless, Karabatis et al. [38] generated synthetic olive datasets using a photorealistic 3D tree model and reported a 54% Intersection over Union (IoU) when training predominantly on synthetic data supplemented with a small amount of real data. Similarly, Singh et al. [10] achieved an F1-score of 0.99 on simulated strawberry images using a customized deep learning-based detector trained with both real and synthetic data, though their images include a single fruit per image. In comparison, our results demonstrate that a high-fidelity, purely synthetic simulation can achieve competitive accuracy on actual field images, proving the feasibility of a digital twin-driven pipeline for strawberry fruit detection.

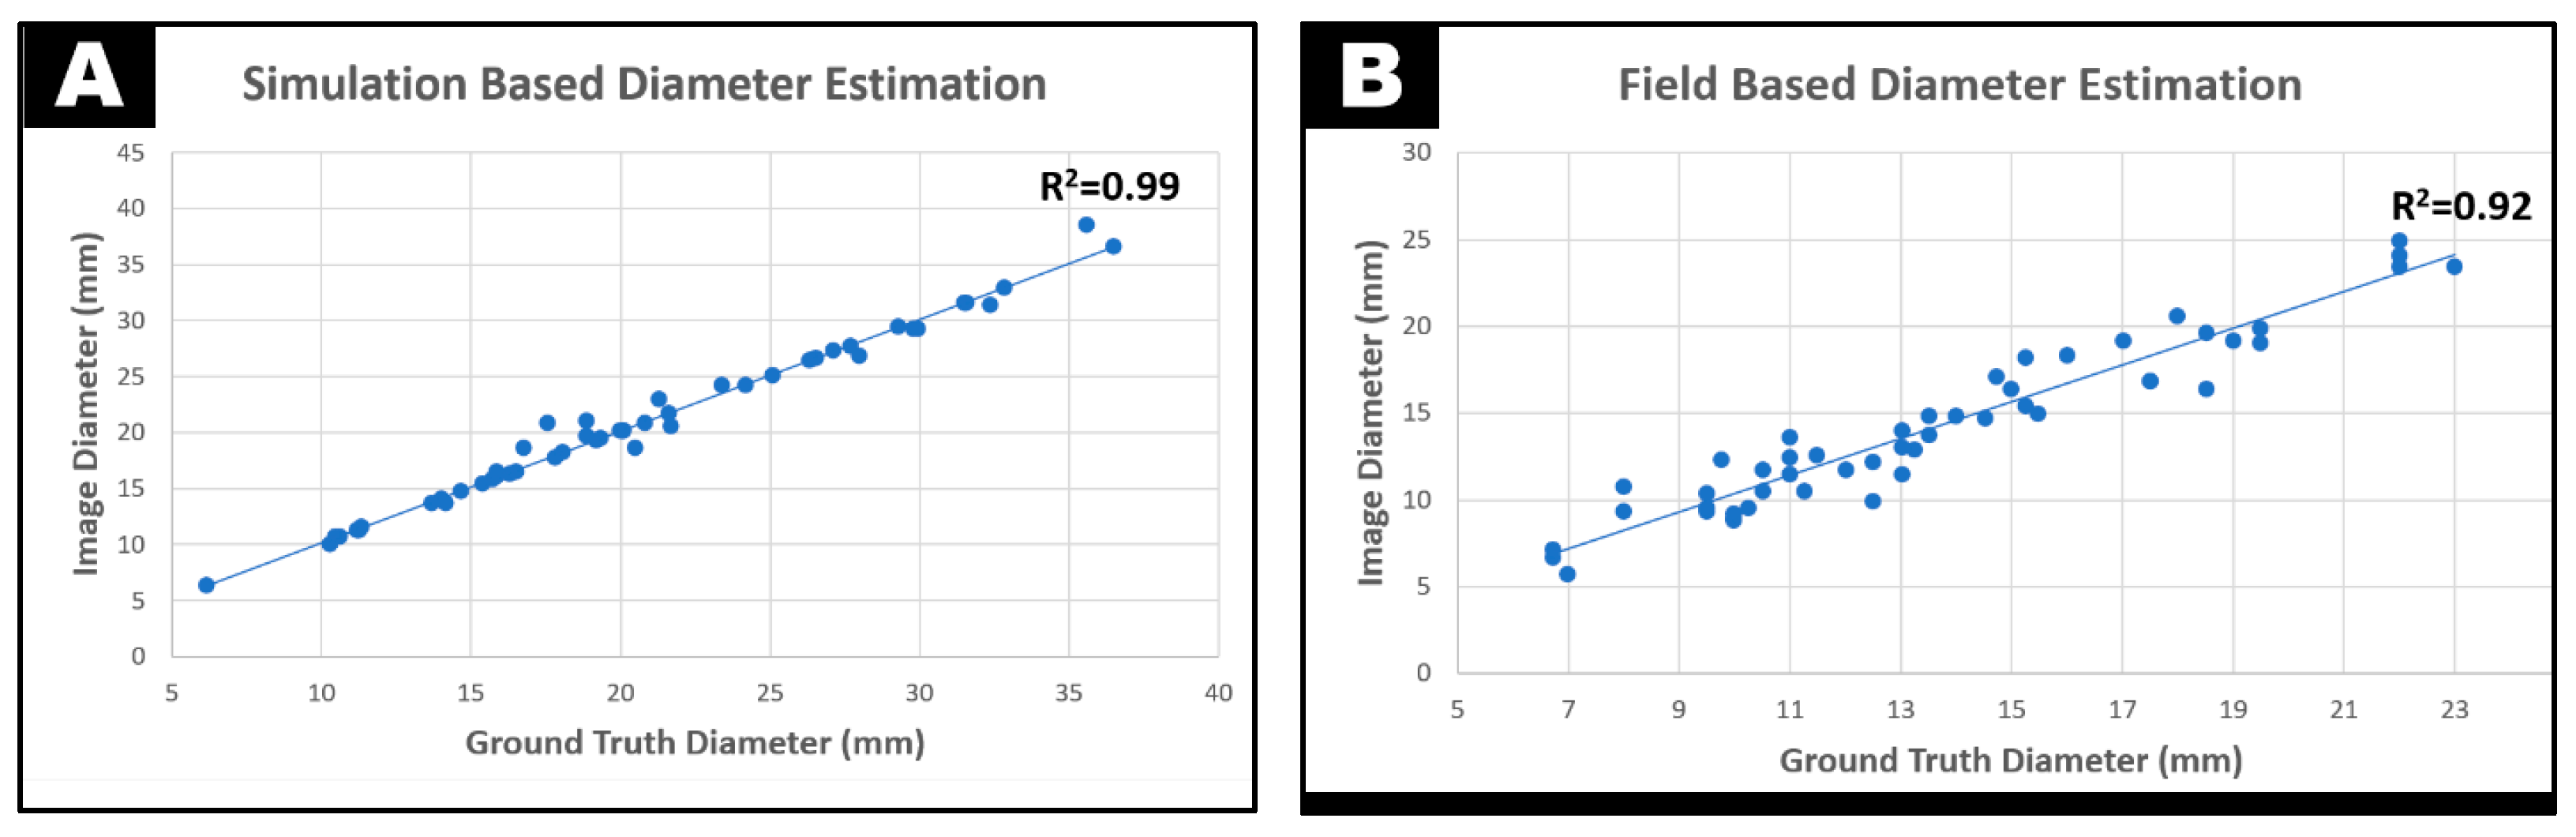
3.3. Fruit Size Estimation Using Synthetic and Field Data

Figure 12 compares results from the strawberry diameter estimation method applied initially to synthetic images for validation (Figure 12A) and subsequently to real-field images for testing (Figure 12B). The regression analysis in the simulation environment yielded an R2 of 0.99 with a Root Mean Squared Error (RMSE) of 1.7 mm, reflecting the precise and controlled nature of synthetic data, where fruits can be generated in any size or shape. By contrast, the field images produced an R2 of 0.92 and an RMSE of 1.4 mm, a slight decrease linked partly to the smaller and medium-sized fruits remaining after a recent harvest had removed large berries. This narrower range of fruit sizes, along with natural variations in lighting and plant structure, contributed to a more challenging detection scenario and thus reduced correlation compared to the simulation. However, an R2 of 0.92 shows the proposed pipeline’s practicality when transferred from a digital twin to real-world conditions. This outcome shows two key points. First, the operability (or transferability) of the system in real-world scenarios is demonstrated by the method’s ability to produce reliable diameter estimates despite the inherent variability of a commercial strawberry field. Such variability arises from non-uniform fruit shapes and lighting shifts, yet the pipeline remains sufficiently accurate for many precision agriculture tasks. Second, the approach’s reliance on a projected diameter may sometimes underrepresent certain three-dimensional details of irregularly shaped fruit, indicating that multi-angle imaging or stereo point clouds could further enhance measurement consistency. However, the digital twin framework used in the simulation is still beneficial because it can be adapted to include additional fruit geometries, thus improving robustness before extensive field trials. Overall, these findings demonstrate that a pipeline validated through simulation can still operate effectively in the more variable conditions of a real-world strawberry field.

3.4. Limitations and Future Recommendations

Several technical and practical challenges remain in fully realizing a robust digital twin for fruit detection and sizing. Occlusion by foliage and variable lighting/weather conditions in real-field data continue to pose significant obstacles for both synthetic image generation and model validation. One limitation of the present study is the lack of a direct comparison between automated fruit detections and manual field counts. Although multiple camera perspectives (side and top views) were employed to reduce leaf occlusion, strawberries hidden beneath dense foliage were not systematically evaluated. Leaf occlusion thus remains a persistent challenge, necessitating future trials that specifically assess the model’s robustness against occluded fruits. The significance of addressing occlusion in yield determination has long been recognized [39] and continues to be an active area of research and development [40]. Additionally, although this study focuses on strawberries oriented with the base (calyx) facing the camera for accurate diameter estimation, real-field conditions frequently present angled or partially occluded berries in images. Future work may employ 3D reconstruction techniques to capture each berry’s full geometry, as well as active camera positioning, allowing the system to autonomously reorient itself and mitigate occlusion or angular distortion. Integrating these approaches with advanced deep learning models, capable of amodal segmentation (estimating the object’s full boundaries or volume), can further increase the pipeline’s robustness under realistic field conditions, ultimately ensuring more reliable fruit size estimation across a broader spectrum of orientations.
Beyond occlusion, the sim-to-real gap persists when the digital twin fails to capture the complexities of actual fields, including disease symptoms, weeds, insects, or other non-target objects. Overcoming these limitations demands more realistic 3D modeling and improved rendering techniques to align synthetic environments with real-world conditions. The current simulation pipeline offers limited coverage of immature fruit scenarios, finer surface textures, and low-light conditions, all of which can significantly influence model performance. Introducing dynamic lighting and environmental clutter (e.g., debris or wilted leaves) may better align the training data with authentic field variability. Near-infrared (NIR) imaging simulation also holds promise in situations where color cues are weak, such as green fruit against green foliage or low-contrast lighting at dusk, further enhancing detection robustness.
Subsequent research will focus on narrowing the sim-to-real gap, especially in low fruit-saliency or challenging image-quality scenarios, and on identifying which features most strongly affect field-image inference under synthetic-only training. Immediate efforts center on systematically exploring aspects of virtual plant models, including leaf density, fruit texture and color, and lighting gradients, while also simulating partial occlusions and complex backgrounds. By adjusting these parameters within the 3D modeling workflow, the goal is to pinpoint factors that enhance fruit saliency and improve model inference in real-world settings. Building upon the digital twin’s flexibility, future enhancements may incorporate multi-angle imaging or stereo-point clouds to accommodate irregular fruit shapes and orientations more effectively.
One additional consideration involves real-time performance and computational efficiency, particularly for robotic harvesting or continuous field monitoring. Integrating the refined digital twin with lightweight neural network architectures or hardware-optimized models may be necessary to maintain sufficiently high frame rates for practical deployment on autonomous vehicles.
Longer-term plans include iterative feedback loops, wherein field-collected data continuously refine synthetic models, progressively narrowing the sim-to-real gap across diverse environments and growth stages. Ultimately, integrating real-time weather data and crop growth models into the digital twin would enable dynamic updates and predictive capabilities, thereby supporting more robust decision-making in precision agriculture.

4. Conclusions

In this study, a digital twin strawberry farm was created to aid with the development of machine vision crop management tasks, specifically fruit detection and fruit sizing. Synthetic images of 3D strawberry plant models were collected using simulated stereo camera sensors mounted on a ground vehicle. A Mask R-CNN model was trained on the synthetic images and tested on real images of strawberry plants using the same cameras and ground vehicle setup for a field trial. Fruit detection F1-scores of 0.92 and 0.81 on two separate trials were achieved, along with fruit size estimation RMSE of 1.4 mm. The digital twin farm was tested for spatial accuracy and visual fidelity by comparing camera and lidar sensor readings of the real and virtual farms. The results showed a positive step towards the use of digital twins in agriculture to minimize the need for expensive field data collection trials, time-consuming data labeling, and costly repetitive trips for equipment testing during the refinement of algorithms. While the neural network model and fruit sizing methods were developed purely using synthetic data, they were tested on real-field trials. In this application, image quality and fruit saliency were found to still be important factors for model inference on-field images. The proposed approach in this study illustrates the broader advantage of digital twins for agricultural algorithm development; seasonal factors, cultivar variations, and management practices often constrain field data collection, thereby limiting the diversity of fruit sizes or appearances encountered. In contrast, simulation enables practically unlimited control over parameters such as fruit dimensions, growth stages, or camera viewpoints, facilitating the creation of extensive, varied datasets for training and validation. Algorithms refined under these conditions are consequently more likely to generalize effectively and adapt quickly to different cultivars or field configurations once deployed in commercial operations.

Author Contributions

Conceptualization, D.C. and O.M.; methodology, D.C. and O.M.; software, D.C. and O.M.; validation, O.M.; formal analysis, O.M.; investigation, D.C. and O.M.; resources, D.C.; data curation, O.M.; writing—original draft preparation, D.C. and O.M.; writing—review and editing, D.C., J.K.S. and O.M.; visualization, O.M.; supervision, D.C.; project administration, D.C.; funding acquisition, D.C. All authors have read and agreed to the published version of the manuscript.

Funding

This study was supported by the Florida Strawberry Research and Education Foundation Award #AGR00030583, USDA National Institute of Food and Agriculture Multistate Research under Project #FLA-GCR-006262 and Accession #7003555, and the University of Florida Gulf Coast Research and Education Center (GCREC).

Data Availability Statement

The data that support the findings of this study are available from the corresponding author, D. Choi, upon reasonable request.

Acknowledgments

The authors would also like to thank Zoe Ryan and Kaleb Smith from NVIDIA AI Technology Center (NVAITC) at the University of Florida for their help with this project, as well as Vance Whitaker and the operations team at Gulf Coast Research and Education Center (GCREC) for their support during the field trials. During the preparation of this manuscript, the authors utilized OpenAI ChatGPT (version GPT-o1) to assist with editing a portion of the text. The authors have reviewed and edited the output and take full responsibility for the content of this publication.

Conflicts of Interest

The authors declare no conflicts of interest.

Abbreviations

The following abbreviations are used in this manuscript:
CNNConvolutional Neural Network
R-CNNRegion-based CNN
Sim2realSimulation-to-Reality
GCRECGulf Coast Research and Education Center
URDFUnified Robot Description Format
GPSGlobal Positioning Unit
RGBRed–Green–Blue
LEDLight-Emitting Diode
RMSERoot Mean Squared Error
ROSRobot Operating System

References

  1. Astill, G.; Perez, A.; Thornsbury, S. Developing Automation and Mechanization for Specialty Crops: A Review of Us Department of Agriculture Programs—A Report to Congress; Administrative Publication Number 082; USDA Economic Research Service: Washington, DC, USA, 2020. Available online: https://www.ers.usda.gov/publications/pub-details?pubid=95827 (accessed on 11 March 2025).
  2. AgFunder. Farm Tech Investing Report; AgFunder: San Francisco, CA, USA, 2020. [Google Scholar]
  3. Kim, S.; Heo, S. An agricultural digital twin for mandarins demonstrates the potential for individualized agriculture. Nat. Commun. 2024, 15, 1561. [Google Scholar] [CrossRef] [PubMed]
  4. Purcell, W.; Neubauer, T. Digital twins in agriculture: A state-of-the-art review. Smart Agric. Technol. 2023, 3, 100094. [Google Scholar] [CrossRef]
  5. Nasirahmadi, A.; Hensel, O. Toward the next generation of digitalization in agriculture based on digital twin paradigm. Sensors 2022, 22, 498. [Google Scholar] [CrossRef] [PubMed]
  6. VanDerHorn, E.; Mahadevan, S. Digital twin: Generalization, characterization and implementation. Decis. Support Syst. 2021, 145, 113524. [Google Scholar] [CrossRef]
  7. Alves, R.G.; Maia, R.F.; Lima, F. Development of a digital twin for smart farming: Irrigation management system for water saving. J. Clean. Prod. 2023, 388, 135920. [Google Scholar] [CrossRef]
  8. Kampker, A.; Stich, V.; Jussen, P.; Moser, B.; Kuntz, J. Business models for industrial smart services—The example of a digital twin for a product-service-system for potato harvesting. Procedia CIRP 2019, 83, 534–540. [Google Scholar] [CrossRef]
  9. Shoji, K.; Schudel, S.; Onwude, D.; Shrivastava, C.; Defraeye, T. Mapping the postharvest life of imported fruits from packhouse to retail stores using physics-based digital twins. Resour. Conserv. Recycl. 2022, 176, 105914. [Google Scholar] [CrossRef]
  10. Singh, R.; Seneviratne, L.; Hussain, I. A deep learning-based approach to strawberry grasping using a telescopic-link differential drive mobile robot in ros-gazebo for greenhouse digital twin environments. IEEE Access 2025, 13, 361–381. [Google Scholar] [CrossRef]
  11. Guan, Z.; Abd-Elrahman, A.; Whitaker, V.; Agehara, S.; Wilkinson, B.; Gastellu-Etchegorry, J.-P.; Dewitt, B. Radiative transfer image simulation using l-system modeled strawberry canopies. Remote Sens. 2022, 14, 548. [Google Scholar] [CrossRef]
  12. Kim, D.; Kang, W.H.; Hwang, I.; Kim, J.; Kim, J.H.; Park, K.S.; Son, J.E. Use of structurally-accurate 3d plant models for estimating light interception and photosynthesis of sweet pepper (capsicum annuum) plants. Comput. Electron. Agric. 2020, 177, 105689. [Google Scholar] [CrossRef]
  13. Luo, D.; Luo, R.; Cheng, J.; Liu, X. Quality detection and grading of peach fruit based on image processing method and neural networks in agricultural industry. Front. Plant Sci. 2024, 15, 1415095. [Google Scholar] [CrossRef]
  14. Xie, Z.; Yang, Z.; Li, C.; Zhang, Z.; Jiang, J.; Guo, H. Yolo-ginseng: A detection method for ginseng fruit in natural agricultural environment. Front. Plant Sci. 2024, 15, 1422460. [Google Scholar] [CrossRef] [PubMed]
  15. Huang, X.; Li, X.; Yuan, L.; Jiang, Z.; Jin, H.; Wu, W.; Cai, R.; Zheng, M.; Bai, H. Sdes-yolo: A high-precision and lightweight model for fall detection in complex environments. Sci. Rep. 2025, 15, 2026. [Google Scholar] [CrossRef] [PubMed]
  16. Tao, W.; Wang, X.; Yan, T.; Liu, Z.; Wan, S. Esf-yolo: An accurate and universal object detector based on neural networks. Front. Neurosci. 2024, 18, 1371418. [Google Scholar] [CrossRef]
  17. Sun, H.; Wang, B.; Xue, J. Yolo-p: An efficient method for pear fast detection in complex orchard picking environment. Front. Plant Sci. 2022, 13, 1089454. [Google Scholar] [CrossRef] [PubMed]
  18. Ang, G.; Zhiwei, T.; Wei, M.; Yuepeng, S.; Longlong, R.; Yuliang, F.; Jianping, Q.; Lijia, X. Fruits hidden by green: An improved yolov8n for detection of young citrus in lush citrus trees. Front. Plant Sci. 2024, 15, 1375118. [Google Scholar] [CrossRef]
  19. Fang, S.; Zhang, B.; Hu, J. Improved mask r-cnn multi-target detection and segmentation for autonomous driving in complex scenes. Sensors 2023, 23, 3853. [Google Scholar] [CrossRef]
  20. Sapkota, R.; Ahmed, D.; Karkee, M. Comparing yolov8 and mask r-cnn for instance segmentation in complex orchard environments. Artif. Intell. Agric. 2024, 13, 84–99. [Google Scholar] [CrossRef]
  21. Wang, D.; He, D. Apple detection and instance segmentation in natural environments using an improved mask scoring r-cnn model. Front. Plant Sci. 2022, 13, 1016470. [Google Scholar] [CrossRef]
  22. Chen, Y.; Li, X.; Jia, M.; Li, J.; Hu, T.; Luo, J. Instance segmentation and number counting of grape berry images based on deep learning. Appl. Sci. 2023, 13, 6751. [Google Scholar] [CrossRef]
  23. Huang, X.; Peng, D.; Qi, H.; Zhou, L.; Zhang, C. Detection and instance segmentation of grape clusters in orchard environments using an improved mask r-cnn model. Agriculture 2024, 14, 918. [Google Scholar] [CrossRef]
  24. Neupane, C.; Koirala, A.; Wang, Z.; Walsh, K.B. Evaluation of depth cameras for use in fruit localization and sizing: Finding a successor to kinect v2. Agronomy 2021, 11, 1780. [Google Scholar] [CrossRef]
  25. Neupane, C.; Walsh, K.B.; Goulart, R.; Koirala, A. Developing machine vision in tree-fruit applications-fruit count, fruit size and branch avoidance in automated harvesting. Sensors 2024, 24, 5593. [Google Scholar] [CrossRef]
  26. Mirbod, O.; Choi, D. Synthetic data-driven AI using mixture of rendered and real imaging data for strawberry yield estimation. In Proceedings of the 2023 ASABE Annual International Meeting, Omaha, NE, USA, 9–12 July 2023; American Society of Agricultural and Biological Engineers: St. Joseph, MI, USA, 2023; pp. 1–5. [Google Scholar]
  27. Rajeswari, D.; Venkatachalam Parthiban, A.; Ponnusamy, S. Digital twin-based crop yield prediction in agriculture. In Harnessing AI and Digital Twin Technologies in Businesses; Ponnusamy, S., Assaf, M., Antari, J., Singh, S., Kalyanaraman, S., Eds.; IGI Global: Hershey, PA, USA, 2024; pp. 99–110. [Google Scholar]
  28. Goondram, S.; Cosgun, A.; Kulic, D. Strawberry detection using mixed training on simulated and real data. arXiv 2020, arXiv:2008.10236. [Google Scholar]
  29. Zhu, J.Y.; Park, T.; Isola, P.; Efros, A.A. Unpaired image-to-image translation using cycle-consistent adversarial networks. In Proceedings of the IEEE International Conference on Computer Vision, Venice, Italy, 22–29 October 2017; pp. 2223–2232. [Google Scholar]
  30. Lu, Y.; Chen, D.; Olaniyi, E.; Huang, Y. Generative adversarial networks (gans) for image augmentation in agriculture: A systematic review. Comput. Electron. Agric. 2022, 200, 107208. [Google Scholar] [CrossRef]
  31. Fei, Z.; Olenskyj, A.G.; Bailey, B.N.; Earles, M. Enlisting 3d crop models and gans for more data efficient and generalizable fruit detection. In Proceedings of the IEEE/CVF International Conference on Computer Vision, Montreal, BC, Canada, 11–17 October 2021; pp. 1269–1277. [Google Scholar]
  32. Zhang, W.; Chen, K.; Wang, J.; Shi, Y.; Guo, W. Easy domain adaptation method for filling the species gap in deep learning-based fruit detection. Hortic. Res. 2021, 8, 119. [Google Scholar] [CrossRef]
  33. Li, Y.; Zhan, X.; Liu, S.; Lu, H.; Jiang, R.; Guo, W.; Chapman, S.; Ge, Y.; Solan, B.; Ding, Y.; et al. Self-supervised plant phenotyping by combining domain adaptation with 3d plant model simulations: Application to wheat leaf counting at seedling stage. Plant Phenomics 2023, 5, 0041. [Google Scholar] [CrossRef]
  34. Hartley, Z.K.; French, A.P. Domain adaptation of synthetic images for wheat head detection. Plants 2021, 10, 2633. [Google Scholar] [CrossRef]
  35. Brawner, S. Solidworks to Urdf Exporter. Available online: http://wiki.ros.org/sw_urdf_exporter (accessed on 11 March 2025).
  36. Mirbod, O.; Choi, D.; Heinemann, P.H.; Marini, R.P.; He, L. On-tree apple fruit size estimation using stereo vision with deep learning-based occlusion handling. Biosyst. Eng. 2023, 226, 27–42. [Google Scholar] [CrossRef]
  37. Rahnemoonfar, M.; Sheppard, C. Deep count: Fruit counting based on deep simulated learning. Sensors 2017, 17, 905. [Google Scholar] [CrossRef]
  38. Karabatis, Y.; Lin, X.; Sanket, N.J.; Lagoudakis, M.G.; Aloimonos, Y. Detecting olives with synthetic or real data? Olive the above. In Proceedings of the 2023 IEEE/RSJ International Conference on Intelligent Robots and Systems (IROS), Detroit, MI, USA, 1–5 October 2023; pp. 4242–4249. [Google Scholar]
  39. MacArthur, D.; Schueller, J.; Lee, W.S.; Crane, C. Remotely-piloted helicopter citrus yield map estimation. In Proceedings of the 2006 ASAE Annual Meeting, Boston, MA, USA, 6–8 January 2006; American Society of Agricultural and Biological Engineers: St. Joseph, MI, USA, 2006. [Google Scholar]
  40. Koirala, A.; Walsh, K.B.; Wang, Z. Attempting to estimate the unseen—Correction for occluded fruit in tree fruit load estimation by machine vision with deep learning. Agronomy 2021, 11, 347. [Google Scholar] [CrossRef]
Figure 1. The pipeline for using a strawberry farm digital replica to train a neural network model for fruit detection and fruit sizing. Model training and algorithms were first developed using synthetic data acquired from the virtual farm (blue background) and then applied to real-world data (green background).
Agriengineering 07 00081 g001
Figure 2. A ground platform developed to navigate over strawberry beds and collect images of strawberry plants from the sides and top viewpoints of the beds.
Agriengineering 07 00081 g002
Figure 3. Ground-truth data collected in the field, with (A) showing a sample image of tagged fruit in the field and (B) showing the two ground-truth diameter measurements made for each tagged fruit using calipers. The red axis indicates “Diameter 1,” and the blue axis represents “Diameter 2” to distinguish the two measurement axes.
Agriengineering 07 00081 g003
Figure 4. 3D strawberry plant model developed under procedural modeling with (A) showing a plant at three consecutive stages of growth, (B) showing the plants placed on a bed in simulation, and (C) the procedural modeling interface used to customize a wide range of strawberry plant variations.
Agriengineering 07 00081 g004
Figure 5. The strawberry plant model imaged by a simulated camera is shown in (A), with semantic segmentation of different plant components shown in (B) and instance segmentation shown in (C). Data labeling is achieved by assigning a class label to the different components of the 3D plant model. When 2D images of the model are then captured by a simulated camera, labels are automatically generated by Omniverse Replicator. Different colors (blue, red, green, etc.) indicate separate class labels corresponding to distinct plant parts (e.g., leaves, stems, fruit), as defined by the segmentation scheme.
Agriengineering 07 00081 g005
Figure 6. Sample data from simulated camera sensor recording images from the side viewpoint of the strawberry bed. The top row is the RGB image, and the bottom row shows the color-coded mask labels automatically generated by Omniverse Replicator to distinguish individual strawberry surface for instance segmentation.
Agriengineering 07 00081 g006
Figure 7. Loss function on training and validation of Mask R-CNN model for synthetic data.
Agriengineering 07 00081 g007
Figure 8. The pipeline for developing a strawberry fruit size estimation method. First, development was performed in simulation using the Mask R-CNN model for segmenting fruit and computer vision for estimating the metric size of fruit from images. The model and sizing method were then tested on ground-truth data provided by the digital twin. Once the results were satisfactory, the model and sizing method were applied to field images.
Agriengineering 07 00081 g008
Figure 9. Comparison of lidar data obtained from (A) a simulated sensor capturing data from the digital twin farm and (B) a real sensor capturing data from the field. Labels (W), (X), and (Y) correspond to measured bed width, spacing, and height, which are compared in Table 3. Labels (Z) display lidar returns from the front wheels of the ground vehicle, resulting from the sensor being positioned too close to the wheels.
Agriengineering 07 00081 g009
Figure 10. Comparison between images taken from a simulated camera sensor of the digital twin strawberry farm bed (top row) and images from a real camera taken of the field strawberry bed (bottom row).
Agriengineering 07 00081 g010
Figure 11. Fruit detection with masks on simulated and real images (the mask boundaries were traced over in cyan color for easier visibility; red boundaries indicate missed or misrecognized fruit). In (A), simulated and real cameras capture images from the side view of the bed, and in (B), the top view of the bed. Missed regions are often associated with small green fruit.
Agriengineering 07 00081 g011
Figure 12. Comparison on estimating fruit size using (A) simulated cameras on 3D model plants and (B) actual cameras in the strawberry field. Only fruits with their calyx (cap) facing the camera were analyzed in images and compared against ground-truth data.
Agriengineering 07 00081 g012
Table 1. Imaging and Ground-Truth Data Collection.
Field Experiment Dates 2023Data Type CollectedNumber of
Plants Imaged
Number of
Images Processed
16 MarchImages5075
20 MarchImages +
Ground-Truth Fruit Size
5060
Table 2. Summary of images used for Mask R-CNN model training and strawberry fruit sizing method development (unit: number of images).
Fruit Detection Neural Network ModelFruit Sizing Method
Training Synthetic ImagesValidation Synthetic ImagesTesting
Real Images
Validation
Synthetic Images
Testing
Real Images
315501355050
Table 3. Measurements of bed width, bed spacing, and bed height obtained from LiDAR data in the digital twin farm and in the real field, corresponding to the labeled points in Figure 9.
LabelDescriptionSimulated Lidar Sensor (m)Real Lidar
Sensor (m)
Ground-Truth Measurement (m)
(W)Bed Spacing0.500.530.51
(X)Bed Width0.720.710.74
(Y)Bed Height0.260.290.25
(Z)Front Wheel ReturnsSensor proximity effectSensor proximity effectN/A
N/A—No ground-truth measurement was taken for comparison for front wheel returns.
Table 4. Strawberry fruit detection results on field images using Mask R-CNN model trained only on synthetic data. The results show the overall fruit detection performance of the two trials as well as the performance on different fruit growth stages.
Simulation TrialField Trial 1
(16 March)
Field Trial 2
(20 March)
CPRF1CPRF1CPRF1
All Fruit3290.920.900.912950.950.890.921340.890.750.81
Red Fruit1390.971.00.991670.950.990.97390.870.950.91
White Fruit870.930.920.92611.000.870.93520.980.810.89
Green Fruit1030.890.790.83670.940.720.82430.830.580.68
Notation: C—number of images, P—Precision, R—Recall, F1—F1-score.
Disclaimer/Publisher’s Note: The statements, opinions and data contained in all publications are solely those of the individual author(s) and contributor(s) and not of MDPI and/or the editor(s). MDPI and/or the editor(s) disclaim responsibility for any injury to people or property resulting from any ideas, methods, instructions or products referred to in the content.

