Abstract
This paper presents whole-body vibration prediction in an agricultural tractor based on selected operational parameters using machine learning. Experiments were performed using a Landini Powerfarm 100 model tractor on farmlands and service roads located at the Osijek School of Agriculture and Veterinary Medicine. The methodology adhered to the HRN ISO 5008 protocols for establishing test surfaces, including a smooth 100 m track and a rugged 35 m track. Whole-body vibrational exposure assessments were carried out in alignment with the HRN ISO 2631-1 and HRN ISO 2631-4 guidelines, which outline procedures for evaluating mechanical oscillations in occupational settings. The obtained whole-body vibration data were divided into three datasets (one for each axis) and processed using linear regression as a baseline and compared against three machine learning models (gradient boosting regressor; support vector machine regressor; multi-layer perception). The most accurate machine learning model according to the R2 metric was the gradient boosting regressor for the x-axis (R2: 0.98) and the y-axis (R2: 0.98), and for the z-axis (R2: 0.95), the most accurate machine learning model was the SVM regressor. The application of machine learning methods indicates that machine learning models can be used to predict whole-body vibrations more accurately than linear regression.
1. Introduction
1.1. Whole-Body Vibrations (WBVs) in Agricultural Tractors: Health Risks and Regulatory Context
Whole-body vibrations, as one of the key factors in ergonomics, pose a significant problem due to their negative impact on operators, particularly professional drivers. Whole-body vibrations (WBVs) represent a pervasive occupational hazard in agriculture, with tractor operators facing prolonged exposure to mechanical shocks during plowing, harvesting, and other field operations. Epidemiological studies have established a strong correlation between chronic WBV exposure and degenerative musculoskeletal disorders (MSDs), particularly lower back pain, spinal injuries, and intervertebral disc degeneration [1,2,3]. These injuries may also occur due to the combination of high vibration levels and improper working postures. Additionally, whole-body vibrations can cause disturbances in the digestive system. Particular emphasis is placed on their impact on women, where they may lead to urogenital disorders, and on men, where they increase the risk of developing prostate cancer [4,5]. For instance, a 10-year longitudinal study on tractor operators found a 2.5-fold increased risk of lumbar spine degeneration compared to non-exposed workers, with vibration magnitudes exceeding 0.7 ms−2 exacerbating symptom severity [6]. Beyond musculoskeletal harm, WBV has been linked to vascular impairments, including reduced peripheral blood flow and a heightened risk of varicose veins, as well as gastrointestinal disturbances such as gastritis. These health impacts are compounded by the cyclical nature of agricultural work, where operators often endure 8–12 h shifts on uneven terrain, amplifying cumulative vibration doses [7].
Regulatory frameworks like the EU Directive 2002/44/EC aim to mitigate these risks by setting daily exposure limits (1.15 ms−2) and action values (0.5 ms−2) [8]. However, compliance remains inconsistent due to the dynamic nature of operational parameters. For example, rotavator operations at speeds above 8 kmh−1 on clay loamy soils generated z-axis vibrations of 1.2 ms−2, surpassing the Directive’s limit [9]. Similarly, measurements of whole-body vibration levels were conducted in grapple skidder operators during eucalyptus bundle skidding operations [10]. The study found that although the vibration levels exceeded expected values, they remained within permissible limits but within the danger zone (WBV levels within 0.9–1.1 ms−2, nearing regulatory thresholds even with modern suspension systems). Furthermore, the obtained values indicate that workplace exposure could pose health risks to skidder operators with prolonged exposure. The results highlight the need for measures to reduce vibration transmission to operators. Such findings underscore the urgency of predictive WBV modeling tailored to real-world agricultural scenarios.
1.2. Limitations of Existing Research on WBV and Operational Parameters
While prior studies have identified individual factors influencing WBVs—such as terrain roughness [10], implement type [9], and operator posture [11]—their interactions remain poorly understood. A critical gap lies in the reductionist approach of isolating variables, which fails to account for synergistic effects. For instance, tire pressure and speed were analyted independently in tractor noise/vibration studies, overlooking how underinflated tires amplify lateral vibrations (y-axis) at higher speeds [12]. Similarly, Griffin’s seminal work on human vibration [2] emphasized seat transmissibility but neglected the role of implement loads in modifying vibration spectra. In next study [13], whole-body vibrations were measured on two professional operators, both with over 20 years of work experience but differing in age, height, and weight. The measurements were conducted twice on the same route, which was divided into four sections (four different agrotechnical surfaces), with varying travel speeds and a constant vibration exposure duration of four hours. The findings indicate a significant influence of agrotechnical surface type and speed on whole-body vibration levels. Furthermore, the vibration results in this study suggest that as a younger operator, he would likely exceed the permissible vibration exposure limit of 1.15 ms−2 set by Directive 2002/44/EC [8], whereas the older operator would not reach the threshold values.
Traditional statistical methods, such as multiple linear regression (MLR), further limit insights due to their reliance on linearity assumptions. An attempt to model WBVs using MLR achieved only moderate explanatory power (R2 = 0.55) for speed–terrain interactions, attributing this to unmodeled nonlinearities [11]. This also aligns with findings showing that linear models underestimate WBV peaks by 30–40% compared to deep learning approaches in automotive comfort studies [14]. Such methodological constraints hinder the development of robust safety protocols, particularly in heterogeneous agricultural environments, where parameters like soil moisture and tire pressure vary dynamically.
1.3. The Untapped Potential of Operational Parameters in WBV Analysis
Operational parameters—speed, tire pressure, implement load, and terrain type—are interdependent drivers of WBVs, yet their collective influence remains underexplored. For example, increasing the tractor speed from 2.35 kmh−1 to 6.50 kmh−1 during operation tillage on silty clay loam soil elevates vertical vibrations (z-axis) by 22% [15], but this effect doubles when combined with a 50% implement load due to resonance frequencies in the vehicle chassis [16]. An investigation into the effects of whole-body vibrations on tractor operators was conducted during rotavator operations. It was determined that speed and traction force significantly impact vibration levels. The obtained results exceed the daily exposure action value of 0.5 ms−2 set by Directive 2002/44/EC [8], and prolonged exposure may lead to the development of occupational diseases. Also, a tractor’s speed and pulling force have a significant impact on the daily equivalent static compressive dose, with a 64.43% and 27.73% percentage contribution [17]. Similarly, tire pressure adjustments (e.g., 1.0 bar and 1.6 bar) alter vibration damping characteristics, with underinflation exacerbating lateral oscillations (y-axis) [18].
Current research lacks the tools to dissect these interactions. A meta-analysis of 32 WBV studies revealed that 78% focused on single parameters, while only 6% employed multivariate analysis [19]. This gap is particularly problematic given the nonlinear relationship between WBVs and operational inputs. For instance, vibration amplitude was shown to increase exponentially with speed on uneven terrain, a pattern irreconcilable with linear models [20]. Such complexities demand advanced analytical frameworks capable of capturing high-dimensional, nonlinear relationships.
1.4. Advancing WBV Prediction Through Machine Learning
Machine learning (ML) offers a transformative approach to WBV analysis by integrating heterogeneous operational parameters into predictive models. Unlike conventional methods, ML algorithms like gradient boosting machines (GBM) and convolutional neural networks (CNNs) autonomously identify nonlinear patterns and interaction effects in high-dimensional datasets [21,22,23].
The risk of worker falls in agriculture, closely linked to ergonomics, was emphasized, with machine learning applied to analyze this issue [24]. The motivation behind the study was the increasing incidence of worker falls, particularly among aging workers who are at higher risk, especially when climbing and descending ladders or tractors. The application of machine learning demonstrated that the k-nearest neighbors (kNN) and support vector machine (SVM) algorithms achieved ROC-AUC scores of 0.999 in distinguishing falls from activities of daily living (ADLs) in binary classification tasks. Furthermore, the artificial neural network (ANN) classifier achieved the highest classification performance, with an ROC-AUC score of 1.0. Evaluation metrics indicated the highest performance in analyzing and assessing signals obtained from the S2 acceleration sensor, with a measurement range of ±16 g. The SVM classifier demonstrated an ROC-AUC score of 0.988 in sensor tests for multi-class classification, along with the highest performance in terms of the F1-score and Matthews correlation coefficient (MCC), exceeding 84% in a multi-class classification model distinguishing each ADL and fall using the ±16 g acceleration sensor.
Workers in various industries are exposed to whole-body vibrations, which, as previously mentioned, can lead to health disorders. To prevent such issues, a study was conducted where machine learning was applied in three classification tasks by tracking workers via mobile phone sensors (accelerometer, linear accelerometer, and gyroscope signals) to enable timely preventive actions. The framework’s cross-validation results demonstrated an accuracy of 90.2% [25].
The study assessed ride comfort across four vehicles at different speeds and road conditions using deep learning. Furthermore, by applying deep learning with two neural networks, a novel method for evaluating vibration-induced comfort was developed. This method proved superior to traditional approaches, reducing the prediction loss by 76.9% [14].
Machine learning applications in ergonomics were explored, with noise levels measured on different agricultural surfaces at varying speeds and tire pressures (independent variables) [12]. Findings highlight that these independent variables influence ergonomic parameters. The data were analyzed using multiple linear regression (MLR) and three machine learning methods: a gradient boosting machine (GBM), a support vector machine with a radial basis function kernel (SVMRadial), and a monotonic multi-layer perceptron neural network (monMLP). The most accurate method, based on performance metrics, was predominantly the monMLP, with SVMRadial performing slightly worse. The results for the left-side dataset were as follows: R2 = 0.515–0.955; RMSE = 0.302–0.704; and MAE = 0.225–0.488. For the right-side dataset, the results were R2 = 0.555–0.955; RMSE = 0.180–0.969; and MAE = 0.139–0.644.
Aguilar et al. [26] aimed to predict whole-body vibrations experienced by machine operators using six artificial neural networks, with the primary goal of ensuring operator safety and minimizing both short-term and long-term health risks. The results from the developed neural network models demonstrated high accuracy, with R2 values exceeding 0.90.
In agriculture, ML has been successfully applied to crop yield prediction [27] and pest detection [28], but its potential for WBV mitigation remains untapped. This study bridges this gap by leveraging three ML regressors—GBM, SVM, and MLP—to predict WBV levels across x-, y-, and z-axes using real-world data on speed, terrain, and tire pressure. GBM is chosen for its ability to handle nonlinearities through additive tree ensembles [22], while SVM’s kernel-based approach excels in high-dimensional spaces [29]. MLP, a deep learning architecture, captures hierarchical feature interactions, making it ideal for complex vibration spectra [21].
This study represents a comprehensive integration of operational parameters and machine learning (ML) with the aim of predicting whole-body vibration (WBV) of tractor operators inside the cabin of an agricultural tractor for each axis (x-axis, y-axis, and z-axis). The study advances ergonomic research in four key ways: (1) multidimensional analysis: by simultaneously modeling speed, terrain, and tire pressure, the research captures interaction effects neglected in previous studies; (2) algorithmic innovation: the study compares gradient boosting machines (GBMs), support vector machines (SVMs), and multi-layer perceptron (MLP) versus linear regression, demonstrating ML’s superiority in predicting nonlinear WBV dynamics (e.g., R2 improvement ≥ 0.25); (3) practical insights: feature importance analysis identifies tire pressure as the dominant factor for y-axis vibration, informing tire design optimization for specific terrains; and (4) regulatory impact: predictive models enable proactive WBV management, aligning with ISO 2631-1:1997 [30] vibration monitoring standards. Input properties are agrotechnical surfaces, the speed of movement, and air pressure in tires. The target variable is vibration on the x-axis, y-axis, or z-axis. The baseline was linear regression, and the machine learning models evaluated against the baseline were the GBM regressor, SVM regressor, and MLP regressor. Feature importance analysis was also performed for each model and each axis, with the aim of discovering the features that the models considered most relevant.
2. Materials and Methods
The machine learning-driven methodology for forecasting whole-body vibrational exposure was structured into four sequential operational phases: (1) exploratory analysis of whole-body vibration datasets for the x-axis, y-axis, and z-axis for each of the six different agrotechnical surfaces; (2) dataset preprocessing and splitting the dataset into the training and validation subset and test subset; (3) finding the best hyperparameters, training, and then evaluating the machine learning models, and (4) determining the relative significance of three input parameters within the predictive model through a feature relevance assessment.
2.1. Exploitation Research
Whole-body vibrational exposure assessments of an agricultural tractor operator were carried out on farmlands and service roads located at the Osijek School of Agriculture and Veterinary Medicine. Experiments were performed using a Landini Powerfarm 100 model tractor with a power output of 68 kW, without any attachments, while moving over different agricultural surfaces (asphalt, gravel, grass, and dirt road) and test tracks (smooth and rough) according to standard HRN ISO 5008. The standard [31] specifies that test tracks should be constructed as follows: smooth, 100 m in length, and rough, 35 m in length. It also provides recommendations for the maximum allowable speeds, based on which the vibration measurement speeds were determined: 1, 2, 3, 4, 5, and 6 kmh−1.
Additionally, the tire pressure was varied during measurements, starting with the manufacturer’s recommended pressure of 2.4 bar, as well as a lower pressure (1.9 bar) and a higher pressure (2.9 bar). The variation in tire pressure was set at ±20% of the recommended value, considering that tractor tires are often underinflated or overinflated due to operator negligence. The selection of these agricultural surfaces aimed to cover the most common terrains over which agricultural tractor operators move while performing agrotechnical operations in crop production.
The investigated tractor (Table 1) had suspension of the front part, i.e., the front bridge and suspension of the cabin and seat suspension of pneumatic design. The steering system is power steering. Power steering is a system that gives the advantages of turning the wheels at slower speeds, especially when stationary. The advantages of this system are effortless steering, improved maneuverability, increased performance, accurate steering control for agriculture, and increased tire durability and performance. Hydraulic power steering consists of three parts: a hydraulic pump (this pump directs fluid to assist steering), a hydraulic cylinder (it works by applying force to the tractor frame to turn the wheels), and a steering control valve (it is a valve that controls the flow of fluid into the cylinder) [32].

Table 1.
Technical specifications of the tractor [33].
The vibration measurements were carried out using an MMF VM30 (Table 2) device with an accompanying sensor for measuring whole-body vibrations at the operator’s seat in the agricultural tractor. The triaxial vibration sensor (Figure 1) was mounted on the tractor operator’s seating surface, adhering to the HRN ISO 2631-4 protocol [34]. The device’s coordinate system was aligned as specified: the x-axis measured longitudinal vibrations (parallel to the vehicle’s travel direction, with forward as positive and reverse as negative); the y-axis captured lateral oscillations (side to side relative to motion); and the z-axis recorded vertical forces (positive upward and negative downward), oriented perpendicularly to the ground plane.
Table 2.
The technical characteristics of the MMF VM30 whole-body vibration measurement device [35].
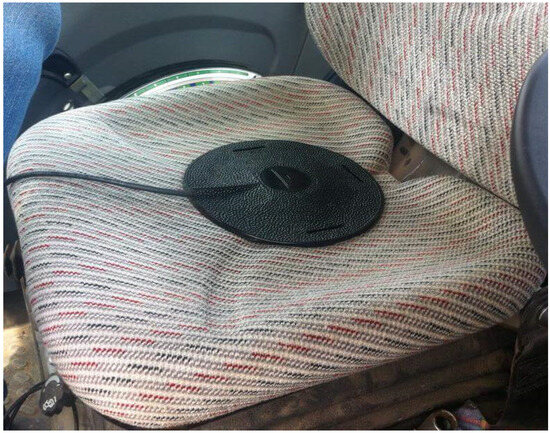
Figure 1.
Sensor for measuring whole-body vibrations of an agricultural tractor operators.
For accurate measurement, it was crucial to apply the appropriate weighting filter as specified in HRN ISO 2631-1 [30]: Wd for evaluating motion along the horizontal axes (x and y) and Wk for the vertical axis (z). This standard explains how vibrations are measured in three operator-related planes using a coordinate system aligned with the x-, y-, and z-axes (Figure 2). All measurements were repeated in six iterations.
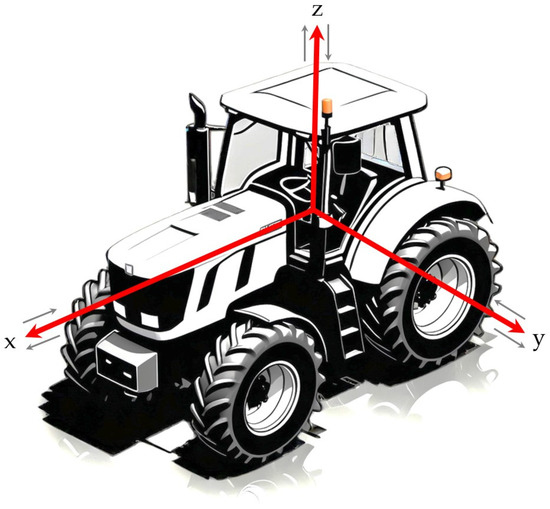
Figure 2.
Representation of coordinate axes of the tractor.
According to HRN ISO 2631-1 [30] the root mean square (RMS) measurement methodology accounts for transient and intermittent vibrational impulses by applying a brief integration time constant. Within this framework, the vibration intensity is quantified using the maximum transient vibration value (MTVV), representing the peak instantaneous magnitude of the frequency-weighted acceleration signal aw(t0):
where aw(t) represents the current frequency of measured acceleration in ms−2, τ represents the integration time for continuous averaging, t is the time in seconds, and t0 is the observation time in seconds.
where, MTVV represents maximum transient vibration value in ms−2.
MTVV = max [aw(t0)]
2.2. Machine Learning Prediction of Whole-Body Vibrations
The machine learning prediction task was predicting the whole-body vibrations of the tractor operator on one of the axes (either x-axis, y-axis, or z-axis) given the agrotechnical surface, speed of movement, and air pressure in the tires. In other words, the inputs were the agrotechnical surface, speed of movement, and air pressure in the tires, and the outputs were the whole-body vibrations of the tractor operator on one of the axes (either x-axis, y-axis, or z-axis). This prediction was performed independently for each of the aforementioned axes.
Machine learning prediction was implemented in Python (version 3.13.0). Jupyter Lab (version 4.2.5) was used as the development environment, and Jupyter Notebooks were created for each of the steps below. The library used for data manipulation was pandas (2.2.3), and the scikit-learn library (version 1.5.2) was used for machine learning models. Matplotlib (version 3.9.2) was used for plotting.
2.2.1. Dataset Analysis
First, the dataset was analyzed by calculating the mean, standard deviation, minimum, maximum, and quartile for each of the attributes of the dataset. Once this was completed, a box plot was created showing the x-axis, y-axis, and z-axis vibrations for all types of surfaces present in the dataset.
2.2.2. Dataset Preprocessing
The dataset was previously processed as follows:
- The agrotechnical surface in the original dataset was encoded as numbers from 1 to 6 (1 being smooth track, 2 being rough track, etc.). This numerical representation was converted into one-hot encoded vectors using the one-hot encoder provided by scikit-learn [36]. This was necessary so that the machine learning models would not mistakenly think that there was some numerical relationship between the values of the agrotechnical surface feature.
- The air pressure in the tires was mapped to its actual value (i.e., 1 was mapped to 1.9 bar, 2 was mapped to 2.4 bar, etc.).
- The dataset was divided into two separate subsets—a training and validation subset and a testing subset. The dataset contains 6 data samples related to a single measurement. In other words, 6 data samples with the same input feature values and the same (or slightly different) target variable values are used. In order to prevent data leakage (i.e., 4 out of 6 data samples related to the same measurement are in the training and validation subset, while 2 out of 6 data samples are in the testing subset), all samples from a single measurement were completely in the training and validation subset or the testing subset. A stratified split on the agrotechnical surface feature was also performed, which means that an attempt was made to ensure that the same distribution of the agrotechnical surface feature was present in both the training and validation subset and the testing subset. We used 80% of our total data for training and validation, and we used 20% of our total data for testing the model.
2.2.3. Hyperparameter Tuning, Training, and Evaluation
The baseline model against which the results were compared was linear regression. The machine learning models tested in this paper were a gradient boosting regressor, an SVM regressor, and a multi-layer perceptron regressor. The choice of models was based on their ability to capture different types of relationships within the data: the gradient boosting regressor for structured data with potential nonlinearities, the SVM regressor for robust regression in small datasets, and multi-layer perceptron as a neural network approach. These models represent distinct machine learning paradigms and provide a balanced evaluation of predictive performance. All of the machine learning models were trained on each axis separately, which means that a total of 3 baselines and 9 machine learning models were achieved (1 baseline and 3 machine learning models per axis).
Linear regression is a model that estimates the linear relationship between the target variable and the input features [37]. It has the form:
where the weights are denoted by and the input features are denoted by . is called the bias term.
Within a computer, the weights ( and the input features ( are represented as vectors and matrices in order to allow for more efficient computation. This vectorization is present in all the other machine learning models as well. In this paper, a linear regression model was used as a baseline for comparing other models.
A gradient boosting machine is a machine learning model that is an ensemble of decision trees that are fitted sequentially. Each decision tree is fitted on the residual errors of the previously fitted decision tree [38]. Within scikit-learn, the gradient boosting regressor [39] has the following hyperparameters that are tuned: learning_rate (which shrinks the contribution of each decision tree), n_estimators (the number of boosting stages to perform), and max_depth (the maximum depth of each decision tree).
SVMs, a shorthand for support vector machines, can be used for classification as well as regression. Here, an SVM was used for regression, implemented inside the SVR class in scikit-learn [40]. Important hyperparameters for this model include the kernel (which transforms the data into a higher-dimensional space), C (which is used for regularization; higher values for C mean lower regularization), and epsilon (which specifies the error margin in the training loss).
A multi-layer perceptron regressor is a shallow neural network, meaning that it usually has one input layer, one or two hidden layers, and one output layer. This is in contrast with deep neural networks, which have much more than two hidden layers. A multi-layer perceptron regressor is implemented via the MLPRegressor class inside scikit-learn [41]. Important hyperparameters to consider for this model are hidden_layer_sizes (which is used to control the sizes of the hidden layers), activation (the activation function for the hidden layer), and alpha (which is the strength of the L2 regularization term).
For each of these machine learning models (excluding the baseline), a grid search with 10-fold cross-validation was performed to find the best hyperparameters [42]. This means that for each of the cross-validation folds, the training and validation subset was split into 90% training data and 10% validation data, and all possible combinations of hyperparameters for that machine learning model were used for training and evaluating that machine learning model. The score for each hyperparameter combination was remembered. R2 was used as the scoring metric. Table 3 contains the hyperparameter search space for each of the models.
Table 3.
Hyperparameter search space.
The best hyperparameters found through hyperparameter tuning are shown in Table 4.
Table 4.
Best hyperparameters for each machine learning model.
After finding the best hyperparameters for a particular machine learning model, the model was retrained on the entire training and validation subset of the dataset, and then the performance of the machine learning model was evaluated on the training and validation subset and the test subset of the dataset. The performance of the machine learning model on the test subset of the dataset provides insight into how well the model generalizes to unseen data.
The model was evaluated on both the training and validation subset and the test subset of the dataset. The following metrics were calculated: coefficient of determination (R2), root mean square error (RMSE), normalized root mean square error (NRMSE), and mean absolute error (MAE). They are calculated according to the following formulas:
where SSR represents the sum of squares of residuals between true and predicted whole-body vibrations, SST represents the total sum of squares, n is the number of samples, ypredicted represents the predicted whole-body vibration values, and ytrue represents the true whole-body vibration values.
2.2.4. Feature Importance Analysis
Feature importance analysis was performed using either the embedded feature importances attribute of the gradient boosting regressor or by using the permutation importance function [43]. The permutation importance function calculates the importance of a feature as follows: First, a baseline metric is calculated on the provided dataset. Then, one input feature of the dataset is randomly permuted. Once permuted, the metric is calculated again. The difference between the baseline metric and the metric obtained once the data are randomly permuted is the permutation importance. It is necessary to sum all the feature importances pertaining to the one-hot encoded agrotechnical surface feature.
3. Results and Discussion
The descriptive statistics of the x-axis, y-axis, and z-axis whole-body vibrations are provided in Table 5. All the axes have 648 data samples associated with them. The 25% (first quartile) column indicates that 25% of the vibration measurements are below this number, the 50% (median) column is the middle value of the dataset, meaning that half of the measurements are below this value and half are above, and the 75% (third quartile) column shows that 75% of the measurements are below this number. The SEM column stands for standard error of the mean.
Table 5.
Descriptive statistics of whole-body vibrations for each axis (measured in ms−2).
Vibrations for each of the axes are visible in Figure 3.
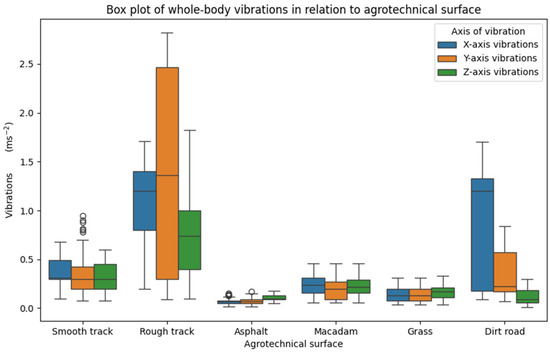
Figure 3.
The box plot of whole-body vibrations in relation to the agrotechnical surface.
From the figure, we can see that the vibrations were most prominent and dispersed on the rough track, followed by the dirt road. The median was also found to be most prominent on the rough track in all three axes and was followed by the dirt road. Furthermore, this clustering shows how the two mentioned surfaces have separated themselves from the others in terms of their vibration levels.
The analysis revealed the greatest data variability in the longitudinal (x-axis) orientation at inflation pressures of 2.4 bar and 2.9 bar, with lateral (y-axis) variability peaking at 2.4 bar and vertical (z-axis) variability at 2.9 bar. Median-based assessments further demonstrated heightened dispersion in both the longitudinal and lateral axes under the baseline tire pressure (2.4 bar), whereas vertical axis variability correlated with reduced inflation levels (1.9 bar) (Figure 4).
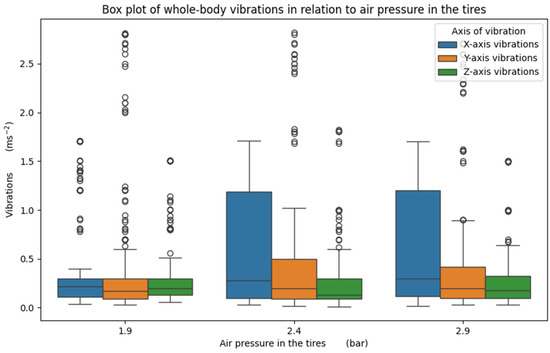
Figure 4.
The box plot of whole-body vibrations in relation to tire pressure.
Peak median values were observed across all three vibrational axes at the highest tested speed of 6 kmh−1 (Figure 5). Empirical trends indicate a direct correlation between a rising operational speed and elevated median vibration magnitudes along all three measurement axes. Additionally, longitudinal (x-axis) data exhibited the greatest variability in recorded values at every tested speed of movement.
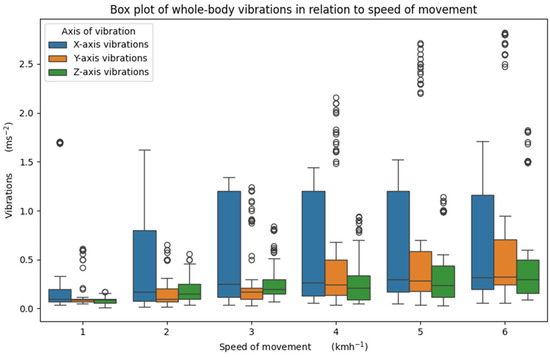
Figure 5.
The box plot of whole-body vibrations in relation to the speed of movement.
The European Directive 2002/44/EC [8] prescribes the permissible limits for vibrations of the whole body, which are classified into two categories during the eight-hour working time of the operator: exposure action value of 0.5 ms−2 and exposure limit of 1.15 ms−2. If the action value is exceeded, the following guidelines should be made: other working methods that require less exposure to mechanical vibration; appropriate work equipment of ergonomic design, producing the least possible vibration; provision of auxiliary equipment that reduces the risk of injuries, such as special seats; appropriate maintenance programs for work equipment; design and layout of workplaces; adequate information and training to instruct workers to use work equipment correctly and safely limitation of the duration and intensity of the exposure; work schedules with adequate rest periods; and provision of clothing to protect workers from cold and damp. In any event, workers shall not be exposed above the exposure limit value. If this should be the case, the employer shall take immediate action to reduce exposure below the exposure limit value.
By observing the influence of the surfaces, it was determined that the exposure limit for vibrations in the x-axis and y-axis directions was exceeded for the rough track and for the dirt road in the x-axis direction. The exposure action limit was exceeded for the rough track (in the z-axis direction) and the dirt road (in the y-axis direction).
The longitudinal (x-axis) vibration levels surpassed regulatory exposure thresholds under both baseline (2.4 bar) and elevated (2.9 bar) tire inflation conditions. Additionally, testing identified exceedances of the exposure action limit at the standard tire pressure setting (2.4 bar).
An exceeded vibration exposure limit was determined at higher speeds of movement (3 kmh−1, 4 kmh−1, 5, and 6 kmh−1) in the x-axis direction, while the exceeded exposure action limit was determined in the direction of the y-axis at movement speeds of 4 kmh−1, 5 kmh−1, and 6 kmh−1.
The results for each of the machine learning models can be found in Table 6, Table 7 and Table 8 below.
Table 6.
x-axis whole-body vibration prediction results.
Table 7.
y-axis whole-body vibration prediction results.
Table 8.
z-axis whole-body vibration prediction results.
By looking at Table 6, Table 7 and Table 8, it is determined that the gradient boosting regressor performed the best on the test subset for the x-axis whole-body vibration prediction in regard to the R2 metric. This is also true for the y-axis whole-body vibration prediction. This was not surprising, as the gradient boosting regressor often performs very well on structured data with potential nonlinearities. Regarding the z-axis whole-body vibration prediction, the SVM regressor performed slightly better on the test subset in regard to the R2 metric than the gradient boosting regressor. This is not so strange, considering that the SVM regressor tends to work well on relatively small datasets (such as ours). It is also possible to notice that the SVM regressor performed worse than the baseline on the x-axis on the test subset. This was somewhat surprising to us, as we expected all the machine learning models to perform better than the baseline.
The superiority of machine learning models over the traditional linear regression approach has also been established in other studies regarding the impact of whole-body vibration. Aguilar et al. [26], investigating the transmission of vibrations to a machine operator at different speeds and surfaces, determined, using neural networks, a coefficient of determination (R2) above 0.90 for each model. Zeng et al. [44], investigating farmers’ exposure to whole-body vibrations while operating machinery, analyzed their prediction using two models, RMS and VDV, where they determined the coefficient of determination (R2) of 47% (RMS) and R2 of 19.5% (VDV). Tian et al. [45] used several machine learning models to predict machine operator driving comfort, with the XGBoost model achieving satisfactory accuracy (R2 = 0.96; RMSE = 0.015), which is better than the ANN, SVM, and GP models. Investigating vibrations in surface mining machines, Ali and Frimpong [46] used deep learning to track impact forces in real time during the operation, which is assumed to cause vibrations. DeepImpact showed exceptional performance, yielding R2, RMSE, and MAE values of 0.9948, 10.750, and 6.33 respectively. Waleed et al. [47] applied five techniques (k-nearest neighbor (KNN), support vector machine (SVM), decision tree (DT), random forest (RF) and gradient boosting (GB)) of supervised machine learning for the classification of agricultural machinery. All five machine learning algorithms used for the classification had an accuracy greater than 82% [26,44,45,46,47].
The feature importances for each model are described in Figure 6.
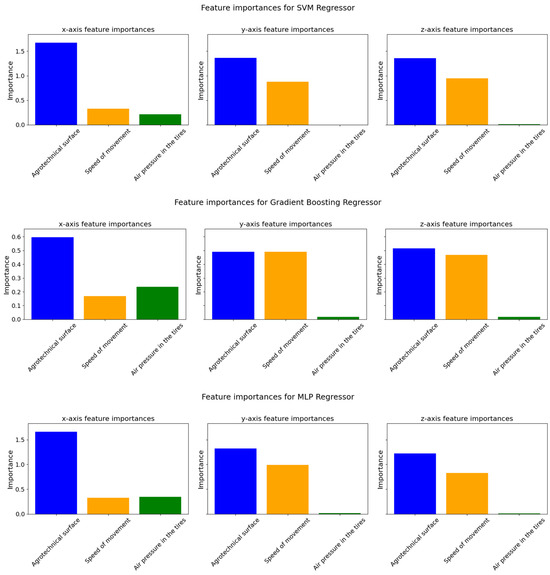
Figure 6.
The feature importances for SVM regressor, gradient boosting regressor, and MLP Regressor.
It is shown that for each of the axes, the agrotechnical surface was the most important feature in predicting whole-body vibrations. Following this feature, most machine learning models deemed the speed of movement to be the second most important feature (albeit not always). Air pressure in the tires seems to be the least important input feature overall, as indicated by other research on the importance of the selected independent variables in this study [12,48,49].
4. Conclusions
The primary objective of this research was to employ machine learning algorithms to predict whole-body vibrational exposure in agricultural tractor operators within cabin environments, considering diverse terrain surfaces, varying operational speeds, and differing tire inflation pressures.
By employing machine learning on the measured whole-body vibration levels within the cabin of the agricultural tractor for each of the axes, aiming for more accurate prediction, the following was concluded:
- Whole-body vibrations were most prominent on the rough track;
- In almost all instances, the machine learning models were better than the baseline (linear regression);
- For the x-axis and the y-axis, the model of choice would be the gradient boosting regressor, while for the z-axis, the model of choice would be the SVM regressor (which beat gradient boosting slightly);
- The most important input features for predicting whole-body vibrations across all three axes are, in order, agrotechnical surface, the speed of movement, and air pressure in the tires.
The application of machine learning methods has proven accurate in predicting whole-body vibrations of a tractor operator for all axes. To enhance statistical reliability, subsequent studies should prioritize expanded sampling efforts across select terrain (surface) types, thereby improving the dataset scale and diversity.
Author Contributions
Conceptualization, Ž.B. and M.J.; methodology, Ž.B. and M.J.; software, M.J.; validation, Ž.B., M.J., I.P., T.J. and M.M.; formal analysis, Ž.B.; investigation, Ž.B. and M.J.; resources, Ž.B.; data curation, Ž.B. and M.J.; writing—original draft preparation, Ž.B., M.J. and I.P.; writing—review and editing, Ž.B., M.J., I.P., T.J. and M.M.; visualization, M.J.; supervision, I.P.; project administration, M.M.; funding acquisition, Ž.B., M.J., I.P., T.J. and M.M. All authors have read and agreed to the published version of the manuscript.
Funding
This research received no external funding.
Data Availability Statement
The data presented in this study are available on request from the corresponding author.
Conflicts of Interest
The authors declare no conflicts of interest.
References
- Bovenzi, M.; Hulshof, C.T. An Updated Review of Epidemiologic Studies on the Relationship between Exposure to Whole-Body Vibration and Low Back Pain (1986–1997). Int. Arch. Occup. Env. Health 1999, 72, 351–365. [Google Scholar] [CrossRef] [PubMed]
- Griffin, M.J. (Ed.) 14—Vascular Disorders Associated with Hand-Transmitted Vibration. In Handbook of Human Vibration; Academic Press: London, UK, 1990; pp. 553–593. ISBN 978-0-12-303040-5. [Google Scholar]
- de la Hoz-Torres, M.L.; Aguilar, A.J.; Martínez-Aires, M.D.; Ruiz, D.P. A Methodology for Assessment of Long-Term Exposure to Whole-Body Vibrations in Vehicle Drivers to Propose Preventive Safety Measures. J. Saf. Res. 2021, 78, 47–58. [Google Scholar] [CrossRef] [PubMed]
- Wikström, B.-O.; Kjellberg, A.; Landström, U. Health Effects of Long-Term Occupational Exposure to Whole-Body Vibration: A Review. Int. J. Ind. Ergon. 1994, 14, 273–292. [Google Scholar] [CrossRef]
- Krajnak, K. Health Effects Associated with Occupational Exposure to Hand-Arm or Whole Body Vibration. J. Toxicol. Env. Health B Crit. Rev. 2018, 21, 320–334. [Google Scholar] [CrossRef]
- Bovenzi, M. A Longitudinal Study of Low Back Pain and Daily Vibration Exposure in Professional Drivers. Ind. Health 2010, 48, 584–595. [Google Scholar] [CrossRef]
- Blood, R.P.; Yost, M.G.; Camp, J.E.; Ching, R.P. Whole-Body Vibration Exposure Intervention among Professional Bus and Truck Drivers: A Laboratory Evaluation of Seat-Suspension Designs. J. Occup. Env. Hyg. 2015, 12, 351–362. [Google Scholar] [CrossRef]
- Directive—2002/44—EN—EUR-Lex. Available online: https://eur-lex.europa.eu/eli/dir/2002/44/oj/eng (accessed on 24 February 2025).
- Singh, A.; Samuel, S.; Singh, H.; Kumar, Y.; Prakash, C. Evaluation and Analysis of Whole-Body Vibration Exposure during Soil Tillage Operation. Safety 2021, 7, 61. [Google Scholar] [CrossRef]
- Cazani, A.C.; Miyajima, R.H.; Simões, D.; dos Santos, J.E.G. Operator Exposure to Whole-Body Vibration in Timber Extraction with Grapple Skidder. J. Vib. Eng. Technol. 2021, 9, 177–182. [Google Scholar] [CrossRef]
- Scarlett, A.J.; Price, J.S.; Stayner, R.M. Whole-Body Vibration: Evaluation of Emission and Exposure Levels Arising from Agricultural Tractors. J. Terramech. 2007, 44, 65–73. [Google Scholar] [CrossRef]
- Barač, Ž.; Radočaj, D.; Plaščak, I.; Jurišić, M.; Marković, M. Prediction of Noise Levels According to Some Exploitation Parameters of an Agricultural Tractor: A Machine Learning Approach. AgriEngineering 2024, 6, 995–1007. [Google Scholar] [CrossRef]
- de la Hoz-Torres, M.L.; Aguilar, A.J.; Ruiz, D.P.; Martínez-Aires, M.D. Whole Body Vibration Exposure Transmitted to Drivers of Heavy Equipment Vehicles: A Comparative Case According to the Short- and Long-Term Exposure Assessment Methodologies Defined in ISO 2631-1 and ISO 2631-5. Int. J. Environ. Res. Public Health 2022, 19, 5206. [Google Scholar] [CrossRef]
- Du, X.; Sun, C.; Zheng, Y.; Feng, X.; Li, N. Evaluation of Vehicle Vibration Comfort Using Deep Learning. Measurement 2021, 173, 108634. [Google Scholar] [CrossRef]
- Al-Mafrachi, A.A.H. Measuring Vibration at Tractor Platform, Steering Wheel and Seat Effective Amplitude Transmissibility Factor During Operation Tillage. Iraqi J. Agric. Sci. 2016, 47, 365–378. [Google Scholar] [CrossRef][Green Version]
- Hoz-Torres, M.L.; López-Alonso, M.; Ruíz, D.P.; Martínez-Aires, M.D. Analysis of Whole-Body Vibrations Transmitted by Earth Moving Machinery. In Proceedings of the Occupational Safety and Hygiene V, Guimarães, Portugal, 10 April 2017; pp. 453–456. [Google Scholar]
- Singh, A.; Samuel, S.; Singh, H.; Singh, J.; Prakash, C.; Dhabi, Y.K. Whole Body Vibration Exposure among the Tractor Operator during Soil Tillage Operation: An Evaluation Using ISO 2631-5 Standard. Shock Vib. 2022, 2022, 6412120. [Google Scholar] [CrossRef]
- Anifantis, A.S.; Cutini, M.; Bietresato, M. An Experimental–Numerical Approach for Modelling the Mechanical Behaviour of a Pneumatic Tyre for Agricultural Machines. Appl. Sci. 2020, 10, 3481. [Google Scholar] [CrossRef]
- Halmai, B.; Holsgrove, T.P.; Vine, S.J.; Harris, D.J.; Williams, G.K.R. The After-Effects of Occupational Whole-Body Vibration on Human Cognitive, Visual, and Motor Function: A Systematic Review. Appl. Ergon. 2024, 118, 104264. [Google Scholar] [CrossRef]
- Deboli, R.; Calvo, A.; Preti, C. Whole-Body Vibration: Measurement of Horizontal and Vertical Transmissibility of an Agricultural Tractor Seat. Int. J. Ind. Ergon. 2017, 58, 69–78. [Google Scholar] [CrossRef]
- LeCun, Y.; Bengio, Y.; Hinton, G. Deep Learning. Nature 2015, 521, 436–444. [Google Scholar] [CrossRef]
- Friedman, J.H. Greedy Function Approximation: A Gradient Boosting Machine. Ann. Stat. 2001, 29, 1189–1232. [Google Scholar] [CrossRef]
- Jordan, M.I.; Mitchell, T.M. Machine Learning: Trends, Perspectives, and Prospects. Science 2015, 349, 255–260. [Google Scholar] [CrossRef]
- Son, H.; Lim, J.W.; Park, S.; Park, B.; Han, J.; Kim, H.B.; Lee, M.C.; Jang, K.-J.; Kim, G.; Chung, J.H. A Machine Learning Approach for the Classification of Falls and Activities of Daily Living in Agricultural Workers. IEEE Access 2022, 10, 77418–77431. [Google Scholar] [CrossRef]
- Nath, N.D.; Chaspari, T.; Behzadan, A.H. Automated Ergonomic Risk Monitoring Using Body-Mounted Sensors and Machine Learning. Adv. Eng. Inform. 2018, 38, 514–526. [Google Scholar] [CrossRef]
- Aguilar, A.J.; de la Hoz-Torres, M.L.; Martínez-Aires, M.D.; Ruiz, D.P.; Arezes, P.; Costa, N. Artificial Neural Network-Based Model for Assessing the Whole-Body Vibration of Vehicle Drivers. Buildings 2024, 14, 1713. [Google Scholar] [CrossRef]
- Kamilaris, A.; Prenafeta-Boldú, F.X. Deep Learning in Agriculture: A Survey. Comput. Electron. Agric. 2018, 147, 70–90. [Google Scholar] [CrossRef]
- Machine Learning in Agriculture: A Review. Available online: https://www.mdpi.com/1424-8220/18/8/2674 (accessed on 25 February 2025).
- Cortes, C.; Vapnik, V. Support-Vector Networks. Mach. Learn. 1995, 20, 273–297. [Google Scholar] [CrossRef]
- HRN4You Mechanical Vibration and Shock—Assessment of Human Exposure to Whole-Body Vibration—Part 1: General Requirements (HRN ISO 2631-1:1997). Available online: https://repozitorij.hzn.hr/norm/HRN+ISO+2631-1%3A1999 (accessed on 30 January 2025).
- HRN4You Agricultural Wheeled Tractors and Field Machinery—Measurement of Whole-Body Vibration of the Operator (ISO 5008:2002+Cor 1:2005). Available online: https://repozitorij.hzn.hr/norm/HRN+ISO+5008%3A2015 (accessed on 25 June 2024).
- What Is Power Steering and How Does Tractor Power Steering Work? Available online: https://www.tractorjunction.com/blog/what-is-power-steering/ (accessed on 13 February 2025).
- TractorData.Com Landini Powerfarm 100 Tractor Information. Available online: https://www.tractordata.com/farm-tractors/008/6/2/8627-landini-powerfarm-100.html (accessed on 13 February 2025).
- HRN4You Mechanical Vibration and Shock—Evaluation of Human Exposure to Whole-Body Vibration—Part 4: Guidelines for the Evaluation of the Effects of Vibration and Rotational Motion on Passenger and Crew Comfort in Fixed-Guideway Transport Systems (HRN ISO 2631-4:2001/Amd 1:2010). Available online: https://repozitorij.hzn.hr/norm/HRN+ISO+2631-4%3A2010%2FA1%3A2018 (accessed on 30 January 2025).
- Metra Meß- und Frequenztechnik Home Page. Available online: https://www.mmf.de/wp-content/uploads/2023/08/vm30-wmane.pdf (accessed on 30 January 2025).
- OneHotEncoder. Available online: https://scikit-learn/stable/modules/generated/sklearn.preprocessing.OneHotEncoder.html (accessed on 30 January 2025).
- Linear Regression in Machine Learning. Available online: https://www.geeksforgeeks.org/ml-linear-regression/ (accessed on 30 January 2025).
- Gradient Boosting Trees, vs. Random Forests|Baeldung on Computer Science. Available online: https://www.baeldung.com/cs/gradient-boosting-trees-vs-random-forests (accessed on 30 January 2025).
- GradientBoostingRegressor. Available online: https://scikit-learn/stable/modules/generated/sklearn.ensemble.GradientBoostingRegressor.html (accessed on 30 January 2025).
- SVR. Available online: https://scikit-learn/stable/modules/generated/sklearn.svm.SVR.html (accessed on 30 January 2025).
- MLPRegressor. Available online: https://scikit-learn/stable/modules/generated/sklearn.neural_network.MLPRegressor.html (accessed on 30 January 2025).
- GridSearchCV. Available online: https://scikit-learn/stable/modules/generated/sklearn.model_selection.GridSearchCV.html (accessed on 30 January 2025).
- Permutation_Importance. Available online: https://scikit-learn/stable/modules/generated/sklearn.inspection.permutation_importance.html (accessed on 30 January 2025).
- Zeng, X.; Kociolek, A.M.; Khan, M.I.; Milosavljevic, S.; Bath, B.; Trask, C.M. Predicting Whole-Body Vibration Exposure in Canadian Prairie Farmers. Ann. Work. Expo. Health 2017, 61, 554–565. [Google Scholar] [CrossRef]
- Tian, H.; Ji, A. Real-Time Adaptive Tractor Ride Comfort Adjustment System Based on Machine Learning Method. IEEE Access 2025, 13, 3274–3283. [Google Scholar] [CrossRef]
- Ali, D.; Frimpong, S. DeepImpact: A Deep Learning Model for Whole Body Vibration Control Using Impact Force Monitoring. Neural Comput. Applic. 2021, 33, 3521–3544. [Google Scholar] [CrossRef]
- Waleed, M.; Um, T.-W.; Kamal, T.; Usman, S.M. Classification of Agriculture Farm Machinery Using Machine Learning and Internet of Things. Symmetry 2021, 13, 403. [Google Scholar] [CrossRef]
- Ramar, K.; Kumaraswamidhas, L.A.; Balaji, P.S.; Agasthian, A. Whole Body Vibration Impact Assessment on Dumper Operator Using Computational Learning Technique. Int. J. Precis. Eng. Manuf. 2023, 24, 219–238. [Google Scholar] [CrossRef]
- Hota, S.; Tewari, V.K.; Chandel, A.K. Workload Assessment of Tractor Operations with Ergonomic Transducers and Machine Learning Techniques. Sensors 2023, 23, 1408. [Google Scholar] [CrossRef] [PubMed]


Disclaimer/Publisher’s Note: The statements, opinions and data contained in all publications are solely those of the individual author(s) and contributor(s) and not of MDPI and/or the editor(s). MDPI and/or the editor(s) disclaim responsibility for any injury to people or property resulting from any ideas, methods, instructions or products referred to in the content. |
© 2025 by the authors. Licensee MDPI, Basel, Switzerland. This article is an open access article distributed under the terms and conditions of the Creative Commons Attribution (CC BY) license (https://creativecommons.org/licenses/by/4.0/).