
Soil Structure Analysis with Attention: A Deep-Learning-Based Method for 3D Pore Segmentation and Characterization

 , , ,
, , ,  , and
, and
Abstract
1. Introduction
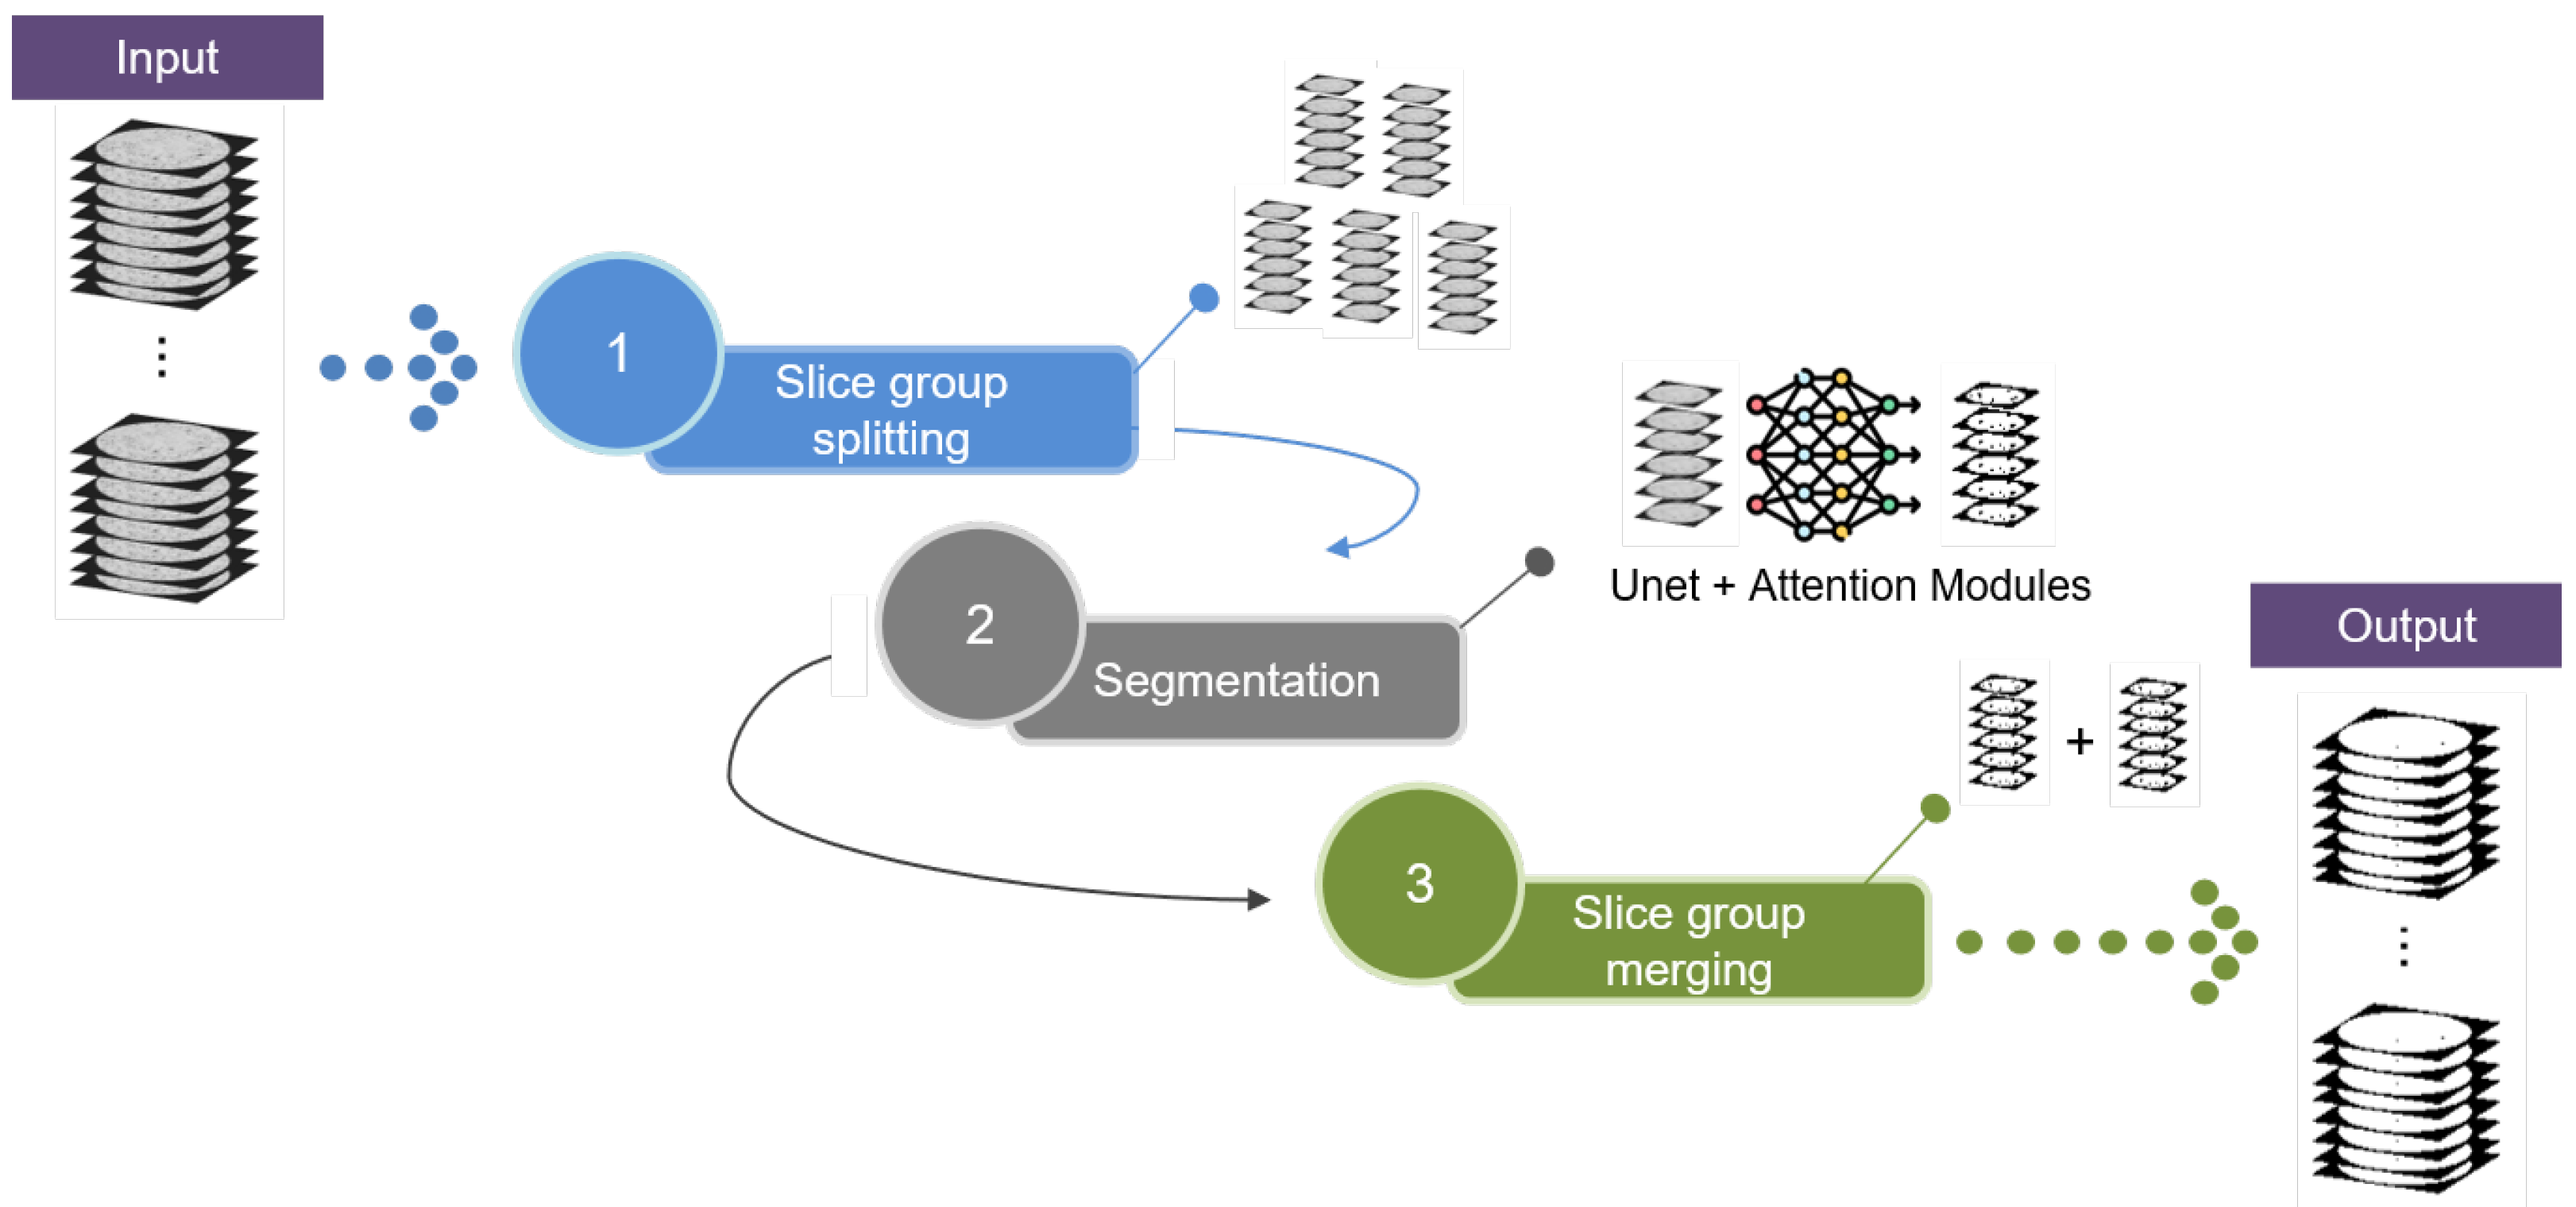
2. Proposed Method
2.1. Pore Segmentation
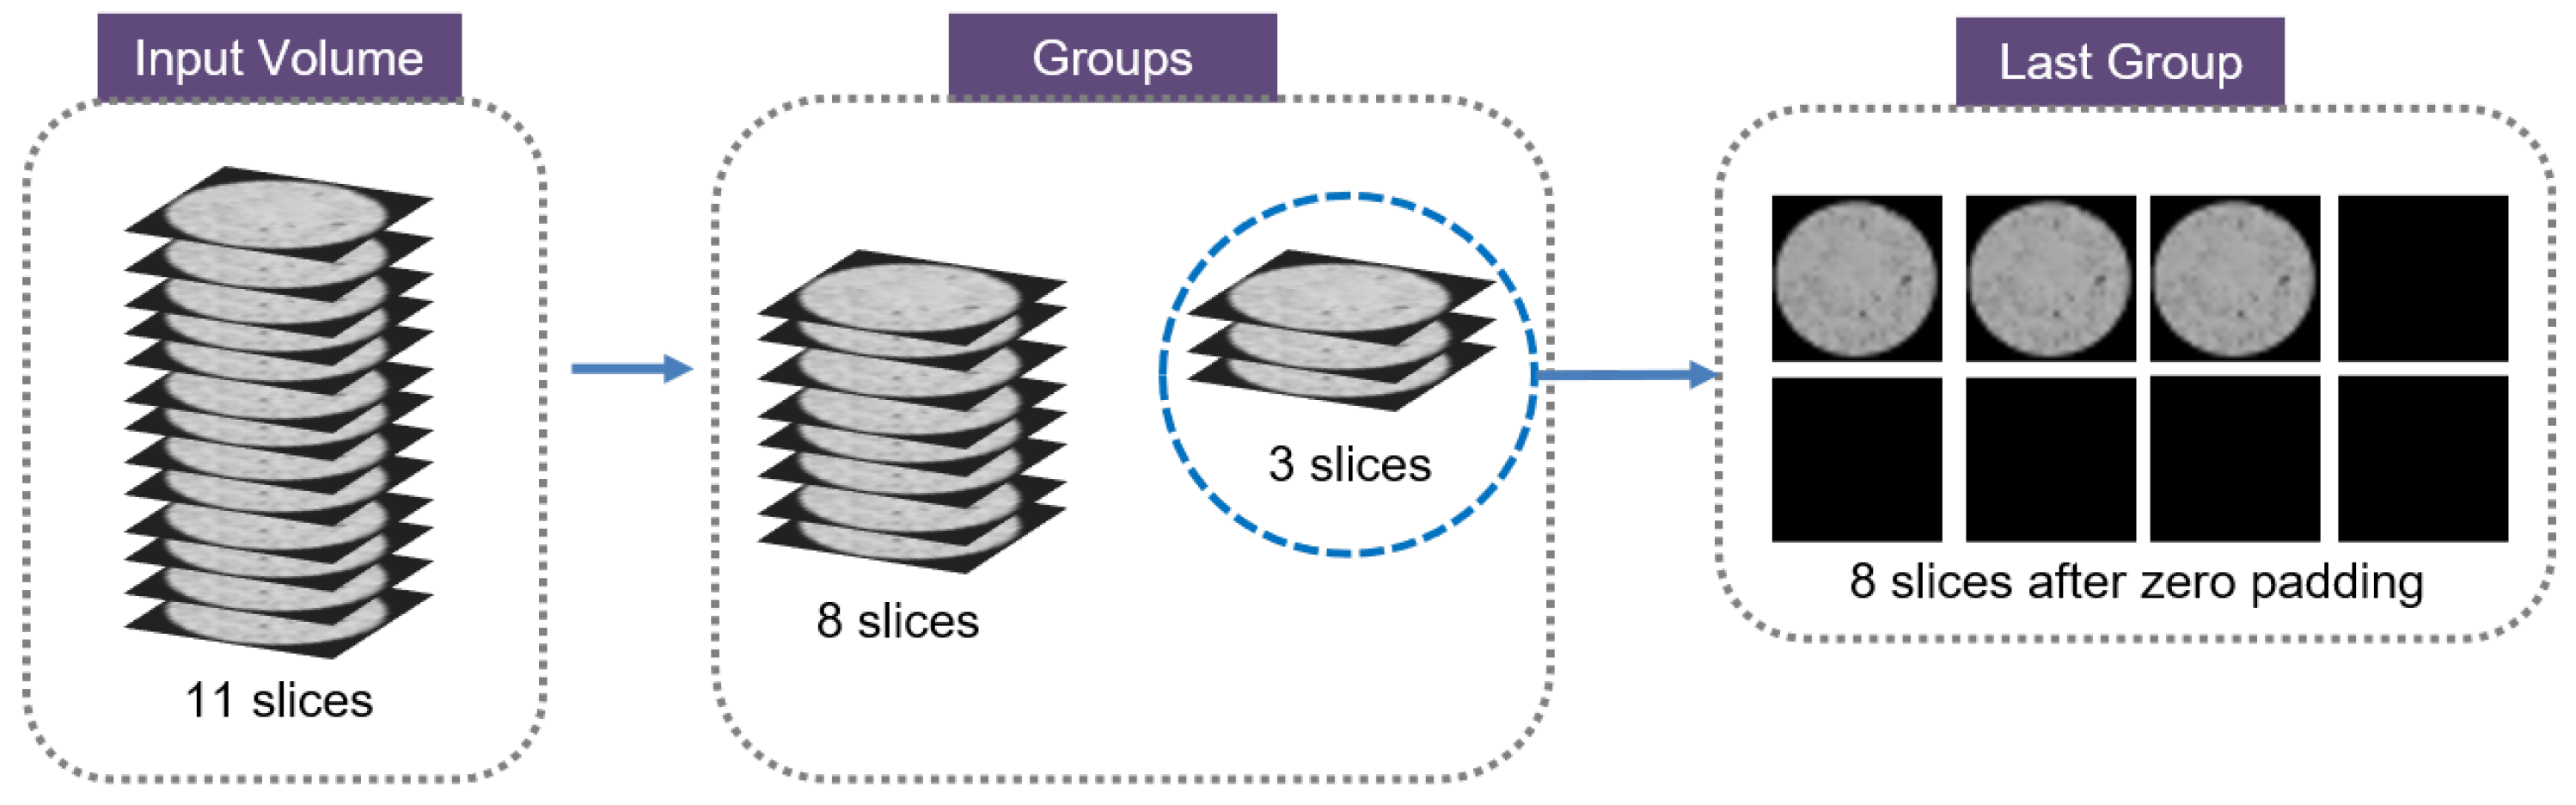
2.1.1. Slice Group Splitting
2.1.2. Segmentation
2.1.3. Slice Group Merging and Output
2.2. Soil Characterization
3. Experiments and Results
3.1. Datasets
3.2. Experimental Setup
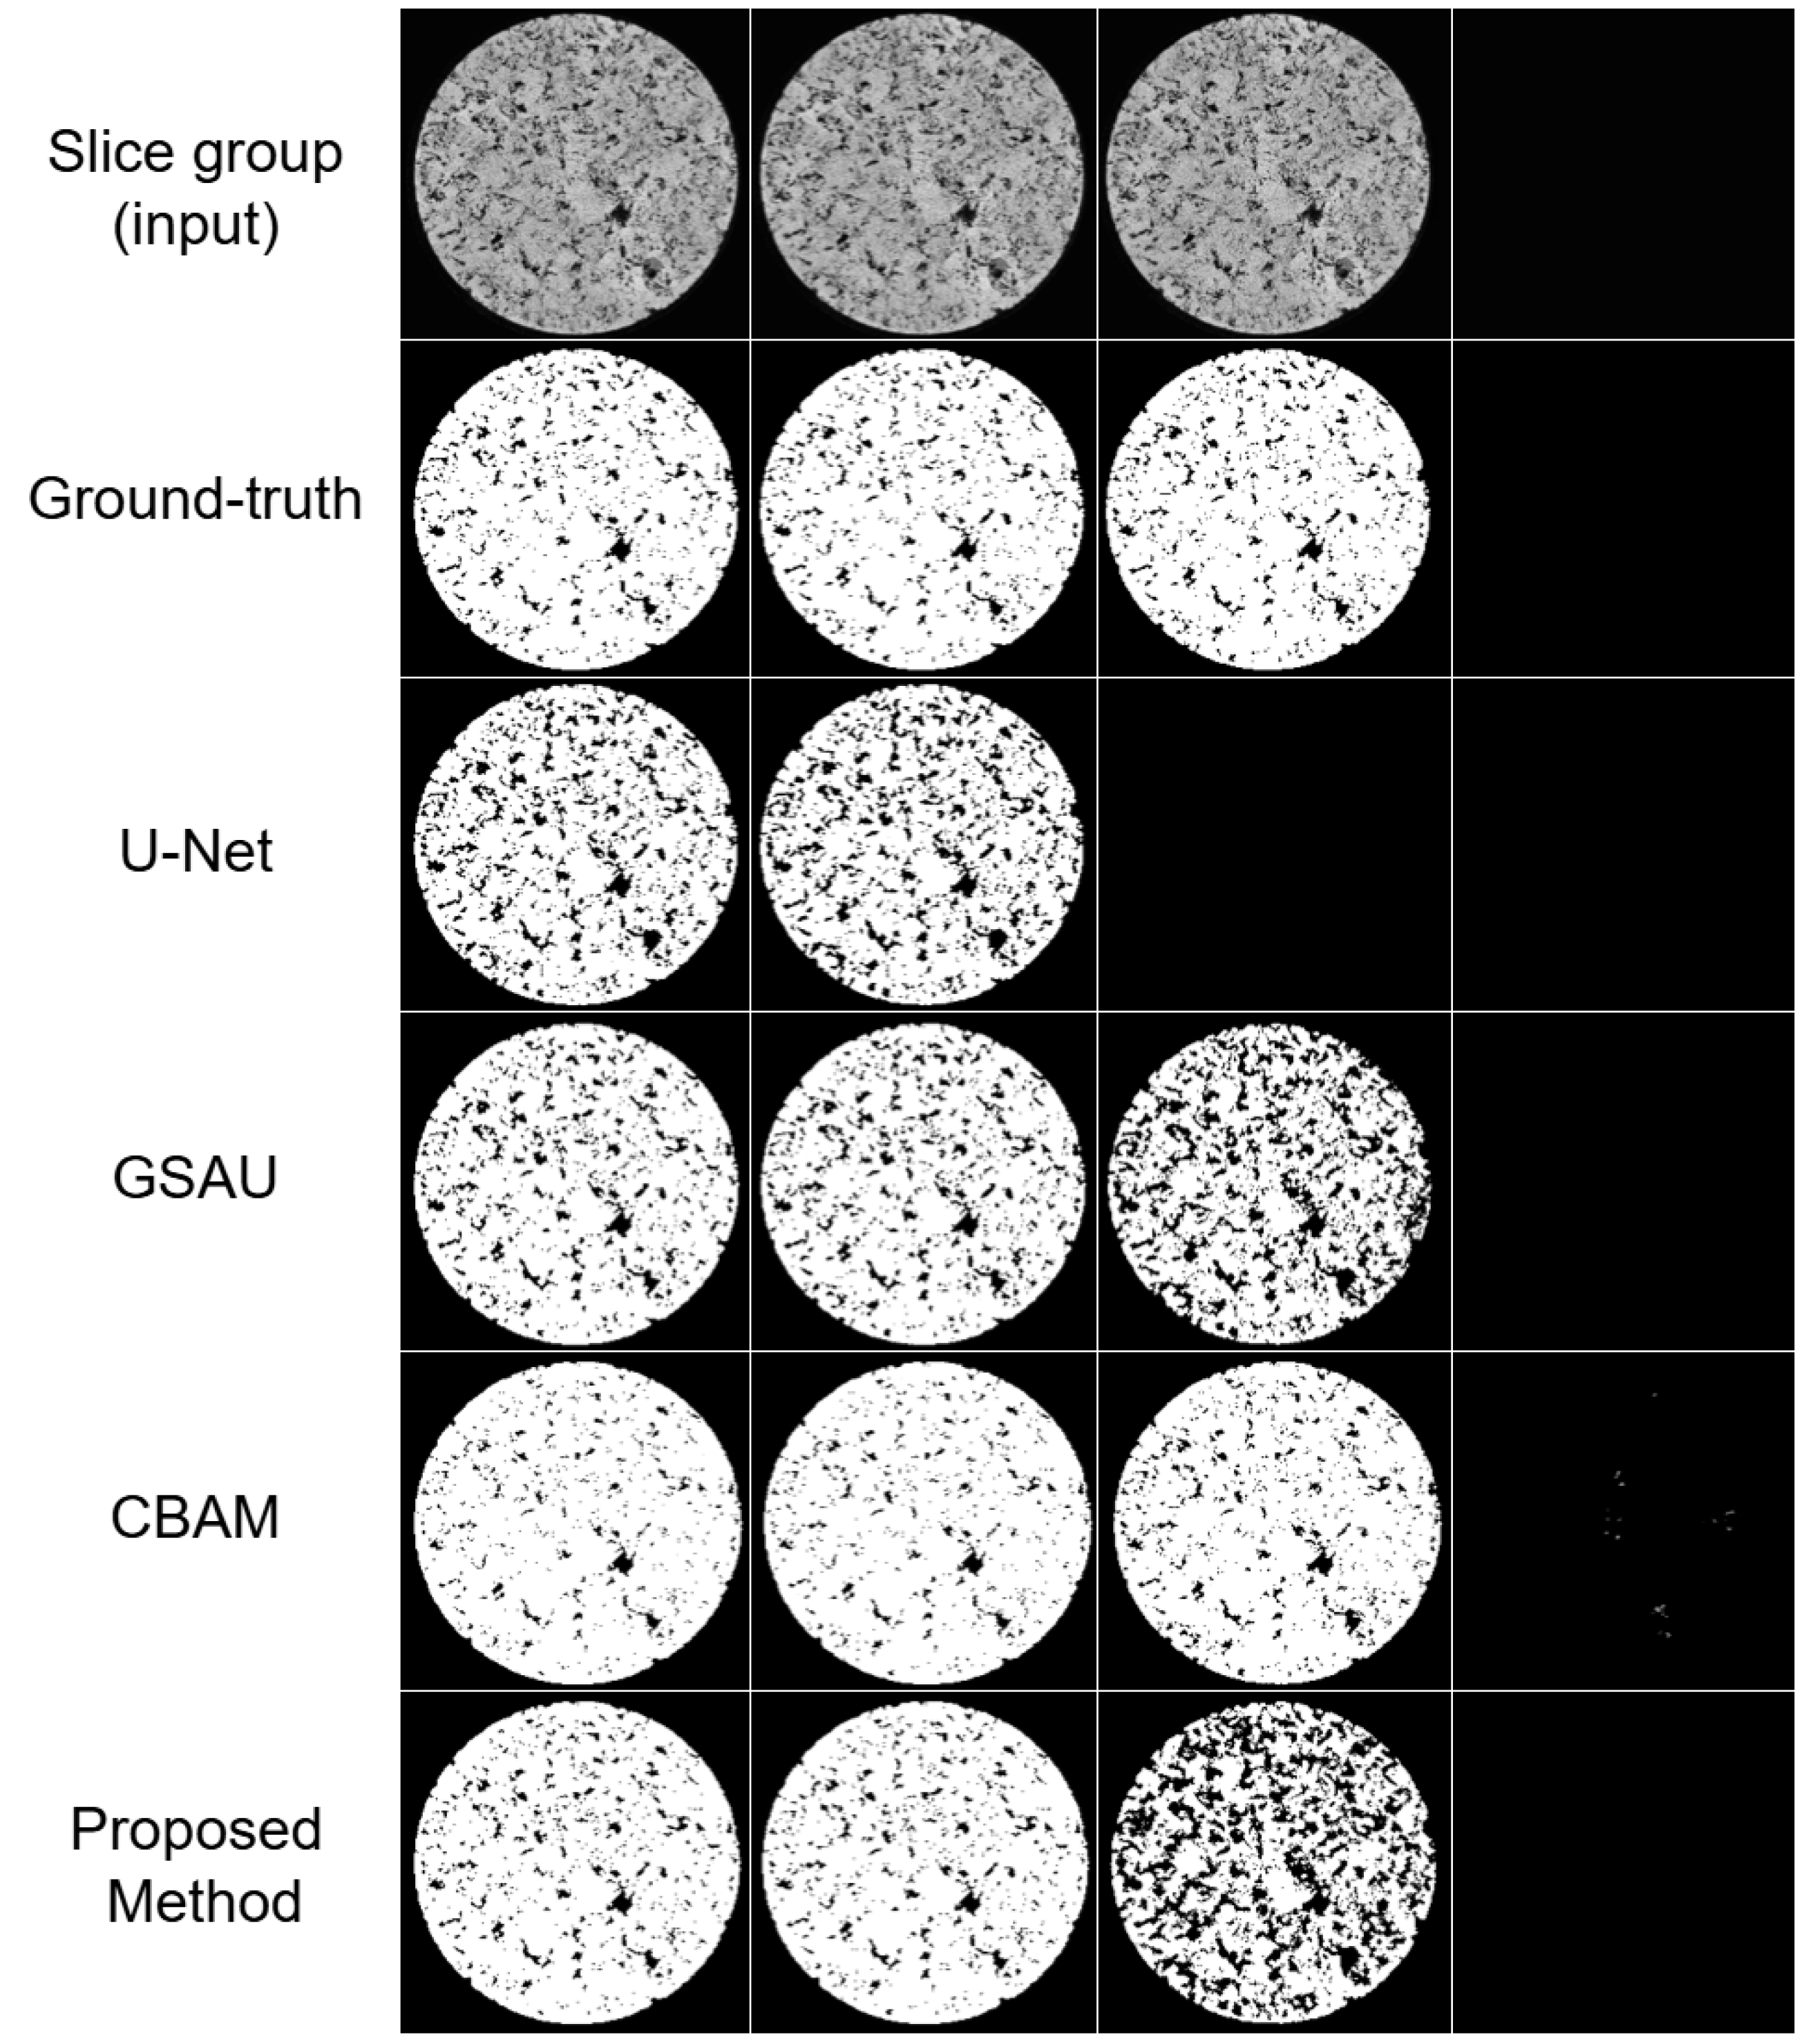
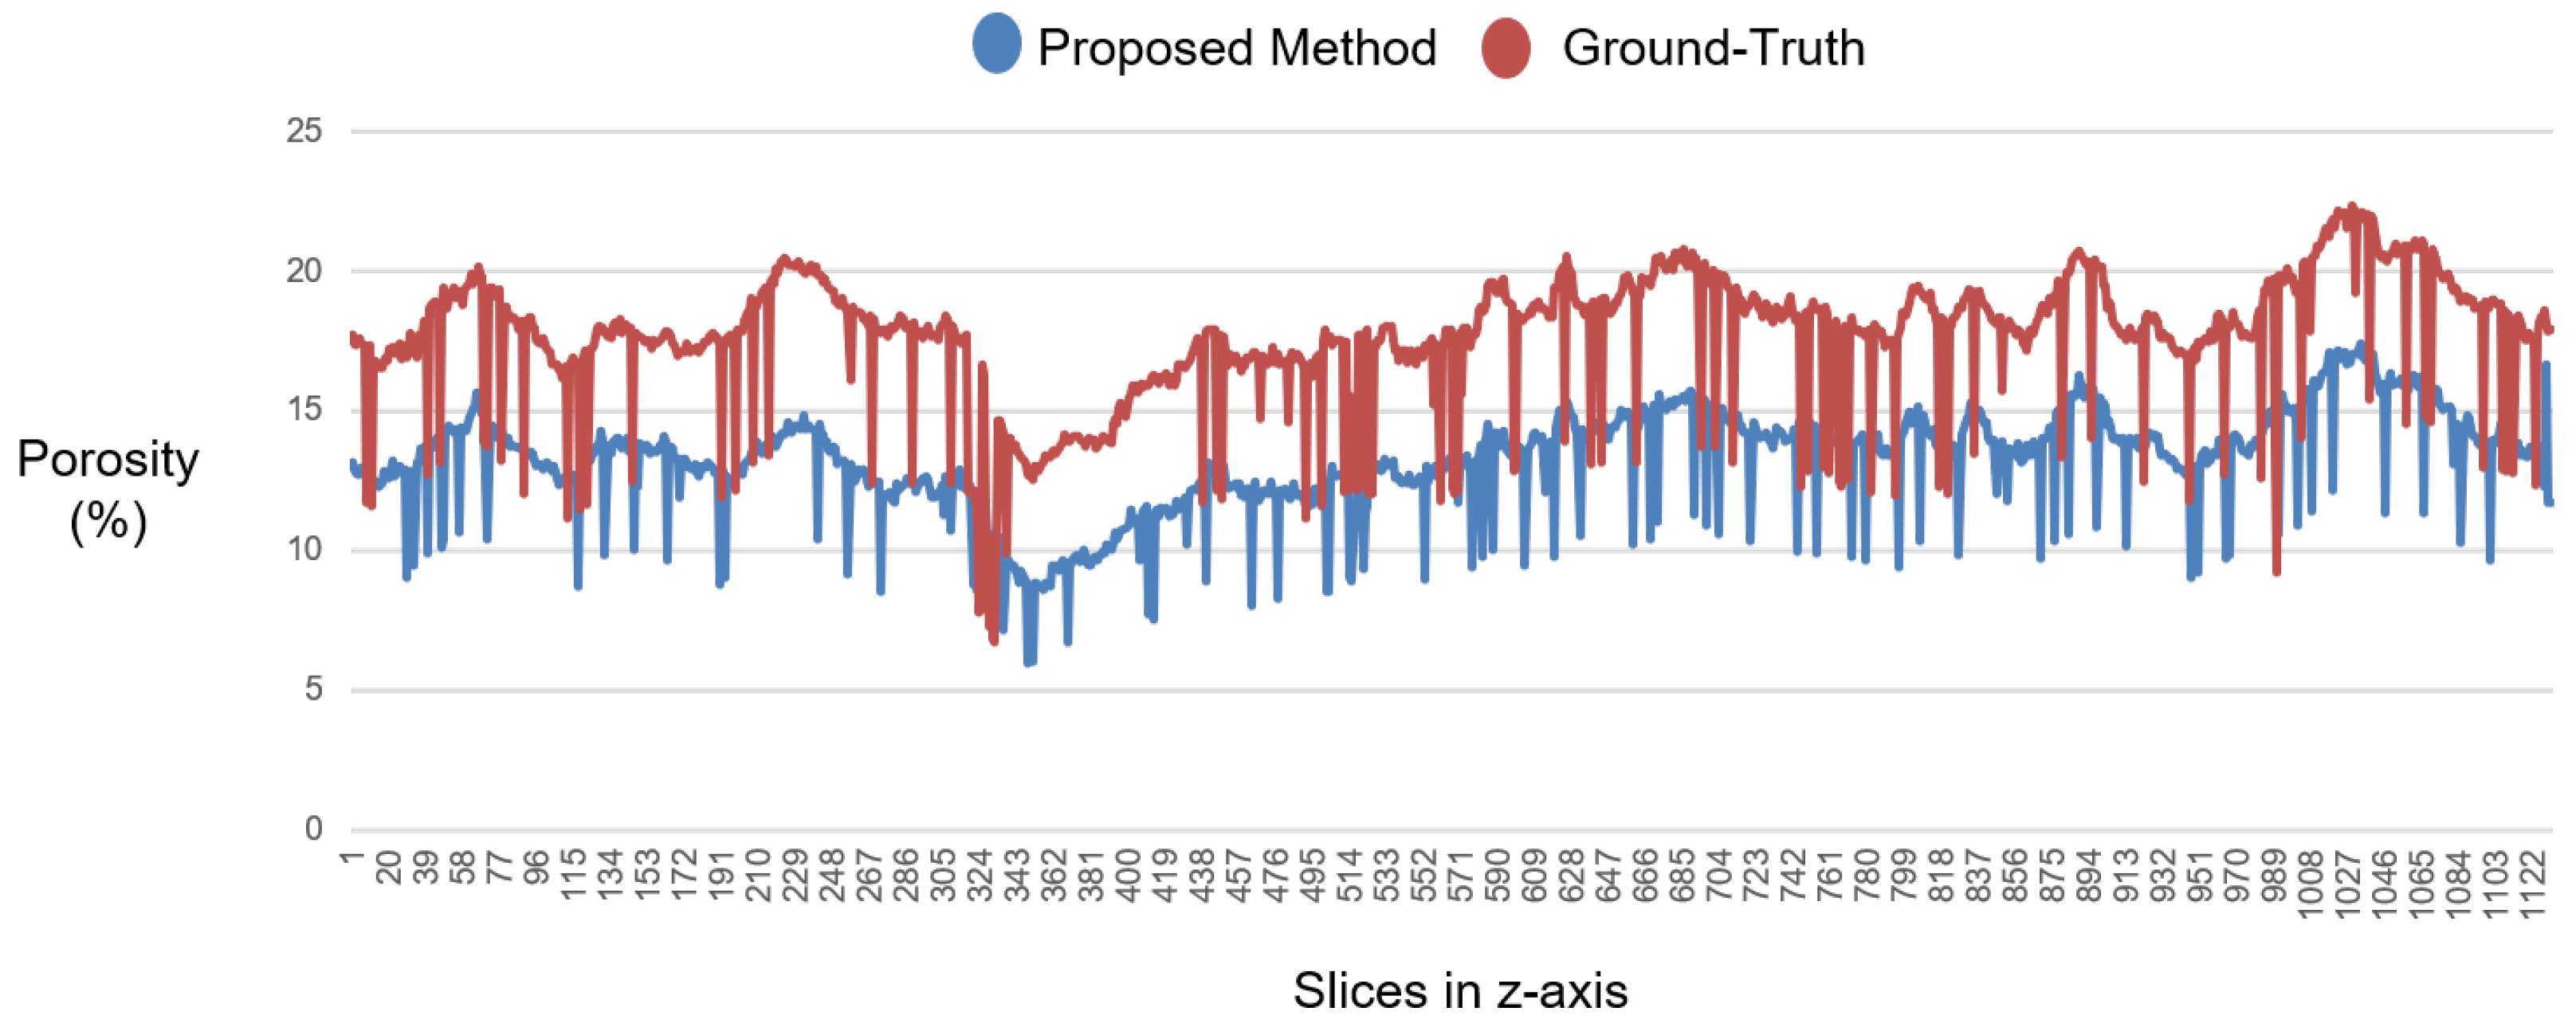
3.3. Experiments with the Private Dataset
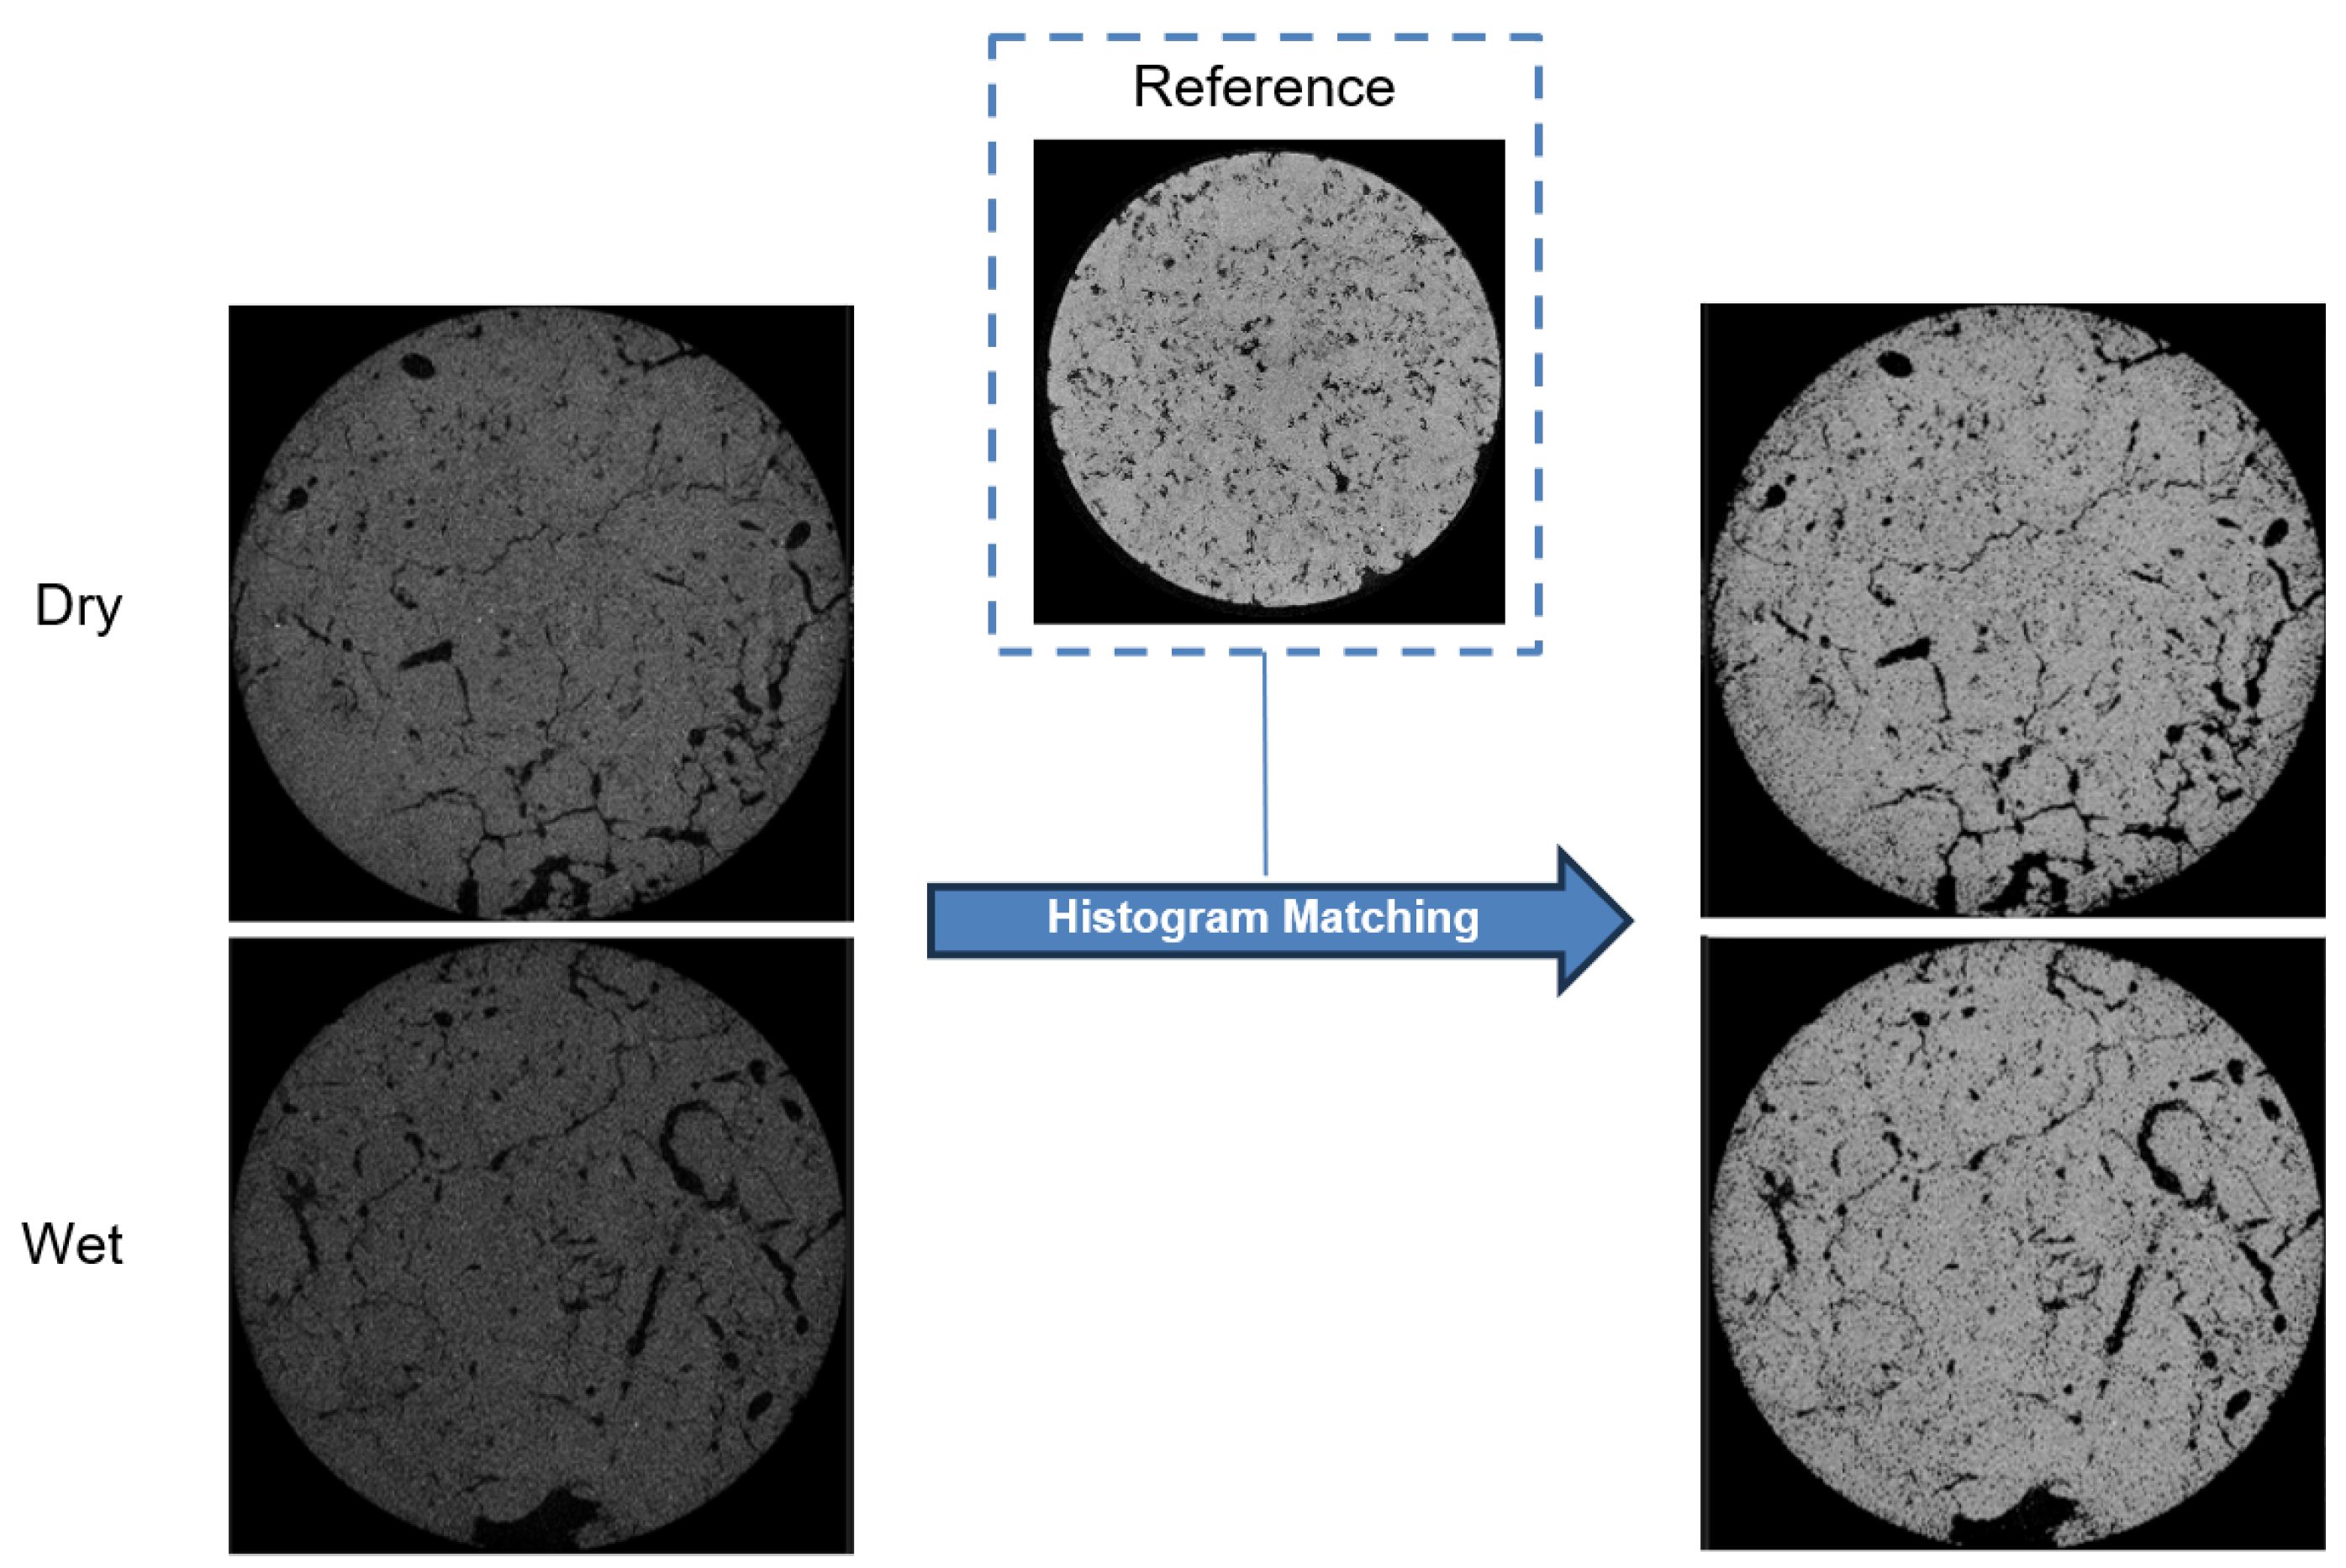
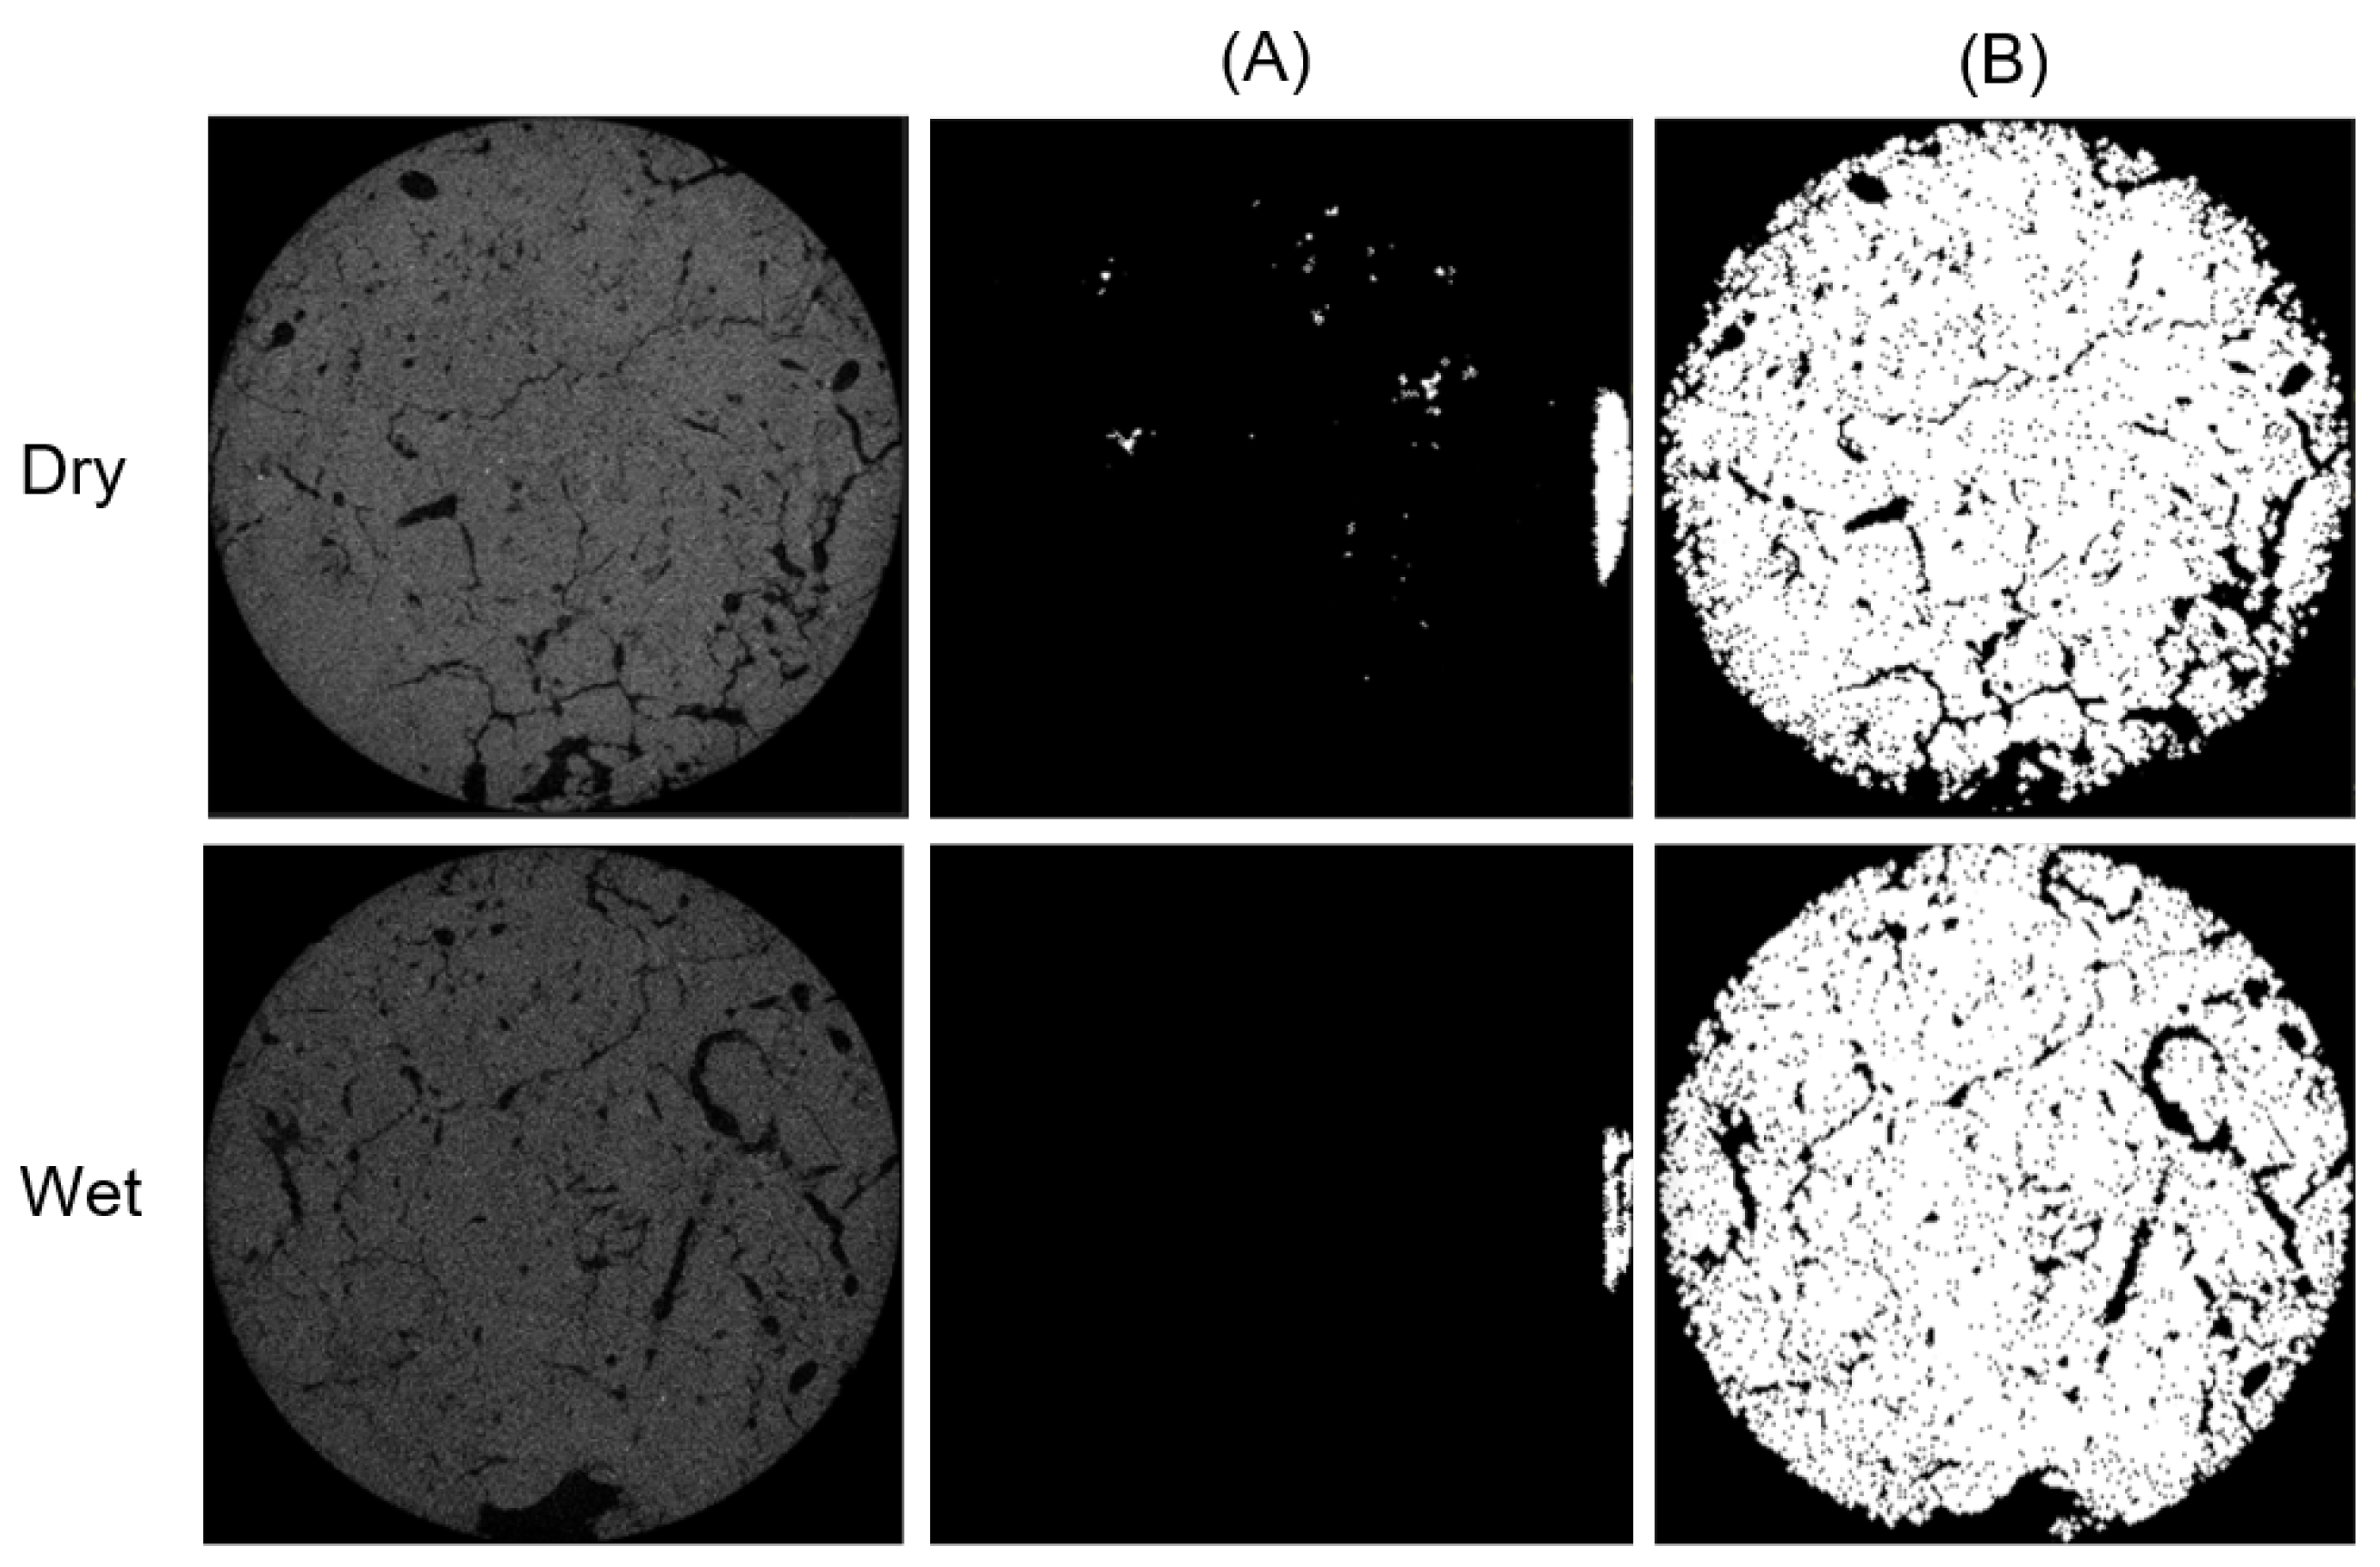
3.4. Experiments with the SLPA Dataset
4. Discussion
5. Conclusions and Future Works
Author Contributions
Funding
Data Availability Statement
Acknowledgments
Conflicts of Interest
References
- Houston, A.N.; Otten, W.; Falconer, R.; Monga, O.; Baveye, P.C.; Hapca, S.M. Quantification of the pore size distribution of soils: Assessment of existing software using tomographic and synthetic 3D images. Geoderma 2017, 299, 73–82. [Google Scholar] [CrossRef]
- Ivonin, D.; Kalnin, T.; Grachev, E.; Shein, E. Quantitative analysis of pore space structure in dry and wet soil by integral geometry methods. Geosciences 2020, 10, 365. [Google Scholar] [CrossRef]
- Kerloch, E.; Michel, J.C. Pore tortuosity and wettability as main characteristics of the evolution of hydraulic properties of organic growing media during cultivation. Vadose Zone J. 2015, 14, 1–7. [Google Scholar] [CrossRef]
- Cejas, C.M.; Hough, L.A.; Beaufret, R.; Castaing, J.C.; Frétigny, C.; Dreyfus, R. Preferential Root Tropisms in 2D Wet Granular Media with Structural Inhomogeneities. Sci. Rep. 2019, 9, 14195. [Google Scholar] [CrossRef]
- Freddi, O.d.S.; Centurion, J.F.; Beutler, A.N.; Aratani, R.G.; Leonel, C.L. Compactação do solo no crescimento radicular e produtividade da cultura do milho. Rev. Bras. Ciênc. Solo 2007, 31, 627–636. [Google Scholar] [CrossRef]
- Al-Marzouqi, H. Digital rock physics: Using CT scans to compute rock properties. IEEE Signal Process. Mag. 2018, 35, 121–131. [Google Scholar] [CrossRef]
- Andrä, H.; Combaret, N.; Dvorkin, J.; Glatt, E.; Han, J.; Kabel, M.; Keehm, Y.; Krzikalla, F.; Lee, M.; Madonna, C.; et al. Digital rock physics benchmarks—Part I: Imaging and segmentation. Comput. Geosci. 2013, 50, 25–32. [Google Scholar] [CrossRef]
- Schindelin, J.; Rueden, C.T.; Hiner, M.C.; Eliceiri, K.W. The ImageJ ecosystem: An open platform for biomedical image analysis. Mol. Reprod. Dev. 2015, 82, 518–529. [Google Scholar] [CrossRef]
- Comet Technologies Canada Inc. Dragonfly 2022.2 [Computer Software]. 2022. Available online: https://dragonfly.comet.tech/ (accessed on 23 December 2024).
- Mandal, P.P.; Rezaee, R. Facies classification with different machine learning algorithm–An efficient artificial intelligence technique for improved classification. ASEG Ext. Abstr. 2019, 2019, 1–6. [Google Scholar] [CrossRef]
- Liu, X.; Chandra, V.; Ramdani, A.I.; Zuhlke, R.; Vahrenkamp, V. Using deep-learning to predict Dunham textures and depositional facies of carbonate rocks from thin sections. Geoenergy Sci. Eng. 2023, 227, 211906. [Google Scholar] [CrossRef]
- Dantas, A.; Vidal, A.; Soares, J.; Medeiros, L. Petrofísica Computacional Aplicada a Analise da Tortuosidade de Rochas Carbonáticas. In Proceedings of the VII Simpósio Brasileiro de Geofísica, SBGf, Ouro Preto, MG, Brazil, 25–27 October 2016. [Google Scholar]
- Chawshin, K.; Berg, C.F.; Varagnolo, D.; Lopez, O. Automated porosity estimation using CT-scans of extracted core data. Comput. Geosci. 2022, 26, 595–612. [Google Scholar] [CrossRef]
- dos Anjos, C.E.M.; de Matos, T.F.; Avila, M.R.V.; Fernandes, J.d.C.V.; Surmas, R.; Evsukoff, A.G. Permeability estimation on raw micro-CT of carbonate rock samples using deep learning. Geoenergy Sci. Eng. 2023, 222, 211335. [Google Scholar] [CrossRef]
- Da Wang, Y.; Shabaninejad, M.; Armstrong, R.T.; Mostaghimi, P. Deep neural networks for improving physical accuracy of 2D and 3D multi-mineral segmentation of rock micro-CT images. Appl. Soft Comput. 2021, 104, 107185. [Google Scholar] [CrossRef]
- Ronneberger, O.; Fischer, P.; Brox, T. U-net: Convolutional networks for biomedical image segmentation. In Proceedings of the Medical Image Computing and Computer-Assisted Intervention—MICCAI 2015: 18th International Conference, Munich, Germany, 5–9 October 2015; pp. 234–241. [Google Scholar]
- He, K.; Zhang, X.; Ren, S.; Sun, J. Deep residual learning for image recognition. In Proceedings of the IEEE Conference on Computer Vision and Pattern Recognition, Las Vegas, NV, USA, 27–30 June 2016; pp. 770–778. [Google Scholar]
- Yu, Q.; Xiong, Z.; Du, C.; Dai, Z.; Soltanian, M.R.; Soltanian, M.; Yin, S.; Liu, W.; Liu, C.; Wang, C.; et al. Identification of rock pore structures and permeabilities using electron microscopy experiments and deep learning interpretations. Fuel 2020, 268, 117416. [Google Scholar] [CrossRef]
- Marques, V.G.; da Silva, L.R.; Carvalho, B.M.; de Lucena, L.R.; Vieira, M.M. Deep learning-based pore segmentation of thin rock sections for aquifer characterization using color space reduction. In Proceedings of the 2019 International Conference on Systems, Signals and Image Processing (IWSSIP), Osijek, Croatia, 5–7 June 2019; pp. 235–240. [Google Scholar]
- Badrinarayanan, V.; Kendall, A.; Cipolla, R. Segnet: A deep convolutional encoder-decoder architecture for image segmentation. IEEE Trans. Pattern Anal. Mach. Intell. 2017, 39, 2481–2495. [Google Scholar] [CrossRef]
- Zhao, H.; Jia, J.; Koltun, V. Exploring self-attention for image recognition. In Proceedings of the IEEE/CVF Conference on Computer Vision and Pattern Recognition, Seattle, WA, USA, 13–19 June 2020; pp. 10076–10085. [Google Scholar]
- Gonçalves, T.; Rio-Torto, I.; Teixeira, L.F.; Cardoso, J.S. A survey on attention mechanisms for medical applications: Are we moving toward better Algorithms? IEEE Access 2022, 10, 98909–98935. [Google Scholar] [CrossRef]
- Koeshidayatullah, A.; Ferreira-Chacua, I.; Li, W. Is attention all geosciences need? Advancing quantitative petrography with attention-based deep learning. Comput. Geosci. 2023, 181, 105466. [Google Scholar] [CrossRef]
- Song, M.; Zhao, Y.; Zhao, Y.; Han, Q. ACFTransUNet: A new multi-category soil pores 3D segmentation model combining Transformer and CNN with concentrated-fusion attention. Comput. Electron. Agric. 2024, 225, 109312. [Google Scholar] [CrossRef]
- Woo, S.; Park, J.; Lee, J.Y.; Kweon, I.S. Cbam: Convolutional block attention module. In Proceedings of the European Conference on Computer Vision (ECCV), Munich, Germany, 8–14 September 2018; pp. 3–19. [Google Scholar]
- Wang, Y.; Li, Y.; Wang, G.; Liu, X. Multi-scale attention network for single image super-resolution. In Proceedings of the IEEE/CVF Conference on Computer Vision and Pattern Recognition, Seattle, WA, USA, 16–22 June 2024; pp. 5950–5960. [Google Scholar]
- Hara, K.; Saito, D.; Shouno, H. Analysis of function of rectified linear unit used in deep learning. In Proceedings of the 2015 International Joint Conference on Neural Networks (IJCNN), Killarney, Ireland, 12–17 July 2015; pp. 1–8. [Google Scholar]
- Oktay, O.; Schlemper, J.; Folgoc, L.L.; Lee, M.; Heinrich, M.; Misawa, K.; Mori, K.; McDonagh, S.; Hammerla, N.Y.; Kainz, B.; et al. Attention u-net: Learning where to look for the pancreas. arXiv 2018, arXiv:1804.03999. [Google Scholar]
- Li, W.; Wu, J.; Chen, H.; Wang, Y.; Jia, Y.; Gui, G. Unet combined with attention mechanism method for extracting flood submerged range. IEEE J. Sel. Top. Appl. Earth Obs. Remote Sens. 2022, 15, 6588–6597. [Google Scholar] [CrossRef]
- Su, H.; Wang, X.; Han, T.; Wang, Z.; Zhao, Z.; Zhang, P. Research on a U-Net bridge crack identification and feature-calculation methods based on a CBAM attention mechanism. Buildings 2022, 12, 1561. [Google Scholar] [CrossRef]
- Dauphin, Y.N.; Fan, A.; Auli, M.; Grangier, D. Language modeling with gated convolutional networks. In Proceedings of the International Conference on Machine Learning, PMLR, Sydney, Australia, 6–11 August 2017; pp. 933–941. [Google Scholar]
- Wang, W.; Xie, E.; Li, X.; Fan, D.P.; Song, K.; Liang, D.; Lu, T.; Luo, P.; Shao, L. Pvt v2: Improved baselines with pyramid vision transformer. Comput. Vis. Media 2022, 8, 415–424. [Google Scholar] [CrossRef]
- Hua, W.; Dai, Z.; Liu, H.; Le, Q. Transformer quality in linear time. In Proceedings of the International Conference on Machine Learning, PMLR, Baltimore, MD, USA, 17–23 July 2022; pp. 9099–9117. [Google Scholar]
- Fernandes, C.; Santos, L.; Philippi, P.; Bueno, A.; Rodrigues, C.; Gaspari, H. Predição de propriedades petrofísicas de rochas reservatório de petróleo a partir de análise de imagens. In Proceedings of the 1º Congresso Brasileiro de P&D em Petróleo e Gás, UFRN–SBQ Regional RN, Natal, RN, Brazil, 25–28 November 2001. [Google Scholar]
- Zhang, Y.; Yang, Z.; Wang, F.; Zhang, X. Comparison of soil tortuosity calculated by different methods. Geoderma 2021, 402, 115358. [Google Scholar] [CrossRef]
- Chollet, F. Keras. 2015. Available online: https://keras.io (accessed on 8 December 2024).
- Müller, D.; Soto-Rey, I.; Kramer, F. Towards a guideline for evaluation metrics in medical image segmentation. BMC Res. Notes 2022, 15, 210. [Google Scholar] [CrossRef] [PubMed]
- Javaheri, I.; Sundararaghavan, V. Polycrystalline microstructure reconstruction using Markov random fields and histogram matching. Comput.-Aided Des. 2020, 120, 102806. [Google Scholar] [CrossRef]
- Sinha, A.; Dolz, J. Multi-scale self-guided attention for medical image segmentation. IEEE J. Biomed. Health Inform. 2020, 25, 121–130. [Google Scholar] [CrossRef]
- Hou, Q.; Zhou, D.; Feng, J. Coordinate attention for efficient mobile network design. In Proceedings of the IEEE/CVF Conference on Computer Vision and Pattern Recognition, Nashville, TN, USA, 20–25 June 2021; pp. 13713–13722. [Google Scholar]
- Tan, M.; Le, Q. EfficientNet: Rethinking Model Scaling for Convolutional Neural Networks. In Proceedings of the 36th International Conference on Machine Learning (ICML 2019), Long Beach, CA, USA, 9–15 June 2019; pp. 6105–6114. [Google Scholar]
- Dosovitskiy, A.; Beyer, L.; Kolesnikov, A.; Weissenborn, D.; Zhai, X.; Unterthiner, T.; Dehghani, M.; Minderer, M.; Heigold, G.; Gelly, S.; et al. An image is worth 16x16 words: Transformers for image recognition at scale. arXiv 2020, arXiv:2010.11929. [Google Scholar]
- Yue, Y.; Li, Z. Medmamba: Vision mamba for medical image classification. arXiv 2024, arXiv:2403.03849. [Google Scholar]


| Method | Dice | IoU |
|---|---|---|
| U-Net | 0.9896 | 0.9818 |
| GSAU | 0.9907 | 0.9819 |
| CBAM | 0.9910 | 0.9824 |
| Proposed Method | 0.9910 | 0.9825 |
| Method | Dice | IoU | Best Dice | Worst Dice |
|---|---|---|---|---|
| CBAM | 0.9907 ± 0.0006 | 0.9819 ± 0.0014 | 0.9913 | 0.9900 |
| Proposed Method | 0.9910 ± 0.0004 | 0.9823 ± 0.0008 | 0.9915 | 0.9906 |
| Sample | Porosity (%) | Tortuosity |
|---|---|---|
| Ground-truth | 17.65 | 0.1473 |
| Proposed Method | 13.21 | 0.1509 |
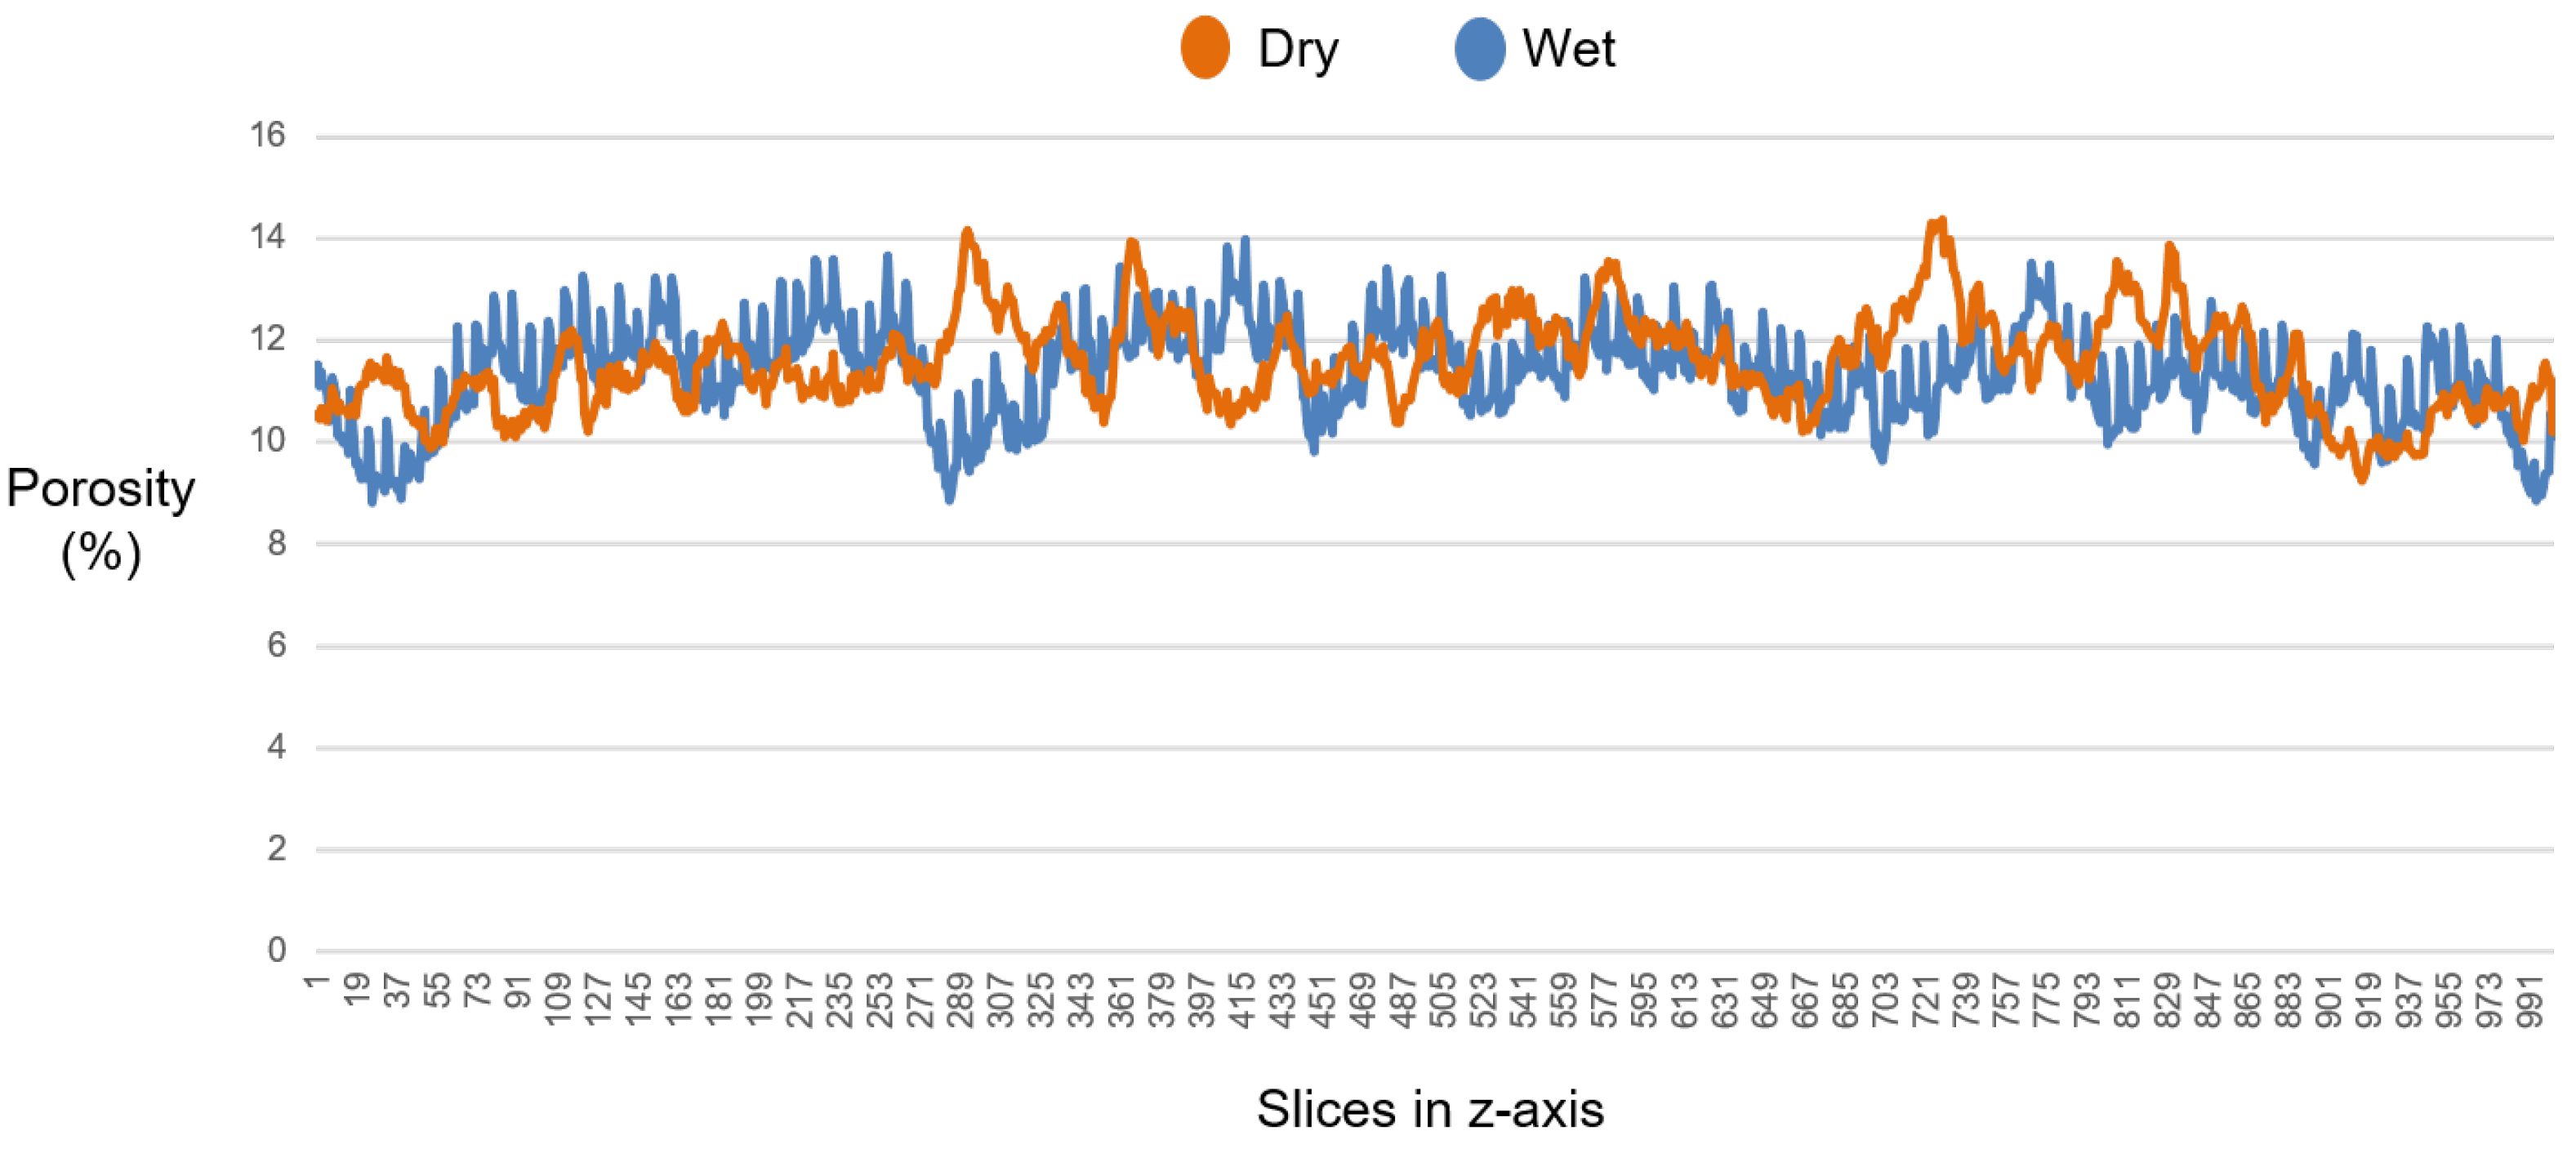
| SLPA Sample | Porosity | Tortuosity |
|---|---|---|
| Dry | 11.55 | 0.1224 |
| Wet | 11.35 | 0.1388 |
Disclaimer/Publisher’s Note: The statements, opinions and data contained in all publications are solely those of the individual author(s) and contributor(s) and not of MDPI and/or the editor(s). MDPI and/or the editor(s) disclaim responsibility for any injury to people or property resulting from any ideas, methods, instructions or products referred to in the content. |
© 2025 by the authors. Licensee MDPI, Basel, Switzerland. This article is an open access article distributed under the terms and conditions of the Creative Commons Attribution (CC BY) license (https://creativecommons.org/licenses/by/4.0/).
Share and Cite
Silva, I.F.S.d.; Araújo, A.d.C.; Almeida, J.D.S.d.; Paiva, A.C.d.; Silva, A.C.; Roehl, D. Soil Structure Analysis with Attention: A Deep-Learning-Based Method for 3D Pore Segmentation and Characterization. AgriEngineering 2025, 7, 27. https://doi.org/10.3390/agriengineering7020027
Silva IFSd, Araújo AdC, Almeida JDSd, Paiva ACd, Silva AC, Roehl D. Soil Structure Analysis with Attention: A Deep-Learning-Based Method for 3D Pore Segmentation and Characterization. AgriEngineering. 2025; 7(2):27. https://doi.org/10.3390/agriengineering7020027
Chicago/Turabian StyleSilva, Italo Francyles Santos da, Alan de Carvalho Araújo, João Dallyson Sousa de Almeida, Anselmo Cardoso de Paiva, Aristófanes Corrêa Silva, and Deane Roehl. 2025. "Soil Structure Analysis with Attention: A Deep-Learning-Based Method for 3D Pore Segmentation and Characterization" AgriEngineering 7, no. 2: 27. https://doi.org/10.3390/agriengineering7020027
APA StyleSilva, I. F. S. d., Araújo, A. d. C., Almeida, J. D. S. d., Paiva, A. C. d., Silva, A. C., & Roehl, D. (2025). Soil Structure Analysis with Attention: A Deep-Learning-Based Method for 3D Pore Segmentation and Characterization. AgriEngineering, 7(2), 27. https://doi.org/10.3390/agriengineering7020027