Abstract
This study aims to enhance the efficiency of mechanized sugarcane (Saccharum spp.) harvesting by optimizing the maneuvers of the auxiliary vehicle (infield wagon) operating in tandem with the harvester. The optimization focuses on increasing productivity and reducing soil compaction in high-traffic maneuver areas. A comprehensive three-year experimental study was conducted in agricultural fields at a Brazilian mill, where extensive field data and economic parameters were collected to simulate and compare maneuvering techniques on both flat and sloped terrain. To evaluate the synchronization between the harvester and the infield wagon under non-optimized scenarios, a Maneuver Simultaneity Index (MSI) was developed. The results demonstrated that the optimized “P-optimized” technique, which utilizes dedicated maneuvering spaces, significantly increased economic returns per hour worked by reducing maneuver times across various terrain types. Additionally, fuel consumption decreased with the adoption of the optimized maneuver pattern, leading to lower operational costs and reduced environmental impact. These findings highlight the economic and operational feasibility of optimizing maneuver patterns, particularly in flat areas, and provide a sustainable framework adaptable for improving efficiency and productivity in diverse mechanized agricultural operations.
1. Introduction
Sugarcane is a primary raw material for sugar and ethanol production, playing a crucial role in the agricultural economy, particularly in Brazil, the world’s largest producer of this biofuel. The growing global demand for biofuels has driven significant investments in advanced cultivation practices and mechanized harvesting technologies [1,2]. However, the transition to mechanization has introduced new challenges, particularly in managing environmental impacts and improving operational efficiency.
Until 2014, sugarcane harvesting in Brazil was predominantly manual, requiring the pre-burning of biomass before cutting and transporting it to mills and distilleries. Due to the environmental consequences of this practice, São Paulo State Law 11.241/2002 mandated the complete elimination of sugarcane burning in mechanizable areas by 2014 and in sloped areas by 2021 [3,4]. The shift toward mechanized harvesting brought new operational challenges, especially in sloped terrain, where the increasing size and weight of machinery contribute to soil compaction—a growing concern in precision agriculture [5].
Field efficiency, also known as harvesting efficiency, is a critical metric of machine performance during field operations. It is defined as the ratio between actual machine productivity under working conditions and its maximum theoretical productivity [6]. Although agricultural machines are capable of high performance in terms of work rate and quality, they do not operate continuously on the intended task, which negatively impacts harvesting efficiency. Significant downtime occurs during headland maneuvers, where machines reposition and change crop lines. Reducing these non-productive times is essential to lowering production costs [7,8].
Precision agriculture tools for route optimization have advanced significantly. Various studies have explored redesigning field routes, adjusting vehicle sizes, minimizing tractor turning radius, automating headland maneuvers in grain crops, and modifying maneuver patterns [8,9,10,11]. However, for enhanced harvesting efficiency, route optimization becomes even more crucial when multiple machines operate in tandem. This is especially true in sugarcane harvesting, where self-propelled harvesters work alongside an auxiliary vehicle—the infield wagon—consisting of tractors towing one or more wagons to receive the harvested cane [12].
Traditionally, route planning and field efficiency studies have focused on the harvester, considered the primary machine in the operation. Ref. [13] emphasizes the importance of harvester route planning, noting that these machines require 1.5 to 2 min to maneuver and reposition within sugarcane rows. A mathematical model was proposed to optimize harvester routes and reduce maneuvering time, achieving a 31.64% reduction in harvester maneuver times compared to unplanned routes [3].
In mechanized sugarcane harvesting, however, the infield wagon typically requires more time to complete headland maneuvers than the harvester [14,15]. Consequently, the auxiliary vehicle often determines the return time to active harvesting rather than the harvester itself. Ref. [8] developed a model for infield wagon maneuvering patterns to estimate turnaround time, space requirements, and maneuvering costs in mechanized operations, calculating a maneuvering cost of USD 98.9 per hectare. This substantial cost highlights the importance of efficient maneuvering techniques.
Despite progress in route optimization, existing studies often lack models that account for the interdependent relationship between harvesters and infield wagons. This relationship involves variations in machine configurations, speeds, turning types, and interactions with field variability—factors essential for achieving realistic and effective operational outcomes.
This research aims to present an integrated optimization approach for infield wagon maneuvering in conjunction with the harvester, targeting increased field efficiency and reduced soil compaction in maneuvering areas. This strategy seeks to deliver both economic and environmental benefits to the sugarcane agro-industry. To evaluate the economic feasibility of the proposed optimization technique compared to conventional methods, a comprehensive three-year experimental study was conducted at a Brazilian mill. Field data and economic parameters were collected for simulations on flat and sloped terrain, providing a detailed analysis of the operational efficiency and economic viability of the optimized maneuvering approach.
2. Materials and Methods
2.1. The Sugarcane Harvesting Operation and the New Optimized Maneuvering Approach: An Overview
In mechanized sugarcane harvesting operations, the harvester and infield wagon work side by side. When the wagon reaches its maximum raw material capacity, it moves to a point outside the cultivation area, where the harvested material is transferred to a sugarcane truck that transports it to an industrial processing unit. If the wagon has not reached its full capacity when it leaves the sugarcane row, the mechanized set maneuvers at the roads and field borders before returning to the adjacent harvest row [16,17].
According to [7], some types of maneuvers are easily performed, while others result in lower average speeds due to factors such as operator skill, available space, minimum turning radius of machines, operating width, the presence of implements, and cultivation spacing. These authors identified the most common maneuver types for agricultural machinery operating in a headland pattern across various crops (Figure 1).
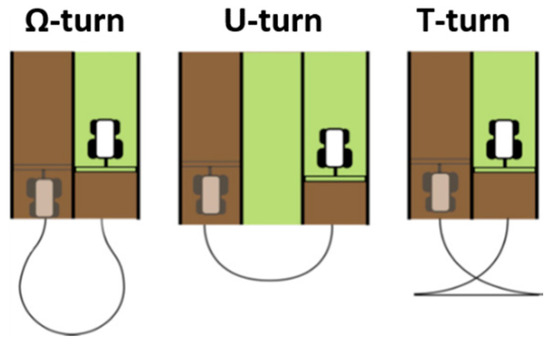
Figure 1.
Maneuvers in headland turns. Adapted from [7].
Loop turns (Ω-turn and U-turn) are faster because the machine moves at a constant forward speed until it aligns with the adjacent row. The Ω-turn requires more space than the U-turn for maneuvering. In contrast, reverse turns (T-turn) require less space but take more time, as the machine moves forward transversely, then reverses to align with the next row. This maneuver involves two stop times: before and after reversing [7,8].
Sugarcane harvesters commonly perform reverse turns because the limited space within the carrier and the type of wheels used impose kinematic restrictions that make continuous loop movements (Ω-turn and U-turn) impractical and potentially damaging to the machinery.
For infield wagons—the focus of this study—the type of maneuver depends on the number of wagons being transported. According to [18], using a single-wagon unit (14 tons) can create logistical inefficiencies, raising production costs if a single wagon cannot meet the industry’s raw material demand. Conversely, using more than two wagons can create operational difficulties, affecting visibility and alignment. As a result, double-wagon carriers are the most common configuration in sugarcane mills. However, their turning radius is often incompatible with the available space, leading to a distinct maneuvering pattern.
In the conventional double-wagon maneuver, while the harvester performs its maneuver within the available carrier space, the tractor and double-wagon carrier must extend into the preharvest field border to complete the turn and return to the adjacent cane row (Figure 2A).
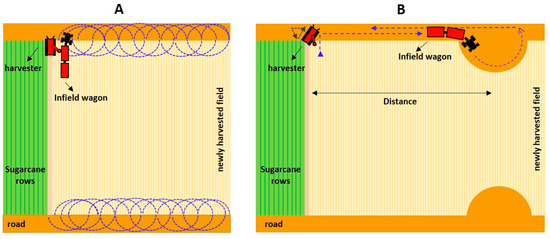
Figure 2.
(A) Conventional infield wagon maneuver. (B) P-Optimized maneuver.
It is important to note that sugarcane is a semi-perennial crop that regrows ratoons after the initial harvest, allowing multiple harvests from a single planting before replanting is necessary. The repeated traffic of agricultural machinery between crop rows and along the newly harvested borders causes soil and plant damage, reducing the longevity and productivity of sugarcane [19]. In particular, the traffic of infield wagons along the field boundaries during maneuvers across successive seasons leads to significant soil compaction and ratoon damage, resulting in lower yields in these areas compared to the field center, where maneuvering does not occur.
In some situations, a more advanced maneuvering strategy may be implemented, where the machine travels a certain distance before performing the maneuver in a designated space (Figure 2B). This maneuver pattern, referred to as the P-turn by [8], is named for its geometric shape in the field. However, the authors note that even when the infield wagon is positioned near the dedicated maneuvering space, P-turn maneuvers are the most time-consuming.
These maneuvers are designed to mitigate soil compaction along the entire length of the field borders seen in conventional patterns. However, while maneuvering within dedicated spaces reduces border compaction, the repeated, concentrated passes in these specific areas lead to more intense but localized impacts on sugarcane production.
The infield wagon maneuvers performed in designated maneuvering spaces are the focus of this study, referred to as P-optimized maneuvers. The optimization strategy aims to eliminate the unproductive time the harvester spends waiting for the infield wagon to complete its maneuver, thereby enhancing harvesting efficiency. This technique involves executing a P-turn maneuver within dedicated spaces, but in a manner where the infield wagon’s maneuvering time is synchronized with that of the harvester. In other words, the total time the harvester requires to complete its maneuver on the road is treated as the maximum allowable time for the infield wagon to traverse the road, execute its maneuver in the designated space, and return to a position parallel to the harvester. The key challenge this optimization seeks to address is determining the ideal field distance for installing the maneuvering spot—referred to as the optimal maneuvering spot—where the harvester and infield wagon can maneuver simultaneously.
The optimal maneuvering spot is calculated using the average velocity formula (Velocity = Displacement/Time), where the position of the machines relative to the maneuvering spot is defined by their distance as a function of time (specifically, the harvester’s maneuvering time). This time is directly influenced by variations in speed, in this case, the infield wagon’s displacement speed. Ref. [20] applied a similar optimization approach for unmanned aerial vehicle (UAV) flight trajectories, using variable and constant speeds to minimize maneuvering time, achieve optimal timing, and avoid collisions.
In addition to operational variables, several field-specific factors, including terrain slope, field width, cultivation spacing, and carrier conditions, can affect the dynamics and configuration of this maneuvering pattern. To apply and compare the performance of the P-optimized maneuver against the conventional maneuver, field data (Section 2.2) were integrated with economic parameters and used as inputs in mathematical models implemented in Microsoft Excel™ spreadsheet simulations (Section 2.3). This analysis aimed to address the following research questions:
- i.
- Which maneuvering technique (Conventional or P-optimized) has the greatest impact on sugarcane production due to machine trampling?
- ii.
- Are there significant differences in fuel consumption between the evaluated techniques?
- iii.
- What is the relationship between the infield wagon’s displacement speed (in the P-optimized maneuver) and field productivity?
- iv.
- Is there a limit to the number of maneuvering spots for the P-optimized technique to remain economically viable?
- v.
- How does the economic performance of the evaluated maneuver patterns differ between flat and sloped areas?
2.2. Experimental Study
The experiment was conducted in commercial sugarcane fields of a mill located in the state of São Paulo, Brazil, over three consecutive harvest seasons from 2017 to 2020, allowing for the collection of substantial machine field time data. The area is situated at an average altitude of 660 m. According to the Köppen classification, the region’s climate is classified as Cwa, a humid subtropical climate [21].
The study was carried out in various systematized areas of the mill. Two experimental conditions were considered: areas with a 5% slope (flat terrain) and areas with a 12% slope (sloping terrain). A 12% slope was selected for this research because, beyond this level, the harvester requires lateral component adjustments to prevent tipping, significantly affecting harvesting efficiency—an adjustment unnecessary in flatter areas. Slope measurements were taken using 15 points evenly spaced 10 m apart along the road, with an angle and inclination measurement application, Clinometer 1.5.1.
Field tests were conducted to assess the influence of different soil types on maneuvering times. However, since maneuvers are performed on the carrier road, which is highly compacted due to heavy machine and truck traffic, no significant differences in times were observed. Therefore, soil type was not considered a variable in this study.
In the experimental plots, maneuver times were recorded for mechanized harvesting systems composed of a sugarcane harvester and a tractor pulling an infield wagon. Timing began when the harvester, upon reaching the end of a sugarcane row, raised its elevator component and initiated the maneuver. The maneuvering period ended when each machine was repositioned in the next sugarcane row, ready to resume harvesting. The carrier road used for maneuvers was 6 m wide.
The harvesters, with 358 hp engines, were equipped with autopilot systems, monitors, and cabins featuring transmission and directional joysticks. The tractors, with 172 kW (235 hp) engines, hauled double-wagon carriers. Each infield wagon had a volumetric capacity of 33 m3 and a load capacity of 14,000 kg.
The time and motion study focused on comparing two infield wagon maneuvering techniques: the conventional maneuver and the P-optimized maneuver. While the harvester followed the same maneuvering pattern in both techniques, variations occurred due to differences in terrain slope.
2.2.1. Harvester Maneuver
During the collection of harvester maneuver times in both flat and sloping experimental areas, an unusual maneuvering pattern was observed. This pattern, referred to as a sudden maneuver or intermittent harvester maneuver, was analyzed alongside other evaluated maneuver patterns (Table 1) and is introduced in this research as part of a comprehensive study.

Table 1.
Description of harvester maneuvering techniques performed.
2.2.2. Conventional Infield Wagon Maneuver
The times and motions of the conventional infield wagon maneuver were analyzed. This maneuver is performed immediately parallel to the harvester. When leaving the cane row, the vehicle initially performs its maneuver on the carrier, entering the newly harvested field for a distance of 15.5 m until it completes its turn and repositions next to the harvester (Figure 3A,B). The maneuver was performed at 9 km h−1 with 1900 rpm, in both flat and sloping areas. This speed is recommended by the mill when adopting this maneuver pattern.
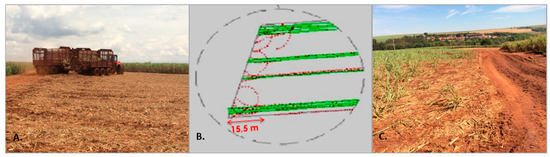
Figure 3.
(A) Infield wagon maneuvering over a newly harvested field. (B) Illustration of the infield wagon passes on the border generated by the tractor autopilot. (C) Borders showing low productivity after re-growth.
The infield wagon traffic in a transverse direction over the sugarcane rows during the maneuvers results in spiral-shaped demarcations of the infield wagon passes after harvesting. This practice leads to a decrease in productivity in these areas (Figure 3C). According to studies conducted by the company, the TCH (tons of sugarcane per hectare) in the field border area, affected by infield wagon passes, is 26% lower than the TSH (tons of sugarcane per hectare) in the center of the field, where there are no maneuvers. Yield analysis was performed over 5 cultivation cycles, with samples of sugarcane culms collected both from the borders and central areas of the field. The samples were weighed using a wagon equipped with a load cell to obtain the average productivity (kg ha−1) and assess the reduction in productivity in the field borders compared to the central area.
Statistical Process Control (SPC)
The variability of harvester and infield wagon maneuver time data observed for the conventional technique was analyzed using the Control Charts tool of Statistical Process Control (SPC). The analyses were performed with the aid of the Minitab® program 17.1.0.
SPC tools, commonly used in industrial processes, have also been applied in agricultural operations as they allow the identification of patterns throughout a process or operation at the moment when an instability occurs, enabling preventive monitoring. Regular monitoring of a process makes its behavior more predictable, facilitating the identification and improvement of weak points.
Control charts are time graphs that display the measurement values of the variable of interest on the ordinate axis and the sample points on the abscissa axis, representing measurements over time. The charts have three lines: the centerline representing the overall average, and the upper (UCL) and lower control limits (LCL), calculated based on the mean plus or minus the standard deviation for UCL and LCL, respectively [22], as expressed by Equations (1) and (2):
where:
- UCL: upper control limit;
- LCL: lower control limit;
- : mean of the variable;
- σ: standard deviation.
Points on the chart that fall outside the upper and lower control limits represent special causes of variation that may be causing process instability.
Maneuver Simultaneity Index (MSI)
Since this maneuvering technique does not incorporate a time optimization approach, we developed an index to obtain the percentage of simultaneity between the maneuvers of the mechanized assemblies. The Agricultural Machinery Maneuver Simultaneity Index (MSI), which may be applicable to other crops that use interdependent agricultural machines, was applied here to comparatively evaluate the differences between harvester and infield wagon maneuver times under varying terrain slope conditions.
The maneuver simultaneity index is expressed by Equation (3):
where:
- MSI: simultaneity index between machine maneuvers in field operation (%); Tmin A: maneuver time first completed by a given machine (s); and Tmax B: machine maneuver time accompanying machine A (s).
2.2.3. P-Optimized Maneuver
Regarding this technique, the maneuver times vary mainly according to the displacement speed of the infield wagon in the carrier, ranging from 9 to 35 km h−1. The time evaluations were conducted through the simulation of scenarios (Section 2.3). In practice, the displacement speed used depends on the condition of the carrier and is known to the harvest manager.
In the experimental study, parameters related to the maneuvering spots were measured and surveyed, as well as the time taken by the infield wagon to perform its turn inside them. The maneuvering spots installed for testing in the experimental areas of the mill were semi-elliptical (Figure 4A), with the major half-axis measuring 33 m and the minor half-axis measuring 15.5 m, compatible with the infield wagon turning radius of 10.5 m (Figure 4B) and occupying an area of 401.7 m2 (0.04 ha). The average time the infield wagon took to maneuver through the maneuvering spots was 18 s.
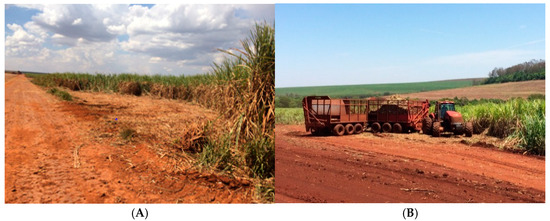
Figure 4.
(A) Maneuvering spot. (B) Infield wagon maneuvering at the turning spot.
By conjecture in this research, productivity was considered null at the maneuver spots, as these locations receive repeated infield wagon maneuvers.
2.3. Case Study
2.3.1. Simulation of Infield Wagon Maneuvering Techniques
To support the simulation of the evaluated maneuver patterns (conventional and P-optimized), a systematized trapezoidal area of 87.72 ha was selected. The area was 936 m wide and 584,800 linear meters long, with an average TCH of 93.63 (tons of sugarcane per hectare). The cultivation spacing was 1.5 m, which was used to estimate the number of sugarcane rows (and therefore the number of maneuvers) in the area, totaling 624 cultivation rows. For each row, the maneuvering time and the fuel consumption of the machines were calculated. The total time of the mechanized harvesting operation was also calculated, as well as the impact of each maneuvering technique on the final production of the selected field for the simulation. These calculations served as a basis for the comparative analysis of economic viability and are described in detail in Section 2.3.2.
The simulation of the conventional infield wagon maneuver considered two terrain slope scenarios: flat (S < 12%) and sloped (S > 12%), with only one maneuver speed scenario of 9 km h−1. As the maneuvers are performed at the same speed throughout the harvesting operation, the same pattern of time and fuel consumption is maintained for all cultivation rows in the field.
For the optimized proposal performed at maneuvering spots, which covers the displacement of the infield wagon by the carrier, additional displacement speed scenarios of 10, 15, 20, 25, 30, and 35 km h−1 were considered. Fluctuations in infield wagon speeds were not considered, as agricultural machines often use constant engine acceleration. The pseudocode for the practical application of the P-optimized maneuvering approach in a computer simulation program is described and illustrated below (Figure 5):
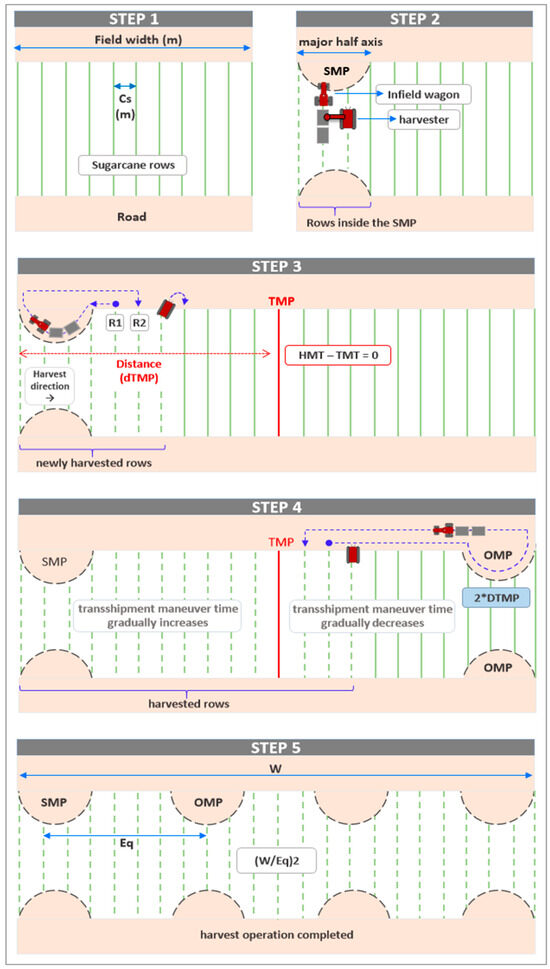
Figure 5.
Steps to implement P-optimized maneuver technique.
(Step 1) → Insert the number of rows in the field: Based on the relationship between the width of the field and the cultivation spacing (cs), the number of cultivation lines (equivalent to the number of maneuvers) is expressed, which will be inserted into the electronic spreadsheet to simulate the harvesting operation.
(Step 2) → Count the number of lines from the Starting Maneuver Point (SMP): In practice, the first maneuvers of machines are carried out at a maneuvering spot installed at the beginning of the field. The number of rows covering the SMP is expressed by the relationship between the length of the semi-major axis of the maneuvering spot and the cultivation spacing. The maneuver time in these rows is the time the infield wagon takes to complete its turn inside the SMP, not involving vehicle displacement on the road.
(Step 3) → Determine the theoretical maneuvering point (TMP): In the first sugarcane row (r1) occurring outside the SMP, the infield wagon begins to perform its full P-optimized maneuver, which consists of leaving r1, moving to the SMP, executing the maneuver inside it, and returning to the adjacent harvest line (r2), and so on for all rows. In the sugarcane rows close to the SMP, the infield wagon maneuver is faster than the harvester maneuver. As the harvesting operation progresses and the mechanized set moves away from the SMP, the infield wagon maneuver time gradually increases. The theoretical maneuvering point (TMP) is the distance or conceptual position in the field where the infield wagon maneuver time equals the harvester time (with a simultaneity index of 100%), theoretically indicating the ideal position for the installation of an optimal maneuvering spot. From this position, the harvester would stop waiting for the return of the infield wagon, impairing harvesting efficiency. To determine the TMP, it is necessary to condition the infield wagon maneuver time to the harvester maneuver time for each row in the computer system and identify the position where the maneuver times are equal (HMT − IWMT = 0).
(Step 3.a) → Harvester maneuver time (HMT): The HMT can vary according to terrain characteristics. It has an average time value for flat areas (slope < 12%) and a different value for sloped areas (slope > 12%). Once the terrain slope condition is designated as an input parameter, this maneuver time value remains constant for all harvest rows.
(Step 3.b) → Infield wagon maneuver time (IWMT): Involving the speed of displacement by the carrier to the maneuvering spots and the variation of the relative distance to them, the IWMT varies from row to row. The calculation is expressed by Equation (4).
where:
IWMT= (((nr × Cs × 2 + Cs)/(V × 1000)) × 3600) + Tt
- V: infield wagon displacement speed (km h−1); Tt: turning time at the maneuvering spot (s); nr: number of sugarcane rows to maneuvering spot (reference system); Cs: space cultivation (m).
(Step 4) → Identify the optimal maneuvering point (OMP): In practice, it is recommended that the OMP be installed at twice the distance of the TMP (2 * dTMP). Adopting this practice, the inverse process described in step 3 occurs, where the infield wagon maneuver time increases gradually as the mechanized set moves away from the SMP. Upon reaching the TMP, the infield wagon maneuver time gradually decreases as the mechanized set approaches the OMP. This avoids the installation of excess maneuver spots in the field, benefiting productivity without interfering with harvesting efficiency. Both during the process of increasing infield wagon maneuver time (from SMP to TMP) and the descending process (from TMP to OMP), the infield wagon maneuver time does not exceed the harvester maneuver time. As a result, the harvester is never stopped in unproductive time waiting for the completion of the auxiliary vehicle’s maneuver.
(Step 5) → Quantify maneuver spots: Counting the maneuver spots in the field is useful for calculating their impact on final productivity. It can be estimated by doubling the ratio between the field width (fW) and the equidistance (eq) between SMP and OMP, since maneuvers occur on both sides of the field ((fW/eq) × 2).
2.3.2. Economic Analysis
To support the decision regarding the replacement of the conventional maneuver pattern with the P-optimized approach, the economic yield (Figure 6) was calculated. This was based on the ratio between the revenue obtained (gain from production minus expenditure on fuel) and the total time of the harvesting operation, with the result expressed in profit per hour of agricultural operation.
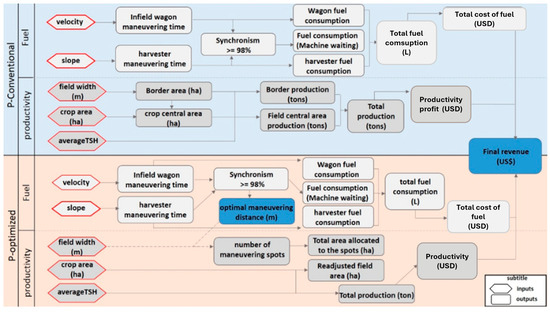
Figure 6.
Conceptual simulation model containing the input data required to obtain the final revenue.
The financial values were converted from Brazilian Real (BRL) to United States dollars (USD), considering the average exchange rate of BRL 3.60 during the study period.
Sugarcane Production
To estimate the impact of each maneuver pattern on field production, the average TCH (tons of cane per hectare) of the field was used. This value, multiplied by the total area (ha), resulted in the potential production (tons). From the potential production, a production readjustment was made, considering the areas compromised by the maneuvers. For the conventional maneuvering pattern, this compromised area corresponds to the entire border of the field, an area of 28,589.7 m2 (2.85 ha), resulting from the product of the field width and the trampling range, where 26% of the potential production was discounted. For the optimized approach, the canceled production of the maneuver spots in the field was reduced, varying in quantity according to operational and field parameters.
To convert the sugarcane production of the field into economic value, the average price per ton of sugarcane supplied by a Brazilian financial institution (UDOP) was used, which was USD 18.19 (or BRL 65.33) per ton of sugarcane produced in the field during the study period.
In real conditions, a sugarcane processing plant can be either a sugar refiner, an ethanol distiller, or a flexible one capable of producing a mix of these two commodities from sugarcane. The analysis of conversion options into sugar and ethanol is complex due to the different price units of the commodities (USD per kg for sugar and USD per L for ethanol) and the influence of agricultural production costs, which are subject to climatic and environmental conditions, resulting in large fluctuations in costs and prices from harvest to harvest and for each industrial unit [23].
For the purpose of this research, which involves comparatively analyzing maneuvering techniques, using the price per ton of cane as a unit of financial value is convenient. This is because each industrial unit has specific and private economic parameters. Here, the analyses were conducted using simulation software that allows for different input data assumptions. For financial analysis research specific to individual industrial units, commodity price values derived from sugarcane can be provided by financial institutions. A reference methodology for evaluating the conversion between sugar and ethanol production for flexible sugarcane processing plants is presented in the study by [23].
Fuel Consumption
The calculation of fuel consumption for the harvesters and infield wagons was based on the average hourly consumption values of the machines (L h−1) in different harvesting operation scenarios (Table 2), accounting for the time spent in each situation. Fuel expenditure was estimated using the price of diesel per liter at the plant in the first year of the study, which was BRL 1.64 or USD 0.45.
Table 2.
Average hourly consumption of harvester and infield wagon.
Operational Field Capacity (FC)
The profit obtained from production per unit of time (harvest operation hour) was calculated for each scenario according to the adaptation of the operational field capacity expressed by Equation (5):
where:
- FC = operational field capacity (USD h−1); Ra = revenue obtained from production in the harvest area (USD); Time = available time, sum of productive time and maneuver time (h).
Since the focus of the research is on the maneuvers of machines, the productive time (the time spent on effective harvest) was considered the same for the two maneuvering techniques analyzed. This productive time was estimated based on the relationship between the field area, expressed in linear meters (m), and the speed of the mechanized set during effective harvest (m h−1), resulting in the total time (h) of the harvesting operation spent on effective harvest. The area selected for the simulation had 584,800 linear meters, and the average speed observed during the experimental study, at which the mechanized set moved during the effective harvest of the sugarcane lines, was 5.7 km h−1.
3. Results and Discussion
3.1. Study of Times and Motions of Agricultural Machines in the Conventional Maneuver
The infield wagon maneuver times in both flat and sloping areas showed higher average values compared to harvester maneuver times, with the exception of harvesters on sloping terrain (HS). This is the only case where the harvester maneuvering time was longer than the infield wagon times (Figure 7). This result agrees with other authors [14,15] and is likely due to the fact that the infield wagon consists of a tractor plus wagon units, requiring a large radius and turning space to perform maneuvers. According to [24], the radius and turning space of agricultural machines or sets are dimensional characteristics that reflect maneuverability. The significant statistical difference observed between treatments, especially between infield wagons and harvesters, underscores the importance of developing integrated and optimized maneuver patterns since harvester and transshipment maneuvers are interdependent.
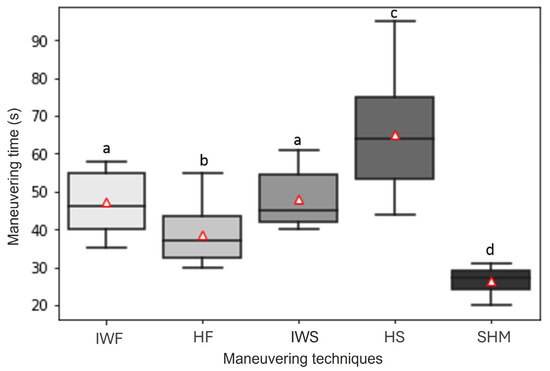
Figure 7.
Boxplot and Tukey test for analysis of machine maneuver times. IWF: infield wagon in flat area; HF: harvester in flat area; IWS: infield wagon in sloped area; HS: harvester in sloped area; SHM: sudden harvester maneuver. Means with different letters differ from each other by Tukey’s test at 5% probability.
The boxplots provide, in addition to the mean value of the data, the median (lower tail) of the lower quartile, and the median (upper tail) of the upper quartile, which allows for identifying extreme values and data distribution. For the Sudden Harvester Maneuver (SHM), the maximum maneuver observed was still lower than the minimum value of the infield wagon maneuver time in both flat and sloped areas (IWF and IWS), indicating low synchronism between harvester maneuvers and infield wagons.
The interpretation of these diagnosed patterns can be better understood when using the SPC control charts together. In the control charts representing the maneuvers of the machines in the harvesting operation, the alternation of clusters of sequenced points detected above or below the center line at time intervals (Figure 8) is probably related to the skill of the machine operator in performing the maneuvers in similar times, as well as the exchange of operators during a work shift change, which is very common in sugarcane mills. Similarly, the smaller amplitude observed in the chart referring to the Sudden Harvester Maneuver (SHM), represented by the high concentration of data around the mean value, is possibly due to the practicality and ease of performing this maneuver technique.
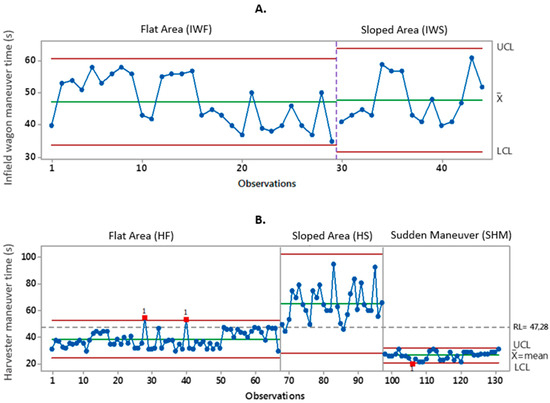
Figure 8.
(A) Control charts for infield wagon maneuvering times. (B) Control charts for harvester maneuvering times.
According to the Cause-and-Effect diagram, or Ishikawa diagram [25], every factor that interferes with the quality of a process falls into six categories: Labor, Raw Material, Machine, Method, Measurement, and Environment. Among these factors, this behavior shows that the labor factor contributes to the occurrence of nonrandom patterns, indicating the strong influence of the machine operator’s experience on the quality of a mechanized harvesting operation. According to [26], the operational performance of machines is influenced not only by obstacles present in the machine’s path, travel speed, and maintenance stops, but also by the hours of rest, food, personal hygiene, state of anxiety, and experience time of the machine operator.
Regarding the influence of terrain slope on maneuver times, control charts showed that the slope did not significantly affect the infield wagon. The infield wagon took an average of 47.28 s to perform maneuvers in flat areas and 47.87 s in sloping areas. The stability of agricultural tractors is directly related to their mass, the weight distribution over the support holding up the machine, the height of the center of gravity, the width of the tractor’s wheelset, and the speed [24].
According to [27], the stability of tractors is influenced by the addition of rear wheel ballast weights and the extension of overall width, which significantly improve lateral stability. However, when tractors tow implements like wagons or tanks carrying fluids, dynamic conditions such as fluid movement can lead to large oscillations in the center of gravity, considerably increasing the risk of tipping. This is especially critical during operations on sloping terrain, where adherence and stability may be further compromised. These findings emphasize the need for careful design and operational adjustments, particularly in scenarios involving high slopes and fluid-carrying equipment.
For the harvesters, there was a difference in maneuver times according to terrain slope. In sloped areas (HS), the average maneuver time was 65.67 s, which is 71% higher compared to the average maneuver time in flat areas, which was 38.46 s.
Although mechanized harvesting allows up to a 17% slope, there are restrictions on the safe use of machines in steep areas with slopes greater than 12% [28,29]. In steep areas, the harvester’s elevator (a side component that adds weight) is arranged at a relatively high elevation, and the harvester itself is a narrow-width machine. These factors contribute to the machine’s center of gravity being altered (Figure 9), thus exceeding the static stability limit and exposing the farm machine to the risk of tipping over. During headland turning, the operator uses the elevator component to return to the equilibrium position by applying a reactive force. This involves using the elevator for lateral overload compensation, maintaining the harvester’s static balance as the harvester directs the component opposite the slope of the terrain. This explains why this is the only situation where the harvester spends more time maneuvering than infield carriers in highly sloped areas.
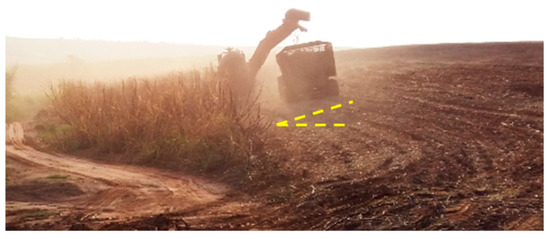
Figure 9.
Harvester elevator positioned against the slope of the ground.
The high data variability in the treatment harvester in sloped areas (HS) can possibly be attributed to environmental factors. Among the six factors mentioned above, sloping areas often contain unpredictable elements such as rocks and recesses in the soil, causing irregularities in the terrain surface. These irregularities are often difficult to perceive or even invisible to the operator due to vegetation cover. This results in heterogeneous maneuvering times, which depend not only on the operator’s attention and experience but also on the conditions of the road where the maneuver is being performed.
The differences between the infield wagon maneuver times and the harvester times are expressed through the maneuver simultaneity index (MSI). It is observed that the higher the MSI, the shorter the time one machine waits for the return of the other machine (Figure 10), which favors the harvesting efficiency of the agricultural operation. Flat areas showed greater simultaneity between maneuvers (81.48%). However, by observing the control charts and the distance between the RL reference line (referring to the average time of infield wagon maneuvers) and the central lines (referring to the average time of harvester maneuvers), it was found that only 28.3% of the maneuvers were synchronized, meaning they were performed by the mechanized set at or near the same time (+/− 5 s).
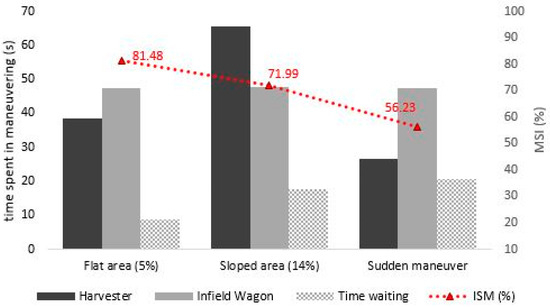
Figure 10.
Mechanized assembly maneuver times and times that one of the machines spends awaiting completion of the accompanying machine’s maneuver.
The lowest maneuver simultaneity index (56.23%) occurs when using the Sudden Harvester Maneuver (SHM) technique. The harvester maneuvering time for this technique is 79.7% longer than the infield wagon maneuver time. At the end of the maneuver, the harvester has to wait approximately 20.69 s for the infield wagon maneuver to complete. This result suggests that there is no benefit to performing the Sudden Harvester Maneuver. Sudden maneuvering can cause serious damage to harvester components due to excessive drag and friction forces, consequently reducing the machine’s durability and leading to significant maintenance costs.
The harvester control charts showed that 33.6% of all maneuvers analyzed were performed abruptly. Although this value may seem insignificant, according to [30], the cost of repair and maintenance for harvesters is high and is more significant than fuel expenses, which are closely related to the intensity of use of the crop machine.
3.2. Optimization Results
Starting with field efficiency, the P-optimized technique in flat areas showed the best results. With optimization, there was an 18.15% reduction in total time spent on maneuvers compared to the conventional maneuver (Table 3).
Table 3.
Fuel cost parameters in the harvesting operation.
In sloping areas, there was no difference in the times between the conventional and the optimized maneuver. This is because, in the P-optimized maneuver, the infield wagon maneuver time is conditioned to the harvester maneuver time, with the aim of eliminating the unproductive time that the harvester loses while waiting for the completion of the infield wagon maneuver. However, in sloping areas, the harvester is in the only condition where it spends more time maneuvering than the transshipment. In this case, the economic viability of the P-optimized approach in sloping areas must be analyzed considering only the parameters of sugarcane production and fuel consumption.
In the P-optimized maneuver, the displacement speed of the transshipment in the carrier influences the number of maneuver spots in the field, and consequently the production. Sloping areas resulted in higher yields compared to flat areas for the same speeds adopted (Figure 11). The distance traveled to the optimal maneuvering spots will be directly proportional to the time of simultaneous maneuvering of the mechanized set (harvester and infield wagon), and inversely proportional to the number of maneuvering spots. In other words, the greater the distance covered, the smaller the number of spots in the field. In sloped areas, the harvester spends more time maneuvering than in flat areas, and within this maximum time limit, greater distances can be reached by the infield wagon, reducing the total amount of maneuver spots in the field. In flat areas, there are almost twice as many turning spots as in sloping areas, resulting in a greater negative impact on production. This does not necessarily mean that the economic return in sloping areas is greater than in flat areas, because in sloping areas the total operation time is longer.
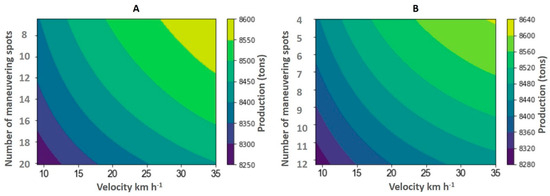
Figure 11.
(A) Isoline graphs of the relationship between speed and number of turning points and response in tons produced for flat areas and (B) sloped areas.
The economic feasibility of replacing the conventional maneuvering technique with the P-optimized one was determined by the profit per hour worked. In flat areas, the conventional maneuver presented higher sugarcane production than the P-optimized technique for infield wagon displacement speeds lower than 15 km h−1. As the speed increases and the number of maneuver points in the field decreases, production is shown to be higher than when using the conventional maneuver (Figure 12A). However, when analyzing the profit per hour worked, the P-optimized maneuver presents a better economic return compared to the conventional maneuver, even with the lowest displacement speeds. The increases varied between USD 15.93 and USD 23.85 per hour of work, for the lowest and highest travel speed adopted, respectively, with the optimization, considering only a mechanized set in agricultural operation.
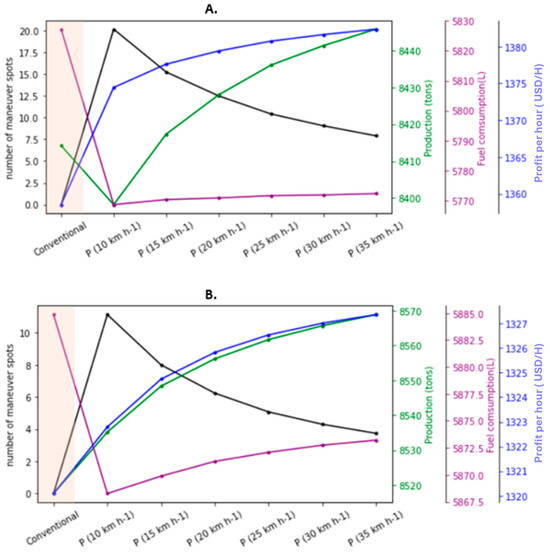
Figure 12.
(A) Economic analysis between the techniques of infield wagon maneuvers for flat areas and (B) for sloped areas. P: P-optimized maneuver at different speeds.
The total fuel consumption during the operation also showed a decrease with the optimization, approximately 60 L in flat areas and 20 L in sloping areas. This occurs because, in the conventional maneuver, the fuel consumption of the machines includes both the execution of the maneuvers and the consumption while waiting for the harvester. According to [31], in a working condition where the harvester is stopped with the engine running, but does not require high engine speed or the activation of its harvesting functions (such as the feeding and cleaning functions), it is recommended that the operator keeps the engine at minimum speed and the harvesting functions off to favor fuel economy, as machines consume high amounts of fuel even when stopped.
The optimization proved to be economically viable for sloping areas as well, showing a linear increase in sugarcane production and profit per hour as the speed increased (Figure 12B). The increases in relation to the conventional maneuver varied between USD 2.70 and USD 7.28 per hour of work for the lowest and highest travel speeds adopted, respectively. The financial return due to the adoption of the optimization was considerably higher in flat areas than in sloping areas, even though sloping areas presented fewer maneuver spots (and better production). This result demonstrates the impact that reductions in unproductive times have on increasing the profit of agricultural production since, in sloping areas, there is no optimization of maneuver time, only the optimization of agricultural production.
To evaluate the performance of the computer program that allows the application of the P-optimized maneuver, experimental maneuver points were installed in the areas of the mill at distances of 50, 100, 150, and 200 m. The maneuver times at these points were evaluated according to the integrated model and correlated with the maneuver times estimated by the computer program. The proposed model presented a 99% probability of occurrence (Figure 13). The variability of the maneuver times can be explained by the fact that the computer program does not consider the fluctuations in the displacement speed of the machines that occur when starting and finishing the maneuver before stabilizing at a constant speed as occurs in the harvesting operation. However, this variability was not significant.
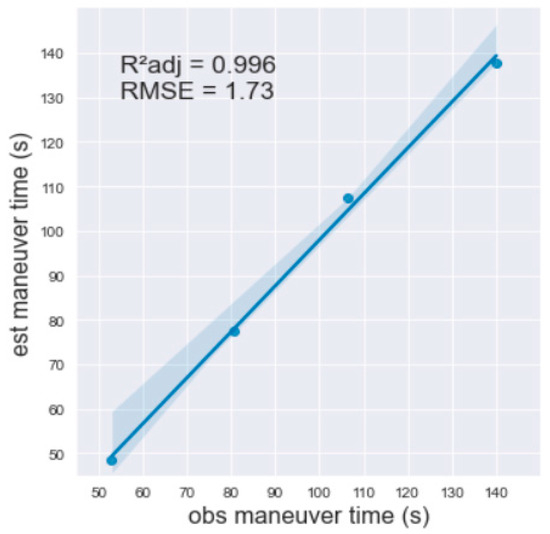
Figure 13.
Correlation between observed and estimated turnaround time for model performance analysis.
3.3. Considerations About the Model and Future Researchs
This research presents a pioneering integrated optimization model for harvester and infield wagon maneuvers, advancing beyond isolated optimization approaches. Results reveal that the proposed method surpasses conventional maneuver patterns by reducing total maneuver time and fuel consumption, as well as mitigating soil compaction, thereby enhancing field productivity and achieving benefits related to soil quality and environmental improvement. These findings align with past work on route optimization in mechanized agriculture [7,8] and underscore the model’s potential for practical application.
In practice, the installation of maneuvering spots requires some input data, such as the harvester maneuvering time, the infield wagon speed, and the time it takes for the infield wagon to maneuver at the maneuvering spots. These inputs may vary according to the sugarcane mill, depending on the machine model and the crop characteristics. As seen in this research (Section 2.3.1), the harvester maneuvering time consists of a constant time value for areas with slopes below 12% and a different value for areas with slopes above 12%. This value may vary according to the harvester model and the maneuvering pattern adopted by the mill. The infield wagon has a greater range of values, with higher speeds leading to greater harvesting efficiency, determined by the carrier’s conditions and the machine’s power, attributes, and limitations.
Therefore, the harvest manager must have knowledge of these variables to apply the model according to the machinery and field conditions. We encourage partnerships between companies and researchers to assist in the collection and analysis of this data.
New infield wagon models have been tested in recent years, with only one wagon unit but greater volumetric capacity and the proposal of performing the headland maneuver by flattening a smaller area than the infield wagon analyzed in this research. The methodology for analyzing the economic viability of maneuvering patterns presented here can be applied to any harvester model (even multi-row) and infield wagon. It can also be applied to the analysis of other crops where a mechanized set operates together in an interdependent way, such as in silage production.
As for tractors and autonomous infield wagons, the application would still be a great challenge since these are developed with the main objective of avoiding damage to the remaining sugarcane shoots in the harvesting lines. However, the movement on the carriers where the maneuvers are performed still requires human supervision due to the free traffic of various transport vehicles.
This research was conducted in systematized areas, which make up the majority of land in sugarcane mills, where the area is subdivided into plots and carriers are allocated to achieve the best efficiency. However, in a sugarcane-producing region, there are many plots with different shapes. We strongly encourage studies similar to this one applied to different plots to improve productivity and sustainability. Additionally, new improved models should include environmental gains in terms of reducing the effects of greenhouse gas (GHG) emissions, especially carbon dioxide (CO2).
Precision agriculture tools can play a transformative role in refining these maneuvers, offering adaptable solutions that maximize yields, reduce operational costs, and promote sustainable practices. This study thus establishes a critical foundation for agricultural managers and researchers, serving as a springboard for customized and high-efficiency strategies in sugarcane and beyond.
4. Conclusions
The study confirmed that conventional maneuvers result in significant inefficiencies, with infield wagons taking longer than harvesters, except on slopes. The optimized maneuver reduced total maneuver time by 18.15% on flat areas, increasing economic returns per hour and lowering fuel consumption. Optimized techniques also enhanced productivity in sloped areas and at speeds above 15 km/h on flat terrain. Profit gains with optimization ranged from USD 15.93 to USD 23.85 per hour on flat terrain and USD 2.70 to USD 7.28 on slopes, proving the approach’s economic and operational viability. The optimization model showed strong reliability (R2 = 99%).
Author Contributions
Conceptualization, L.N.C.; methodology, L.N.C., C.E.A.F. and R.P.d.S.; software, L.N.C. and G.d.S.R.; validation, L.N.C., A.F.d.S. and G.d.S.R.; formal analysis, L.N.C., A.F.d.S. and G.d.S.R.; investigation, L.N.C., C.E.A.F. and R.P.d.S.; resources, C.E.A.F. and R.P.d.S.; data curation, L.N.C.; writing—original draft preparation, L.N.C.; writing—review and editing, A.F.d.S., G.d.S.R., I.C.d.O.V., B.d.S.S. and F.L.S.; visualization, A.F.d.S., G.d.S.R., I.C.d.O.V., B.d.S.S. and F.L.S.; supervision, C.E.A.F. and R.P.d.S.; project administration, C.E.A.F. and R.P.d.S.; funding acquisition, C.E.A.F. and R.P.d.S. All authors have read and agreed to the published version of the manuscript.
Funding
This research was funded by São Paulo Starte University—Faculty of Agricultural and Veterinary Sciences (FCAV) and the Coordination for the Improvement of Higher Education Personnel (CAPES)—Code 001.
Data Availability Statement
The data that support the findings of this study are available from the corresponding author upon reasonable request.
Conflicts of Interest
The authors declare no conflicts of interest.
References
- Goldemberg, J.; Mello, F.F.C.; Cerri, C.E.P.; Davies, C.A.; Cerri, C.C. Meeting the global demand for biofuels in 2021 through sustainable land use change policy. Energy Policy 2014, 69, 14–18. [Google Scholar] [CrossRef]
- Amaral, l.R.; Molin, J.P.; Portz, G.; Finazzi, F.B.; Cortinove, L. Comparison of crop canopy reflectance sensors used to identify sugarcane biomass and nitrogen status. Precis. Agric. 2015, 16, 15–28. [Google Scholar] [CrossRef]
- Santoro, E.; Soler, E.M.; Cherri, A.C. Route optimization in mechanized sugarcane harvesting. Comput. Electron. Agric. 2017, 141, 140–146. [Google Scholar] [CrossRef]
- Gírio, L.A.S.; Silva, R.P.; Menezes, P.C.; Carneiro, F.M.; Zerbato, C.; Ormond, A.T. Quality of multi-row harvesting in sugarcane plantations established from pre-sprouted seedlings and billets. Ind. Crops Prod. 2019, 142, 111831. [Google Scholar] [CrossRef]
- Nilsson, R.S.; Zhou, K. Method and benchmarking framework for coverage path planning in arable farming. Biosyst. Eng. 2020, 198, 248–265. [Google Scholar] [CrossRef]
- Gürsoy, S. Soil compaction due to increased machinery intensity in agricultural production: Its main causes, effects and management. In Technology in Agriculture; IntechOpen: Rijeka, Croatia, 2021; pp. 1–18. [Google Scholar] [CrossRef]
- Bochtis, D.; Vougioukas, S. Minimising the non-working distance travelled by machines operating in a headland field pattern. Biosyst. Eng. 2008, 101, 1–12. [Google Scholar] [CrossRef]
- Spekken, M.; Molin, J.P.; Romanelli, T.L. Cost of boundary manoeuvres in sugarcane production. Biosyst. Eng. 2015, 129, 112–126. [Google Scholar] [CrossRef]
- Edwards, G.T.C.; Hinge, J.; Nielsen, N.S.; Henriksen, A.V.; Sorensen, C.A.G.; Green, O. Route planning evaluation of a prototype optimised infield route planner for neutral material flow agricultural operations. Biosyst. Eng. 2017, 153, 149–157. [Google Scholar] [CrossRef]
- Paraforos, D.S.; Hubner, R.; Griepentrog, H.W. Automatic determination of headland turning from auto-steering position data for minimising the infield non-working time. Comput. Electron. Agric. 2018, 152, 398–400. [Google Scholar] [CrossRef]
- Seyyedhasani, H.; Dvorak, J.S. Reducing field work time using fleet routing optimization. Biosyst. Eng. 2018, 169, 1–10. [Google Scholar] [CrossRef]
- Paniago, A.L. Potential Application of Lean Thinking in Agricultural Activities: Case Studies. Ph.D. Thesis, Luiz de Queiroz College of Agriculture, Piracicaba, Brasil, 2017. [Google Scholar]
- Benedini, S.M.; Conde, J. Systematization of the area for mechanized sugarcane harvesting. Rev. Coplana 2008, 23, 23–25. [Google Scholar]
- Coelho, M.F. Quality Planning in the Process of Mechanized Sugarcane Harvesting. Master’s Thesis, Luiz de Queiroz College of Agriculture, Piracicaba, Brasil, 2009. [Google Scholar]
- Melo, M.O.; Rosa, J.H.M. Cutting, transshipment, and transportation (CTT): Use of transshipment in mechanized harvesting and its impacts on CTT. In Agricultural Processes and Mechanization of Sugarcane; Belardo, G.C., Cassia, M.T., Silva, R.P., Eds.; SBEA Publishing: Jaboticabal, Brazil, 2015; Chapter 18. [Google Scholar]
- Ripoli, T.C.; Paranhos, S.B. Colheita. Harvesting. In Sugarcane, Cultivation and Utilization, 1st ed.; Paranhos, S.B., Ed.; Cargill Foundation: Campinas, Brazil, 1987; pp. 517–597. [Google Scholar]
- Ripoli, T.C.; Ripoli, M.L.C. Sugarcane Biomass: Harvesting, Energy, and Environment, 2nd ed.; Barros & Marques Desktop Publishing: Piracicaba, Brazil, 2009; 333p. [Google Scholar]
- Rosa, L.V.; Voltarelli, M.A.; Ormond, A.T.S.; Silva, R.P.; Tavares, T.O. Engine load profile of sugarcane harvesters before and after adjustments. Rev. Energ. Agric. 2015, 31, 129–137. [Google Scholar] [CrossRef]
- Paula, V.D.; Molin, J.P. Assessing damage caused by accidental vehicle traffic on sugarcane ratoon. Appl. Eng. Agric. 2013, 29, 161–169. [Google Scholar] [CrossRef]
- Machmudah, A.; Shanmugavel, M.; Parman, S.; Manan, T.S.A.; Dutykh, D.; Beddu, S.; Rajabi, A. Flight Trajectories Optimization of Fixed-Wing UAV by Bank-Turn Mechanism. Drones 2022, 6, 69. [Google Scholar] [CrossRef]
- Alvares, C.A.; Stape, J.L.; Sentelhas, P.C.; Gonçalves, J.D.M.; Sparovek, G. Köppen’s climate classification map for Brazil. Meteorol. Z. 2013, 22, 711–728. [Google Scholar] [CrossRef] [PubMed]
- Santos, A.F.; Silva, R.P.; Zerbato, C.; Menezes, P.C.; Kazama, E.H.; Paixao, C.S.S.; Voltarelli, M.A. Use of real-time extend GNSS for planting and inverting peanuts. Precis. Agric. 2019, 19, 1–17. [Google Scholar] [CrossRef]
- Bastian-Pinto, C.; Brandão, L.; Hahn, W. Flexibility as a source of value in the production of alternative fuels: The ethanol case. Energy Econ. 2009, 31, 411–422. [Google Scholar] [CrossRef]
- Lebedev, A.; Shuliak, M.; Lebedev, S.; Khalin, S.; Haidai, T.; Kholodov, A.; Shaposhnyk, V. Determining conditions for providing maximum traction efficiency of tractor as part of a soil tillage unit. East.-Eur. J. Enterp. Technol. 2024, 1, 6–14. [Google Scholar] [CrossRef]
- Ishikawa, K.; Loftus, J.H. Introduction to Quality Control; 3A Corporation: Tokyo, Japan, 1990. [Google Scholar]
- Linhares, M.; Sette, R.C., Jr.; Campos, F.; Minoru, F.Y. Eficiência e desempenho operacional de máquinas harvester e forwarder na colheita floresta. Pesqui. Agropecuária Trop. 2012, 42, 212–219. [Google Scholar] [CrossRef]
- Majdan, R.; Abrahám, R.; Tkáč, Z.; Drlička, R.; Matejková, E.; Kollárová, K.; Mareček, J. Static lateral stability of tractor with rear wheel ballast weights: Comparison of ISO 16231-2 (2015) with experimental data regarding tyre deformation. Appl. Sci. 2021, 11, 381. [Google Scholar] [CrossRef]
- Cervi, R.G.; Esperancini, M.S.T.; Silva, O.F.; Isler, P.R.; Oliveira, P.A. Evaluation of operational performance in sugarcane (Saccharum spp.) harvesting and transshipment. Energ. Agric. 2015, 30, 232–241. [Google Scholar] [CrossRef]
- Gimenes, G.R.; Rone, B.O.; Silva, A.F.; Reis, L.C.; Reis, T.E.S. Mapping of slopes for the operation of agricultural harvesters in Bandeirantes Municipality (PR). Ciências Agrárias 2017, 38, 97–108. [Google Scholar] [CrossRef][Green Version]
- Santos, N.B.; Teixeira, M.M.; Fernandes, H.C.; Junior, C.D.G. Estimated repair and maintenance cost of sugarcane (Saccharum spp.) harvester. Rev. Científica 2017, 45, 214–217. [Google Scholar] [CrossRef]
- Ramos, C.R.G.; Lanças, K.P.; Souza Santos, R.; Martins, M.B.; Sandi, J. Efficiency and energy demand of a sugarcane harvester in plots of different lengths. Energ. Agric. 2016, 31, 121–128. [Google Scholar] [CrossRef]


Disclaimer/Publisher’s Note: The statements, opinions and data contained in all publications are solely those of the individual author(s) and contributor(s) and not of MDPI and/or the editor(s). MDPI and/or the editor(s) disclaim responsibility for any injury to people or property resulting from any ideas, methods, instructions or products referred to in the content. |
© 2025 by the authors. Licensee MDPI, Basel, Switzerland. This article is an open access article distributed under the terms and conditions of the Creative Commons Attribution (CC BY) license (https://creativecommons.org/licenses/by/4.0/).