Review

A Review of Crop Attribute Monitoring Technologies for General Agricultural Scenarios

1
School of Automotive and Traffic Engineering, Jiangsu University, Zhenjiang 212000, China
2
Automotive Engineering Research Institute, Jiangsu University, Zhenjiang 212000, China
*
Author to whom correspondence should be addressed.
AgriEngineering 2025, 7(11), 365; https://doi.org/10.3390/agriengineering7110365
Submission received: 26 August 2025 / Revised: 17 October 2025 / Accepted: 20 October 2025 / Published: 2 November 2025
(This article belongs to the Topic Digital Agriculture, Smart Farming and Crop Monitoring)

Abstract

As global agriculture shifts to intelligence and precision, crop attribute detection has become foundational for intelligent systems (harvesters, UAVs, sorters). It enables real-time monitoring of key indicators (maturity, moisture, disease) to optimize operations—reducing crop losses by 10–15% via precise cutting height adjustment—and boosts resource-use efficiency. This review targets harvesting-stage and in-field monitoring for grains, fruits, and vegetables, highlighting practical technologies: near-infrared/Raman spectroscopy (non-destructive internal attribute detection), 3D vision/LiDAR (high-precision plant height/density/fruit location measurement), and deep learning (YOLO for counting, U-Net for disease segmentation). It addresses universal field challenges (lighting variation, target occlusion, real-time demands) and actionable fixes (illumination compensation, sensor fusion, lightweight AI) to enhance stability across scenarios. Future trends prioritize real-world deployment: multi-sensor fusion (e.g., RGB + thermal imaging) for comprehensive perception, edge computing (inference delay < 100 ms) to solve rural network latency, and low-cost solutions (mobile/embedded device compatibility) to lower smallholder barriers—directly supporting scalable precision agriculture and global sustainable food production.

1. Introduction

Agriculture is the cornerstone of global food security, economic stability, and ecological balance. With the UN FAO projecting a 70% increase in agricultural production needed by 2050 to feed 9 billion people, traditional manual management—reliant on experience and labor—can no longer meet demands for efficiency, precision, and sustainability. This gap has driven the shift toward intelligent agricultural systems, where crop attribute monitoring acts as a “perceptual core” to connect real-time field data with operational decisions [1].
Crop attribute monitoring technology impacts all stakeholders, from smallholder farmers to large-scale agribusinesses. Initially, high costs (tens of thousands of yuan for basic sensor systems) posed barriers, but long-term operation proves its value: precise height detection reduces grain loss by 10–15%; early disease identification via hyperspectral imaging cuts pesticide use by 30%; and data-driven management lowers average per-mu production costs by 8–12% [2]. For accessibility, edge computing has solved universal rural network limitations (avoiding cloud-dependent delays), while lightweight AI models (e.g., MobileNet for maturity grading) now run on low-cost mobile devices—eliminating “equipment unusable, data unreadable” issues across diverse farm types (small plots, large plantations, greenhouse facilities) [3].
Traditional manual detection is time-consuming, subjective, and unfeasible for large-scale operations. For example, assessing maturity plant-by-plant or counting wheat spikes manually leads to inconsistent results and missed harvest windows. In contrast, intelligent monitoring systems—integrating remote sensing, IoT, and AI—enable continuous, high-precision detection: UAV-mounted multispectral sensors map 100+ mu of farmland in hours; harvester-mounted LiDAR adjusts cutting height in real-time; and sorting-line cameras grade fruits by quality in seconds. These technologies not only improve harvesting efficiency but also upgrade downstream processes (storage, transportation) by providing accurate attribute data (e.g., moisture content for drying scheduling) [4,5].
However, universal challenges persist across all agricultural scenarios: variable lighting (sunny/shady transitions, dawn/dusk operations) distorts image data; crop occlusion (leaves covering fruits, dense canopies) reduces detection accuracy; and high-speed machinery motion (vibration, jolting) interferes with sensor stability [6]. Additionally, model generalization—ensuring a single maturity-detection model works for multiple tomato varieties or wheat cultivars—remains a barrier to widespread adoption [7].
To address these, research has advanced toward practical, scenario-agnostic solutions: multi-sensor fusion (combining RGB-D for color and depth, LiDAR for 3D structure) to overcome single-technology limitations; data augmentation (simulating lighting/occlusion) to improve model robustness; and edge computing to enable on-site decision-making without relying on cloud infrastructure [8]. As unmanned machinery, 5G IoT, and low-cost sensors mature, crop attribute monitoring will evolve from “specialized technology” to “standard tool”—supporting efficient, precise, and sustainable agriculture worldwide [9]. Figure 1 is the logical block diagram of this article.

2. Crop Attributes

During crop harvesting, the detection of different attributes directly determines the formulation and execution of operational strategies. Accurately perceiving both the external morphological characteristics and internal quality status of crops can not only enhance the operational efficiency of harvesting machinery but also effectively control the risks of crop loss and quality degradation [10,11]. With the advancement of agricultural intelligence, the requirements for crop attribute detection have gradually shifted from single-index recognition to multi-dimensional comprehensive perception, encompassing aspects such as morphological structure, maturity status, nutritional composition, and health conditions [12].
This chapter, centered on the practical needs of harvesting operations, approaches from the perspective of crop detection attributes [13]. It outlines the key detection priorities during the harvest preparation and execution stages, analyzes their role in operational decision-making, and highlights their application value, thereby laying the foundation for the subsequent introduction of crop attribute detection technologies and intelligent operational systems.

2.1. Grain Crop Attributes

In the agricultural harvesting process, attributes of grain crops such as rice, wheat, rapeseed, and corn not only reflect their growth status and yield but also directly influence the formulation of operational strategies, configuration of equipment parameters, and assurance of harvesting efficiency in mechanized harvesting systems. Unlike fruit and vegetable crops, which are typically harvested individually, grain crops are often distributed in densely concentrated patches and exhibit structural and population characteristics such as plant height, density, and number of panicles [14]. Therefore, attribute detection for these crops emphasizes accurate identification of spatial continuity, local variability, and multi-scale morphology. In complex scenarios such as high-density planting, heterogeneous fields, and lodging, accurately and real-time perceiving crop height, distribution, structure, and spatial position has become critical to enhancing the operational stability and intelligence of combine harvesters [15].
This section focuses on key harvesting attributes of grain crops, including core parameters such as plant height, plant density, number of panicles, crop lodging, canopy structure, and spatial position. It also supplements other attributes with scenario adaptability and structural refinement value, such as panicle layer and stem diameter. The content will systematically outline current key technological approaches and development trends in sensing these attributes, emphasizing their definitions, detection significance, typical sensors, and detection methods [16]. This provides theoretical support for subsequent mechanical adjustment and path optimization in harvesting operations.

2.1.1. Crop Height

Crop height refers to the vertical distance from the ground surface to the highest point of the plant. According to national standards, plant height is typically defined as the vertical length from the base of the main stem (ground level) to the tip of the panicle (excluding awns) [17]. It is one of the core parameters for assessing crop growth and development, biomass accumulation, and population structure. Its value is influenced by factors such as variety characteristics, growth stage, planting density, and environmental conditions, exhibiting significant variability across different crops and growth stages.
In agricultural harvesting, plant height plays a critical role in operational efficiency. The header height, a key parameter determining harvesting accuracy and crop loss, is often set based on the average plant height. If the header is positioned too high, it may lead to missed panicles and yield loss; if set too low, it increases straw entanglement, raises machine load, and reduces threshing efficiency [18]. Furthermore, in fields with uneven growth or severe lodging, real-time perception of plant height variations is essential for adjusting cylinder speed, forward speed, and feed rate. This helps effectively reduce breakage and harvesting loss rates, ensuring operational continuity and stability [19].
Plant height detection currently relies primarily on non-contact 3D measurement devices, such as LiDAR, RGB-D vision systems, structured light cameras, and UAV-based multi-view imaging technologies. These devices can rapidly capture spatial information of field crops, providing data support for subsequent height extraction and model construction [20]. Among specific detection methods, the maximum height difference approach is most commonly used, which calculates the height difference between the highest point of the plant and the ground surface from point clouds or images. Figure 2 is a schematic diagram illustrating the morphological differences of rice at different growth stages.
This method is simple and intuitive, suitable for overall assessment of densely planted crops. The average height method, which subtracts the average ground height from the average crop height within a local window, better reflects regional variations and is appropriate for parameter adjustments in large-scale operation areas. For tall crops with clear structures, such as corn and sorghum, the main stem line fitting method can be employed. This method extracts the point cloud skeleton of the main stem for linear modeling, enabling accurate quantification of individual plant height [21].
Furthermore, in field environments, to reduce noise impact and enhance robustness, some methods construct a Canopy Height Model (CHM) based on the difference between the Digital Surface Model (DSM) and the Digital Terrain Model (DTM). Stable estimation is achieved through point cloud filtering and regional reconstruction techniques [22]. Additionally, combining time-series imagery and crop semantic segmentation helps improve the spatiotemporal continuity and crop specificity of height estimation. For example, Li et al. proposed a method for estimating plant height and biomass using UAV remote sensing and machine learning, as shown in Figure 3. By integrating 3D point clouds, Vegetation Indices (VIs), and Absolute Height of the Inflorescence (AIH) features, they employed algorithms like Random Forest (RF) for modeling and constructed CHMs. The results demonstrated effective AIH extraction (R2 = 0.768–0.784), with multi-feature fusion enhancing accuracy (R2 reaching up to 0.93). Random Forest Regression (RFR) performed best, effectively overcoming issues related to spectral inversion and saturation [23].
In summary, as a fundamental variable for adjusting harvesting machinery parameters, the perception results of plant height directly impact the accuracy of operational path planning and implement control strategies [24]. Plant height detection methods based on 3D spatial reconstruction and structural feature extraction have become an indispensable front-end perception component in intelligent harvesting systems.

2.1.2. Plant Density

Plant density refers to the number of crop plants per unit area and is a critical parameter for evaluating planting structure, field population growth status, and yield. According to agricultural standards, plant density is commonly expressed in “plants·m−2” and is typically measured in field surveys using methods such as quadrat sampling or calculations based on row and plant spacing. During mechanical harvesting, accurately assessing the spatial distribution of crop density is essential for operational path planning, feed rate control, and harvesting strategy formulation, significantly impacting operational efficiency, machinery load management, and yield estimation [25].
Density information can guide the dynamic speed control of harvesters and optimize header width utilization. In high-density areas, crop flow congestion, insufficient threshing intensity, or increased grain breakage may occur, whereas in low-density areas, operational speed can be appropriately increased to enhance efficiency and reduce fuel consumption. Additionally, plant density is closely related to lodging risk, panicle distribution, and nutrient use efficiency, playing a vital role in pre-harvest field assessment and machinery parameter presets [26].
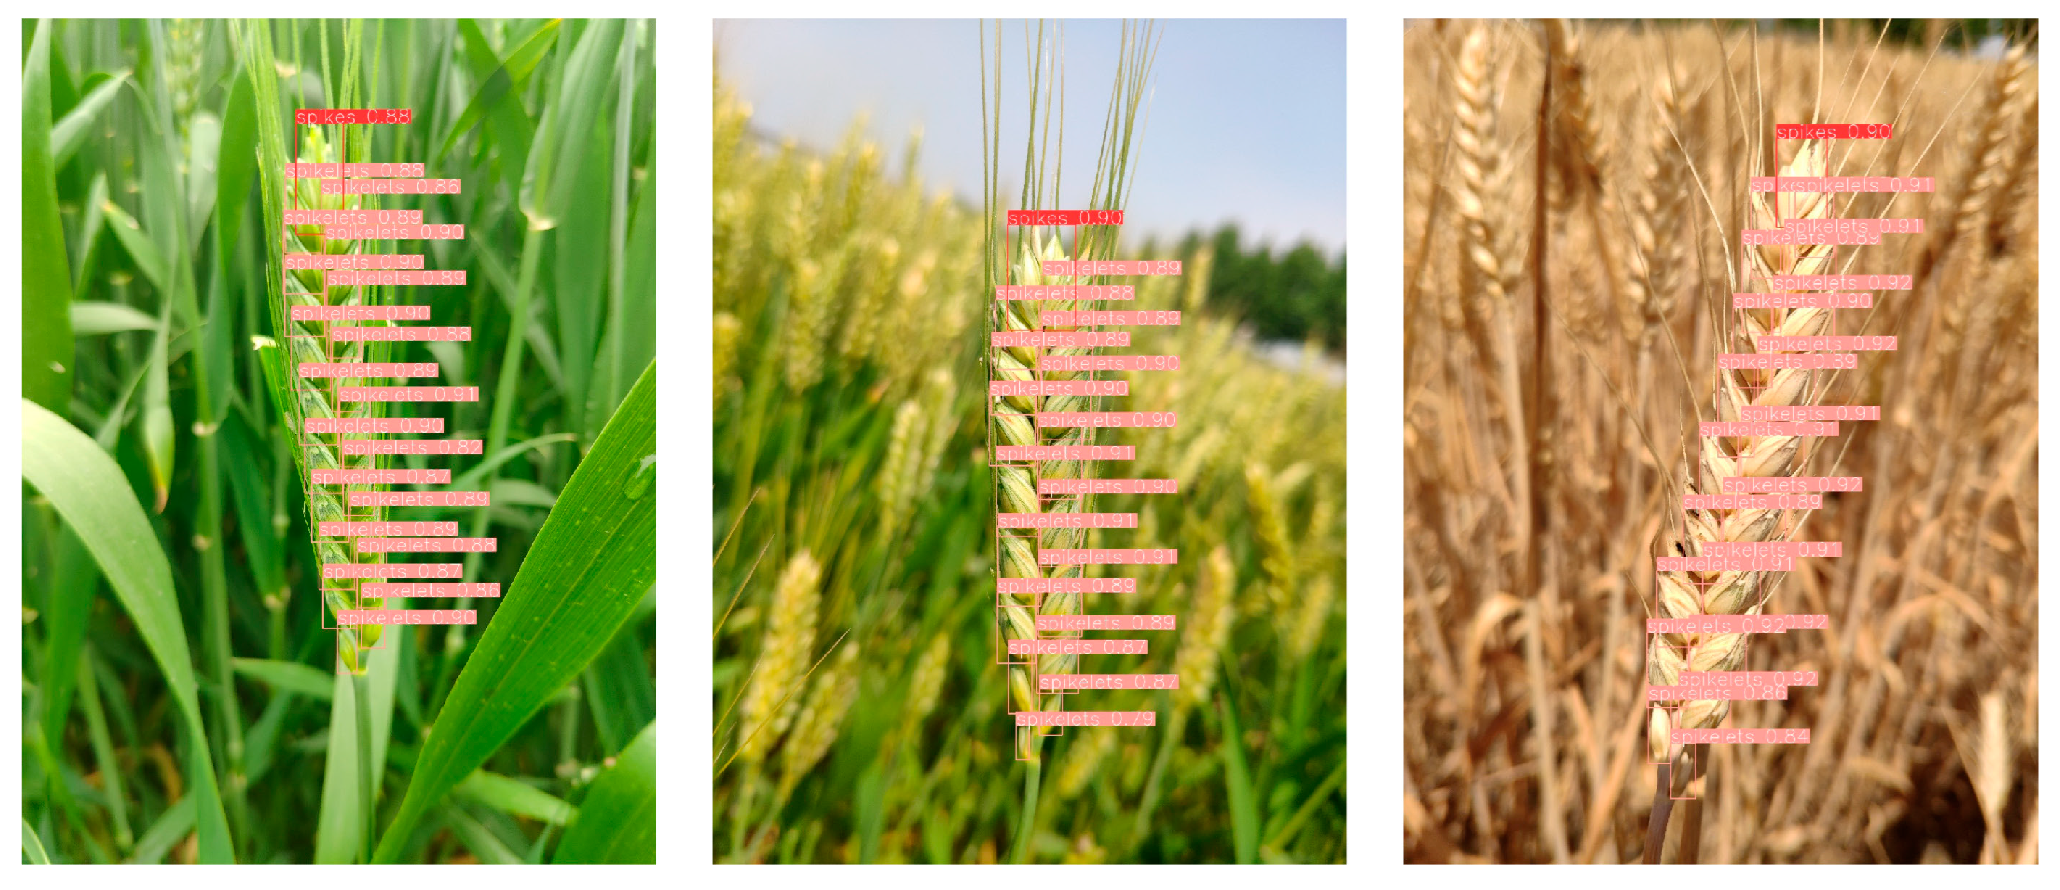
Current plant density detection primarily relies on image-based object counting and point cloud density estimation methods, with typical sensing devices including RGB cameras, RGB-D depth cameras, and multi-line LiDAR. In 2D images, density can be derived by using object detection or semantic segmentation models to identify individual plants or panicles, which are then converted into density values per unit area. Among these, detection models such as YOLO and CenterNet enable rapid identification of individual plants, making them suitable for fields with low to moderate density. Under dense and occluded conditions, density regression models (e.g., CSRNet, MCNN) mitigate overlap and occlusion issues by learning the mapping between image features and target distribution [27].
For crops with distinct three-dimensional structures, such as corn and sorghum, LiDAR-based point cloud density estimation methods are widely used. These methods typically infer plant density by analyzing the number of point clusters per unit area, trends in point density variation, or the number of points in vertically projected regions [27,28]. Furthermore, visualization tools such as plant density prescription maps and histograms are employed to support agricultural machinery scheduling and regional variability analysis. As shown in Figure 4, researchers generate visual prescription maps based on manually annotated data and model predictions, where darker colors indicate higher plant density in specific areas, providing an intuitive visualization to assist harvesting operations.
It is noteworthy that in practical field operations, plant density exhibits spatial heterogeneity and varies across growth stages. Moreover, the tillering and branching characteristics of different crops may interfere with the accuracy of density identification. Therefore, density estimation methods often integrate temporal data, semantic segmentation, and multi-modal information fusion to enhance robustness. Some studies also introduce plant cluster separation strategies based on image-based geometric reconstruction to distinguish adjacent plants and improve recognition accuracy in densely populated areas [29].
In summary, plant density is one of the core attributes influencing operational strategies during crop harvesting [30]. Detection methods combining image-based object recognition and point cloud density analysis provide efficient and intelligent perceptual support for modeling spatial distribution of density and facilitating agricultural machinery decision-making.

2.2. Fruit and Vegetable Crop Attributes

Horticultural cash crops such as citrus, pears, and grapes exhibit distinct sensing requirements and operational characteristics during harvesting that significantly differ from those of grain crops. Their harvest targets are typically individual fruits, characterized by complex spatial distribution, diverse structural morphology, and asynchronous ripening processes. These factors impose higher demands on perception systems in terms of spatial resolution, attribute discrimination accuracy, and real-time responsiveness. The fruit and vegetable harvesting process requires not only determining whether fruits have reached optimal picking conditions but also precisely locating their spatial positions within complex plant structures, assessing external integrity and health status, thereby enabling picking actuators to perform path planning, end-effector operations, and operational decision-making [31].
This section systematically reviews the sensing requirements for key crop attributes relevant to fruit and vegetable harvesting, focusing on core indicators such as maturity, 3D spatial location, and quality status. Furthermore, it explores fine-grained attributes that hold significant importance under specific crops or operational conditions yet remain underexplored, including geometric anomalies, connection structure types, and dynamic response characteristics. The analysis of each attribute will sequentially address definition standards, harvesting significance, typical sensors, and characterization methods, aiming to provide theoretical foundations and technical support for developing perception modules in automated fruit and vegetable harvesting systems.

2.2.1. Maturity

Maturity of fruit and vegetable crops is a critical indicator for determining whether they have reached optimal harvesting conditions, commercial value, and adaptability for subsequent storage and transportation. It is widely used in harvest decision-making, quality evaluation, and grading processes. According to relevant agricultural industry standards, fruit and vegetable maturity can be categorized into multiple stages, such as visual maturity, physiological maturity, and harvest maturity. Its assessment involves comprehensive indicators including color change, texture firmness, moisture content, soluble solids (sugar content), starch content, protein concentration, and acidity variation [32]. Particularly, maturity evaluation methods vary significantly across different types of produce. For instance, citrus fruits are primarily assessed based on color and sugar-acid ratio, whereas bananas are evaluated based on the starch-to-sugar conversion process.
Accurate maturity recognition plays a key role in ensuring harvesting quality and reducing unnecessary losses. On the one hand, premature harvesting may result in insufficient sugar accumulation, inadequate flavor development, and reduced marketability [33]. On the other hand, delayed harvesting can lead to fruit softening, increased disease susceptibility, and higher damage rates during transportation. For crops such as tomatoes and peaches that require color transformation before harvesting, maturity directly determines the harvesting sequence and cold chain strategies. For climacteric fruits like bananas and kiwis, it is essential to accurately determine whether they have reached the critical pre-harvest maturity stage in the field. Therefore, fruit and vegetable harvesting systems must be capable of quantitatively assessing maturity to enable selective picking and quality-based grading.
Maturity detection typically involves comprehensive analysis of external appearance and internal composition using multi-sensor data. In terms of external information acquisition, color change is the most prominent and easily observable maturity indicator [34]. As maturity increases, the content of pigments such as carotenoids, anthocyanins, and chlorophyll in the fruit skin changes, leading to alterations in spectral reflectance characteristics. Color space models such as RGB, HSV, and Lab are commonly used to quantify these changes. For example, the transition of bananas from green to yellow during ripening can be monitored by an increase in the b* channel (Lab color space), while the Red Color Index is often applied to grade tomatoes. To improve detection accuracy, multispectral or hyperspectral cameras have been introduced, enabling the collection of reflectance data from the near-ultraviolet to near-infrared ranges. The use of spectral indices (e.g., NDVI, GCI, RVI) further enhances the characterization of the maturation process [35].
To monitor internal compositional changes, focus is placed on the dynamic evolution of moisture content, sugar, starch, acidity, proteins, and aromatic substances. Near-infrared spectroscopy (NIRS) and hyperspectral imaging (HSI) are currently the most widely used non-contact techniques [36]. They leverage the absorption characteristics of water, carbohydrates, fats, and other components at specific wavelengths during ripening for rapid identification. For example, Zhao Et Al. utilized near-infrared hyperspectral imaging combined with deep learning to achieve rapid non-destructive testing and maturity grading of processing tomatoes. Their approach involved Savitzky–Golay smoothing for noise reduction, extraction of average spectral features, and the establishment of models using RF, PLS, and RNN algorithms. Optimization was achieved through feature wavelength selection. The process is illustrated in Figure 5. Results showed that the RNN outperformed RF and PLS in maturity classification accuracy, and the predicted R2 values for quality parameters all exceeded 0.87, significantly surpassing traditional methods [37].
Furthermore, for more precise compositional detection, such as the breakdown of starch, accumulation of reducing sugars, and release of volatile compounds, techniques including Raman spectroscopy, Fourier-transform infrared spectroscopy (FTIR), or dielectric property analysis can be introduced. Raman spectroscopy is highly sensitive to molecular vibrations of organic compounds (e.g., starch, pectin) and performs excellently in detecting saccharification processes in fruits such as kiwifruit and apples. Meanwhile, FTIR demonstrates strong capabilities in modeling characteristic peaks of water and proteins (around 1640 cm−1 and 1530 cm−1) [38].
In recent years, with the proliferation of fruit and vegetable harvesting robots and mobile devices, maturity detection systems have increasingly evolved toward lightweight and real-time operation. By integrating near-infrared, spectroscopic, or vision modules at the end-effector of robotic arms, real-time assessment of individual fruit maturity can be achieved during scanning [39]. Additionally, some systems have incorporated edge computing architectures to perform image analysis and attribute prediction locally, significantly reducing harvesting response delays. In scenarios with clustered fruits and complex occlusions, studies have also improved the stability and generalization of maturity target detection through regional attention mechanisms or multi-scale feature fusion networks [40].
In summary, accurate detection of maturity in fruit and vegetable crops is crucial not only for determining optimal harvesting timing and efficiency but also for directly influencing product quality control and commercial grading. This attribute integrates multifaceted information including color, chemical composition, and physiological status, necessitating collaborative advances in multi-sensor perception and intelligent model analysis [41]. As sensing and model deployment technologies continue to mature, future maturity detection systems will play an increasingly central role in precision harvesting and smart agricultural production.

2.2.2. Plant and Fruit Location

Plant and fruit location are critical spatial attributes in the harvesting of fruit and vegetable crops, directly influencing core decision-making tasks such as picking path planning, actuator control, and target selection strategies. This attribute encompasses not only the macroscopic arrangement of crops within the field (e.g., row spacing, plant spacing, planting density) but also the specific position of fruits in three-dimensional micro-space (e.g., the angle between the fruit and the main stem, height, lateral offset, etc.) [42]. In automated picking systems, the ability to accurately acquire the spatial location of plants and their fruits determines whether the harvesting equipment can efficiently avoid obstacles, precisely approach targets, and perform low-damage operations.
The importance of crop location perception in fruit and vegetable harvesting is primarily reflected in path planning and positioning accuracy control. On the one hand, obtaining the row structure information of crops in the field assists autonomous chassis or tracked platforms in achieving precise row alignment and correction, reducing lateral deviation errors and mis-picking risks. On the other hand, identifying the location of individual fruits guides robotic arms to avoid obstacles such as branches, stems, and vines, enabling safe and efficient approach to fruits within complex plant structures, thereby significantly improving operational success rates. Additionally, spatial location data can be used for prioritizing multiple targets and dynamically reconstructing paths, allowing rational scheduling of execution paths in densely clustered areas to avoid redundant movements and inefficient routes [43].
It is particularly important to emphasize that the varying growth structures and spatial distributions of different fruit and vegetable crops impose diverse requirements on plant location perception. For example:
Tree crops such as apples and citrus typically bear fruits on the outer canopy, characterized by large three-dimensional distribution ranges, severe occlusion, and thick rigid stems. This requires precise identification of the positional relationship of fruits within the branch network to ensure accurate force application by the end-effector [44].
Vine crops such as tomatoes, sweet peppers, and cucumbers often have fruits suspended between trellises or beneath branches, exhibiting high dispersion and drooping characteristics, and are easily obscured by foliage. This necessitates multi-view perception of the spatial posture of fruits.
Ground-growing crops such as watermelons and pumpkins often have fruits concealed under large leaves, with low ground height and complex backgrounds. This requires combining ground modeling and contour-following strategies to enhance recognition robustness [45].
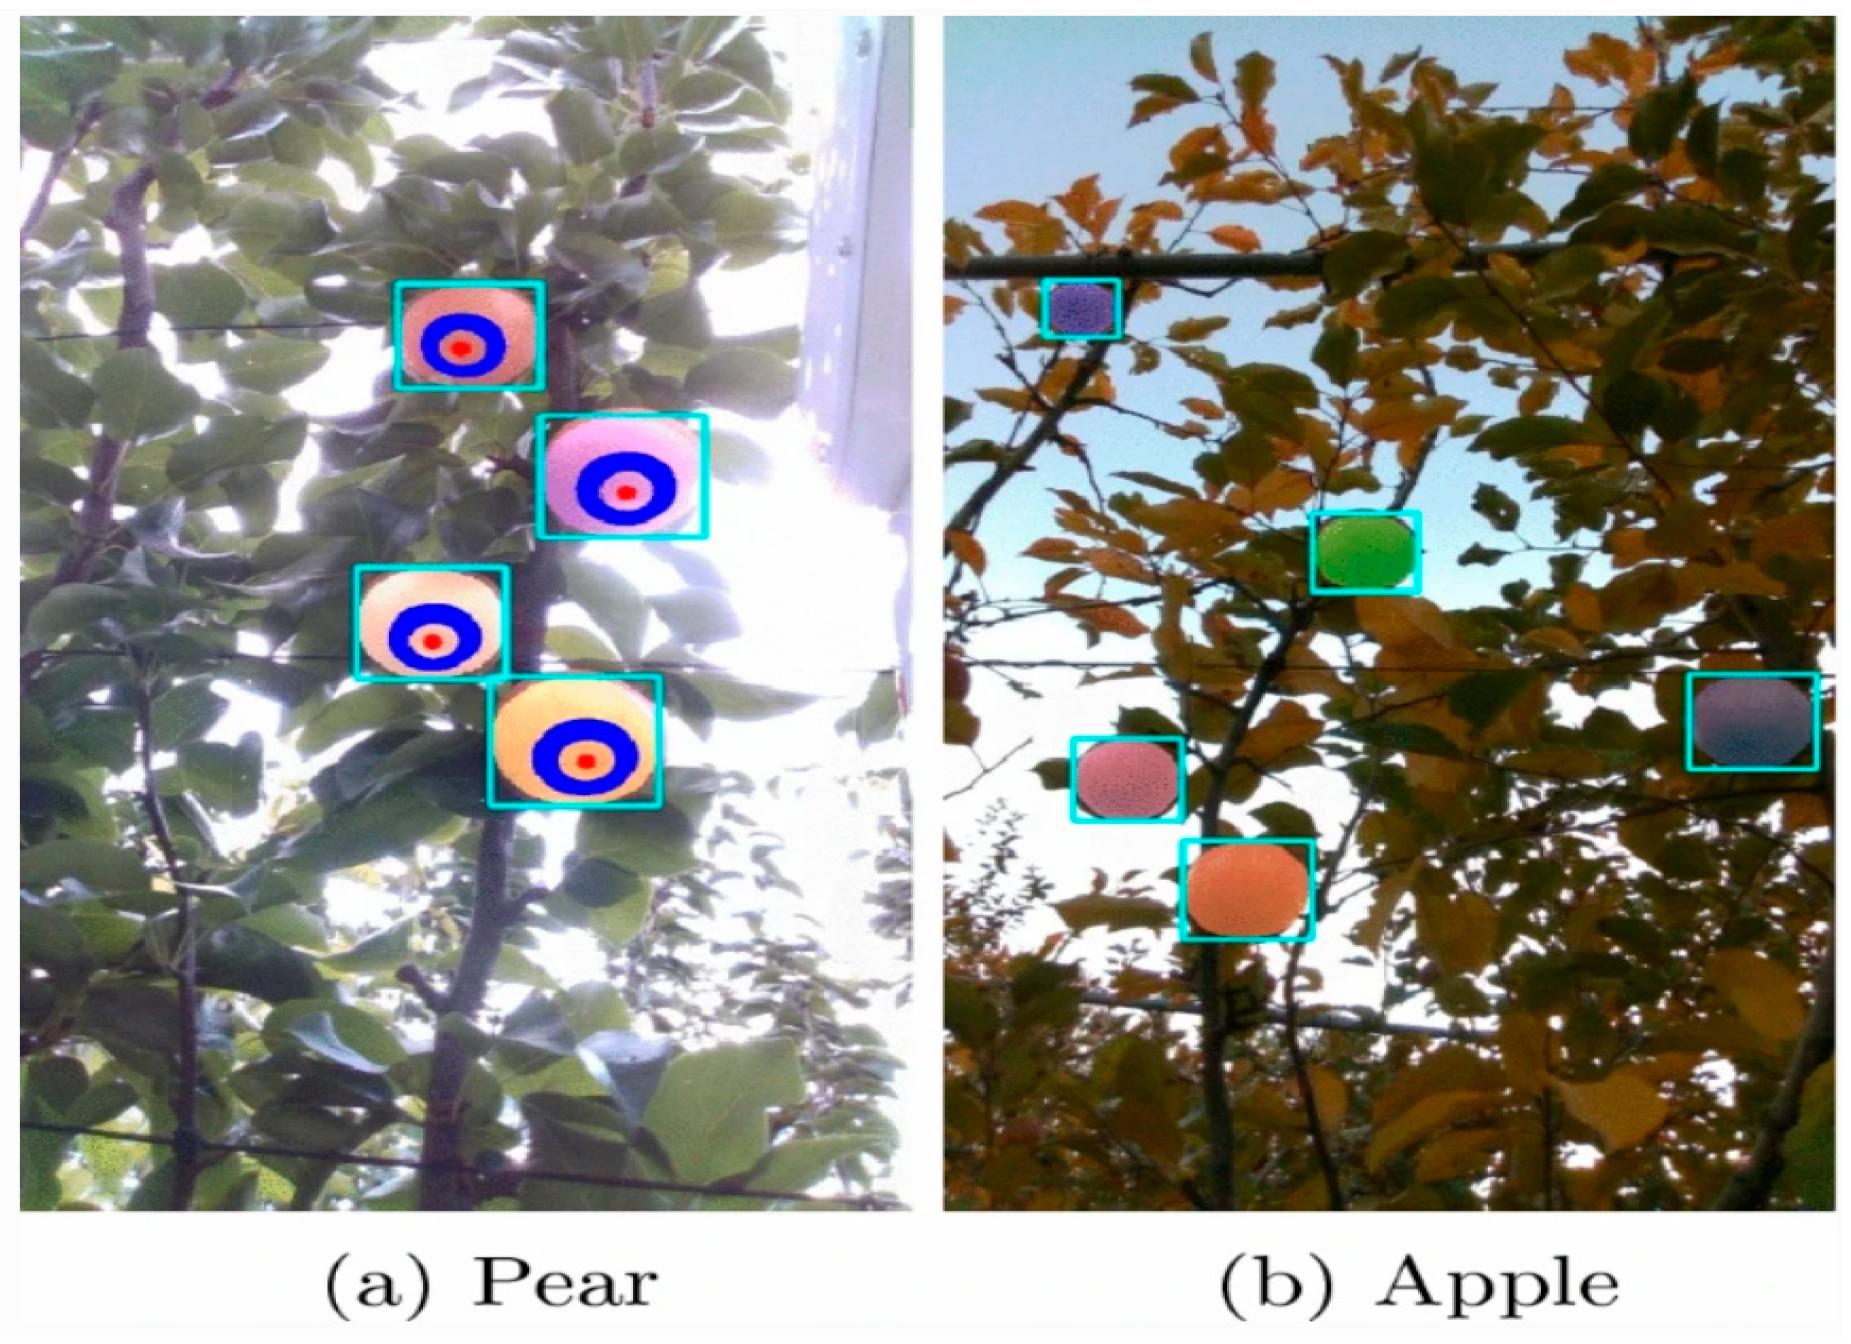
Therefore, tailored localization and perception mechanisms should be designed according to the specific plant architecture of different crops. The schematic diagrams of the spatial localization of the two types of fruits are shown in Figure 6.
In summary, as a fundamental attribute for spatial perception in harvesting systems, the accurate acquisition of plant and fruit location in horticultural crops not only supports critical functions such as actuator path control, obstacle avoidance, and picking motion planning, but also imposes higher requirements for 3D modeling accuracy and the robustness of localization algorithms under varying growing environments and plant architectures. In the future, with advancements in multi-sensor fusion, real-time 3D mapping, and semantic perception technologies, location sensing capabilities will further evolve toward higher precision, timeliness, and adaptability to complex environments [46,47].

2.2.3. Crop Quality

Crop quality is one of the core attributes that requires focused detection during the fruit and vegetable harvesting process, as it directly determines the commercial value and storage/transport performance of agricultural products. In horticultural crops, quality is primarily manifested in whether the fruits are healthy and intact, and whether they exhibit issues such as pest and disease infestation, mechanical damage, rot, or softening. Quality-related problems often feature diversity, locality, and irregularity. They are not only unevenly distributed but may also present visually as subtle discolorations, deformed areas, or textural changes, thereby placing higher demands on the accuracy and robustness of perception systems in automated harvesting operations [48].
Quality perception typically relies on multimodal visual features. Color change is the most direct indicator for identification; for instance, diseased areas often appear darker, yellowish, or locally discolored, while mechanically damaged regions may show irregular edges and rough textures. Thus, RGB imaging remains one of the primary data sources. In some cases, however, relying solely on visible light information may be insufficient to detect hidden or early-stage lesions. To address this, sensors such as near-infrared (NIR), thermal imaging, and hyperspectral imaging (HSI) are increasingly being incorporated [49]. For example, near-infrared bands can be used to assess changes in internal sugar content and moisture levels; thermal imaging can reveal localized temperature anomalies caused by diseases; and hyperspectral imaging enables the extraction of reflectance characteristics of lesions across multiple spectral bands, allowing for earlier and more comprehensive quality identification [50].
The growing environments and structural characteristics of different fruits and vegetables impose distinct requirements on quality perception. For instance, tree fruits such as apples and pears typically have smooth surfaces, making diseased spots relatively easy to detect. In contrast, fruits with complex skin structures and strong reflectivity—such as strawberries and grapes—are prone to highlights or artifacts in images, necessitating enhanced imaging techniques and occlusion modeling to improve recognition robustness. For vine-grown produce like cucumbers and bitter melons, which are often hidden beneath foliage and susceptible to shading, multi-angle imaging and object tracking methods are required to increase visible coverage. Additionally, detecting post-harvest mechanical damage requires incorporating fruit firmness models or mechanical sensing mechanisms to compensate for the limitations of vision-only inspection [51,52].
In summary, as a critical step in automated harvesting systems for evaluating crop health and market value, fruit and vegetable quality inspection requires not only high-precision, multi-scale, and multi-modal perception systems, but also flexible and efficient recognition mechanisms tailored to produce varieties, growth structures, and harvesting rhythms.

3. Techniques for Crop Attribute Sensing

3.1. Data Sensor

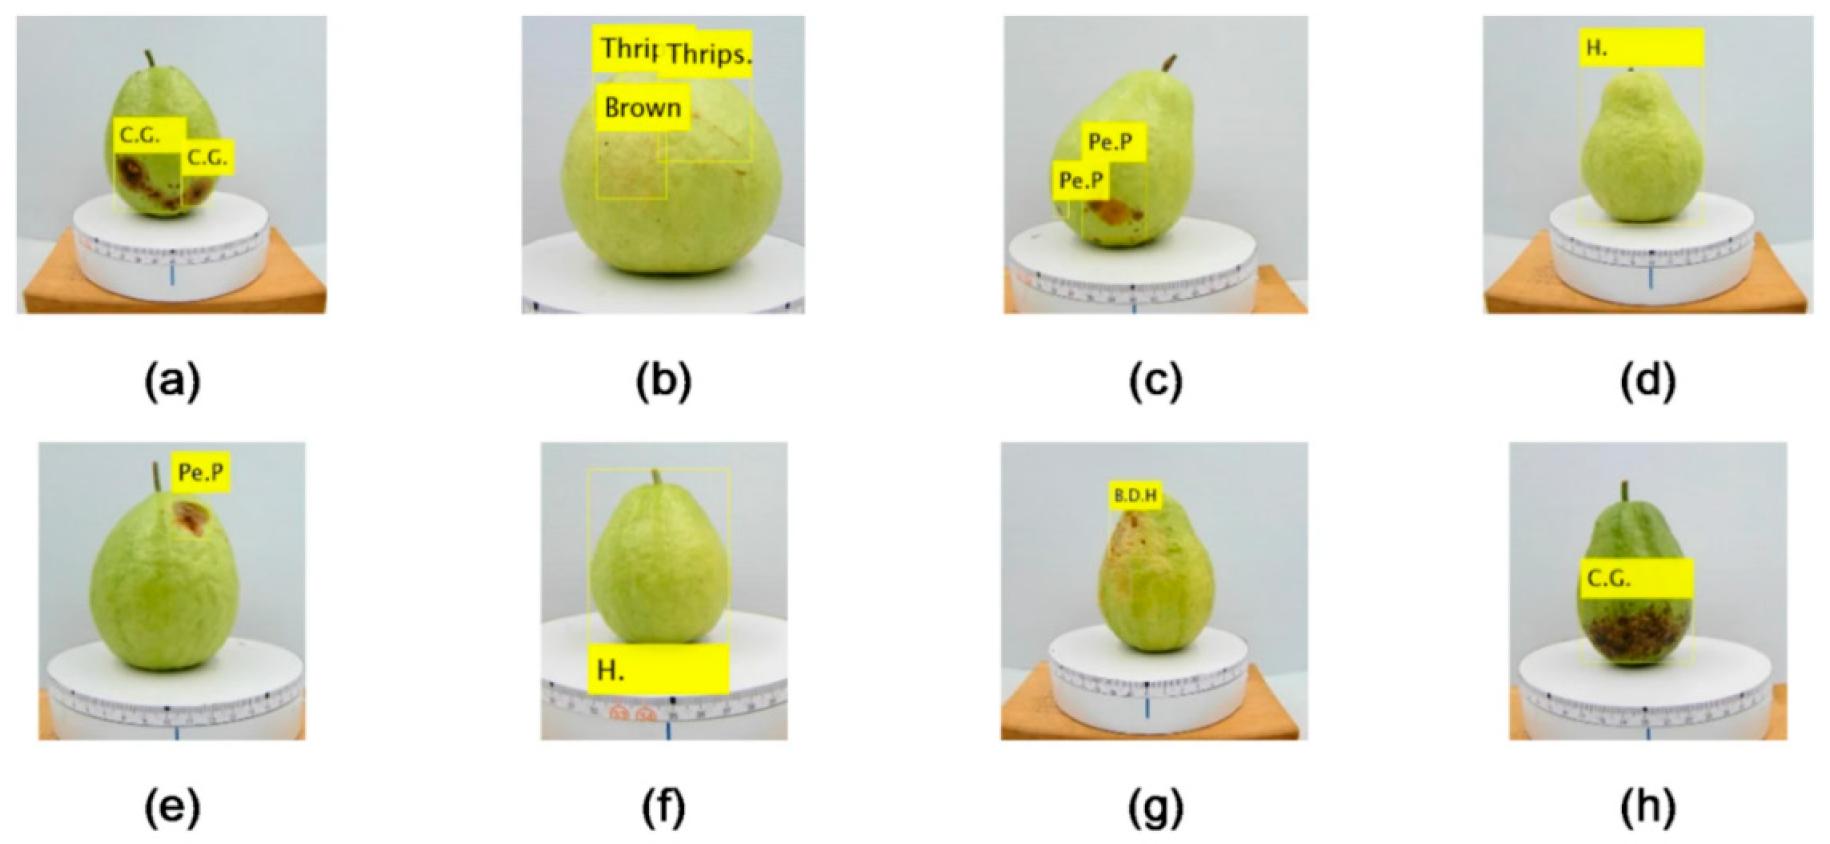
In agricultural crop harvesting detection, sensors serve as the primary means of acquiring information about the environment and crop attributes, directly determining the dimensionality, accuracy, and stability of data perception [53]. By capturing visual information such as color, morphology, texture, and spectral characteristics [54], data sensors can accurately identify crop growth status, maturity, quality grade, and other critical information, for example Figure 7 exhibits some of the image recognition results of the training and test sets. Figure 7a–d present some of the image recognition results of the training set. Figure 7a shows an example of Colletotrichum gloeosporoides in the training set. As shown in Figure 7b, a single image may contain more than one type of defect; this figure shows damage from thrips and browning. Figure 7c shows an example of Pestalotiopsis psidii and Figure 7d displays a healthy fruit with no defects. Figure 7e–h present some of the image recognition results of the test set. Figure 7a shows an example of Pestalotiopsis psidii in the test set. Figure 7f displays a healthy fruit with no defects. Figure 7g shows an example of damage from Bactrocera dorsalis Hendel. Figure 7h shows an example of Colletotrichum gloeosporoides. thereby enabling precision operations and improving harvesting efficiency.
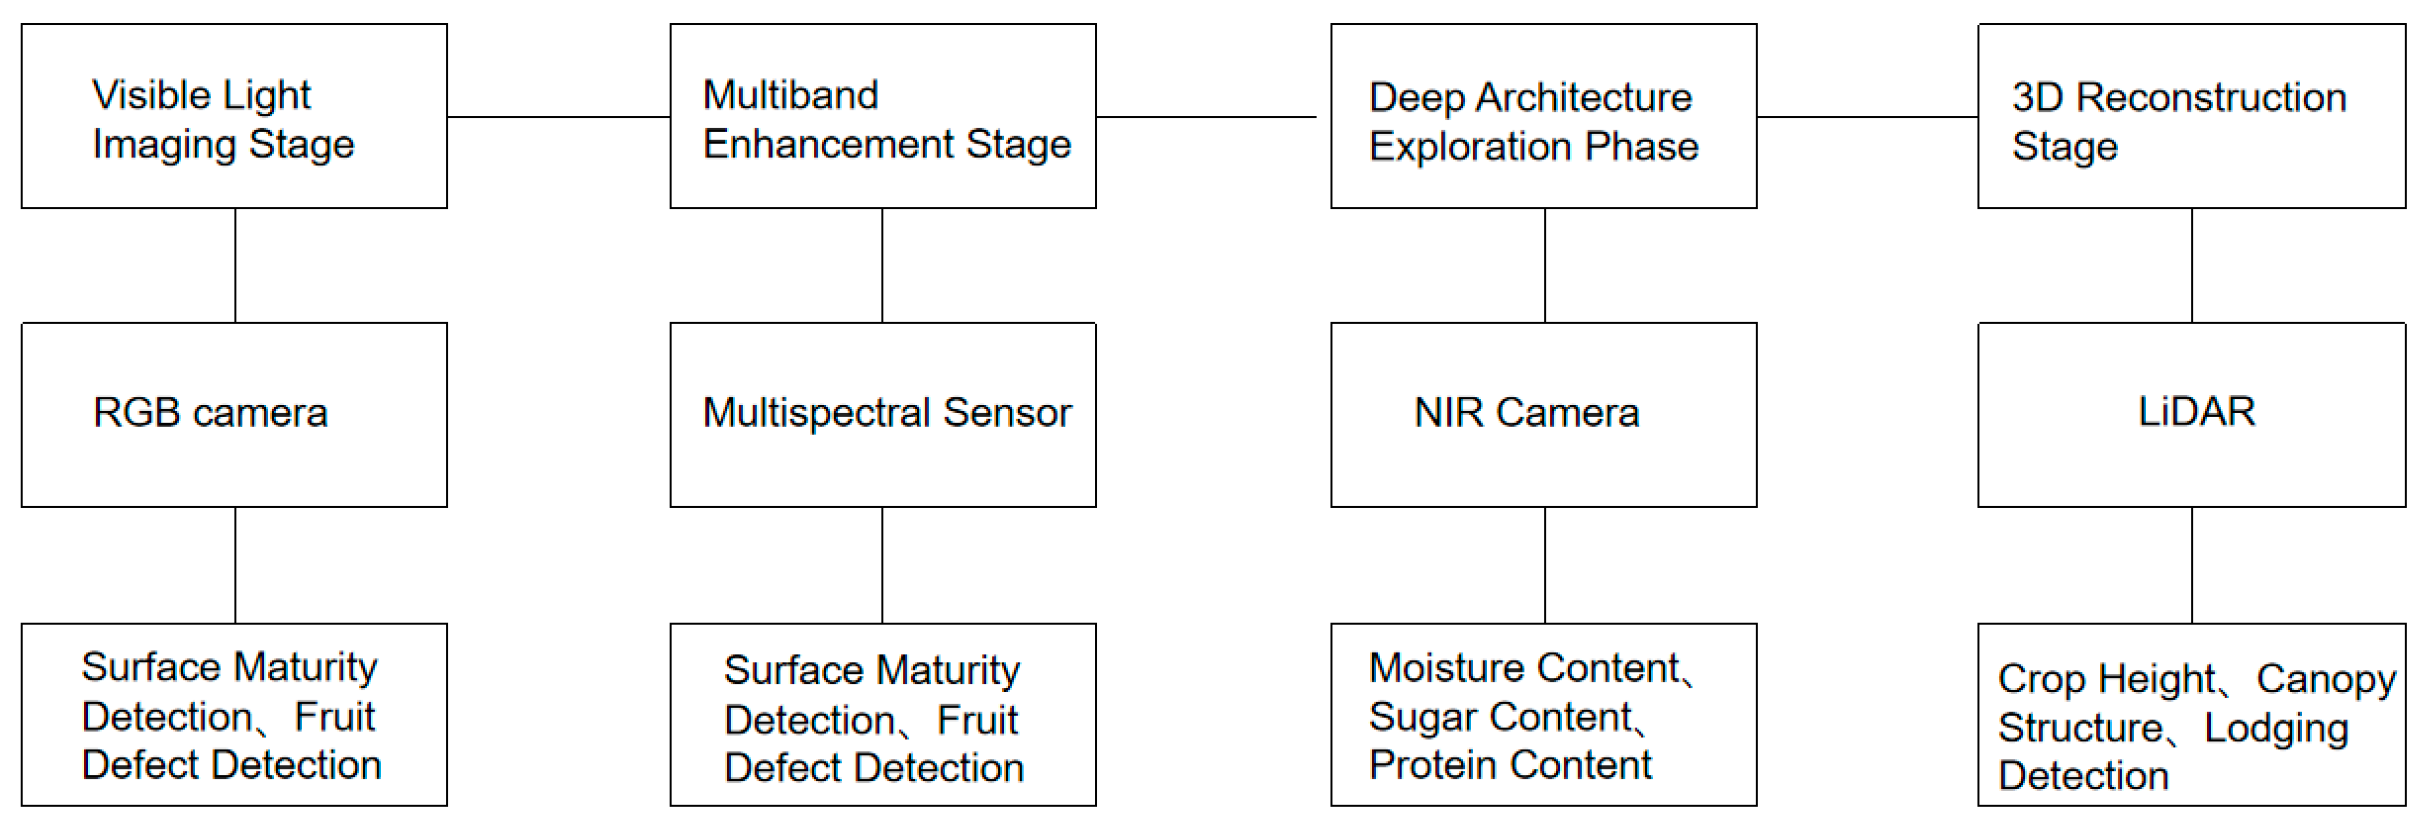
The directions of data sensors broadly encompass two-dimensional visible light information acquisition, multi-band spectral fusion, three-dimensional structural modeling, and internal physiological parameter detection. The application of each type of sensor contributes to continuous improvements in crop recognition accuracy, target dimensionality, and decision-making depth, forming a richly layered technological framework [55]. This section will discuss these sensor technologies, systematically reviewing the current optical hardware technological system and its application pathways in crop harvesting detection, as illustrated in Figure 8. Comparison of Core Sensing Technologies for Crop Attribute Monitoring as illustrated in Table 1.

3.1.1. Visible Light Imaging Stage: RGB Camera

RGB cameras represent the earliest and most widely adopted optical sensors in agriculture. They operate by capturing reflectance images within the visible spectrum through three primary color channels—red, green, and blue—to generate color images for crop characterization. Their working principle is based on detecting variations in image brightness and color resulting from differences in the reflectance of light from various crop surfaces [56]. Offering advantages such as low cost, ease of operation, and high image clarity, they have become a common tool for field monitoring, crop assessment, and harvest assistance.
In industrial production, RGB cameras are extensively used to identify crop appearance features, including size, shape, and surface defects, to support commodity grading and automated fruit sorting [57]. The physical diagram of the RGB camera is shown in Figure 9. For instance, Zhou et al. combined RGB-D depth information to propose an image processing method for detecting corn stalk diameter. This study utilized RGB images, depth images, and 3D point cloud data to extract stalk contours and skeletal structures, thereby enabling the computation of geometric parameters [58].
Beyond dimensional measurement, RGB cameras also excel in pest and disease detection, particularly in the early identification of leaf spots, discolorations, and other disease symptoms. One study developed an in-field disease classification model based on multi-sensor RGB-D imagery, which effectively removed background interference. Integrated with deep learning algorithms, the model achieved accurate recognition and categorization of major diseases in corn, enabling precise identification of infected regions and disease-type discrimination [59].
In current harvesting machinery platforms, RGB cameras often serve as fundamental vision sensors. Coupled with image processing algorithms, they perform tasks such as fruit counting, position tracking, and robotic arm navigation, making them a “standard” component in most automated agricultural equipment.

3.1.2. Multiband Enhancement Stage: Multispectral and Hyperspectral Sensors

Driven by the growing demand for higher precision in crop status monitoring, the limitations of RGB cameras—restricted to the visible spectrum—have become apparent. In response, multispectral sensors have emerged, capable of simultaneously capturing data across multiple specific spectral bands, including red, green, blue, and near-infrared (NIR), significantly expanding the dimensionality of crop data acquisition [60].
Unlike RGB images, which comprise only three channels, multispectral imagery incorporates several strategically chosen bands, enabling the calculation of key indices such as the Normalized Difference Vegetation Index (NDVI). These indices provide critical insights into crop health, nitrogen levels, and photosynthetic activity. For example, Mafuratidze et al. developed an NDVI threshold model using multispectral remote sensing data to successfully map and evaluate hail damage in sugarcane fields [61], offering valuable data for post-disaster replanning and management.
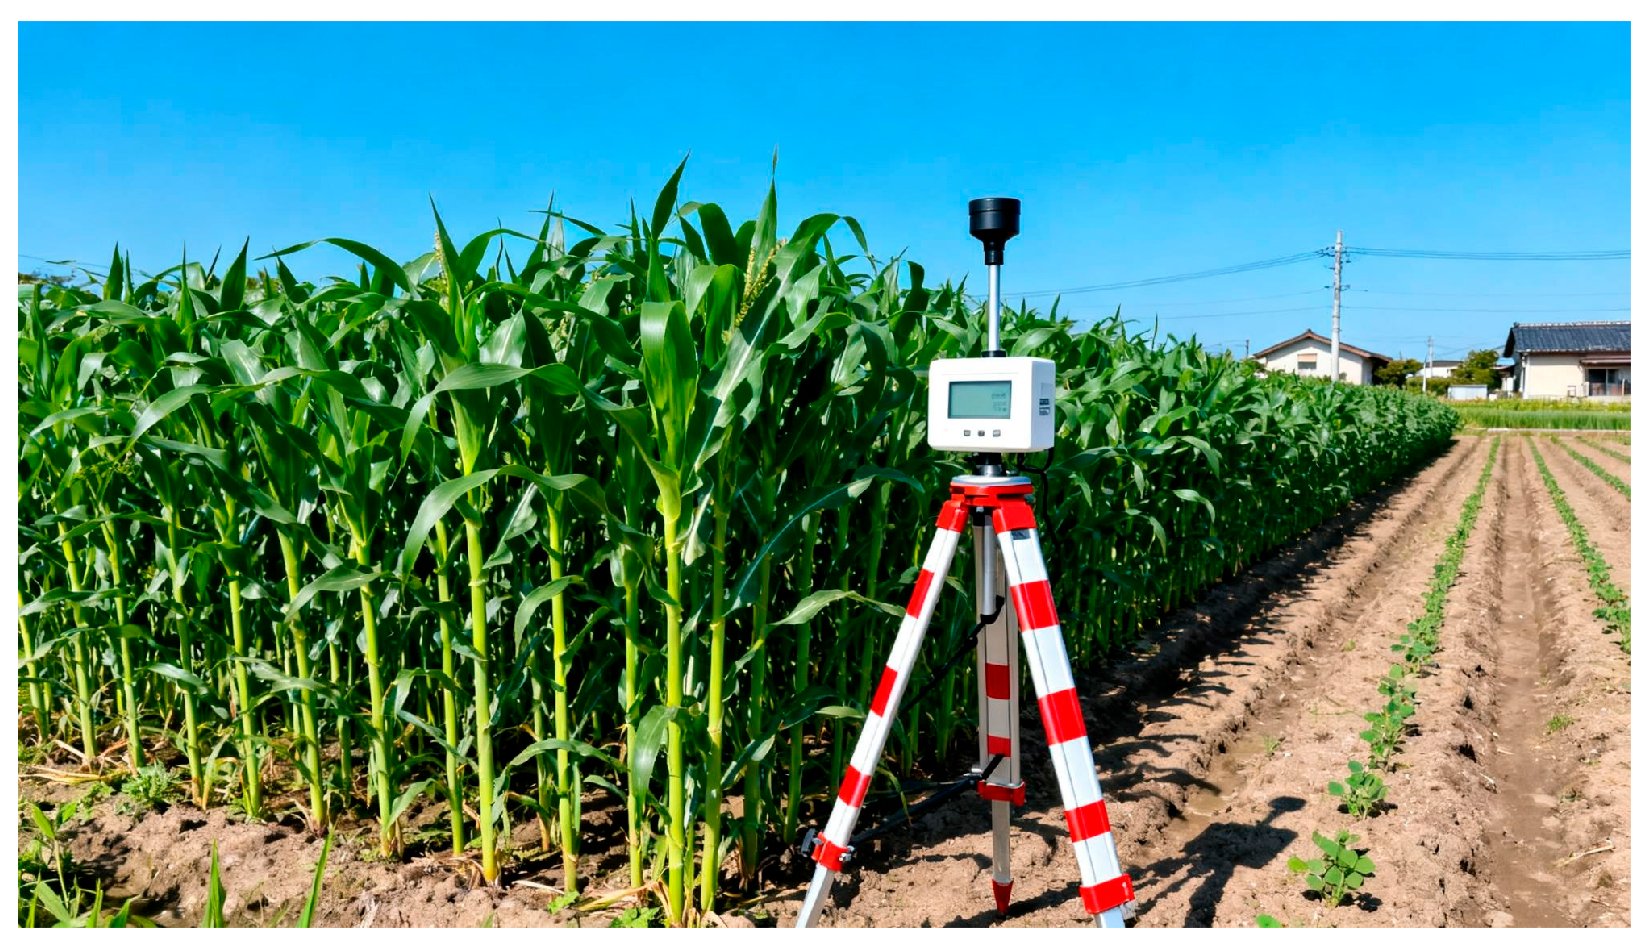
Multispectral sensors are often integrated into unmanned aerial vehicles (UAVs), automated inspection platforms, or satellite-based remote sensing systems. They are widely applied in large-scale field health monitoring, fertilizer recommendation generation, and disease hotspot identification. Due to their relatively simple data structure and low computational overhead, they have become a cornerstone of digital agriculture for broadacre farming [62]. The physical diagram and band information of the multispectral camera are shown in Figure 10.
Pushing the boundaries of precision further, hyperspectral imaging technology offers even greater analytical power. Hyperspectral sensors collect data contiguously across dozens or even hundreds of narrow spectral bands, obtaining a complete spectral signature for each pixel. This enables detailed analysis of microscopic crop characteristics. In contrast to the “discrete band” sensing of multispectral systems, hyperspectral setups typically employ spectrometers to decompose reflected light into high-dimensional information. When combined with machine learning algorithms, this capability supports high-precision tasks such as early disease screening, cultivar identification, and biochemical composition analysis [63].
Despite their irreplaceable role in precision agriculture research, the high cost and computational complexity of hyperspectral systems pose challenges for real-time application and operational scalability. Widespread adoption will depend on further algorithmic refinement and hardware integration efforts.

3.1.3. Subsurface Structure Probing Stage: Near-Infrared (NIR) Imaging

Near-Infrared (NIR) Cameras are optical sensors capable of capturing light within the near-infrared spectrum. As the focus of agricultural monitoring shifts from superficially visible traits to internal structural and compositional attributes, NIR imaging technology has become a vital tool for crop quality assessment. Operating within the 700–1400 nm wavelength range, NIR light offers considerable penetration depth and captures spectral responses associated with internal constituents such as sugars, moisture, and proteins [64]. Consequently, NIR cameras provide insight into the physical and chemical properties of crops, going beyond superficial color and morphological features.
NIR cameras function by detecting spectral reflectance within the NIR band. When NIR light irradiates a crop surface, a portion is absorbed while the rest is either reflected or transmitted through internal tissues. Differences in chemical composition result in distinct reflectance profiles, which NIR cameras capture to infer internal qualities such as water content, sugar levels, and protein concentration [65,66]. These reflectance data are converted into digital signals and processed to evaluate crop health, maturity, and disease status. The ability of NIR radiation to penetrate surface structures and convey physiological information makes NIR cameras highly valuable in modern agriculture.
Water is a critical factor in crop growth, and NIR cameras can assess plant water status by analyzing reflectance patterns. Well-hydrated plants typically exhibit higher NIR reflectance, whereas water-stressed plants show lower reflectance. Monitoring moisture levels helps determine optimal harvest timing and informs post-harvest storage and transportation strategies. Real-time hydration data allow farmers to adjust irrigation schedules, prevent over- or under-watering, conserve water, and increase yield. Zhang et al. proposed a novel method for in situ imaging of water and nitrogen content in live corn leaves using an NIR camera with interference filters [67]. They developed a portable, low-power imaging device with multi-wavelength resolution. By identifying feature wavelengths and simulating hyperspectral data, the system achieved non-destructive visualization of moisture and nitrogen distribution in maize leaves. This approach offers significant advantages in predetermining crop water status before harvest, supporting the identification of ideal harvesting windows and enabling real-time adjustment of intelligent agricultural machinery [68].
NIR cameras are also effective in detecting crop damage by identifying physiological changes caused by external factors such as physical impact, disease, or pests. Damaged tissues often exhibit spectral signatures distinct from those of healthy plants. These anomalies can be captured and analyzed via NIR imaging to enable early warning and precise identification. Tian et al. introduced an early bruise detection method for apples using NIR imaging combined with an adaptive threshold segmentation algorithm [69]. The researchers constructed an NIR imaging system to acquire full-band images of sound apples, as well as apples with single and multiple bruises, capturing the stem, calyx, and equatorial sections. To mitigate interference from the stem, an adaptive threshold segmentation algorithm was developed alongside an image processing procedure involving high-pass filtering, feature extraction, adaptive thresholding, and Hough circle detection. This method improves sensitivity in detecting superficial abnormalities and allows for rapid removal of damaged produce before or during harvest, reducing the inclusion of defective items and increasing grading efficiency and marketable rate [70].
Furthermore, NIR cameras offer considerable advantages in assessing crop maturity and quality. Internal constituents such as water, sugars, and starch change during ripening, directly influencing spectral reflectance. For instance, sugar content typically increases as fruit matures, while water content often decreases. By tracking these patterns, NIR cameras enable precise maturity evaluation, helping avoid premature or delayed harvesting [71]. Accurate maturity assessment is essential for identifying the optimal harvest period—early picking may compromise flavor, while late harvesting can reduce storability and shelf-life. Kathirvelan et al. developed an infrared thermal emission-based sensor for detecting ethylene release during fruit ripening [72]. When ethylene is introduced into the optical path between an infrared source and a temperature detector, it absorbs infrared waves and lowers the detector’s surface temperature. The resulting signal is converted into an electrical output that directly correlates with ethylene concentration. This sensing mechanism can be integrated into smart picking devices to dynamically monitor fruit maturity and support autonomous harvesters in making timely, quality-based decisions during field operations. The near-infrared images of corn leaves under different nitrogen levels are shown in Figure 11.
In summary, NIR cameras are widely employed across multiple stages of agricultural harvesting due to their unique ability to penetrate surface layers and retrieve physiological information from within crops. Whether applied in water management, disease monitoring, maturity assessment, or damage detection, NIR imaging provides efficient and accurate solutions.

3.1.4. Three-Dimensional Reconstruction Stage: LiDAR

LiDAR (Light Detection and Ranging) is a technology that measures the distance and spatial characteristics of objects by emitting laser pulses and calculating their return time. It not only accurately captures the three-dimensional morphology of objects but also provides detailed information about surface properties, making it widely applicable in agriculture [73]. LiDAR offers high-precision spatial data for crop monitoring, particularly suited for measuring height, density, and canopy structure. By precisely quantifying crop height and canopy architecture, LiDAR supports the prediction of optimal harvest timing, thereby enhancing the efficiency and accuracy of harvesting operations.
In simple terms, LiDAR operates by emitting laser pulses and measuring their time of return to calculate distances. The process can be broken down as follows: the LiDAR system emits highly focused, short-duration laser pulses at very high speeds. When a pulse hits a surface, a portion of the light is reflected back to the LiDAR sensor. Depending on the surface characteristics of the target, the intensity of the reflected signal varies. The LiDAR receiver detects the returning light and records properties such as intensity and time-of-flight. Using this information, the system calculates the distance to the object. By analyzing the return times of millions of pulses, LiDAR generates detailed 3D point clouds, enabling precise analysis of crop attributes and providing critical data for determining the best time to harvest [74].
Beyond crop monitoring, LiDAR is also valuable for assessing soil and terrain variations. It produces high-resolution digital terrain models (DTMs) that can be used to analyze soil type, moisture levels, and drainage efficiency [75]. Integrating crop and soil 3D data allows farmers to better understand soil dynamics and develop tailored management strategies, thereby supporting soil condition assessment during the harvest period. Turner et al. investigated the use of airborne LiDAR for estimating agricultural soil surface roughness and validated the method against traditional ground measurements [76]. The study collected two datasets using a laser scanner alongside ground surveys, focusing on the accuracy and precision of LiDAR-derived estimates. The results showed strong agreement between LiDAR-derived root mean square surface heights and ground measurements, with high stability and consistency across repeated scans. This demonstrates the significant potential of LiDAR for large-scale monitoring of soil roughness changes.
In summary, LiDAR provides powerful data support for crop monitoring, soil assessment, and precision agriculture management. Through high-resolution 3D scanning, it accurately measures key crop attributes such as height, canopy structure, and density, offering essential insights into crop growth conditions. Furthermore, LiDAR aids in evaluating soil type, moisture, and drainage efficiency, contributing to improved agricultural management [76]. As the technology continues to advance and become more cost-effective, LiDAR is poised to play an increasingly important role in precision agriculture, enhancing the efficiency and accuracy of crop harvesting.

3.2. Data Analysis

In the scenario of modern agricultural harvesting, relying solely on sensor hardware to collect crop attribute information still cannot meet the multiple requirements of detection accuracy, real-time performance, and adaptability. The efficient analysis and structured processing of multi-source sensory data, as well as the accurate identification of key crop features from it, are crucial links to improve the intelligence level of harvesting.
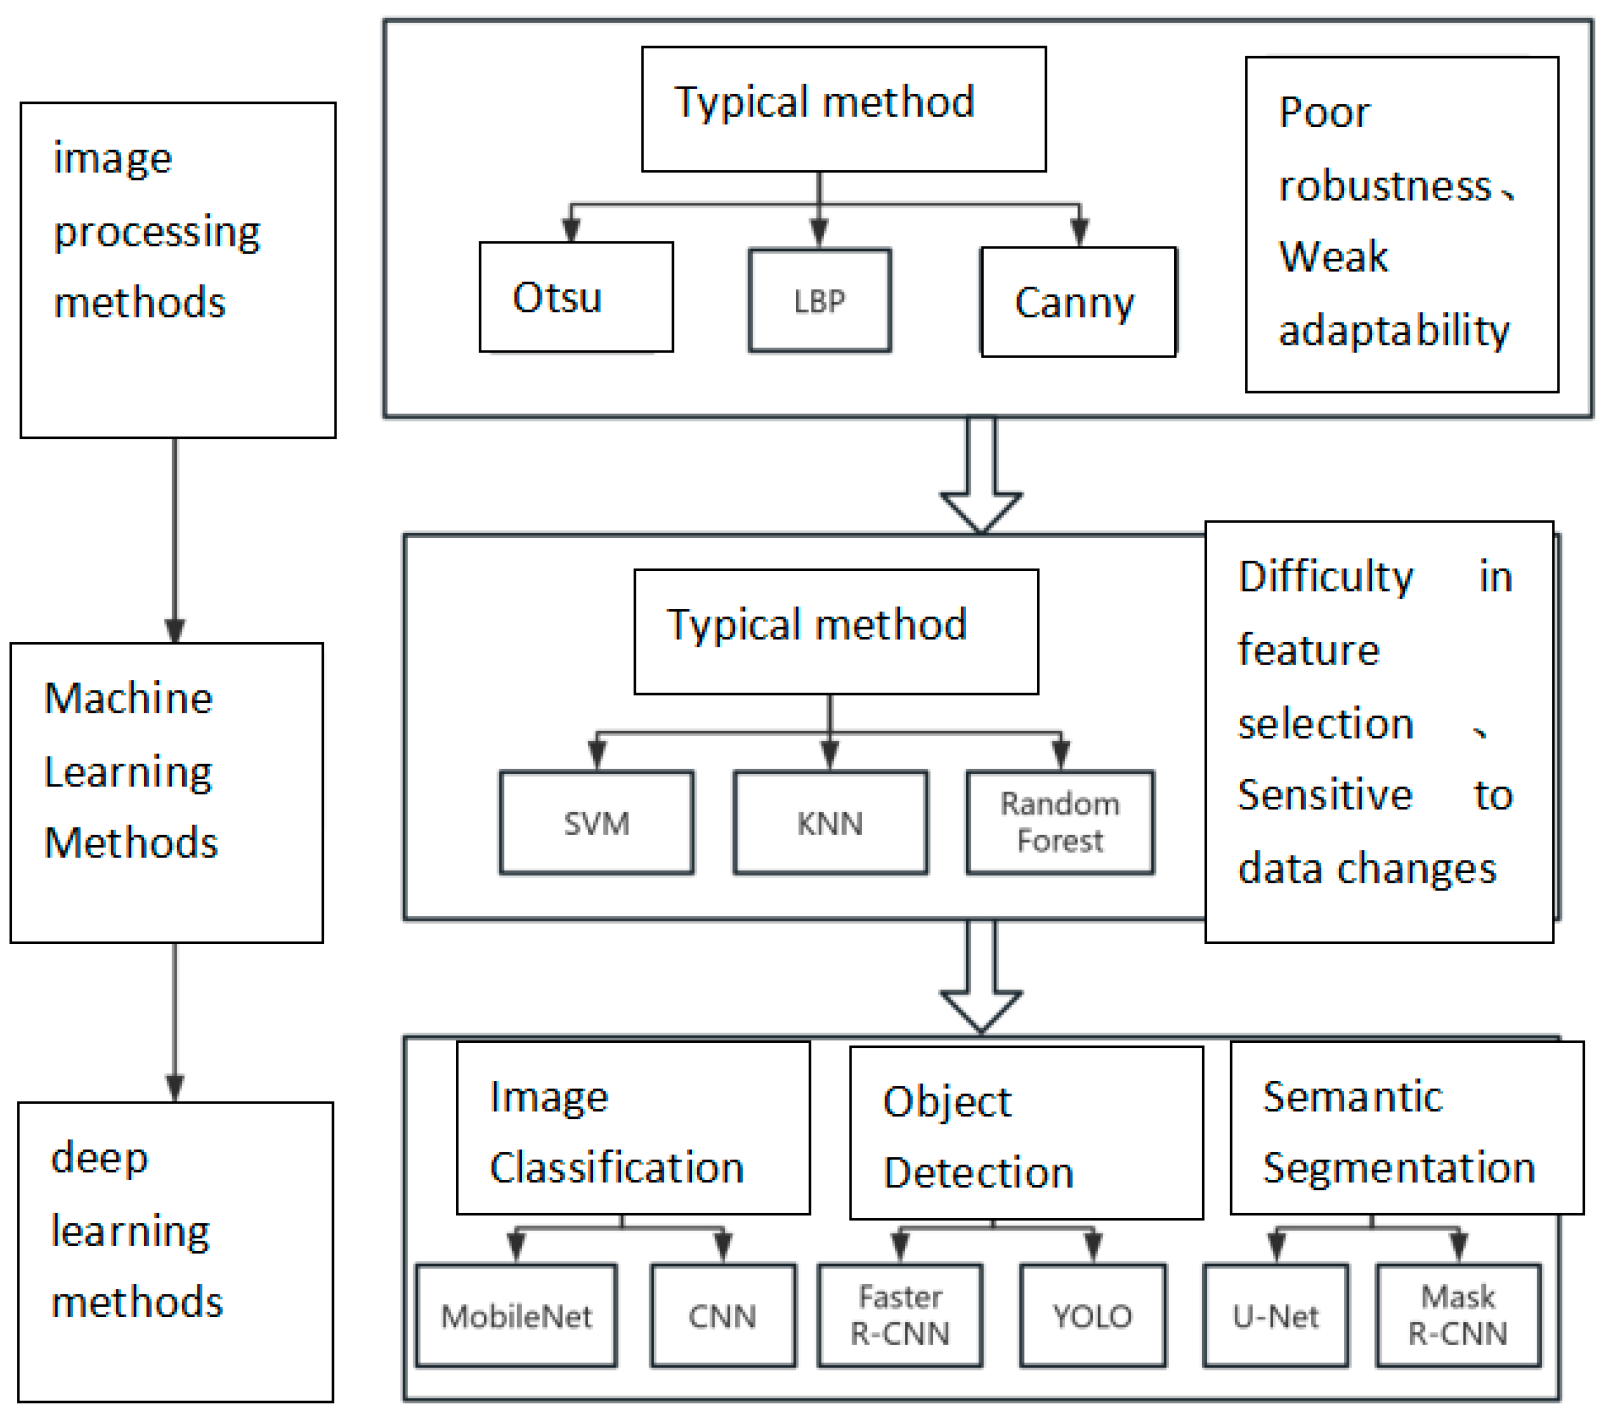
From the perspective of detection methods, this section classifies current mainstream technologies into four categories according to the main task types of crop attribute detection, namely target detection, classification and recognition, image segmentation, anomaly recognition, and quality evaluation. Each category of methods covers the evolution process from traditional algorithms to deep learning models, and their analysis is conducted in combination with typical harvesting application scenarios [77]. The classification of data analysis methods for crop attribute detection is shown in Figure 12.

3.2.1. Image Classification

Image classification methods are widely applied in agricultural harvest attribute detection, particularly suitable for tasks such as variety identification, maturity judgment, and quality grade evaluation. Their core lies in mapping an entire image to specific categories, thereby enabling the discrimination of crop states. Before or during harvest, quickly and accurately determining crop attributes facilitates intelligent graded harvesting, timely picking, and precise operation scheduling—making it a crucial link in the agricultural information perception process [78].
Early image classification methods relied on manually designed low-level image features, such as color histograms, texture statistics, and edge morphologies. These features exhibit a certain degree of effectiveness under static conditions with clean backgrounds, and can assist in tasks like fruit type identification and basic health grade classification [79]. However, in actual field environments, issues such as lighting variations, plant overlap, and fruit occlusion lead to high instability in the low-level features of images, which in turn affects classification accuracy. Additionally, manual feature extraction depends on experience and domain knowledge, lacking generality and adaptability, and it is also difficult to address inter-category ambiguity in large-scale data [80].
To overcome these limitations, Convolutional Neural Networks (CNNs) have been widely introduced in agricultural image classification tasks. Through a multi-layer perception mechanism, CNNs extract high-level semantic features (such as edges, textures, and shapes) layer by layer and construct learning models, significantly improving the accuracy and generalization ability of image classification [81,82]. During harvest operations, CNN-based recognition systems can efficiently distinguish between fruits of different varieties and crops at different maturity stages, thereby guiding the selection of harvesting strategies and the adjustment of mechanical parameters. (as shown in Figure 13).
To further meet the real-time detection requirements of agricultural machinery platforms, lightweight neural network models have gradually become the mainstream choice. For example, lightweight models such as MobileNet and EfficientNet compress the parameter scale through methods like bottleneck layer design and depthwise separable convolution, enabling the rapid deployment of tasks such as fruit maturity classification and crop grade identification on embedded devices. Studies have shown that the inference delay of simplified models in field environments can be controlled within 100 milliseconds, meeting the strict requirements of equipment such as combine harvesters for detection response time [83].
In addition, in recent years, some studies have explored embedding attention mechanisms into convolutional structures to enhance the model’s ability to perceive regional features. This structure exhibits particularly stable performance in scenarios with abundant background interference and unfixed fruit positions, improving the robustness of classification models in complex environments [84]. By integrating prior crop knowledge, temporal information, and harvest progress, image classification technology has been applied in scenarios such as fruit grading, harvest timing judgment, and automatic variety identification.
Although image classification methods have advantages such as flexible deployment and clear model structure, they are mainly suitable for tasks where the overall image features are distinct and category distributions are stable. In scenarios that require simultaneous localization and analysis of multiple crop targets, their capabilities have certain limitations. Therefore, they are usually used in combination with object detection methods and play a role in tasks such as preliminary screening or attribute identification in multi-stage perception systems [85].

3.2.2. Object Detection

Compared with image classification methods that can only output overall attribute labels, object detection methods can simultaneously obtain the position, category, and scale information of multiple targets in an image [86]. Thus, they have become a crucial supporting technology for key tasks in agricultural harvest scenarios, such as fruit counting, spike tracking, lesion localization, and harvest path planning. In intelligent agricultural machinery systems like combine harvesters and picking robots, these methods enable accurate recognition and real-time localization of multiple field targets.
Early object detection methods mostly relied on sliding windows and manual feature matching for region proposal and classification. For instance, detection frameworks based on Haar features and SVM classifiers were once used in tasks such as fruit detection and pest-damaged area demarcation [87]. However, such methods have high computational complexity and weak feature expression capabilities, making it difficult to meet the dual requirements of agricultural machinery operations for real-time performance and accuracy [88].
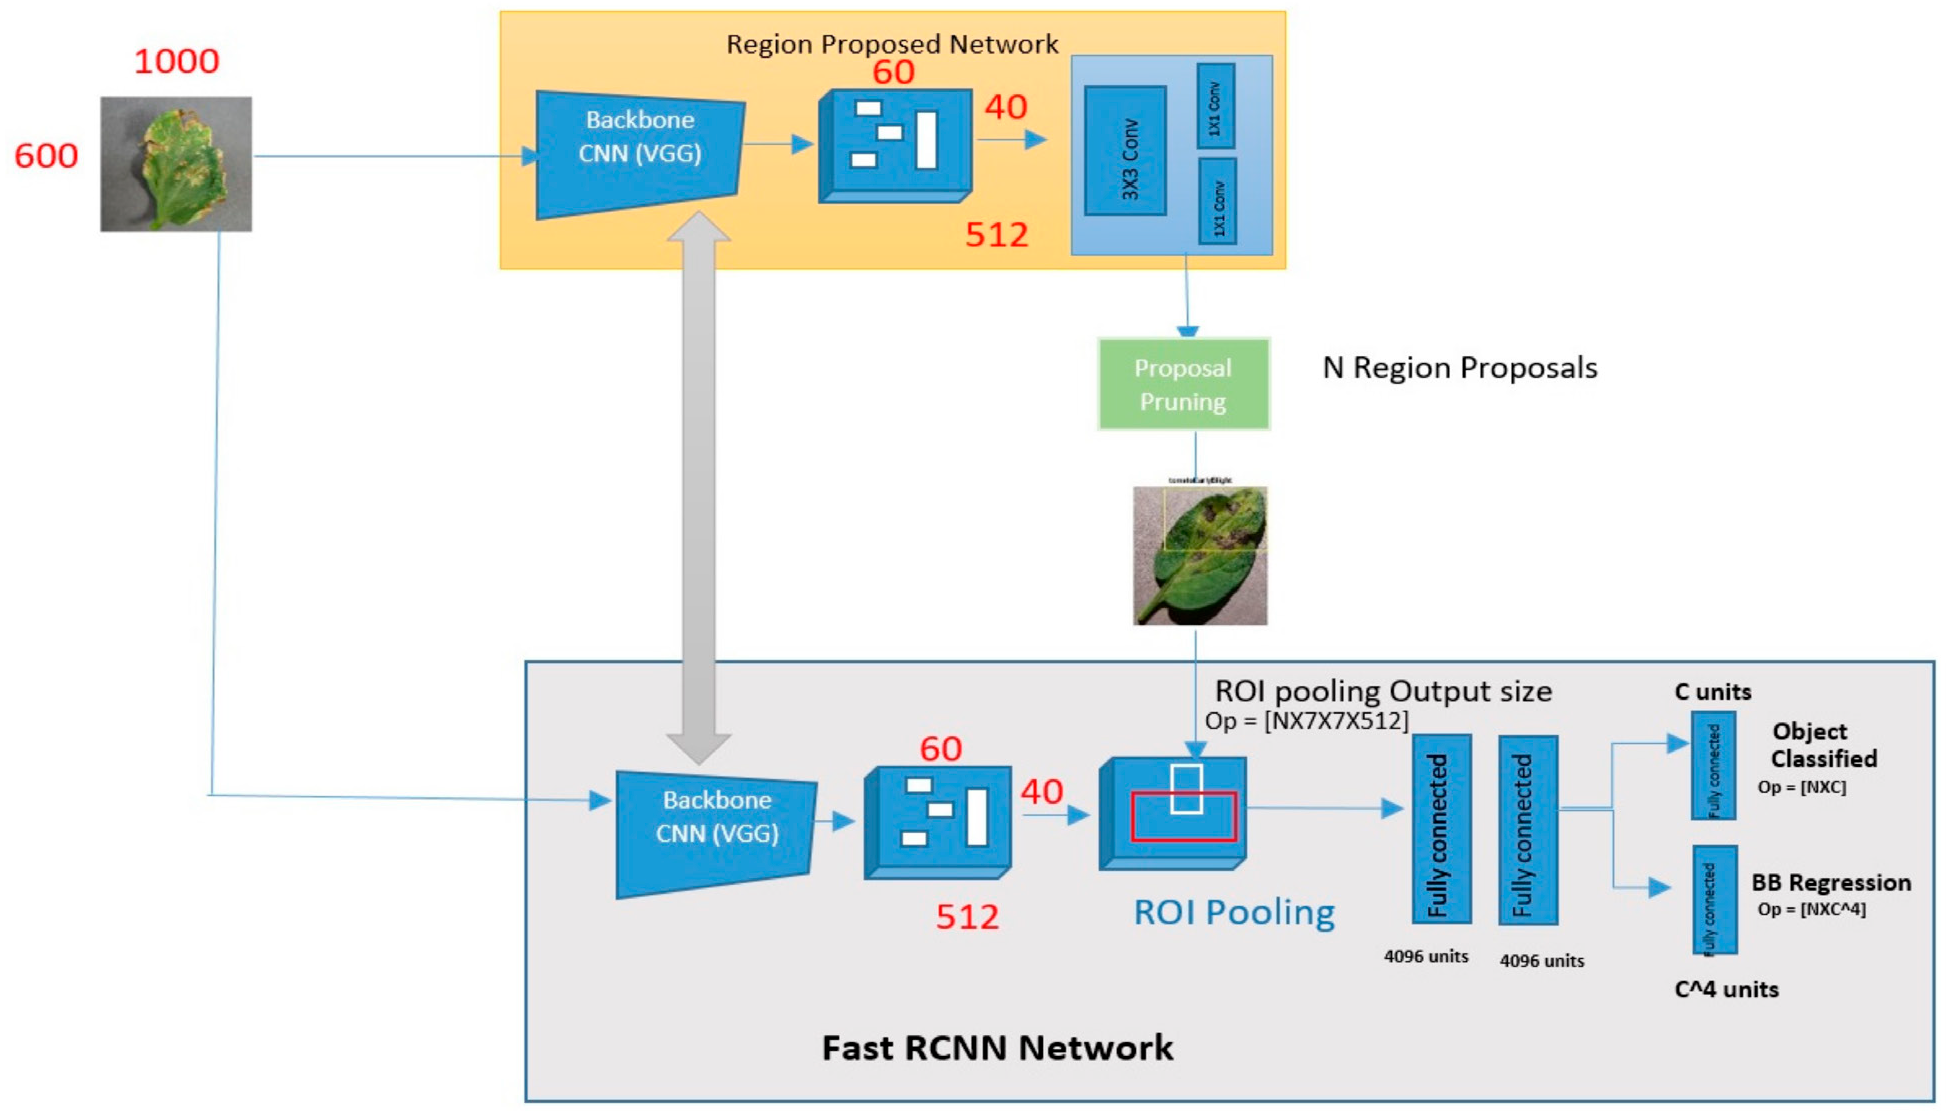
The introduction of deep learning has significantly advanced the development of object detection methods. Among them, two-stage detection models such as Faster R-CNN first generate target proposal regions through a Region Proposal Network (RPN), and then use convolutional neural networks to perform classification and bounding box regression for each region. These methods offer high detection accuracy and are suitable for detection tasks involving crops with small fruits, dense distribution, and complex morphologies [89]. For example, in tomato or grape harvesting, Faster R-CNN can effectively distinguish between fruits and leaves, accurately localize the positions of harvest targets, and support robotic arm path planning and fruit stem cutting operations [90]. (as shown in Figure 14).
Considering the detection speed requirements of harvesting equipment, recent studies have increasingly favored one-stage detection algorithms such as the YOLO series. YOLO divides an image into several grids, and each grid simultaneously predicts multiple target categories and position parameters, enabling integrated processing of detection and classification and significantly improving detection efficiency. On high-speed moving harvesting platforms, versions like YOLOv5 and YOLOv7 have been widely deployed in tasks such as fruit recognition and counting, demonstrating an excellent balance between detection accuracy and inference time [91,92,93].
In addition, considering that the 3D structural features of crops cannot be ignored in localization, object detection technology is gradually expanding toward directions such as RGB-D (Red-Green-Blue-Depth) data fusion and point cloud detection. By integrating LiDAR (Light Detection and Ranging) or structured light sensors, the system can simultaneously acquire the spatial depth information of targets, greatly improving localization accuracy in tasks such as corn ear localization and fruit spatial coordinate extraction. For example, using RGB-D images for object detection can effectively address issues such as fruit overlap and occlusion and large size variations, enhancing the robustness of multi-target detection [93,94,95].
It is worth noting that in harvest operation environments characterized by severe field lighting changes, complex target poses, and frequent motion blur, object detection models need to possess stronger generalization ability and real-time response performance. To this end, strategies such as image enhancement, hybrid attention mechanisms, and multi-scale feature fusion are commonly adopted in research to enhance the model’s robustness and multi-target recognition capability [96]. Furthermore, through lightweight detection models, model pruning, and quantization techniques, detection systems can achieve low-latency and high-frequency target perception and localization on agricultural machinery edge devices.
In summary, object detection methods provide crucial technical support for real-time perception in the crop harvesting process. Evolving from traditional methods to being driven by deep learning, they have been widely applied in tasks such as multi-target localization, fruit tracking, and spatial coordinate extraction.

3.2.3. Image Segmentation

As a crucial visual processing link in crop detection systems, image segmentation is dedicated to effectively separating target crop regions from the background in images, and on this basis, extracting key attribute features such as lesions, leaf boundaries, and lodging areas. Compared with tasks like object detection and attribute regression, image segmentation methods possess higher spatial resolution capabilities and can provide pixel-level information expression, making them widely applicable to various tasks such as disease identification, mature region extraction, spike segmentation, and harvest region labeling [97].
Early image segmentation methods were mainly implemented based on thresholds and edge operators. They separated regions of interest from the background by manually setting color or grayscale thresholds. Such methods exhibit certain effectiveness under controlled conditions; typical representatives include the Otsu adaptive threshold method [98] and the Canny edge detector [99]. However, in field environments, their stability and generality are limited due to the influence of lighting, shadows, and background interference. To improve robustness, subsequent studies gradually introduced color space transformations (e.g., HSV, Lab) [100] and morphological processing operations (e.g., erosion, dilation, closing) [101] to optimize segmentation accuracy.
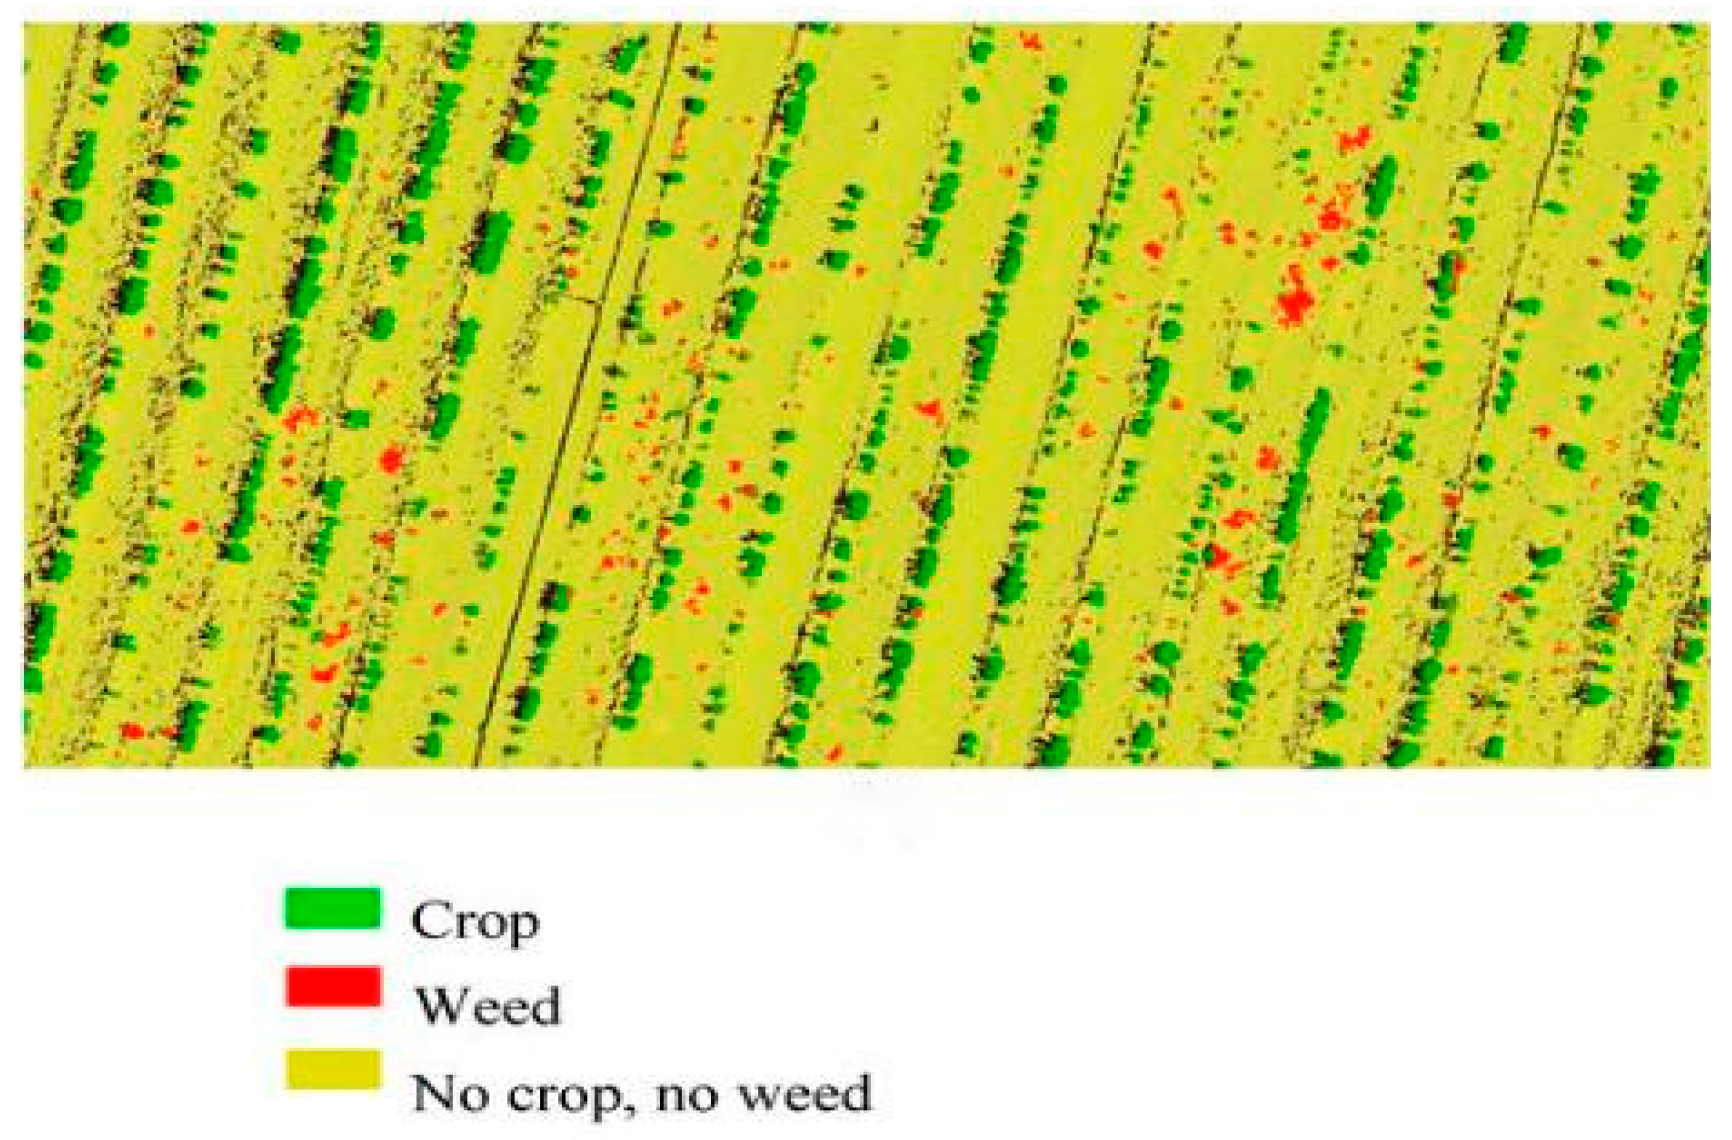
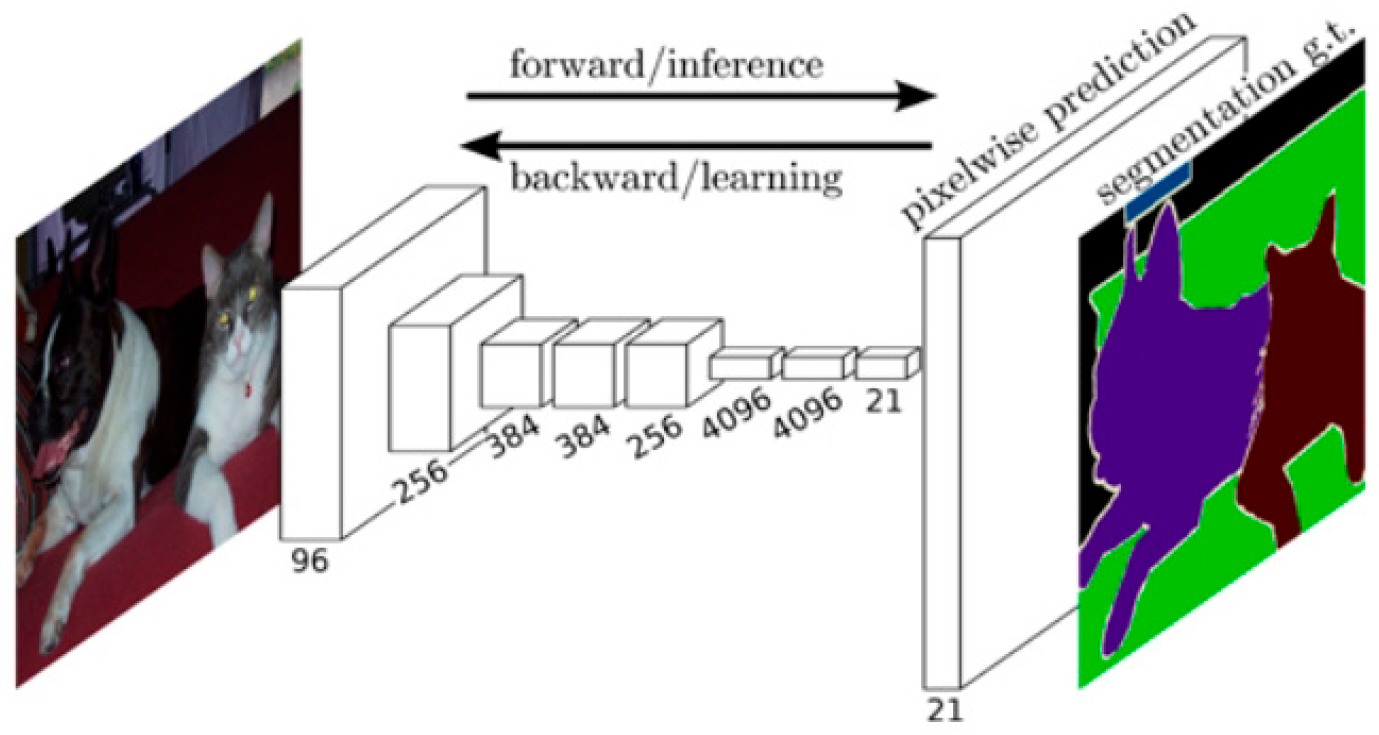
With the development of supervised learning, annotation-based segmentation models have gradually replaced traditional algorithms, and semantic segmentation in particular has become the mainstream approach. This type of method assigns semantic category labels to each pixel in the image, enabling detailed distinction between regions such as leaves, stems, fruits, and lesions. Among them, the Fully Convolutional Network (FCN) first realized end-to-end mapping from images to segmentation maps, laying a theoretical foundation for agricultural visual perception [102]. The subsequent U-Net structure, due to its skip connection design, enhances semantic understanding while preserving spatial details, and has been widely applied to tasks such as leaf segmentation and lesion region identification [103]. In typical scenarios such as wheat stripe rust, apple scab, and rice bacterial blight, U-Net and its improved structures (e.g., U-Net++, Attention U-Net) have been verified to achieve segmentation accuracy of over 90%.(as shown in Figure 15).
Compared with pixel classification-based structures such as U-Net, instance segmentation methods can simultaneously handle target localization and regional segmentation, making them particularly suitable for individual extraction of densely planted or overlapping crops. Models represented by Mask R-CNN have demonstrated excellent performance in tasks like fruit picking and spike separation. For example, in corn ear segmentation, the mechanism of “localization first, then segmentation” can accurately separate adjacent overlapping ears, providing precise input for subsequent quantity estimation and mechanical path planning [104].
In addition, for lesion region detection, recent studies have proposed combining image segmentation with attention mechanisms to enhance the model’s ability to recognize small targets and irregular boundaries. For instance, embedding SE modules (Squeeze-and-Excitation modules) and CBAM (Convolutional Block Attention Module) into the U-Net backbone network can effectively strengthen regional focus and improve segmentation accuracy when lesion boundaries are blurred or lighting conditions are complex [105]. On this basis, to alleviate the difficulty of agricultural image data annotation, some studies have also explored weakly supervised and semi-supervised segmentation methods. These methods complete segmentation model training through image-level labels, point annotations, or pseudo-labels, which reduces the data annotation burden to a certain extent and improves the model’s practicality in large-scale pre-harvest lesion surveys [106].
In harvest operations, image segmentation technology is not only applied to lesion detection but also used in tasks such as lodging area segmentation, spike contour extraction, and fruit integrity judgment. For example, using semantic segmentation to label lodging rice plants in different regions not only facilitates the statistics of lodging ratio and direction but also assists autonomous agricultural machinery in adjusting forward paths or avoiding incorrect harvest areas. In fruit harvesting scenarios, instance segmentation models can help separate occluded fruits from background branches and leaves, improving the localization accuracy and stability of robotic arm grasping [107].
In summary, image segmentation and lesion extraction technology has evolved from initial rule-based methods to high-precision perception solutions that integrate deep semantic modeling, attention mechanisms, and weakly supervised learning [108]. This evolution has significantly enhanced the spatial resolution capability of the perception link in intelligent harvest systems.

3.2.4. Point Cloud Analysis

Point cloud analysis is an important method that takes discrete points in 3D space as the foundation to acquire and analyze the geometric structure and spatial distribution characteristics of crops. Each point contains X, Y, Z coordinates and potential information such as intensity, reflectivity, and color, and is typically acquired by devices like LiDAR (Light Detection and Ranging), structured light cameras, or RGB-D sensors. Compared with traditional 2D image processing methods, point cloud analysis has stronger 3D expression capabilities, making it particularly suitable for high-precision modeling of structural attributes such as plant height, canopy hierarchy, lodging tendency, spatial density, and crop position [109,110].
Early applications of point cloud technology in agriculture mostly focused on static crop 3D reconstruction and height estimation. For example, in fruit tree or corn fields, researchers used 2D images combined with structured light methods to acquire point cloud data, then calculated the distance between the maximum crop height value and the ground plane to derive the average plant height. Point cloud processing at this stage mainly relied on rule-based height statistics and spatial fitting; its feature expression capability was limited, and it was highly affected by noise, occlusion, and sampling density [111].
With the improvement of 3D sensor accuracy and the development of point cloud processing algorithms, geometric feature extraction techniques such as spatial filtering, normal vector estimation, and curvature analysis have been gradually introduced in agricultural scenarios to construct crop point cloud models. For instance, in canopy structure analysis, through density projection and voxel grid division, it is possible to extract canopy hierarchy information, porosity, and vertical structure variation characteristics, which in turn assist in harvest path optimization and mechanical parameter adjustment [112]. In lodging detection tasks, by analyzing changes in the surface normal angle of point cloud segments and the overall tilt trend, it is feasible to determine whether crops are upright, supporting mechanical avoidance and adaptive adjustment of operation posture.
In recent years, point cloud learning methods have gradually become a research hotspot. In particular, the introduction of deep point cloud analysis frameworks has significantly expanded the intelligent perception capabilities of point clouds in agriculture. Representative models such as PointNet, PointNet++, and PointConv perform feature modeling directly on raw point clouds through end-to-end learning, enabling classification, segmentation, and key point extraction of spatial objects. Related methods have achieved breakthroughs in scenarios such as fruit tree branch and leaf recognition, corn ear counting, and individual fruit extraction [113]. For example, Jiang et al. developed a deep learning-based 3D phenotypic analysis system for apple tree organs. By using the PointNeXt network and graph theory algorithms, the system achieved high-precision point cloud segmentation and structure recognition (as shown in Figure 16). The R2 value for tree height prediction reached 0.987, the accuracy of branch counting was 93.4%, and the organ segmentation accuracy was significantly higher than that of traditional methods [114].
To enhance system stability and deployment efficiency, some studies have explored fusion methods of point clouds and images—that is, acquiring color and texture information from RGB images and spatial structure information from point clouds to achieve visual-structural dual-modal perception. Such methods exhibit strong anti-interference capabilities in actual field environments characterized by complex crop targets and frequent multi-source interference. Additionally, SLAM (Simultaneous Localization and Mapping) technology has been introduced into agricultural harvest perception systems. Combined with real-time point cloud analysis, it enables high-precision navigation of agricultural machinery in crop fields and continuous target tracking [115].
Overall, point cloud analysis methods have evolved from simple geometric fitting to a 3D perception framework that integrates deep learning, spatiotemporal modeling, and multi-modal fusion. Its high spatial resolution and ability to analyze complex structural attributes are making it one of the indispensable core technologies in agricultural intelligent perception systems, particularly suitable for harvest control tasks that require the acquisition of 3D structural information [116].

3.2.5. Other Methods

In agricultural harvest scenarios, apart from mainstream technologies like image classification, object detection, image segmentation, and point cloud analysis, there are also relatively niche data analysis methods that demonstrate significant advantages in specific tasks. These methods mainly tackle challenges such as special target recognition, data scarcity, or extreme environments, and play an important supplementary role in improving the robustness of detection systems, reducing modeling costs, or expanding the dimensions of perception. With the development of precision agriculture and intelligent harvest technology, these methods are gradually gaining attention and showing unique advantages in practical applications [116,117,118].
Tensor decomposition and multidimensional modeling methods provide powerful mathematical tools for processing agricultural multi-source heterogeneous data. Data generated during agricultural production often has multidimensional characteristics, such as multi-temporal remote sensing images, hyperspectral data, and multi-sensor fusion information [119]. This data not only has high dimensionality but also exhibits complex spatiotemporal correlations. By representing multidimensional data in the form of tensors (e.g., arrays with three or more dimensions) and using algorithms like CP decomposition and Tucker decomposition, tensor decomposition technology can effectively extract the essential features and variation rules of the data. Taking corn ear development monitoring as an example, constructing a third-order tensor covering temporal, spatial, and spectral dimensions can capture the feature evolution patterns of different growth stages, providing a more accurate basis for harvest timing prediction [119,120]. In addition, tensor methods also show unique advantages in multi-modal data fusion; for instance, the joint analysis of visible light, thermal infrared, and fluorescence images enables a more comprehensive assessment of crop physiological status [121].
Graph Neural Networks (GNNs) have opened up a new path for processing agricultural unstructured spatial data. Unlike traditional image data, many objects in farmland environments have complex spatial topological relationships, such as the connection structure between fruits and the spatial distribution of crop populations. By constructing a graph structure consisting of nodes (e.g., individual fruits, crop organs) and edges (spatial adjacency relationships or physiological connections), GNNs can effectively model such non-Euclidean data [122]. In specific applications, GNNs perform well in multiple agricultural harvest tasks: in grape cluster analysis, by building a fruit connection graph, GNNs can accurately identify the position and status of individual grape berries, calculate cluster integrity scores, and provide decision support for automated harvesting; in crop population analysis, GNNs can model the competitive relationships between plants and predict yield distribution. Particularly noteworthy is that the latest spatial graph convolutional networks and attention graph networks have further enhanced the model’s ability to perceive local structures, enabling it to better handle issues like occlusion and overlap commonly seen in agricultural scenarios. For example, Ye et al. proposed an Attention-Based Spatiotemporal Graph Neural Network (ASTGNN) model, which achieves accurate winter wheat yield prediction by fusing multi-source remote sensing data with geospatial features [123,124]. This model integrates 12 types of heterogeneous data (including remote sensing images, meteorological observations, and soil properties) from Anhui Province between 2005 and 2020, and innovatively introduces a neighborhood geospatial feature analysis module to effectively capture the interaction effects of climate-soil-crops between regions [125]. Experiments show that multi-source data fusion allows the model to achieve a coefficient of determination (R2) of 0.70 three months before harvest, with the prediction error controlled at 0.17 tons per hectare—representing a 28.6% accuracy improvement compared to traditional yield prediction models [126,127]. With the deepening of research, GNNs show broad application prospects in fields such as 3D crop phenotypic analysis and farmland ecosystem modeling.
Although these emerging methods are not yet widely used in current agricultural harvest perception systems, they demonstrate irreplaceable value compared to traditional methods when addressing challenges like complex environments and multi-source fusion [128]. As the level of agricultural intelligence improves and heterogeneous data continues to accumulate, the in-depth integration of these technologies with mainstream methods is expected to further expand the depth and breadth of crop attribute detection, driving agricultural harvest systems toward a more intelligent and precise direction [129]. All the methods mentioned above are shown in Table 2.

4. Future Development Trends

As the process of agricultural intellectualization and automation accelerates, crop attribute detection technology is gradually evolving from single-dimensional perception to multi-dimensional integration and transitioning from static perception to dynamic decision-making. Although current related research has made significant progress in aspects such as sensor types, detection methods, and algorithm accuracy, the existing systems still face many unsolved problems in generalization ability, collaboration efficiency, and scene adaptability when confronting a wider range of crop species, more complex field environments, and more efficient operation requirements.
Therefore, future development should focus on constructing an intelligent perception framework with greater flexibility and adaptability, and promote technological breakthroughs and practical applications from multiple dimensions including learning mechanisms, system architecture, and resource scheduling. This chapter will discuss two directions—perception dimensions and technological transformation—to provide potential paths and technical support for the next-stage development of crop attribute detection systems.

4.1. Deepening of Perception Dimensions: From Macroscopic Phenomena to Microscopic Mechanisms

The evolutionary direction of future agricultural detection technology has gone beyond the acquisition of macroscopic phenotypic indicators such as morphology and color, and shifted toward in-depth analysis of the microscopic level of crops’ internal physiological and biochemical processes. This transformation relies on the integration of interdisciplinary technologies including high-throughput sensors, molecular spectroscopy, multi-omics analysis, and artificial intelligence, aiming to achieve non-destructive, dynamic, and precise quantification of plant physiological states, metabolic activities, nutrient allocation, and stress response mechanisms.
By integrating technologies such as high-resolution remote sensing, near-infrared spectroscopy, gene expression profiling, and metabolite detection, it is possible not only to real-time monitor key physiological parameters of crops (e.g., internal water distribution, nutrient surplus/deficit, hormone regulation, and photosynthetic efficiency) but also to uncover early stress signals and adaptive responses under environmental stress. The acquisition and analysis of such in-depth information at the microscopic scale provide an unprecedented scientific basis for precision regulation and decision support in smart agriculture, driving a fundamental transformation of agricultural production from traditional experience-based management to a data-driven intelligent model.

4.1.1. Hyperspectral Imaging + Fluorescence/Thermal Imaging Fusion

With the in-depth development of precision agriculture and smart agronomy, the demand for crop attribute detection has shifted from macroscopic phenotypic description to in-depth analysis and quantification of internal physiological and biochemical processes in crops. Traditional single imaging technologies, due to the limitations of their information dimensions, struggle to comprehensively capture multi-dimensional information about crop growth status. Therefore, multimodal optical imaging fusion technology has become a key direction in cutting-edge agricultural sensing research.
However, multisource data fusion is far more than a simple superposition of different information sources; it is a complex process of conducting collaborative analysis and information extraction within a unified framework. This process typically covers multiple levels, including pixel-level, feature-level, and decision-level fusion. In pixel-level fusion, strict image registration technology must first be applied to ensure that images from hyperspectral, fluorescence, and thermal imaging sensors correspond completely in space, eliminating geometric misalignment caused by differences in shooting angles, resolutions, and temporal changes. At the same time, radiometric calibration and standardization need to be performed to eliminate noise from the sensors themselves and environmental illumination, making data from different sources comparable.
At the feature-level fusion stage, feature parameters with physical significance are extracted from each source of data. For example:
  • From hyperspectral images, extract the reflectance of specific bands, vegetation indices (such as NDVI, PRI), and biochemical parameters (chlorophyll content, anthocyanin concentration, water content, etc.) obtained through spectral inversion models;
  • From fluorescence images, acquire key indicators reflecting photosynthetic efficiency, such as the maximum quantum yield (Fv/Fm) of photosystem II (PSII) and non-photochemical quenching (NPQ);
  • From thermal images, obtain features closely related to transpiration and water status, such as canopy temperature distribution and temperature stress index.
Subsequently, statistical methods, machine learning, or deep learning models are used to reduce the dimensionality, select, and fuse these heterogeneous features, constructing a unified multi-dimensional information map of “biochemical-physiological-ecophysiological”.
The core advantage of this technical system lies in its excellent complementarity and synergy:
  • Hyperspectral data provide extremely rich chemical composition backgrounds, enabling fine distinction of the spectral fingerprints of different substances;
  • Fluorescence data dynamically and sensitively reveal the internal operating status of photosynthetic apparatus and their immediate responses to stress;
  • Thermal data intuitively reflect the transpiration cooling effect of crop canopies and the degree of water deficit from the perspective of energy balance.
This multi-parameter, multi-dimensional cross-validation mechanism greatly overcomes the ambiguity and misjudgment risks often associated with a single technical source. For instance, relying solely on hyperspectral data may make it difficult to distinguish spectral reflectance changes caused by water stress and nitrogen deficiency—both of which can lead to similar changes in leaf color and thickness. However, by fusing canopy temperature (typically elevated under water stress) from thermal imaging and photosynthetic function indicators (significantly reduced light energy conversion efficiency under nitrogen stress) from fluorescence imaging, accurate identification and quantitative diagnosis of stress types and degrees can be achieved. This significantly improves the accuracy, reliability, and robustness of monitoring and diagnosing abiotic stresses (such as drought, high temperature, salinization), biotic stresses (such as early disease infection), and crop nutritional status (such as nitrogen and potassium levels), providing a solid scientific basis for the healthy growth and precision management of crops.

4.1.2. Multi-Polarization and Multi-Band Penetrating Perception

As the demand for precise and intelligent management in modern agriculture continues to rise, crop attribute detection technology is gradually advancing from traditional optical phenotypic monitoring toward multi-dimensional remote sensing technology with penetrating perception capabilities. This section focuses on exploring the application of penetrating perception technology based on multi-polarization and multi-band radar in crop attribute detection.
This technology is particularly suitable for environments with dense canopy coverage or where optical sensors fail to achieve effective observation. By analyzing the interaction between electromagnetic waves and crop structure as well as dielectric properties, it enables non-destructive quantitative monitoring of crop biophysical parameters, water status, and even subsurface characteristics, providing critical data support for smart farm management.
Multi-polarization and multi-band penetrating perception technology can effectively detect a variety of key crop attributes and boasts significant technical advantages. By analyzing the interaction between electromagnetic waves of different polarization modes (e.g., HH, HV, VH, VV) and different frequency bands (e.g., L-band, C-band, X-band) with crops, the technology enables non-destructive acquisition of crop biophysical and biochemical parameters. Specifically detectable attributes include structural parameters such as crop biomass, Leaf Area Index (LAI), and canopy height, as well as water status indicators such as canopy water content and root-zone soil moisture.
Its unique advantage lies in its excellent penetrating performance: low-frequency electromagnetic waves can penetrate vegetation canopies to directly detect information about stems and soil, thereby overcoming the limitation of traditional optical remote sensing—its insufficient detection capability under dense vegetation. Meanwhile, the multi-polarization scattering matrix is highly sensitive to crop morphological structure and water content, enabling early identification of subtle changes caused by biotic stresses (e.g., lodging, diseases, and pests) and abiotic stresses (e.g., drought, salinization). In addition, unlike optical remote sensing that relies on lighting and weather conditions, this technology features all-time and all-weather operation capabilities, allowing continuous observation under cloudy, rainy, or even nighttime conditions. This greatly improves the reliability and timeliness of agricultural monitoring, providing a stable and reliable data foundation for precision agricultural management, disaster early warning, and yield estimation.
A complete agricultural penetrating perception system typically includes spaceborne/airborne multi-frequency and multi-polarization Synthetic Aperture Radar (SAR), a ground truth measurement system (e.g., soil moisture probes, biomass sampling equipment, and Differential Global Positioning System (DGPS)), and a professional algorithm platform for data preprocessing, feature extraction, and parameter inversion. By integrating multi-frequency, multi-polarization, and multi-temporal observations, the system significantly enhances the ability to analyze multi-level attributes of crops.

4.2. Technological Paradigm Shift: Agricultural Intelligent Agents with a “Perception-Decision-Execution” Closed Loop

The future development of agricultural detection technology will move far beyond the single, isolated detection model; instead, it will be deeply integrated into Agricultural Intelligent Agent Systems that integrate perception, decision-making, and execution. Relying on the fusion of multiple technologies—including the Internet of Things (IoT), Edge Computing, Artificial Intelligence (AI), and agricultural robots—this integration will enable end-to-end intelligence from data collection to autonomous action.
Acting as the perceptual front-end of the system, detection units will no longer merely provide discrete indicator data. Instead, through sensor networks with high spatiotemporal resolution, they will real-time acquire multi-modal information such as crop physiological status, soil-atmosphere continuum parameters, and biotic stress signals. These data are analyzed and modeled by intelligent algorithms to dynamically interpret the interaction mechanisms between crop growth status and the environment. The derived insights are then fed back to cloud-based or on-site decision-making hubs, which drive precision execution mechanisms (e.g., irrigation, fertilization, and pesticide application) to implement adaptive regulation.
This deeply integrated model significantly enhances the autonomous response capability and resource use efficiency of agricultural systems. It marks a fundamental evolution of agricultural production and management toward collaboration, autonomy, and systematization, providing a solid technical pathway to address global challenges in food security and sustainable development.

4.2.1. Multi-Agent Collaborative Perception System

As the scale of agricultural operations continues to expand and task complexity increases, crop attribute detection systems relying on a single operation platform can no longer fully meet the comprehensive perception requirements in large-scale, multi-type agricultural environments. A crucial future development direction is to construct a Multi-Agent Collaborative Perception System consisting of unmanned aerial vehicles (UAVs), intelligent agricultural machinery, ground mobile robots, and edge perception nodes. Through functional complementarity and information collaboration among heterogeneous platforms, this system can achieve crop attribute perception and harvest control capabilities with wider spatial coverage, higher measurement accuracy, and stronger system robustness.
The core advantage of the multi-agent collaborative system lies in its heterogeneous complementarity at the spatial and functional levels. For example, aerial UAV platforms have large-scale, high-mobility global observation capabilities, which can be used to quickly obtain crop distribution maps, detect lodging areas, and generate harvest hot-spot distributions; in contrast, ground agricultural machinery and robots have higher positioning accuracy and stable local operation capabilities, making them suitable for performing refined tasks such as fruit identification, quality grading, and ripeness assessment. By collaboratively scheduling the perception resources of different platforms, a “macro-micro” integrated crop monitoring system can be established, enabling each intelligent agent to undertake differentiated tasks based on its perception strengths. This significantly improves the overall operational efficiency of the system and its adaptability to complex environments.
Furthermore, the design of collaborative strategies in multi-agent systems is particularly critical. On one hand, for tasks such as crop identification, path planning, and harvest decision-making, it is necessary to build distributed collaborative perception and decision-making mechanisms. These mechanisms support each intelligent agent in making autonomous behavioral decisions based on local observations and task priorities, and realize global collaboration through multi-source information fusion and consensus algorithms. On the other hand, advanced artificial intelligence methods such as reinforcement learning and graph neural networks can be introduced to optimize system-level task allocation strategies and behavior coordination among intelligent agents, thereby improving the utilization efficiency of perception resources and the quality of collaborative task completion.
In various practical agricultural scenarios—such as large-scale orchards, diversified crop intercropping areas, and hilly/mountainous farmlands (where perception conditions are complex and a single operation platform cannot achieve full coverage)—the multi-agent collaborative system exhibits significant application potential. With the continuous maturity of 5th Generation Mobile Communication (5G), low-Earth-orbit (LEO) satellite Internet of Things (IoT), and agricultural robot technologies, the Multi-Agent Collaborative Perception System is expected to develop into a core infrastructure for future smart agriculture, providing key technical support for all-weather, full-cycle, and full-process crop attribute perception and automated production management.

4.2.2. Edge Computing and Real-Time Decision-Making

With the in-depth integration of the Internet of Things (IoT), artificial intelligence (AI), and advanced sensing technologies in agriculture, crop detection is gradually shifting from a delayed analysis model that relies on centralized cloud-based processing to a new paradigm of real-time perception and on-site decision-making supported by edge computing.
Traditional agricultural detection systems mostly depend on remote cloud servers for data storage and processing, which are plagued by issues such as long response latency, high network bandwidth consumption, and low reliability in poor network environments. These shortcomings make them unable to meet the demand for real-time on-site control in agricultural settings. In contrast, edge computing significantly reduces data transmission latency and reliance on the cloud by offloading computing capabilities to terminal devices near farmlands. This enables millisecond-level response and intelligent control for monitoring crop growth status, detecting pest and disease outbreaks, and responding to environmental stress.
Deploying AI models on embedded edge computing devices (e.g., those installed on unmanned aerial vehicles (UAVs) or agricultural machinery) to achieve real-time field environment analysis and decision-making has become a key direction in the development of smart agriculture. This technical approach imposes strict requirements on the computational efficiency and resource consumption of the models. Therefore, it is essential to conduct systematic lightweight design on the originally complex deep learning models. The goal of lightweighting is to achieve an optimal balance between model accuracy and inference speed, ensuring that the models can operate stably on edge hardware with limited computing power, memory, and energy consumption (such as the Jetson series and Edge TPU).
Model lightweighting is typically accomplished through the collaborative use of multiple technical methods:
  • Adopting compact network architectures: Replacing traditional deep networks with compact architectures (e.g., MobileNet, ShuffleNet, and SqueezeNet) to drastically reduce the number of parameters and computational load;
  • Pruning technology: Removing redundant connections or channels in the model while preserving its core feature extraction capabilities;
  • Quantization technology: Converting the weights and activation values of the model from 32-bit floating-point numbers to 8-bit integers, which significantly reduces computational and storage overhead with minimal loss of accuracy.
Through these lightweighting methods, tasks that originally relied on cloud computing—such as visual recognition, semantic segmentation, and object detection—can now be migrated to local computing units on UAVs or agricultural machinery, enabling millisecond-level image processing and real-time analysis. For example, UAVs can instantly identify crop growth conditions, pest-infested areas, or weed distribution during flight and independently generate decisions for pesticide application or harvesting. Agricultural machinery can real-time determine crop row alignment and monitor ripeness during operation, while dynamically adjusting operation parameters. This edge-based intelligent processing not only greatly reduces reliance on continuous network connectivity and improves system robustness in remote farmland environments but also effectively minimizes data transmission latency, truly realizing a closed-loop agricultural intelligent agent integrating “perception-decision-execution.”
However, complex lighting conditions, crop diversity, and dynamic environments in field applications still pose challenges to the generalization ability and robustness of lightweight models. Future research should focus on developing lightweight models more adaptable to agricultural scenarios, enhancing their performance in scenarios with occlusion, lighting variations, and limited samples. This will promote the broader and more reliable application of edge intelligence in modern agricultural production.

5. Conclusions

This review systematically summarizes crop attribute detection technologies for intelligent harvesting, with key practical insights:
First, it identifies field pain points (complex environments, lighting interference, real-time demands) and provides actionable solutions—e.g., LiDAR-based plant height detection to adjust harvester cutting platforms, hyperspectral imaging for non-destructive fruit maturity grading, and edge computing to solve rural network latency issues (inference delay < 100 ms for on-site decisions).
Second, it clarifies crop-specific practical applications: for grains, microwave/near-infrared technologies enable rapid moisture/protein detection to reduce threshing losses; for fruits/vegetables, RGB-D + deep learning achieves accurate fruit localization (success rate > 90%) and defect sorting, supporting robotic harvesting.
Finally, future directions prioritize real-world utility: multi-sensor fusion (hyperspectral + thermal imaging) to address dense canopy occlusion in hilly areas, and multi-agent collaborative systems (UAV + ground robots) to expand monitoring coverage for smallholder farms. These advancements will drive agricultural production toward cost-effective, precise, and unmanned operations—directly addressing global food security and labor shortage challenges.

6. Review Methodology

To ensure the comprehensiveness, accuracy, and relevance of this review on crop attribute monitoring in hilly regions, a systematic literature search and selection process was implemented, following the principles of evidence-based review methodology. The detailed procedures are outlined below.

6.1. Databases and Search Strategy

A multi-database search was conducted to cover both international and Chinese literature, considering the interdisciplinary nature of the research (integrating agricultural engineering, optical sensing, and computer science) and the authors’ regional research context (Jiangsu University, China). The selected databases included:
International databases: Web of Science Core Collection (WoS), Scopus, ScienceDirect, IEEE Xplore, and Precision Agriculture Database. These platforms were chosen for their extensive coverage of high-impact journals and conference proceedings in precision agriculture, sensor technology, and deep learning applications (e.g., Computers and Electronics in Agriculture, Sensors, IEEE Transactions on Agricultural Informatics).
Chinese database: China National Knowledge Infrastructure (CNKI). This database was included to capture domestic research progress on hilly region agriculture (a key focus of Chinese agricultural engineering) and localized technology adaptations (e.g., UAV-LiDAR applications in Chinese hilly wheat fields).
The search was performed using a combination of topic-based retrieval (targeting article titles, abstracts, and keywords) and citation tracing (expanding the literature pool by reviewing references of highly relevant studies, such as foundational works on crop height estimation via LiDAR and maturity detection via hyperspectral imaging).

6.2. Keywords

To balance search comprehensiveness and specificity, a set of keywords was designed, covering three core dimensions: study context (hilly regions), research object (crop attributes), and technical methods (sensing and data analysis). The keyword combinations (using “AND” for logical connection and “OR” for synonym expansion) are listed below (as shown in Table 3):
For example, a typical English search string was: “Hilly regions AND Crop attribute monitoring AND (LiDAR OR Hyperspectral imaging)”.

6.3. Selection Criteria

Literature screening was conducted in two stages—title/abstract screening and full-text screening—by two independent researchers to minimize bias. Disagreements were resolved through discussion with a third researcher specializing in agricultural intelligent sensing.

6.3.1. Inclusion Criteria

Theme relevance: Studies focusing on crop attribute monitoring during the harvesting period in hilly regions; research objects must include grains (rice, wheat, corn) or fruits/vegetables (citrus, tomato, grape) (consistent with the review’s core focus).
Technical validity: Studies reporting specific sensing technologies (e.g., LiDAR, NIR) or data analysis methods (e.g., deep learning, point cloud analysis) with clear experimental designs (e.g., field validation, sensor calibration, model performance metrics like R2 or accuracy).
Publication quality: Peer-reviewed journal articles, authoritative conference proceedings (e.g., IEEE International Conference on Robotics and Automation for Agriculture), and book chapters; preprints and non-peer-reviewed reports were excluded unless they contained groundbreaking technical details (e.g., novel edge computing frameworks for real-time harvest decision-making).
Language: English or Chinese (to include both international and domestic research progress).

6.3.2. Exclusion Criteria

Irrelevant context: Studies targeting flat farmlands, greenhouses, or non-harvest periods (e.g., seedling stage growth monitoring).
Theoretical only: Studies lacking experimental validation (e.g., pure simulation studies without field data).
Redundancy: Duplicate publications (e.g., conference papers expanded into journal articles, prioritizing the more comprehensive journal version).
Low relevance: Studies focusing solely on crop yield prediction or soil monitoring without linking to “harvesting-related crop attributes” (e.g., moisture content for threshing efficiency).

6.4. Time Span

The literature search covered the period from January 2012 to March 2025. This time frame was selected for two reasons:
Technical milestone: 2012 marked the early application of UAVs and low-cost sensors in precision agriculture, representing the start of rapid development in crop attribute sensing technologies.
Timeliness: The end date (March 2025) aligns with the review’s publication timeline (copyright 2025), ensuring the inclusion of the latest research (e.g., 2025 studies on PointNeXt-based fruit tree point cloud segmentation and ASTGNN-based yield prediction) to reflect current technical trends.
A total of 823 initial studies were retrieved, and 129 eligible studies were finally included after screening—forming the core evidence base for the review’s analysis of sensing technologies, data methods, and future trends.

Author Contributions

Conceptualization, Z.L. and R.D.; methodology, R.W.; formal analysis, Z.L.; resources, R.W.; writing—original draft preparation, Z.L.; writing—review and editing, Z.L.; supervision, R.D.; project administration, R.W.; funding acquisition, R.W. All authors have read and agreed to the published version of the manuscript.

Funding

This research was supported by the National Key Research and Development Program of China (2023YFB2504500), the National Natural Science Foundation Project of China (52472410), and the Project of College of Agricultural Engineering, Jiangsu University (NZXB20210101).

Institutional Review Board Statement

Not applicable.

Informed Consent Statement

Not applicable.

Data Availability Statement

Data sharing is not applicable. No new data were created or analyzed in this study.

Conflicts of Interest

The authors declare no conflict of interest.

References

  1. Zhang, C.; Kovacs, J.M. The Application of Small Unmanned Aerial Systems for Precision Agriculture: A Review. Precis. Agric. 2012, 13, 693–712. [Google Scholar] [CrossRef]
  2. Liakos, K.G.; Busato, P.; Moshou, D.; Pearson, S.; Bochtis, D. Machine Learning in Agriculture: A Review. Sensors 2018, 18, 2674. [Google Scholar] [CrossRef]
  3. Yang, F.; Liao, D.; Wu, X.; Gao, R.; Fan, Y.; Raza, M.A.; Wang, X.; Yong, T.; Liu, W.; Liu, J.; et al. Effect of Aboveground and Belowground Interactions on the Intercrop Yields in Maize-Soybean Relay Intercropping Systems. Field Crops Res. 2017, 203, 16–23. [Google Scholar] [CrossRef]
  4. Madec, S.; Baret, F.; de Solan, B.; Thomas, S.; Dutartre, D.; Jezequel, S.; Hemmerlé, M.; Colombeau, G.; Comar, A. High-Throughput Phenotyping of Plant Height: Comparing Unmanned Aerial Vehicles and Ground LiDAR Estimates. Front. Plant Sci. 2017, 8, 2002. [Google Scholar] [CrossRef] [PubMed]
  5. Ji, Y.; Mestrot, A.; Schulin, R.; Tandy, S. Uptake and Transformation of Methylated and Inorganic Antimony in Plants. Front. Plant Sci. 2018, 9, 140. [Google Scholar] [CrossRef]
  6. Sa, I.; Ge, Z.; Dayoub, F.; Upcroft, B.; Perez, T.; McCool, C. DeepFruits: A Fruit Detection System Using Deep Neural Networks. Sensors 2016, 16, 1222. [Google Scholar] [CrossRef]
  7. Kamilaris, A.; Prenafeta-Boldú, F.X. Deep Learning in Agriculture: A Survey. Comput. Electron. Agric. 2018, 147, 70–90. [Google Scholar] [CrossRef]
  8. Auat Cheein, F.A.; Carelli, R. Agricultural Robotics: Unmanned Robotic Service Units in Agricultural Tasks. IEEE Ind. Electron. Mag. 2013, 7, 48–58. [Google Scholar] [CrossRef]
  9. Lu, D.; Wang, Y. MAR-YOLOv9: A Multi-Dataset Object Detection Method for Agricultural Fields Based on YOLOv9. PLoS ONE 2024, 19, e0307643. [Google Scholar] [CrossRef] [PubMed]
  10. Magar, L.P.; Sandifer, J.; Khatri, D.; Poudel, S.; Kc, S.; Gyawali, B.; Gebremedhin, M.; Chiluwal, A. Plant Height Measurement Using UAV-Based Aerial RGB and LiDAR Images in Soybean. Front. Plant Sci. 2025, 16, 1488760. [Google Scholar] [CrossRef]
  11. Xie, T.; Li, J.; Yang, C.; Jiang, Z.; Chen, Y.; Guo, L.; Zhang, J. Crop Height Estimation Based on UAV Images: Methods, Errors, and Strategies. Comput. Electron. Agric. 2021, 185, 106155. [Google Scholar] [CrossRef]
  12. Panday, U.S.; Shrestha, N.; Maharjan, S.; Pratihast, A.K.; Shahnawaz Shrestha, K.L.; Aryal, J. Correlating the Plant Height of Wheat with Above-Ground Biomass and Crop Yield Using Drone Imagery and Crop Surface Model, A Case Study from Nepal. Drones 2020, 4, 28. [Google Scholar] [CrossRef]
  13. Li, Y.; Li, C.; Cheng, Q.; Chen, L.; Li, Z.; Zhai, W.; Mao, B.; Chen, Z. Precision estimation of winter wheat crop height and above-ground biomass using unmanned aerial vehicle imagery and oblique photoghraphy point cloud data. Front. Plant Sci. 2024, 15, 1437350. [Google Scholar] [CrossRef] [PubMed]
  14. Velumani, K.; Lopez-Lozano, R.; Madec, S.; Guo, W.; Gillet, J.; Comar, A.; Baret, F. Estimates of Maize Plant Density from UAV RGB Images Using Faster-RCNN Detection Model: Impact of the Spatial Resolution. Plant Phenomics 2021, 2021, 9824843. [Google Scholar] [CrossRef] [PubMed]
  15. Tian, Z.; Fang, Y.; Fang, X.; Ma, Y.; Li, H. A Large-Scale Building Unsupervised Extraction Method Leveraging Airborne LiDAR Point Clouds and Remote Sensing Images Based on a Dual P-Snake Model. Sensors 2024, 24, 7503. [Google Scholar] [CrossRef] [PubMed]
  16. Lu, N.; Zhou, J.; Han, Z.; Li, D.; Cao, Q.; Yao, X.; Tian, Y.; Zhu, Y.; Cao, W.; Cheng, T. Improved Estimation of Aboveground Biomass in Wheat from RGB Imagery and Point Cloud Data Acquired with a Low-Cost Unmanned Aerial Vehicle System. Plant Methods 2019, 15, 17. [Google Scholar] [CrossRef]
  17. Jin, X.; Liu, S.; Baret, F.; Hemerlé, M.; Comar, A. Estimates of Plant Density of Wheat Crops at Emergence from Very Low Altitude UAV Imagery. Remote Sens. Environ. 2017, 198, 105–114. [Google Scholar] [CrossRef]
  18. Xu, X.; Geng, Q.; Gao, F.; Xiong, D.; Qiao, H.; Ma, X. Segmentation and Counting of Wheat Spike Grains Based on Deep Learning and Textural Feature. Plant Methods 2023, 19, 77. [Google Scholar] [CrossRef]
  19. Shi, L.; Sun, J.; Dang, Y.; Zhang, S.; Sun, X.; Xi, L.; Wang, J. YOLOv5s-T: A Lightweight Small Object Detection Method for Wheat Spikelet Counting. Agriculture 2023, 13, 872. [Google Scholar] [CrossRef]
  20. Qiu, R.; He, Y.; Zhang, M. Automatic Detection and Counting of Wheat Spikelet Using Semi-Automatic Labeling and Deep Learning. Front. Plant Sci. 2022, 13, 872555. [Google Scholar] [CrossRef]
  21. Sun, X.; Jiang, T.; Hu, J.; Song, Z.; Ge, Y.; Wang, Y.; Liu, X.; Bing, J.; Li, J.; Zhou, Z.; et al. Counting Wheat Heads Using a Simulation Model. Comput. Electron. Agric. 2025, 228, 109633. [Google Scholar] [CrossRef]
  22. Sanaeifar, A.; Guindo, M.L.; Bakhshipour, A.; Fazayeli, H.; Li, X.; Yang, C. Advancing Precision Agriculture: The Potential of Deep Learning for Cereal Plant Head Detection. Comput. Electron. Agric. 2023, 209, 107875. [Google Scholar] [CrossRef]
  23. Wen, J.; Yin, Y.; Zhang, Y.; Pan, Z.; Fan, Y. Detection of Wheat Lodging by Binocular Cameras during Harvesting Operation. Agriculture 2023, 13, 120. [Google Scholar] [CrossRef]
  24. Zhang, Z.; Flores, P.; Igathinathane, C.; Naik, D.L.; Kiran, R.; Ransom, J.K. Wheat Lodging Detection from UAS Imagery Using Machine Learning Algorithms. Remote Sens. 2020, 12, 1838. [Google Scholar] [CrossRef]
  25. De Castro, A.I.; Torres-Sánchez, J.; Peña, J.M.; Jiménez-Brenes, F.M.; Csillik, O.; López-Granados, F. An Automatic Random Forest-OBIA Algorithm for Early Weed Mapping between and within Crop Rows Using UAV Imagery. Remote Sens. 2018, 10, 285. [Google Scholar] [CrossRef]
  26. Kang, G.; Wang, J.; Zeng, F.; Cai, Y.; Kang, G.; Yue, X. Lightweight Detection System with Global Attention Network (GloAN) for Rice Lodging. Plants 2023, 12, 1595. [Google Scholar] [CrossRef] [PubMed]
  27. Xie, B.; Wang, J.; Jiang, H.; Zhao, S.; Liu, J.; Jin, Y.; Li, Y. Multi-Feature Detection of In-Field Grain Lodging for Adaptive Low-Loss Control of Combine Harvesters. Comput. Electron. Agric. 2023, 208, 107772. [Google Scholar] [CrossRef]
  28. Li, Z.; Feng, X.; Li, J.; Wang, D.; Hong, W.; Qin, J.; Wang, A.; Ma, H.; Yao, Q.; Chen, S. Time Series Field Estimation of Rice Canopy Height Using an Unmanned Aerial Vehicle-Based RGB/Multispectral Platform. Agronomy 2024, 14, 883. [Google Scholar] [CrossRef]
  29. Shu, M.; Li, Q.; Ghafoor, A.; Zhu, J.; Li, B.; Ma, Y. Using the Plant Height and Canopy Coverage to Estimate Maize Aboveground Biomass with UAV Digital Images. Eur. J. Agron. 2023, 151, 126957. [Google Scholar] [CrossRef]
  30. Xie, J.; Zhou, Z.; Zhang, H.; Zhang, L.; Li, M. Combining Canopy Coverage and Plant Height from UAV-Based RGB Images to Estimate Spraying Volume on Potato. Sustainability 2022, 14, 6473. [Google Scholar] [CrossRef]
  31. Valluvan, A.B.; Raj, R.; Pingale, R.; Jagarlapudi, A. Canopy Height Estimation Using Drone-Based RGB Images. Smart Agric. Technol. 2023, 4, 100145. [Google Scholar] [CrossRef]
  32. Joshi, A.; Pradhan, B.; Gite, S.; Chakraborty, S. Remote-Sensing Data and Deep-Learning Techniques in Crop Mapping and Yield Prediction: A Systematic Review. Remote Sens. 2023, 15, 2014. [Google Scholar] [CrossRef]
  33. Zhang, Y.; Wang, X.; Liu, Y.; Li, J.; Liu, Y. Crop Row Detection in the Middle and Late Periods of Maize under Sheltering Based on Solid State LiDAR. Agriculture 2022, 12, 2011. [Google Scholar] [CrossRef]
  34. Wu, F.; Wang, J.; Zhou, Y.; Song, X.; Ju, C.; Sun, C.; Liu, T. Estimation of Winter Wheat Tiller Number Based on Optimization of Gradient Vegetation Characteristics. Remote Sens. 2022, 14, 1338. [Google Scholar] [CrossRef]
  35. Ma, J.; Li, M.; Fan, W.; Liu, J. State-of-the-Art Techniques for Fruit Maturity Detection. Agronomy 2024, 14, 2783. [Google Scholar] [CrossRef]
  36. Chu, X.; Miao, P.; Zhang, K.; Wei, H.; Fu, H.; Liu, H.; Jiang, H.; Ma, Z. Green Banana Maturity Classification and Quality Evaluation Using Hyperspectral Imaging. Agriculture 2022, 12, 530. [Google Scholar] [CrossRef]
  37. Mahmood, A.; Singh, S.K.; Tiwari, A.K. Pre-Trained Deep Learning-Based Classification of Jujube Fruits According to Their Maturity Level. Neural Comput. Appl. 2022, 34, 13925–13935. [Google Scholar] [CrossRef]
  38. Zhao, M.; Cang, H.; Chen, H.; Zhang, C.; Yan, T.; Zhang, Y.; Gao, P.; Xu, W. Determination of Quality and Maturity of Processing Tomatoes Using Near-Infrared Hyperspectral Imaging with Interpretable Machine Learning Methods. LWT-Food Sci. Technol. 2023, 183, 114861. [Google Scholar] [CrossRef]
  39. Tzuan, G.T.H.; Hashim, F.H.; Raj, T.; Baseri Huddin, A.; Sajab, M.S. Oil Palm Fruits Ripeness Classification Based on the Characteristics of Protein, Lipid, Carotene, and Guanine/Cytosine from the Raman Spectra. Plants 2022, 11, 1936. [Google Scholar] [CrossRef]
  40. Yoshida, T.; Kawahara, T.; Fukao, T. Fruit Recognition Method for a Harvesting Robot with RGB-D Cameras. Robomech J. 2022, 9, 15. [Google Scholar] [CrossRef]
  41. Liu, T.; Wang, X.; Hu, K.; Zhou, H.; Kang, H.; Chen, C. FF3D: A Rapid and Accurate 3D Fruit Detector for Robotic Harvesting. Sensors 2024, 24, 3858. [Google Scholar] [CrossRef]
  42. Lowe, A.; Harrison, N.; French, A.P. Hyperspectral Image Analysis Techniques for the Detection and Classification of the Early Onset of Plant Disease and Stress. Plant Methods 2017, 13, 80. [Google Scholar] [CrossRef]
  43. García-Vera, Y.E.; Polochè-Arango, A.; Mendivelso-Fajardo, C.A.; Gutiérrez-Bernal, F.J. Hyperspectral Image Analysis and Machine Learning Techniques for Crop Disease Detection and Identification: A Review. Sustainability 2024, 16, 6064. [Google Scholar] [CrossRef]
  44. Nagasubramanian, K.; Jones, S.; Singh, A.K.; Sarkar, S.; Singh, A.; Ganapathysubramanian, B. Plant Disease Identification Using Explainable 3D Deep Learning on Hyperspectral Images. Plant Methods 2019, 15, 98. [Google Scholar] [CrossRef]
  45. Chiou, K.D.; Chen, Y.X.; Chen, P.S.; Jou, Y.T.; Tsai, S.H.; Chang, C.Y. Application of Deep Learning for Fruit Defect Recognition in Psidium guajava L. Sci. Rep. 2025, 15, 6145. [Google Scholar] [CrossRef]
  46. Pang, Q.; Huang, W.; Fan, S.; Zhou, Q.; Wang, Z.; Tian, X. Detection of Early Bruises on Apples Using Hyperspectral Imaging Combining with YOLOv3 Deep Learning Algorithm. J. Food Process Eng. 2022, 45, e13952. [Google Scholar] [CrossRef]
  47. Yue, J.; Zhou, C.; Feng, H.; Yang, Y.; Zhang, N. Novel Applications of Optical Sensors and Machine Learning in Agricultural Monitoring. Agriculture 2023, 13, 1970. [Google Scholar] [CrossRef]
  48. Wang, W.; den Brinker, A.C. Modified RGB Cameras for Infrared Remote-PPG. IEEE Trans. Biomed. Eng. 2020, 67, 2893–2904. [Google Scholar] [CrossRef] [PubMed]
  49. Linhares, J.M.M.; Monteiro, J.A.R.; Bailão, A.; Cardeira, L.; Kondo, T.; Nakauchi, S.; Picollo, M.; Cucci, C.; Casini, A.; Stefani, L.; et al. How Good Are RGB Cameras Retrieving Colors of Natural Scenes and Paintings?—A Study Based on Hyperspectral Imaging. Sensors 2020, 20, 6242. [Google Scholar] [CrossRef]
  50. Zhang, J.; Yang, C.; Song, H.; Hoffmann, W.C.; Zhang, D.; Zhang, G. Evaluation of an Airborne Remote Sensing Platform Consisting of Two Consumer-Grade Cameras for Crop Identification. Remote Sens. 2016, 8, 257. [Google Scholar] [CrossRef]
  51. dos Santos, L.M.; Ferraz, G.A.E.S.; Barbosa, B.D.S.; Diotto, A.V.; Maciel, D.T.; Xacier, L.A.G. Biophysical Parameters of Coffee Crop Estimated by UAV RGB Images. Precis. Agric. 2020, 21, 1227–1241. [Google Scholar] [CrossRef]
  52. Okamoto, Y.; Tanaka, M.; Monno, Y.; Okutomi, M. Deep Snapshot HDR Imaging Using Multi-Exposure Color Filter Array. Vis. Comput. 2024, 40, 3285–3301. [Google Scholar] [CrossRef]
  53. Yan, B.; Li, X. RGB-D Camera and Fractal-Geometry-Based Maximum Diameter Estimation Method of Apples for Robot Intelligent Selective Graded Harvesting. Fractal Fract. 2024, 8, 649. [Google Scholar] [CrossRef]
  54. Zhou, J.; Cui, M.; Wu, Y.; Gao, Y.; Tang, Y.; Jiang, B.; Wu, M.; Zhang, J.; Hou, L. Detection of Maize Stem Diameter by Using RGB-D Cameras’ Depth Information under Selected Field Condition. Front. Plant Sci. 2024, 15, 1371252. [Google Scholar] [CrossRef]
  55. Orlandella, I.; Smith, K.N.; Belcore, E.; Ferrero, R.; Piras, M.; Fiore, S. Monitoring Strawberry Plants’ Growth in Soil Amended with Biochar. AgriEngineering 2025, 7, 324. [Google Scholar] [CrossRef]
  56. Mafuratidze, P.; Chibarabada, T.P.; Shekede, M.D.; Masocha, M. A New Four-Stage Approach Based on Normalized Vegetation Indices for Detecting and Mapping Sugarcane Hail Damage Using Multispectral Remotely Sensed Data. Geocarto Int. 2023, 38, 2245788. [Google Scholar] [CrossRef]
  57. Lee, J.; Park, Y.; Kim, H.; Yoon, Y.-Z.; Ko, W.; Bae, K.; Lee, J.-Y.; Choo, H.; Roh, Y.-G. Compact Meta-Spectral Image Sensor for Mobile Applications. Nanophotonics 2022, 11, 2563–2569. [Google Scholar] [CrossRef] [PubMed]
  58. Zhang, J.; Rivard, B.; Rogge, D.M. The Successive Projection Algorithm (SPA), an Algorithm with a Spatial Constraint for the Automatic Search of Endmembers in Hyperspectral Data. Sensors 2008, 8, 1321–1342. [Google Scholar] [CrossRef]
  59. Wu, P.; Sun, S.; Wei, W.; Yuan, X.; Zhou, R. Research on Calibration Methods of Long-Wave Infrared Camera and Visible Camera. J. Sens. 2022, 2022, 8667606. [Google Scholar] [CrossRef]
  60. Wang, H.; Jiang, M.; Yan, L.; Yao, Y.; Fu, Y.; Luo, S.; Lin, Y. Angular Effect in Proximal Sensing of Leaf-Level Chlorophyll Content Using Low-Cost DIY Visible/Near-Infrared Camera. Comput. Electron. Agric. 2020, 178, 105765. [Google Scholar] [CrossRef]
  61. Kang, R.; Ma, T.; Tsuchikawa, S.; Inagaki, T.; Chen, J.; Zhao, J.; Li, D.; Cui, G. Non-Destructive Near-Infrared Moisture Detection of Dried Goji (Lycium barbarum L.) Berry. Horticulturae 2024, 10, 302. [Google Scholar] [CrossRef]
  62. Pandey, P.; Mishra, G.; Mishra, H.N. Development of a Non-Destructive Method for Wheat Physico-Chemical Analysis by Chemometric Comparison of Discrete Light Based Near Infrared and Fourier Transform Near Infrared Spectroscopy. Food Meas. Charact. 2018, 12, 2535–2544. [Google Scholar] [CrossRef]
  63. Guo, Z.; Chen, X.; Zhang, Y.; Sun, C.; Jayan, H.; Majeed, U.; Watson, N.J.; Zou, X. Dynamic Nondestructive Detection Models of Apple Quality in Critical Harvest Period Based on Near-Infrared Spectroscopy and Intelligent Algorithms. Foods 2024, 13, 1698. [Google Scholar] [CrossRef]
  64. Zhang, N.; Li, P.C.; Liu, H.; Huang, T.C.; Liu, H.; Kong, Y.; Dong, Z.C.; Yuan, Y.H.; Zhao, L.L.; Li, J.H. Water and Nitrogen In-Situ Imaging Detection in Live Corn Leaves Using Near-Infrared Camera and Interference Filter. Plant Methods 2021, 17, 117. [Google Scholar] [CrossRef]
  65. Zhang, C.; Li, C.; He, M.; Cai, Z.; Feng, Z.; Qi, H.; Zhou, L. Leaf Water Content Determination of Oilseed Rape Using Near-Infrared Hyperspectral Imaging with Deep Learning Regression Methods. Infrared Phys. Technol. 2023, 134, 104921. [Google Scholar] [CrossRef]
  66. Kathirvelan, J.; Vijayaraghavan, R. An Infrared Based Sensor System for the Detection of Ethylene for the Discrimination of Fruit Ripening. Infrared Phys. Technol. 2017, 85, 403–409. [Google Scholar] [CrossRef]
  67. Lee, Y.H.; Khalil-Hani, M.; Bakhteri, R.; Nambiar, V.P. A Real-Time Near Infrared Image Acquisition System Based on Image Quality Assessment. J. Real-Time Image Process. 2017, 13, 103–120. [Google Scholar] [CrossRef]
  68. Liu, X.; Zhang, L.; Zhai, X.; Li, L.; Zhou, Q.; Chen, X.; Li, X. Polarization Lidar: Principles and Applications. Photonics 2023, 10, 1118. [Google Scholar] [CrossRef]
  69. Tan, H.; Wang, P.; Yan, X.; Xin, Q.; Mu, G.; Lv, Z. A Highly Accurate Detection Platform for Potato Seedling Canopy in Intelligent Agriculture Based on Phased Array LiDAR Technology. Agriculture 2024, 14, 1369. [Google Scholar] [CrossRef]
  70. Xu, W.; Yang, W.; Wu, J.; Chen, P.; Lan, Y.; Zhang, L. Canopy Laser Interception Compensation Mechanism—UAV LiDAR Precise Monitoring Method for Cotton Height. Agronomy 2023, 13, 2584. [Google Scholar] [CrossRef]
  71. Li, Y.; Feng, Q.; Ji, C.; Sun, J.; Sun, Y. GNSS and LiDAR Integrated Navigation Method in Orchards with Intermittent GNSS Dropout. Appl. Sci. 2024, 14, 3231. [Google Scholar] [CrossRef]
  72. Yuan, W.; Choi, D.; Bolkas, D. GNSS-IMU-Assisted Colored ICP for UAV-LiDAR Point Cloud Registration of Peach Trees. Comput. Electron. Agric. 2022, 197, 106966. [Google Scholar] [CrossRef]
  73. Murcia, H.F.; Tilaguy, S.; Ouazaa, S. Development of a Low-Cost System for 3D Orchard Mapping Integrating UGV and LiDAR. Plants 2021, 10, 2804. [Google Scholar] [CrossRef]
  74. Reji, J.; Nidamanuri, R.R. Deep Learning Based Fusion of LiDAR Point Cloud and Multispectral Imagery for Crop Classification Sensitive to Nitrogen Level. In Proceedings of the 2023 International Conference on Machine Intelligence for GeoAnalytics and Remote Sensing (MIGARS), Hyderabad, India, 27–29 January 2023; pp. 1–4. [Google Scholar] [CrossRef]
  75. Jones, H.G. Application of Thermal Imaging and Infrared Sensing in Plant Physiology and Ecophysiology. In Advances in Botanical Research; Academic Press: New York, NY, USA, 2004; Volume 41, pp. 107–163. [Google Scholar] [CrossRef]
  76. Neupane, C.; Koirala, A.; Wang, Z.; Walsh, K.B. Evaluation of Depth Cameras for Use in Fruit Localization and Sizing: Finding a Successor to Kinect v2. Agronomy 2021, 11, 1780. [Google Scholar] [CrossRef]
  77. Chen, H.; Zhou, G.; He, W.; Duan, X.; Jiang, H. Classification and Identification of Agricultural Products Based on Improved MobileNetV2. Sci. Rep. 2024, 14, 3454. [Google Scholar] [CrossRef]
  78. Hu, J.; Shen, L.; Sun, G. Squeeze-and-Excitation Networks. In Proceedings of the 2018 IEEE/CVF Conference on Computer Vision and Pattern Recognition (CVPR), Salt Lake City, UT, USA, 18–23 June 2018; pp. 7132–7141. [Google Scholar] [CrossRef]
  79. Tommaselli, A.M.G. Application of Image Processing in Agriculture. Agronomy 2023, 13, 2399. [Google Scholar] [CrossRef]
  80. Devi, P.S.; Rajan, A.S. An Inquiry of Image Processing in Agriculture to Perceive the Infirmity of Plants Using Machine Learning. Multimed. Tools Appl. 2024, 83, 80631–80640. [Google Scholar] [CrossRef]
  81. Benmouna, B.; Pourdarbani, R.; Sabzi, S.; Fernandez-Beltran, R.; García-Mateos, G.; Molina-Martínez, J.M. Attention Mechanisms in Convolutional Neural Networks for Nitrogen Treatment Detection in Tomato Leaves Using Hyperspectral Images. Electronics 2023, 12, 2706. [Google Scholar] [CrossRef]
  82. Nuanmeesri, S. Enhanced Hybrid Attention Deep Learning for Avocado Ripeness Classification on Resource Constrained Devices. Sci. Rep. 2025, 15, 3719. [Google Scholar] [CrossRef] [PubMed]
  83. Ebrahimi, M.A.; Khoshtaghaza, M.H.; Minaee, S.; Jamshidi, B. Vision-Based Pest Detection Based on SVM Classification Method. Comput. Electron. Agric. 2017, 137, 52–58. [Google Scholar] [CrossRef]
  84. Mirzaee-Ghaleh, E.; Omid, M.; Keyhani, A.; Dalvand, M.J. Comparison of fuzzy and on/off controllers for winter season indoor climate management in a model poultry house. Comput. Electron. Agric. 2015, 112, 187–195. [Google Scholar] [CrossRef]
  85. Ren, S.; He, K.; Girshick, R.; Sun, J. Faster R-CNN: Towards Real-Time Object Detection with Region Proposal Networks. IEEE Trans. Pattern Anal. Mach. Intell. 2017, 39, 1137–1149. [Google Scholar] [CrossRef] [PubMed]
  86. Alruwaili, M.; Siddiqi, M.H.; Khan, A.; Azad, M.; Khan, A.; Alanazi, S. RTF-RCNN: An Architecture for Real-Time Tomato Plant Leaf Diseases Detection in Video Streaming Using Faster-RCNN. Bioengineering 2022, 9, 565. [Google Scholar] [CrossRef]
  87. Hou, B. Theoretical Analysis of the Network Structure of Two Mainstream Object Detection Methods: YOLO and Fast RCNN. Appl. Comput. Eng. 2023, 17, 213–225. [Google Scholar] [CrossRef]
  88. Wang, Z.; Su, Y.; Kang, F.; Wang, L.; Lin, Y.; Wu, Q.; Li, H.; Cai, Z. PC-YOLO11s: A Lightweight and Effective Feature Extraction Method for Small Target Image Detection. Sensors 2025, 25, 348. [Google Scholar] [CrossRef]
  89. Cao, J.; Bao, W.; Shang, H.; Yuan, M.; Cheng, Q. GCL-YOLO: A GhostConv-Based Lightweight YOLO Network for UAV Small Object Detection. Remote Sens. 2023, 15, 4932. [Google Scholar] [CrossRef]
  90. Jiang, K.; Xie, T.; Yan, R.; Wen, X.; Li, D.; Jiang, H.; Jiang, N.; Feng, L.; Duan, X.; Wang, J. An Attention Mechanism-Improved YOLOv7 Object Detection Algorithm for Hemp Duck Count Estimation. Agriculture 2022, 12, 1659. [Google Scholar] [CrossRef]
  91. Attri, I.; Awasthi, L.K.; Sharma, T.P.; Rathee, P. A Review of Deep Learning Techniques Used in Agriculture. Ecol. Inform. 2023, 77, 102217. [Google Scholar] [CrossRef]
  92. Vite-Chávez, O.; Flores-Troncoso, J.; Olivera-Reyna, R.; Munoz-Minjares, J.U. Improvement Procedure for Image Segmentation of Fruits and Vegetables Based on the Otsu Method. Image Anal. Stereol. 2023, 42, 185–196. [Google Scholar] [CrossRef]
  93. Zhang, C.; Li, T.; Li, J. Detection of Impurity Rate of Machine-Picked Cotton Based on Improved Canny Operator. Electronics 2022, 11, 974. [Google Scholar] [CrossRef]
  94. Hamedpour, V.; Oliveri, P.; Malegori, C.; Minami, T. Development of a Morphological Color Image Processing Algorithm for Paper-Based Analytical Devices. Sens. Actuators B Chem. 2020, 322, 128571. [Google Scholar] [CrossRef]
  95. Long, J.; Shelhamer, E.; Darrell, T. Fully Convolutional Networks for Semantic Segmentation. In Proceedings of the 2015 IEEE Conference on Computer Vision and Pattern Recognition (CVPR), Boston, MA, USA, 7–12 June 2015; pp. 3431–3440. [Google Scholar] [CrossRef]
  96. Li, Y.; Guo, Y.; Li, Y.; Ji, Y.; Wu, Y.; Chen, Y.; Han, Y.; Han, Y.; Liu, Y.; Ruan, Y.; et al. An Improved U-Net and Attention Mechanism-Based Model for Sugar Beet and Weed Segmentation. Front. Plant Sci. 2025, 16, 123456. [Google Scholar] [CrossRef] [PubMed]
  97. Paulus, S. Measuring Crops in 3D: Using Geometry for Plant Phenotyping. Plant Methods 2019, 15, 103. [Google Scholar] [CrossRef]
  98. Jiang, L.; Li, C.; Fu, L. Apple Tree Architectural Trait Phenotyping with Organ-Level Instance Segmentation from Point Cloud. Comput. Electron. Agric. 2025, 229, 109708. [Google Scholar] [CrossRef]
  99. Yuan, Q.; Wang, P.; Luo, W.; Zhou, Y.; Chen, H.; Meng, Z. Simultaneous Localization and Mapping System for Agricultural Yield Estimation Based on Improved VINS-RGBD: A Case Study of a Strawberry Field. Agriculture 2024, 14, 784. [Google Scholar] [CrossRef]
  100. Zare, M.; Helfroush, M.S.; Kazemi, K.; Scheunders, P. Hyperspectral and Multispectral Image Fusion Using Coupled Non-Negative Tucker Tensor Decomposition. Remote Sens. 2021, 13, 2930. [Google Scholar] [CrossRef]
  101. Guo, H.; Bao, W.; Qu, K.; Ma, X.; Cao, M. Multispectral and Hyperspectral Image Fusion Based on Regularized Coupled Non-Negative Block-Term Tensor Decomposition. Remote Sens. 2022, 14, 5306. [Google Scholar] [CrossRef]
  102. Qiao, M.; He, X.; Cheng, X.; Li, P.; Zhao, Q.; Zhao, C.; Tian, Z. KSTAGE: A Knowledge-Guided Spatial-Temporal Attention Graph Learning Network for Crop Yield Prediction. Inf. Sci. 2023, 619, 19–37. [Google Scholar] [CrossRef]
  103. Ye, Z.; Zhai, X.; She, T.; Liu, X.; Hong, Y.; Wang, L.; Zhang, L.; Wang, Q. Winter Wheat Yield Prediction Based on the ASTGNN Model Coupled with Multi-Source Data. Agronomy 2024, 14, 2262. [Google Scholar] [CrossRef]
  104. Kwaghtyo, D.K.; Eke, C.I. Smart Farming Prediction Models for Precision Agriculture: A Comprehensive Survey. Artif. Intell. Rev. 2023, 56, 5729–5772. [Google Scholar] [CrossRef]
  105. Akkem, Y.; Biswas, S.K.; Varanasi, A. Smart Farming Using Artificial Intelligence: A Review. Eng. Appl. Artif. Intell. 2023, 120, 105899. [Google Scholar] [CrossRef]
  106. Vonikakis, V.; Kouskouridas, R.; Gasteratos, A. On the Evaluation of Illumination Compensation Algorithms. Multimed. Tools Appl. 2018, 77, 9211–9231. [Google Scholar] [CrossRef]
  107. Nitin Gupta, S.B.; Yadav, R.; Bovand, F.; Tyagi, P.K. Developing Precision Agriculture Using Data Augmentation Framework for Automatic Identification of Castor Insect Pests. Front. Plant Sci. 2023, 14, 1101943. [Google Scholar] [CrossRef]
  108. Li, Y.; Zhao, Q.; Hu, P.; Zhang, H.; Zhang, Z.; Liu, X.; Zhou, J. Adaptive Exposure Control for Line-Structured Light Sensors Based on Global Grayscale Statistics. Sensors 2025, 25, 1195. [Google Scholar] [CrossRef]
  109. Hsu, W.-Y.; Cheng, H.-C. A Novel Automatic White Balance Method for Color Constancy Under Different Color Temperatures. IEEE Access 2021, 9, 111925–111937. [Google Scholar] [CrossRef]
  110. Dhal, K.G.; Das, A.; Ray, S.; Gálvez, J.; Das, S. Histogram Equalization Variants as Optimization Problems: A Review. Arch. Comput. Methods Eng. 2021, 28, 1471–1496. [Google Scholar] [CrossRef]
  111. Liu, M.; Chen, J.; Han, X. Research on Retinex Algorithm Combining with Attention Mechanism for Image Enhancement. Electronics 2022, 11, 3695. [Google Scholar] [CrossRef]
  112. Zheng, J.; Xu, C.; Zhang, W.; Yang, X. Single Image Dehazing Using Global Illumination Compensation. Sensors 2022, 22, 4169. [Google Scholar] [CrossRef]
  113. Pang, S.; Thio, T.H.G.; Siaw, F.L.; Chen, M.; Xia, Y. Research on Improved Image Segmentation Algorithm Based on GrabCut. Electronics 2024, 13, 4068. [Google Scholar] [CrossRef]
  114. Avola, G.; Matese, A.; Riggi, E. An Overview of the Special Issue on “Precision Agriculture Using Hyperspectral Images”. Remote Sens. 2023, 15, 1917. [Google Scholar] [CrossRef]
  115. Xin, J.; Cao, X.; Xiao, H.; Liu, T.; Liu, R.; Xin, Y. Infrared Small Target Detection Based on Multiscale Kurtosis Map Fusion and Optical Flow Method. Sensors 2023, 23, 1660. [Google Scholar] [CrossRef]
  116. Yang, G.; Yang, H.; Yu, S.; Wang, J.; Nie, Z. A Multi-Scale Dehazing Network with Dark Channel Priors. Sensors 2023, 23, 5980. [Google Scholar] [CrossRef]
  117. Liu, Z.; Xiao, G.; Liu, H.; Wei, H. Multi-Sensor Measurement and Data Fusion. IEEE Instrum. Meas. Mag. 2022, 25, 28–36. [Google Scholar] [CrossRef]
  118. Guan, Z.; Li, H.; Chen, X.; Mu, S.; Jiang, T.; Zhang, M.; Wu, C. Development of Impurity-Detection System for Tracked Rice Combine Harvester Based on DEM and Mask R-CNN. Sensors 2022, 22, 9550. [Google Scholar] [CrossRef]
  119. Liu, Z.; Yang, T.; Li, P.; Wang, J.; Xu, J.; Jin, C. The Design and Experimentation of a Differential Grain Moisture Detection Device for a Combined Harvester. Sensors 2024, 24, 4551. [Google Scholar] [CrossRef] [PubMed]
  120. Chen, W.-M.; Tsai, H.-H.; Ling, J.F. Parallel Computation of Dominance Scores for Multidimensional Datasets on GPUs. IEEE Trans. Parallel Distrib. Syst. 2024, 35, 919–931. [Google Scholar] [CrossRef]
  121. Kumar, U.S.; Kapali, B.S.C.; Nageswaran, A.; Umapathy, K.; Jangir, P.; Swetha, K.; Begum, M.A. Fusion of MobileNet and GRU: Enhancing Remote Sensing Applications for Sustainable Agriculture and Food Security. Remote Sens. Earth Syst. Sci. 2025, 8, 118–131. [Google Scholar] [CrossRef]
  122. Shen, L.; Su, J.; He, R.; Song, L.; Huang, R.; Fang, Y.; Song, Y.; Su, B. Real-Time Tracking and Counting of Grape Clusters in the Field Based on Channel Pruning with YOLOv5s. Comput. Electron. Agric. 2023, 206, 107662. [Google Scholar] [CrossRef]
  123. Xu, Y.; Zhang, Y.; Wang, Y.; Li, X. Fruit Fast Tracking and Recognition of Apple Picking Robot Based on Improved YOLOv5. IET Image Process. 2024, 18, 3179–3191. [Google Scholar] [CrossRef]
  124. Li, H.; Du, Y.Q.; Xiao, X.Z.; Chen, Y.X. Remote Sensing Identification Method of Cultivated Land at Hill County of Sichuan Basin Based on Deep Learning. Smart Agric. 2024, 6, 34–45. [Google Scholar] [CrossRef]
  125. Zhang, J.; Chen, Y.; Qin, Z.; Zhang, M.; Zhang, J. Study on Terrace Remote Sensing Extraction Based on Improved DeepLab v3+ Model. Smart Agric. 2024, 6. [Google Scholar] [CrossRef]
  126. Zhang, J.; Wu, T.; Luo, J.; Hu, X.; Wang, L.; Li, M.; Lu, X.; Li, Z. Toward Agricultural Cultivation Parcels Extraction in the Complex Mountainous Areas Using Prior Information and Deep Learning. In IEEE Transactions on Geoscience and Remote Sensing; IEEE: New York, NY, USA, 2025. [Google Scholar]
  127. Chinese Academy of Sciences, Aerospace Information Innovation Institute. AI and Remote Sensing Fusion Technology Developed to Quantify Forage Planting Potential in Arid and Semi-Arid Basins of Northern China. China Daily. 29 September 2025. Available online: https://www.aircas.cn/dtxw/cmsm/202509/t20250929_7982637.html (accessed on 10 October 2025).
  128. Chinese Academy of Sciences, Northeast Institute of Geography and Agroecology. China’s First DeepSeek-Driven Intelligent Platform for Black Soil Protection Put into Trial Operation. China News Service. 28 April 2025. Available online: https://www.iga.ac.cn/news/cmsm/202504/t20250428_7618122.html (accessed on 10 October 2025).
  129. Anonymous. New Idea of Agricultural Machinery Path Planning Based on Spatio-Temporal Graph Convolutional Network (Complex Terrain Optimization Practice). CSDN Blog. 26 May 2025. Available online: https://blog.csdn.net/m0_38141444/article/details/148218324 (accessed on 10 October 2025).
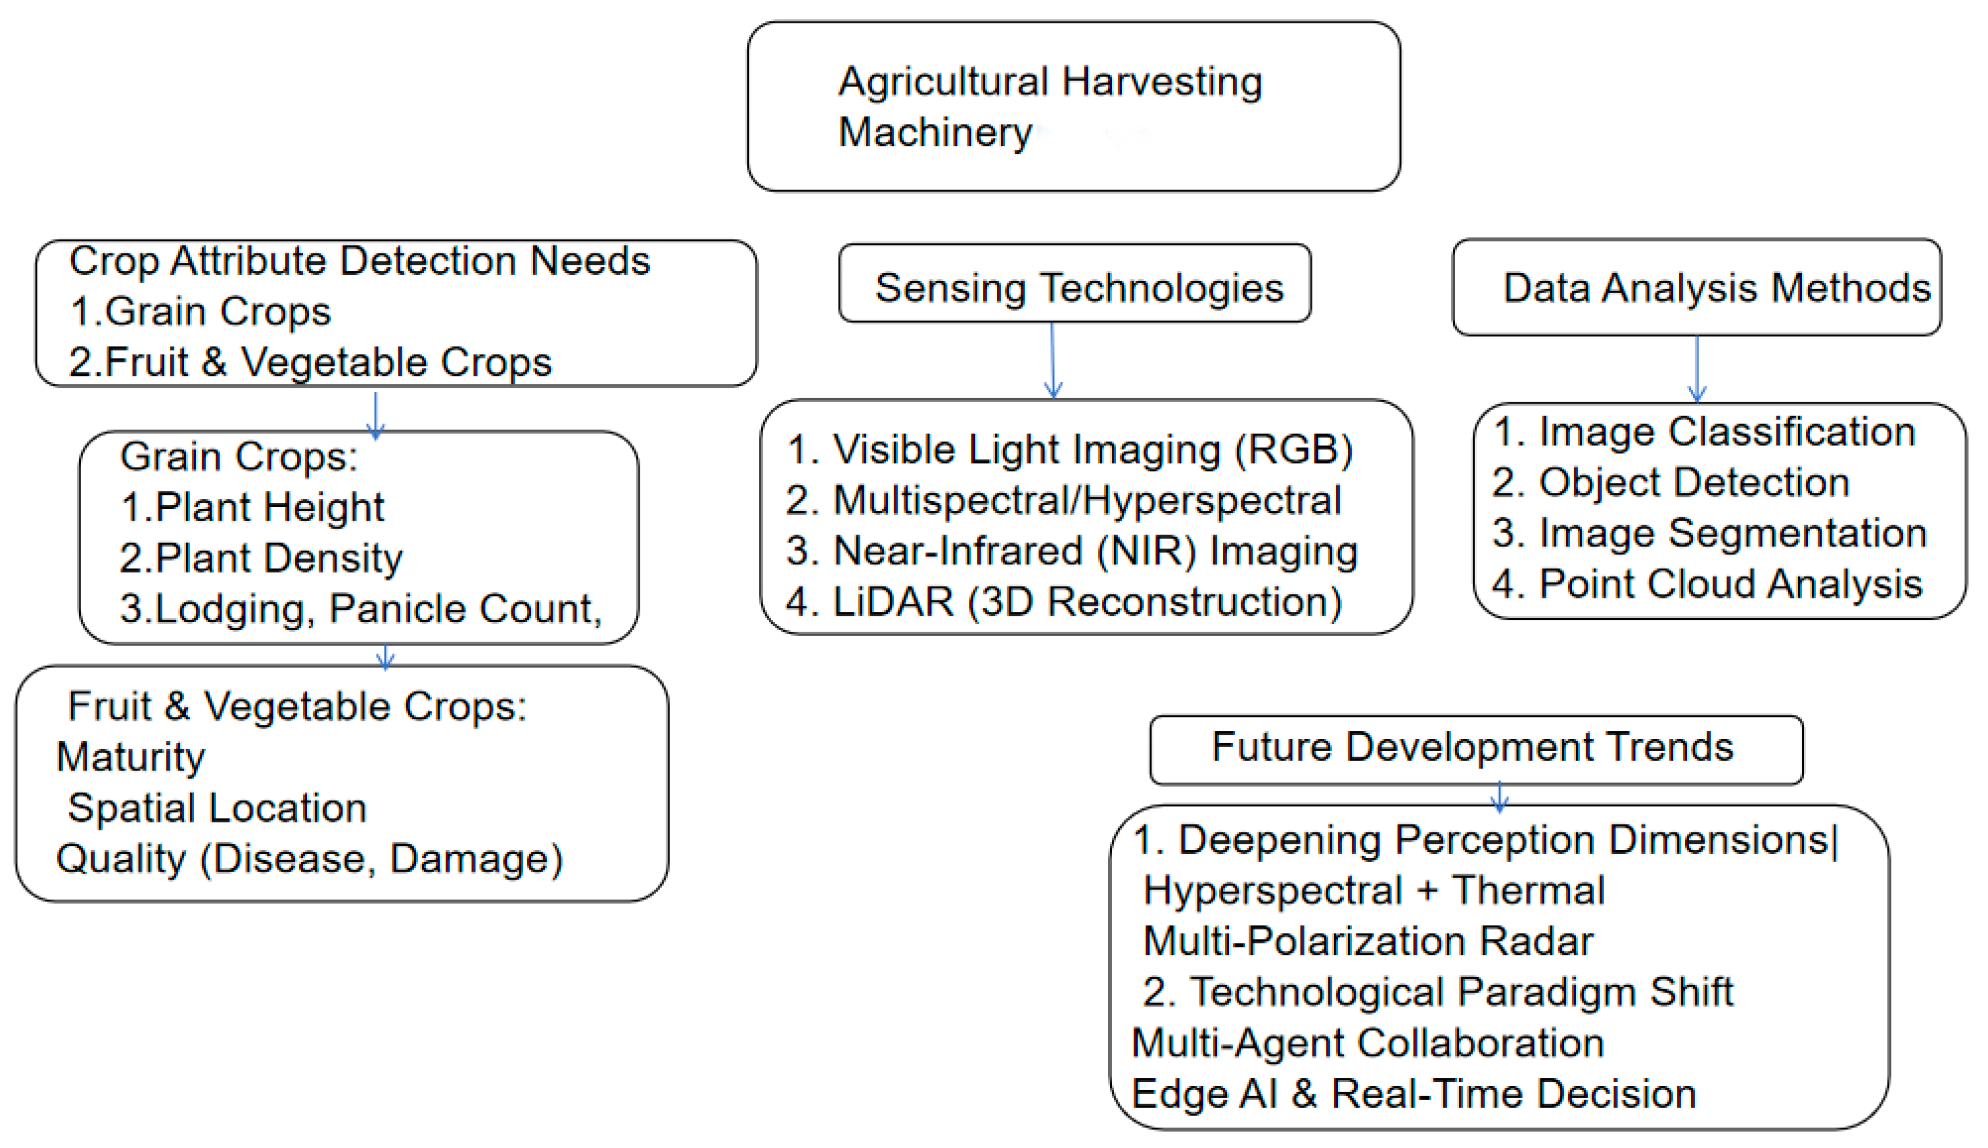
Figure 1. Logic diagram of the article.
Agriengineering 07 00365 g001
Figure 2. Schematic Diagram of Wheat Morphological Differences at Different Growth Stages. Cited from reference [19].
Agriengineering 07 00365 g002
Figure 3. Plant Height Detection Map.
Agriengineering 07 00365 g003
Figure 4. Distribution Map of Crop and Weed. Cited from reference [25].
Agriengineering 07 00365 g004
Figure 5. Hyperspectral Imaging Pipeline for Obtaining Mean Spectrum of Processing Tomatoes. Cited from reference [38].
Agriengineering 07 00365 g005
Figure 6. Schematic Diagram of Fruit Spatial Localization. Cited from reference [40].
Agriengineering 07 00365 g006
Figure 7. Experiment results: (ad) training images; (eh) test images. Cited from reference [45].
Agriengineering 07 00365 g007
Figure 8. Sensor Classification for Crop Attribute Monitoring.
Agriengineering 07 00365 g008
Figure 9. Physical Diagram of an RGB Camera.
Agriengineering 07 00365 g009
Figure 10. Details of the low-cost proximal sensor system installed for remote monitoring: (A) spectral camera and (B) and Raspberry Pi 4 computer board. Picture not scaled. Cited from reference [55].
Agriengineering 07 00365 g010
Figure 11. Near-Infrared (NIR) Imaging of Corn Leaves.
Agriengineering 07 00365 g011
Figure 12. Classification of Data Analysis Methods for Crop Attribute Detection.
Agriengineering 07 00365 g012
Figure 13. Schematic Diagram of the Channel Attention Module in Convolutional Neural Networks.
Agriengineering 07 00365 g013
Figure 14. Network Structure Diagram of Fast RCNN for Crop Target Detection. Cited from reference [86].
Agriengineering 07 00365 g014
Figure 15. Fully Convolutional Network (FCN) for Semantic Segmentation of Crop Lesions. Cited from website https://blog.csdn.net/CVHub/article/details/148202576 (accessed on 10 October 2025).
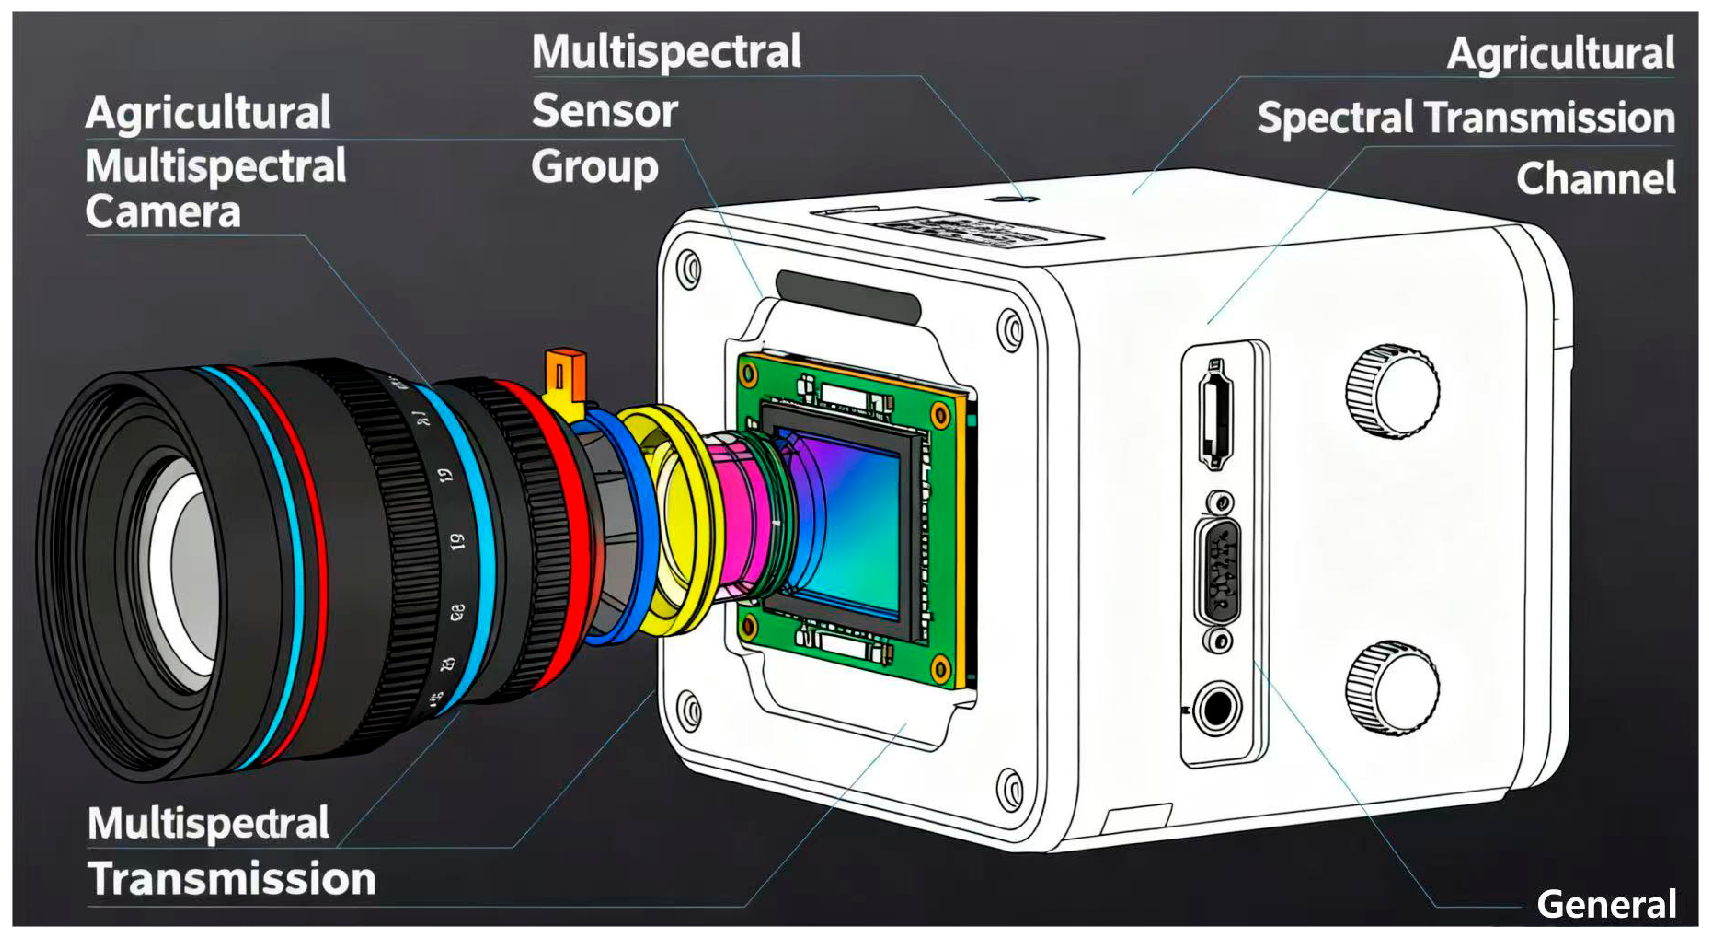
Agriengineering 07 00365 g015
Figure 16. Instance segmentation of apple tree point cloud based on skeleton extraction. (a,c) are instance annotations, and (b,d) are instance prediction results. Different colors represent different instances. Cited from reference [98].
Agriengineering 07 00365 g016
Table 1. Comparison of Core Sensing Technologies for Crop Attribute Monitoring.
Sensing TechnologyCore Working PrincipleAdvantagesDisadvantagesTypical Applications
RGB CameraCaptures visible light (R/G/B bands) to generate color images; extracts appearance features (color, shape, texture)Low cost and easy to operateLimited to visible spectrum (cannot detect internal crop attributes)Corn stem diameter detection (combines RGB-D depth information to extract contours)
High image clarity for surface feature recognitionSusceptible to lighting variations (e.g., shadows in hilly terrain) and background clutterCorn disease classification (removes background interference via deep learning)
Widely compatible with edge devices (e.g., harvesters, UAVs)Fruit counting and surface defect identification (e.g., tomato skin blemishes)
Multispectral SensorCaptures 4–10 discrete bands (including NIR); calculates vegetation indices (e.g., NDVI) to invert crop statusBalances data richness and computational efficiencyDiscrete bands limit fine-grained attribute detection (e.g., cannot distinguish sugar-acid ratio)Sugarcane hail damage mapping (uses NDVI threshold model)
Suitable for large-scale field monitoring (e.g., UAV-mounted)Accuracy declines under dense canopy occlusion (common in hilly orchards)Wheat group health assessment (inverts nitrogen content via NDVI)
Low power consumption (long endurance for hilly terrain surveys)Hilly field crop distribution mapping (UAV-based multispectral imaging)
Hyperspectral SensorCaptures dozens to hundreds of continuous narrow bands; obtains “spectral fingerprints” for biochemical composition analysis.High spectral resolution (detects early stress and internal attributes)High cost and large data volume (heavy computational burden)Processing tomato maturity grading (combines NIR hyperspectral imaging with RNN, R2 > 0.87)
Enables non-destructive testing (e.g., fruit sugar content, hidden lesions)
data
data
Slow imaging speed (hard to match high-speed harvest operations)Early apple disease detection (extracts lesion reflectance features across bands)
Sensitive to atmospheric scattering (hilly fog affects data quality)
data
Wheat protein content inversion (spectral absorption at specific wavelengths)
Near-Infrared (NIR) CameraDetects 700–1400 nm band; uses absorption characteristics of water, sugar, and protein to invert internal physiological parameters.Penetrates crop tissues (detects internal attributes like hidden bruises)Limited penetration depth (ineffective for thick-skinned crops like citrus)Corn leaf water/nitrogen content in situ imaging (uses NIR + interference filters)
Fast response (suitable for real-time harvest monitoring)Susceptible to ambient temperature (hilly diurnal temperature variation interferes with data)Apple early bruise detection (combines NIR imaging with adaptive threshold segmentation)
Lower cost than hyperspectral sensorsGrain moisture content measurement (guides harvester drying system adjustment)
LiDAR (Light Detection and Ranging)Emits laser pulses; calculates distance via time-of-flight to generate 3D point clouds for spatial structure modeling.High spatial precision (cm-level accuracy for plant height, fruit location)High cost (especially multi-line LiDAR)Soybean plant height estimation (UAV-LiDAR point cloud + ground truth validation)
Unaffected by lighting (works in low-light hilly mornings/evenings)Point cloud noise (hilly terrain vibrations cause data distortion)Apple orchard organ segmentation (PointNeXt network, branch counting accuracy 93.4%)
Captures 3D canopy structure (resolves occlusion issues)Large data storage requirements (needs edge computing for real-time processing)Wheat lodging angle detection (analyzes point cloud surface normal variation)
Table 2. Comparison of Core Data Analysis Methods for Crop Attribute Monitoring.
Data Analysis MethodCore Task ObjectiveAdvantagesDisadvantagesTypical Applications
Image ClassificationMaps entire images to predefined categories (e.g., “mature/immature,” “healthy/diseased”)Simple model structure (easy to deploy on edge devices)Cannot locate targets (only outputs overall image labels)Tomato maturity grading (MobileNet model + Lab color space b channel)
Fast inference speed (meets harvest real-time requirements, <100 ms)Poor performance in complex backgrounds (hilly weed interference reduces accuracy)
data
Wheat variety identification (adds attention mechanism to resist background clutter)
Effective for batch attribute screeningCrop health status batch screening (UAV RGB image classification)
Object DetectionLocates multiple targets and outputs “category + bounding box” (e.g., fruit position, spike count)Integrates localization and classification (supports harvest path planning)Higher computational cost than image classificationGrape cluster counting (pruned YOLOv5s, balances speed and accuracy)
Adaptable to multi-target scenarios (e.g., dense fruit clusters)Small target detection accuracy declines (e.g., wheat spikelets in hilly wind-blown canopies)Corn ear localization (Faster R-CNN, resolves leaf occlusion)
Image SegmentationPerforms pixel-level semantic labeling (e.g., “fruit/leaf/branch,” “diseased area/healthy area”)High spatial resolution (extracts fine-grained regions like small lesions)Complex model training (needs large-scale pixel-level annotations)Wheat stripe rust lesion segmentation (Attention U-Net, accuracy > 90%)
Enables quantitative analysis (e.g., lodging area ratio)
data
Slow inference (hard to match high-speed harvesters)
data
Rice lodging area mapping (semantic segmentation + lodging angle statistics)
Overlapping apple separation (Mask R-CNN, supports robotic arm grasping)
Point Cloud AnalysisProcesses 3D point clouds to extract spatial structure attributes (e.g., plant height, canopy porosity)Captures 3D geometric features (resolves 2D image occlusion issues)High data preprocessing requirements (needs denoising, downsampling)Corn canopy structure analysis (voxel grid division + porosity calculation)
Unaffected by color/lighting (stable in hilly variable environments)Deep learning models are complex (e.g., PointNet requires large training datasets)Fruit tree height prediction (CHM from LiDAR DSM-DTM, R2 = 0.987)
Tensor DecompositionProcesses multi-dimensional data (e.g., time-series hyperspectral + meteorological data) to extract coupled featuresPreserves spatiotemporal correlations (captures dynamic crop growth trends)Requires prior knowledge of tensor structure (poor adaptability to new crops)Corn ear development monitoring (3D tensor: time + space + spectrum)
Reduces data dimensionality (alleviates computational burden)Sensitive to missing data (hilly sensor malfunctions cause errors)Multi-modal data fusion (visible light + thermal infrared + fluorescence images)
Graph Neural Networks (GNNs)Models spatial topological relationships (e.g., fruit-branch connections, plant competition)Captures non-Euclidean data features (e.g., grape cluster adjacency)Dependent on graph construction quality (poor topology leads to errors)Winter wheat yield prediction (ASTGNN, fuses remote sensing + soil data, R2 = 0.70)
Supports small-sample learning (reduces annotation cost)Slow inference for large-scale fields (hilly large orchards need parallel computing)Grape berry integrity assessment (constructs fruit connection graphs)
Crop population competition analysis (models plant interaction via graph edges)
Table 3. Keywords.
Table 3. Keywords.
DimensionKeywords
Study ContextHilly regions, Mountainous areas, Uneven terrain
Crop AttributesCrop attribute monitoring, Maturity detection, Plant height, Fruit location, Crop quality, Lodging detection
Technical MethodsSensing technology (LiDAR, NIR spectroscopy, Hyperspectral imaging, RGB-D), Deep learning (CNN, YOLO, PointNet), Machine learning (Random Forest, SVM)
Disclaimer/Publisher’s Note: The statements, opinions and data contained in all publications are solely those of the individual author(s) and contributor(s) and not of MDPI and/or the editor(s). MDPI and/or the editor(s) disclaim responsibility for any injury to people or property resulting from any ideas, methods, instructions or products referred to in the content.