1. Introduction
Vibrations are dynamic mechanical responses that manifest within elastic or quasi-elastic continua as a consequence of localized excitation, propagating as oscillatory disturbances throughout the medium. In the context of mechanical structures, such as the operator’s seats of self-propelled agricultural vehicles, these vibrations predominantly occur within the low-frequency range and directly influence both the operator’s comfort and the dynamic behavior of the assembly subjected to the specific excitations generated by uneven terrain.
Operators of self-propelled agricultural vehicles are frequently exposed to whole-body vibrations (WBV) since they operate the vehicle for extended periods under varying and often irregular terrain conditions [
1].
Specialized literature has demonstrated that prolonged exposure of operators to vibrations during the use of heavy tractor-type agricultural machinery constitutes one of the most significant risk factors contributing to the development of chronic disorders [
2,
3,
4]. Although these conditions do not necessarily lead to premature mortality, they may result in considerable disabilities, producing a substantial socio-economic and human impact [
5,
6]. Vibrations transmitted by agricultural vehicles have been correlated with numerous health problems. The literature highlights effects such as fatigue, muscle and joint pain, and, in some cases, circulatory and digestive disorders [
7,
8,
9,
10,
11,
12].
Whole-body vibrations occur when a significant portion of the body weight is supported by a surface undergoing oscillatory motion, as is the case with operator’s seats in agricultural vehicles. In the context of tractor operations on uneven agricultural terrains, such as vegetable greenhouses, WBV exposure is primarily experienced in the seated posture. In such scenarios, vibrations are transmitted to the operator via both the seat cushion and the backrest. Previous studies have emphasized the importance of conducting biodynamic analyses of the human body in the seated position, with a particular focus on the vibrational energy absorbed by the body, which is considered a critical indicator for assessing the discomfort generated by vibrations.
Several external factors affect operator comfort during tractor operation, including the running surface characteristics, the vehicle suspension system, and the seat suspension system [
13]. Recent studies have also emphasized the significance of terrain irregularities and surface types in amplifying whole-body vibration (WBV) exposure during tractor operation. For instance, ref [
14] reported notable variations in vibration magnitude transmitted to the operator when driving a tractor with a timber trailer across uneven and off-road conditions, confirming that terrain characteristics represent a major determinant of operator comfort and health risk [
14].
Research conducted in [
15,
16] highlights the importance of the proper functioning of suspension components to ensure optimal driving conditions. The same studies underline the need for an efficient balance between suspended and unsuspended masses, aiming to achieve a favorable dynamic equilibrium, reduce vibration levels, and enhance both operator comfort and operational safety. Vibrations are primarily transmitted to the operator’s body through the vehicle seat, a fact frequently reported in the literature. Studies dedicated to WBV analysis highlight the direct influence of key vehicle components on the level of vibrations perceived by the operator. Among these components are the cabin structure, tire characteristics and pressure, and the efficiency of the seat suspension system—all of which have a significant impact on both the operator’s comfort and health protection during operations on uneven terrain [
17,
18,
19,
20,
21,
22,
23].
To evaluate operator exposure to WBV, specialized studies often refer to the ISO 2631-1 standard [
23], which defines vibration measurement methods and establishes the frequency range of 0–80 Hz as critical for both comfort and health protection [
24].
According to the ISO 2631-1:1997 standard, the assessment of whole-body vibration exposure is based on two primary quantitative indicators: the frequency-weighted root mean square acceleration (awr.m.s) and the Vibration Dose Value (VDV), which are used to evaluate both the comfort level and the potential health risks associated with prolonged exposure to mechanical vibrations transmitted to the human body.
In this study, the frequency-weighted root mean square acceleration (awr.m.s) was determined and calculated using the VATS vibration analysis software, based on the raw acceleration data collected during the experimental tests. The data were filtered, processed, and analyzed in the frequency domain through algorithms implemented in accordance with the requirements of ISO 2631-1.
In the context of this study, a
wr.m.s represents the mean weighted acceleration, expressed as the root mean square (r.m.s.) value, and was evaluated along the three measurement axes (X, Y, and Z). The formula used for calculating this value is presented in Equation (1).
where
awr.m.s is the root mean square (r.m.s),
a2w (t) is frequency-weighted acceleration at time t, and T is the measurement time.
The Vibration Dose Value (VDV) is primarily applied in situations where the vibration exposure consists predominantly of transient events, shocks, or impulsive phenomena, reflecting cumulative effects over time. The corresponding calculation formula for determining VDV is provided in Equation (2).
where
is the frequency-weighted instantaneous acceleration, and T is the measurement time.
Although the VDV parameter is integrated into the VATS analysis module, the short exposure duration of the operator during the experimental tests did not allow for a meaningful estimation of cumulative vibration dose values. Therefore, the VDV evaluation was not considered in the present study.
Recent studies have highlighted that prolonged exposure to vibrations exceeds the thresholds recommended by ISO 2631-1, potentially generating significant health and safety risks for operators [
25,
26]. To mitigate the negative effects of vibrations on operators, it is essential to analyze intermediate elements located between the vibration source and the operator’s body, such as seat suspension systems and the materials used in damping cushions.
Recent research underscores the importance of optimizing these factors to enhance operator comfort and reduce the risks of lower back pain and other musculoskeletal disorders caused by seat-transmitted vibrations in self-propelled agricultural vehicles [
27].
Seats in agricultural vehicles are subjected to vibrations influenced by multiple factors, including vehicle type, travel speed, terrain conditions, and other specific parameters. The seated operator is predominantly subjected to whole-body vibrations transmitted through the seat structure, thereby rendering the assessment of the seat’s dynamic response a critical component in quantifying WBV exposure. Although vibrations are also transmitted via feet and hands, this study focuses mainly on evaluating the seat’s role in operator exposure.
To minimize the adverse operator response to vibrations caused by both tractor operation and terrain irregularities, the seat must feature optimized dynamic properties. The dynamic performance of a vehicle seat is controlled by the interrelation of three essential parameters: the vibrational conditions (vehicle displacement on heterogeneous terrains at specific operating speeds), the seat suspension’s vibration isolation capacity, and the human body’s response to vibrations. Generally, seat optimization aims to achieve: enhanced operator comfort, reduced vibrations transmitted to the human body and minimized health risks.
The operator’s seat demonstrates a fundamental resonant frequency within the 2–4 Hz range, while the 4–8 Hz frequency band is considered critical, corresponding to peak human sensitivity to vertical vibration exposure. In
Figure 1, operator positions A and B represent incorrect postures, resulting from the non-uniform distribution of pressure on the intervertebral disks due to insufficient lumbar support. Conversely, position C illustrates a correct seated posture aided by a pneumatic lumbar support, which contributes to the proper alignment of the spinal column and an optimal pressure distribution on the intervertebral disks.
In recent decades, numerical modeling and computer-based simulation have become essential complementary methods for analyzing vibration transmission, enabling the estimation of forces and displacements at the vehicle-seat interface under various operating scenarios.
Within this framework, the Finite Element Method (FEM) is extensively applied to investigate the coupled dynamic interaction between the operator and the seat structure. For example, the authors of [
29,
30] analyzed, using FEM, the distribution of pressure and contact stresses between the operator’s body and the seat, highlighting their impact on the perceived comfort during the operation of agricultural vehicles. Based on the findings from previous studies, the present research focuses on the analysis of operator comfort in the operator’s seat of a self-propelled agricultural vehicle, considering two configurations of seat suspension height, with the backrest fixed at a 90° angle.
According to the experimental protocol established in this study, the backrest of the operator’s seat was fixed at an angle of 90°, representing the standard adjustment setting of the tractor seat configuration. This choice ensured the repeatability of measurements and consistency across all tests. Although minor variations in operator posture and movement may occur during real-world driving, their influence on vibration transmissibility was limited under the controlled test conditions.
Each experimental trial was repeated three times to ensure result accuracy, and the raw acceleration data recorded by the sensors placed on the seat pan and backrest were individually processed and segmented using the Biometrics specialized software. This approach enabled a clear separation of the vibration response at each measurement point, leading to a robust evaluation of vibration transmissibility from the seat structure to the operator.
The study employs FEM using the Altair SimSolid software 2024 to simulate the vibrational behavior of the operator’s seat within the frequency range of 0–80 Hz, which corresponds to the critical zone for both operator comfort and health protection, as defined by the ISO 2631-1 international standard.
The primary objective is to identify the natural frequencies and natural vibration modes of the seat for each seat suspension configuration, in order to understand its dynamic response to external excitations and to establish a foundation for optimizing operator comfort during the operation of the agricultural machine. In this study, the aim is to validate the FEA modal analysis of the operator’s seat of the TE-0 electric tractor by correlating theoretical results with experimental measurements performed under realistic experimental conditions on an uneven, grass-covered soil track, maintained at a constant forward speed of 5 km/h.
The second objective of this study is to compare the vibration modes between the two seat suspension configurations of the tractor—S1 (stiff suspension, 10 cm height) and S2 (soft suspension, 20 cm height)—highlighting how suspension stiffness influences the natural frequencies of the seat, with direct implications for operator comfort.
For the evaluation of each vibration mode, the modal participation factors were computed for each of the three principal axes of motion (X, Y, and Z), which allowed the calculation of the cumulative participation factors. Higher values of these factors indicate a greater influence of the corresponding modes on the seat dynamics, having a direct impact on the transmission of vibrations to the operator. Therefore, the modal analysis carried out in this study provides a comprehensive understanding of the vibrational behavior of the tractor operator’s seat, paving the way for the optimization of suspension design and the improvement of working conditions for operators.
2. Materials and Methods
2.1. Experimental Setup, Tractor Specifications, and Testing Protocol
This study analyzes the impact of vibrations transmitted to the operator of an electric tractor through a detachable seat, which was specially mounted for experimental measurements. The goal is to collect accurate data to enable the comparison of different types of tractors used in agricultural operations.
The measurements were performed on a sample of seven operators, selected to cover a wide range of anthropometric parameters, thus ensuring the representativeness of the results. The tests were carried out under identical conditions on an uneven terrain.
Previous studies exhibit significant gaps, including variations in testing conditions, the lack of correlation between terrain type and vibration levels, as well as the neglect of operators’ anthropometric characteristics. These limitations reduce the accuracy of conclusions regarding vibration transmissibility.
The present research addresses these limitations through a detailed analysis of the vibrational behavior of the seat, considering a homogeneous sample of subjects with average anthropometric dimensions representative of agricultural machinery operators.
The study highlights the effects of vibrations on both operator comfort and performance, showing that seat suspension stiffness has a direct influence on the perception of comfort. Furthermore, prolonged exposure to excessive vibrations may lead to fatigue and a decrease in operator performance.
The experimental tests were conducted with a sample of participating operators, consisting exclusively of male subjects aged between 27 and 50 years, selected according to the ISO 7250 “Basic Anthropometric Data” [
31] standard to ensure representativeness and ergonomic consistency. The average anthropometric parameters used for the operator sample are summarized in
Table 1.
All seven operators who formed the sample of participants in the experimental tests had experience in operating agricultural tractors, held a valid driving license, and were medically certified as fit for participation in the study. Each participant provided written informed consent prior to testing, acknowledging their voluntary involvement. None of the operators suffered from lumbar or spinal disorders, ensuring that the vibration data collected were not influenced by any pre-existing medical conditions.
An improvement of these aspects is achieved through a comparative evaluation of the two seat suspension configurations (S1 and S2) by integrating experimental results obtained on an uneven grass-covered terrain, in order to better reflect real operating scenarios, such as those encountered on greenhouse farmland. This approach provides a more realistic solution for operators working on surfaces with moderate vibration levels.
The data collected from the accelerometer sensors mounted on the seat and backrest provided detailed information regarding the vibration transmission mechanism and were used to validate the FEA modal analysis, contributing to a comprehensive assessment of operator comfort and safety. The infrastructure of the National Institute of Research–Development for Machines and Installations Designed for Agriculture and the Food Industry (INMA), Bucharest, facilitated the execution of the experiments by providing access to multiple surface conditions.
The decision to conduct the vibration experiments on a grass-covered track was grounded in both methodological and practical considerations, reflecting the surface conditions that most frequently occur in protected agricultural settings, such as greenhouses and small-scale farms. Short vegetation layers, particularly grass, provide a realistic representation of operational environments for self-propelled tractor-type vehicles employed in sensitive horticultural applications. Previous studies indicate that grass-covered soil inherently exhibits attenuating properties, as the vegetation layer functions as a natural damping interface, thereby lowering the transmission of vibration energy.
Unlike rigid pavements, including asphalt or gravel-based surfaces, grass-covered terrain absorbs a significant fraction of the mechanical energy induced by vehicular motion. This reduces the vibrational load transmitted to both the machine structure and the human operator. In the current study, a grass-covered dirt track exhibiting irregularities was selected (
Figure 2), with an average surface roughness in the range of 0.2–0.6 mm, quantified through the sand patch (HS) method.
Such values confirm that the selected test site provided an adequate compromise between experimental repeatability and realistic field conditions.
Figure 2a illustrates the location of the experimental test area (marked as “1”), representing the uneven grass-covered dirt terrain within the INMA testing field, where vibration measurements were carried out. The test area has a total length of 100 m and a width of 40 m, ensuring sufficient distance for stable and repeatable vibration data acquisition.
The experimental campaign was conducted in June under controlled environmental parameters: ambient temperature of 26.5 °C, relative humidity of 40%, wind speed of 0.2 m/s, and atmospheric pressure of 756 mmHg. The experimental trials were performed using a prototype of a self-propelled tractor-type agricultural vehicle, specifically the TE-0 electric tractor (National Institute of Research—Development for Machines and Installations Designed for Agriculture and Food Indus-try (INMA), Bucharest, Romania), operated at a preset travel speed of 5 km/h. The selected operating speed of 5 km/h for the agricultural tractor-type vehicle represents a typical working speed for greenhouse operations and was established in accordance with the ISO 14397-1 standard, which defines a typical speed range of 4–6 km/h for tractors used in greenhouses and protected horticultural environments.
Table 2 summarizes the technical specifications of the electric tractor employed in this study.
The equipment used for data acquisition during the experimental tests on seat vibrations of the tractor-type vehicle, mounted on the TE-0 electric tractor, was carried out using the Vibration Analysis Toolkit (VATS), developed by NexGen Ergonomics [
32]. The system is configured with an MWX8 DataLOG device, a fully portable data acquisition unit that is part of the Biometrics Data Acquisition and Monitoring System [
33], synchronized in real time for six analog channels, as illustrated in
Figure 3b.
This advanced vibration monitoring and analysis system enables the real-time collection and processing of data, providing high accuracy in evaluating the impact of vibrations transmitted through the seat to the operator. The system is well-known and widely used in various research fields, including biomechanics [
34], the investigation of pathological musculoskeletal conditions [
35], rehabilitation science, clinical medicine, robotics, and the quantitative monitoring of daily functional activities [
36].
Additionally, the Vibration Analysis Toolkit (VATS) software version 3.4.4 is used for whole-body vibration (WBV) analysis and is equipped with the MWX8 DataLOG acquisition unit, which collects data from the triaxial accelerometer sensors [
37,
38].
The main technical parameters of the equipment presented in this figure are detailed according to
Figure 3a–c:
(a) General overview of the complete experimental setup, illustrating all equipment used in the vibration analysis, including the DataLog acquisition units and the triaxial accelerometer sensors mounted on the operator’s seat;
(b) The DataLog MWX8 data acquisition unit, allowing experimental data collection with sampling frequencies up to 20,000 Hz, equipped with an automatic digital filter (−3 dB at 0.45 × the sampling rate), 8–24 independently programmable channels, real-time display and analysis, Bluetooth wireless connection, automatic data backup via Micro SD card, and a full-color LCD graphical interface;
(c) The S2A-16G-MF triaxial accelerometer, a high-precision 3-axis sensor (X, Y, Z) with factory-set offset and sensitivity, accuracy ±0.5%, adjustable frequency response (DC to 1 KHz (+0 dB/−3 dB)), three full-scale measurement ranges (±16 G, ±4.8 G, ±1.6 G), an 8th-order anti-aliasing filter per channel, low-impedance outputs, mass 15 g, and electronic calibration adjustments ensuring long-term stability under vibration conditions.
The seat model integrated into the self-propelled tractor-type agricultural vehicle is the Grammer Cabin Seat, manufactured by Grammer GmbH (Ursensollen, Germany), and was used in the modal analysis.
The vibration measurement system consisted of two triaxial precision accelerometers (Series S2A-16G-MF, Biometrics Ltd., Gwent, UK), featuring a 10 g full-scale range, factory-defined offset and sensitivity, signal thermal isolation, and adjustable filters for each axis. One sensor was mounted on the seat backrest (
Figure 3c), while the second was integrated into a rubber pad placed on the seat cushion surface in direct contact with the operator (
Figure 3b). The sensors were connected to a Biometrics Ltd. Data Acquisition System, which includes three portable DataLog MWX8 units capable of recording up to 24 synchronized analog and digital channels. The MWX8 module, illustrated in
Figure 3b, is lightweight (129 g) and designed for field applications, ensuring accurate, real-time data acquisition without interfering with operator comfort. Each input channel was individually configured for analog signal conversion, and the internal real-time clock enabled automatic timestamping of all recordings.
This system architecture allowed the collection of high-resolution vibration data suitable for both laboratory and outdoor environments.
The virtual model of the seat was downloaded from the online GrabCAD library [
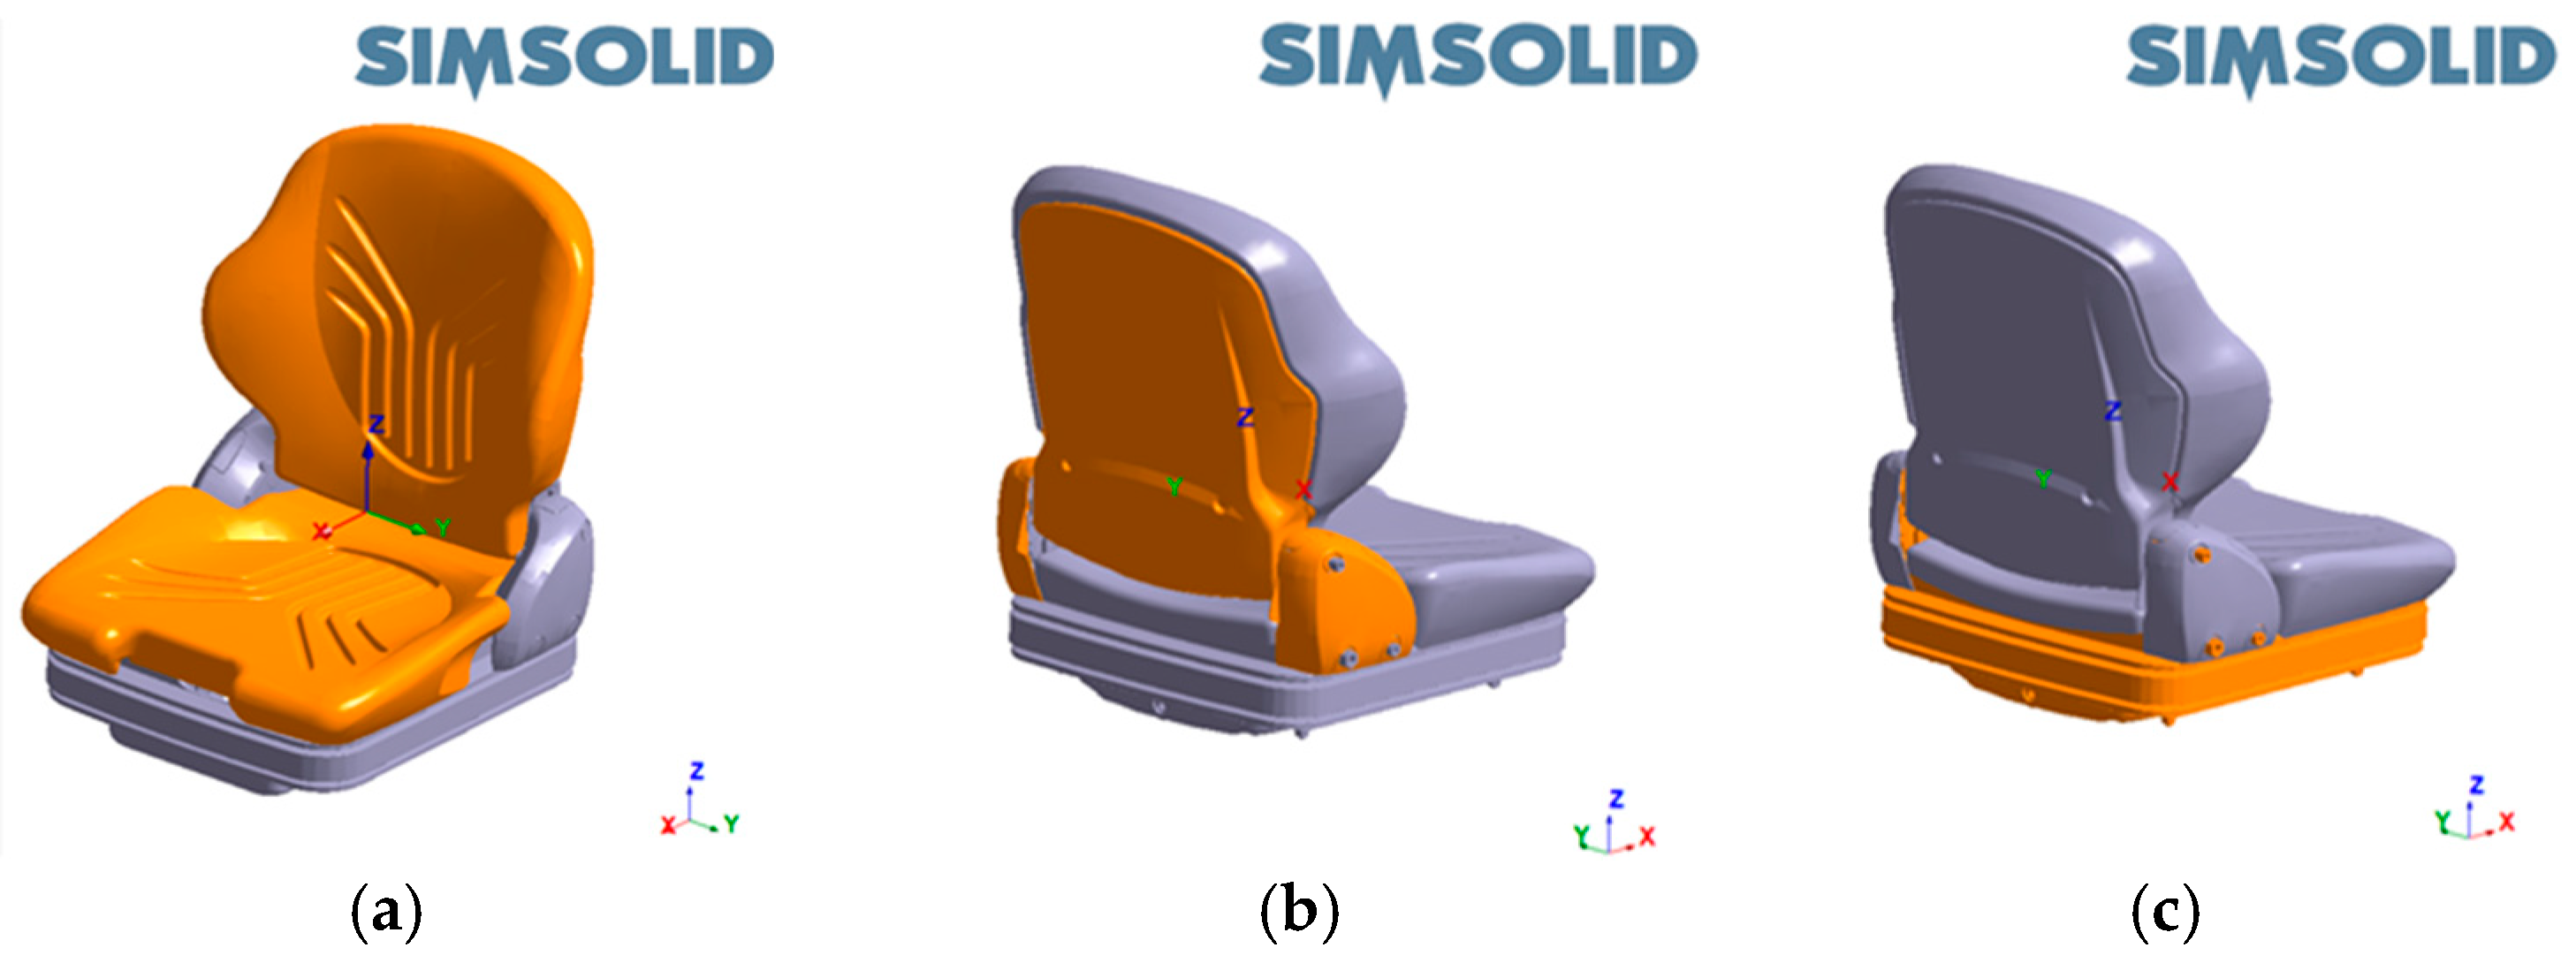
39]. The seat is a robust assembly consisting of a steel base for structural stability, foam rubber damping cushions for vibration absorption, and plastic components designed to optimize both ergonomic comfort and functional performance. The constituent components are depicted in
Figure 4.
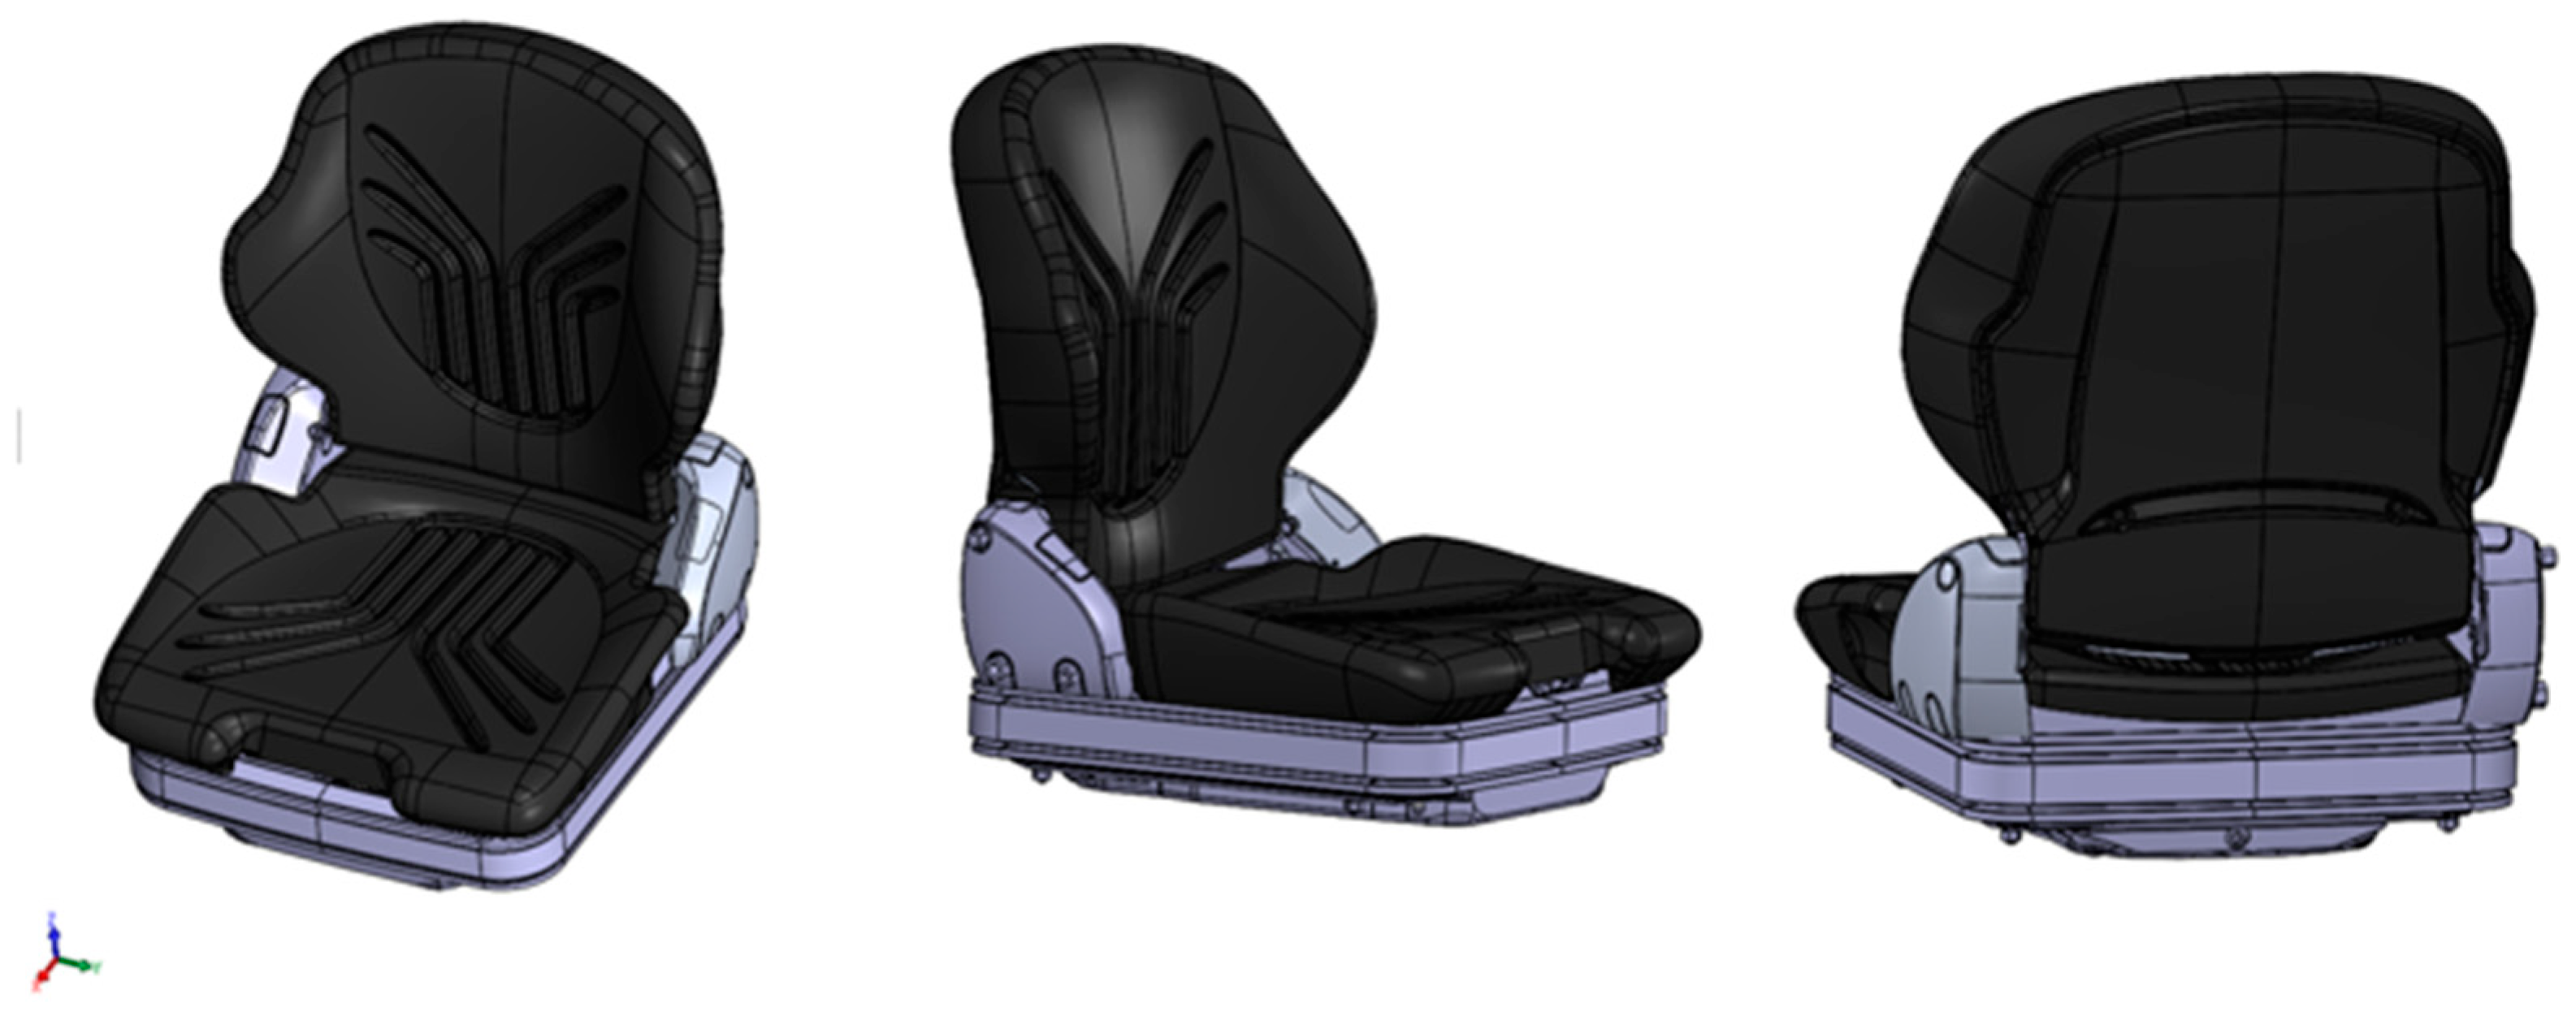
Figure 5 presents different views of the 3D seat model, including an isometric view, a side view, and a rear view. These multiple perspectives provide a clear and detailed visualization of the seat’s geometry and structure, highlighting its essential design elements that are critical for evaluating its dynamic behavior and the way it contributes to the transmission of vibrations to the operator.
The experimental setup incorporated a mechanically actuated suspension system, configured at two discrete height levels: S1, representing the minimum suspension setting (10 cm), and S2, corresponding to the maximum suspension setting (20 cm), as illustrated in
Figure 6a.
The stiffness of the seat suspension was characterized experimentally for these two cases, hereafter referred to as the “rigid suspension” and the “compliant suspension.” The seat backrest was maintained at a fixed inclination of 90°. For vibration acquisition, two triaxial accelerometers were strategically positioned—one at the seating surface and the other on the backrest (
Figure 6b). Throughout the tests, the operator preserved continuous contact with both instrumented locations (seat pan and backrest), as depicted in
Figure 6c, in accordance with ISO 2631-1 specifications. This protocol ensured an accurate and comprehensive assessment of the vibrational loads transmitted to the human body through the seating system.
To ensure the accuracy and repeatability of the experimental data, each vibration measurement was performed in three successive replicates under identical test conditions. All trials were conducted at a constant travel speed of 5 km/h along the same grass-covered dirt track. This approach minimized the influence of terrain variability and operator movement, allowing the computation of average acceleration values representative of real operating conditions. The three replicate datasets were processed and averaged using the Biometrics analysis software prior to frequency-domain transformation in VATS.
To quantify the experimental uncertainty, each vibration measurement was repeated three times under identical operating conditions. The resulting datasets were averaged, and the variability was expressed as standard deviation (SD), calculated for each measurement point. This approach, consistent with ISO 2631-1 recommendations, reflects the dispersion of the acceleration amplitudes around the mean value and ensures the repeatability of the experimental data. All mean values presented in the tables are expressed as mean ± SD.
2.2. Analytical Determination of the Seat Suspension Natural Frequency
The natural frequency of the seat suspension was derived through the conventional analytical expression of a single-degree-of-freedom mass–spring system. This relation provides the fundamental natural frequency of the suspension, a critical parameter for characterizing its dynamic response.
Accurate determination of this value is essential for assessing the system’s vibrational behavior and for avoiding resonance conditions that may otherwise intensify the transmission of oscillatory energy to the operator.
To perform this calculation, it was necessary to determine two unknown parameters: the seat suspension stiffness and the total mass of the seat.
The seat suspension stiffness was experimentally determined for two distinct configurations: “stiff suspension” and “soft suspension”. These measurements enabled the evaluation of the seat’s dynamic behavior under different damping conditions, providing essential data for the study of vibrations and operator comfort.
Table 3 summarizes all the relevant values required for the suspension stiffness analysis, including the parameters related to the applied forces, displacements, and stiffness coefficients for both suspension configurations.
- -
‘A’ indicates the vertical clearance between the floor and the seat base when the suspension is adjusted to the ‘rigid’ configuration with the operator seated.
- -
‘B’ indicates the vertical clearance between the floor and the seat base when the suspension is set to the ‘soft’ configuration with the operator seated.
- -
‘C’ denotes the vertical distance from the floor to the seat base when the seat is unoccupied.
- -
C − A (mm) represents the height difference between the unloaded condition (C) and the loaded condition of the seat when using the rigid suspension configuration (A).
- -
C − B (mm) represents the height difference between the unloaded condition (C) and the loaded condition of the seat when using the soft suspension configuration (B).
For each of the parameter’s A, B, and C, five measurements were performed. The values recorded in
Table 3 represent the arithmetic mean of these five measurements.
Under the rigid suspension arrangement, oscillatory energy is transmitted with reduced attenuation to both the vehicle frame and the operator. While this setup enhances stability when operating on irregular terrain, it does so at the expense of reduced ride comfort. Conversely, the compliant suspension is capable of dissipating a greater fraction of the input vibrations, thereby mitigating operator discomfort, though it may lead to diminished stability in certain operational scenarios. Evaluating the system’s linear vibrational response allows for a systematic assessment of how each suspension setting governs the propagation of dynamic loads through the vehicle structure and ultimately to the operator.
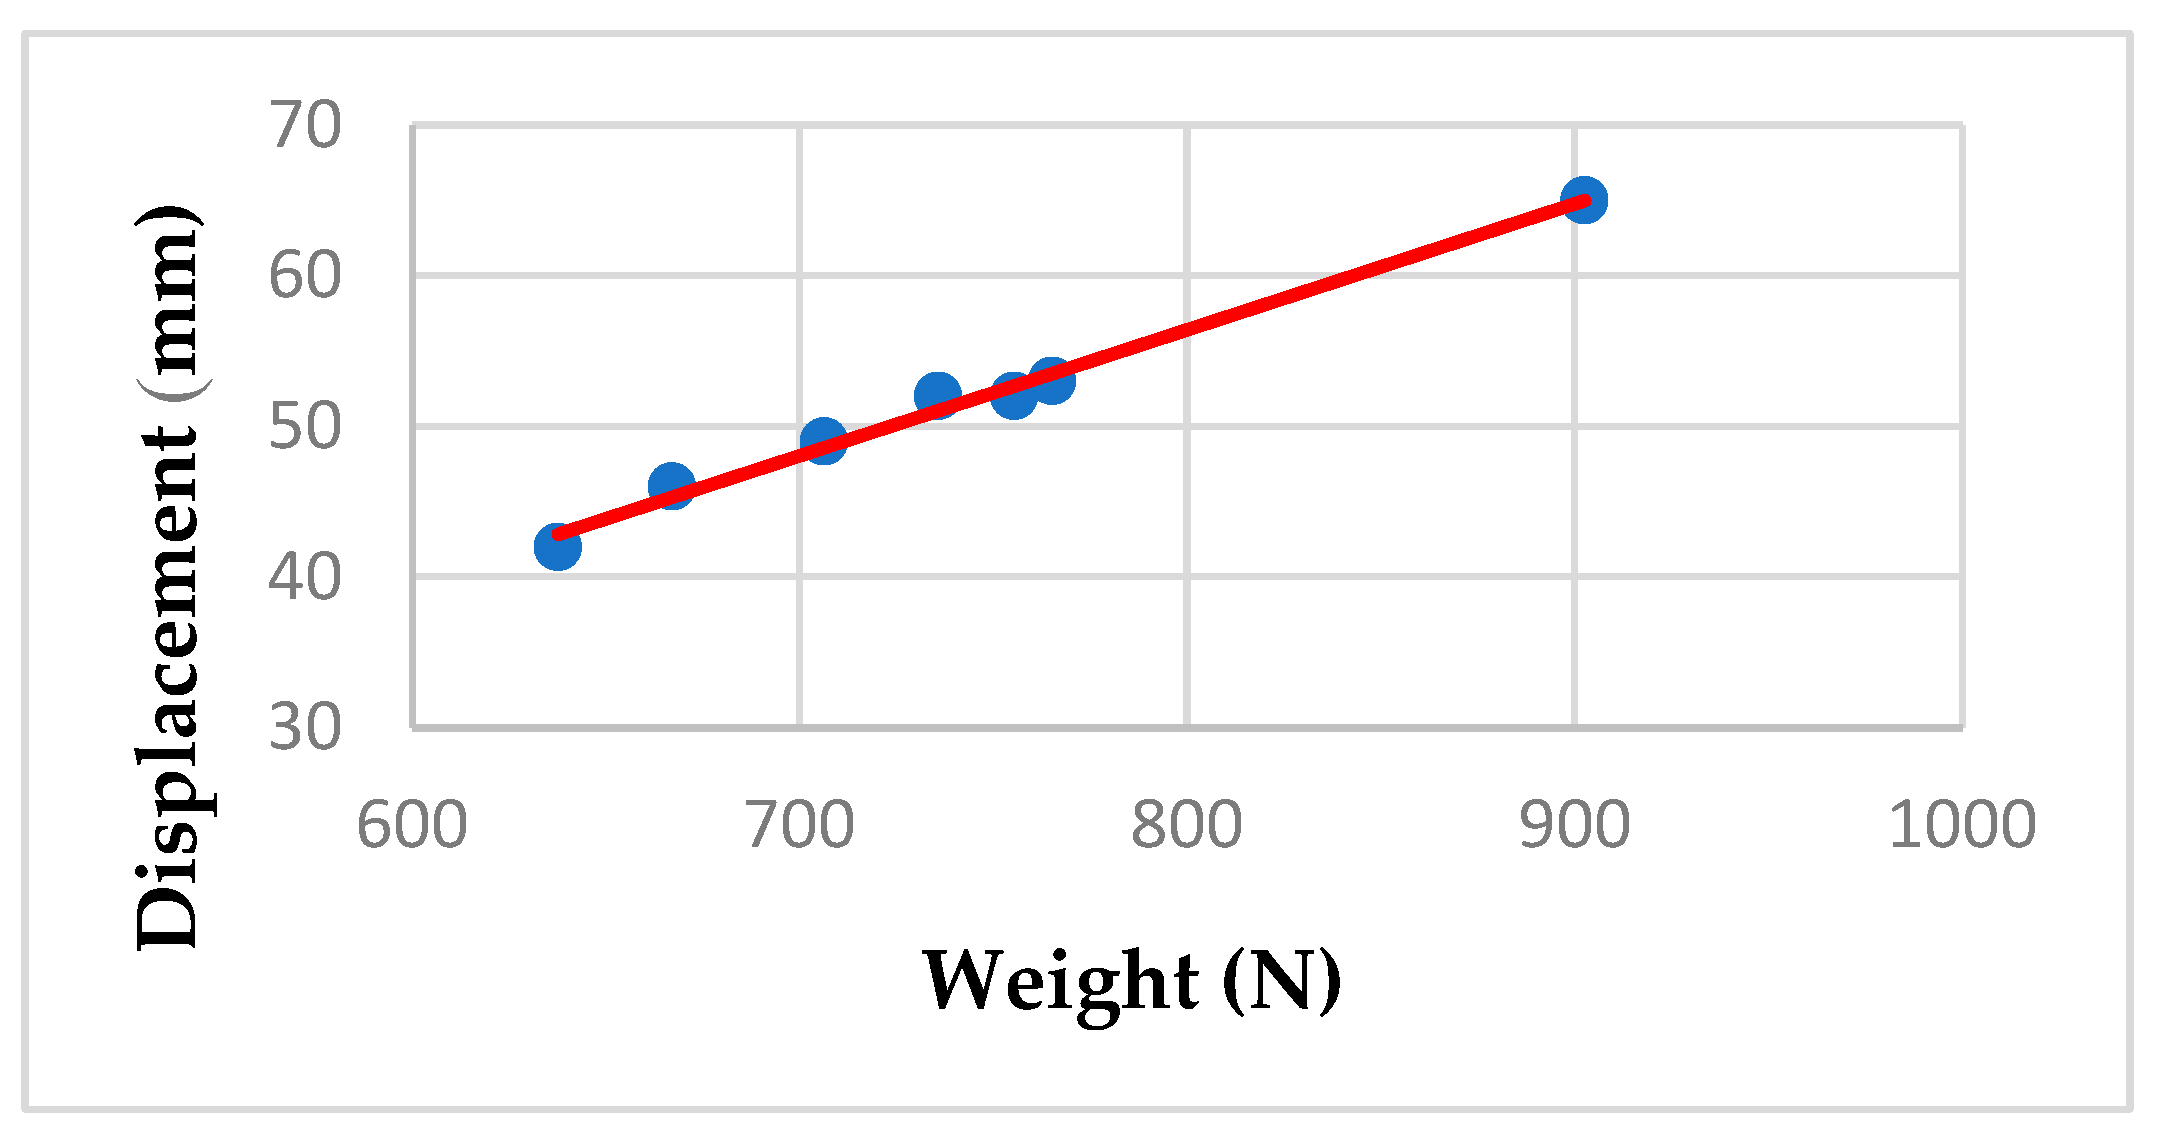
Figure 7 and
Figure 8 illustrate the linear interpolation analyses performed for the seat suspension system, corresponding to the ‘stiff’ configuration and the ‘soft’ configuration, respectively.
Analysis of the data presented in
Table 3 indicates that the suspension demonstrates a linear response, and the governing equation was derived from relation (3) with a coefficient of determination (R
2) of 99%:
where A = −1.96637, B = 0.06855, X = operator’s weight, expressed in N;
The average weight of the operators (Md) combined with the seat mass (Ms) determines the total dynamic load applied to the seat structure, as described in relation (4):
The average weight of the operators (Md), as described in relation (5), was determined based on the mean anthropometric characteristics of the subjects included in the experimental tests.
Accordingly, the elastic stiffness of the seat suspension is determined as described in relation (6):
Thus, the suspension exhibits a maximum stiffness value of: 15.00 N/mm.
For the ‘soft’ suspension configuration, the governing equation was derived from relation (7), yielding a coefficient of determination (R
2) of 99%.
where A = 87.04607, B = 0.02507 and X = operator’s weight, expressed in N;
The minimum value of the suspension stiffness coefficient was obtained as described in relation (8):
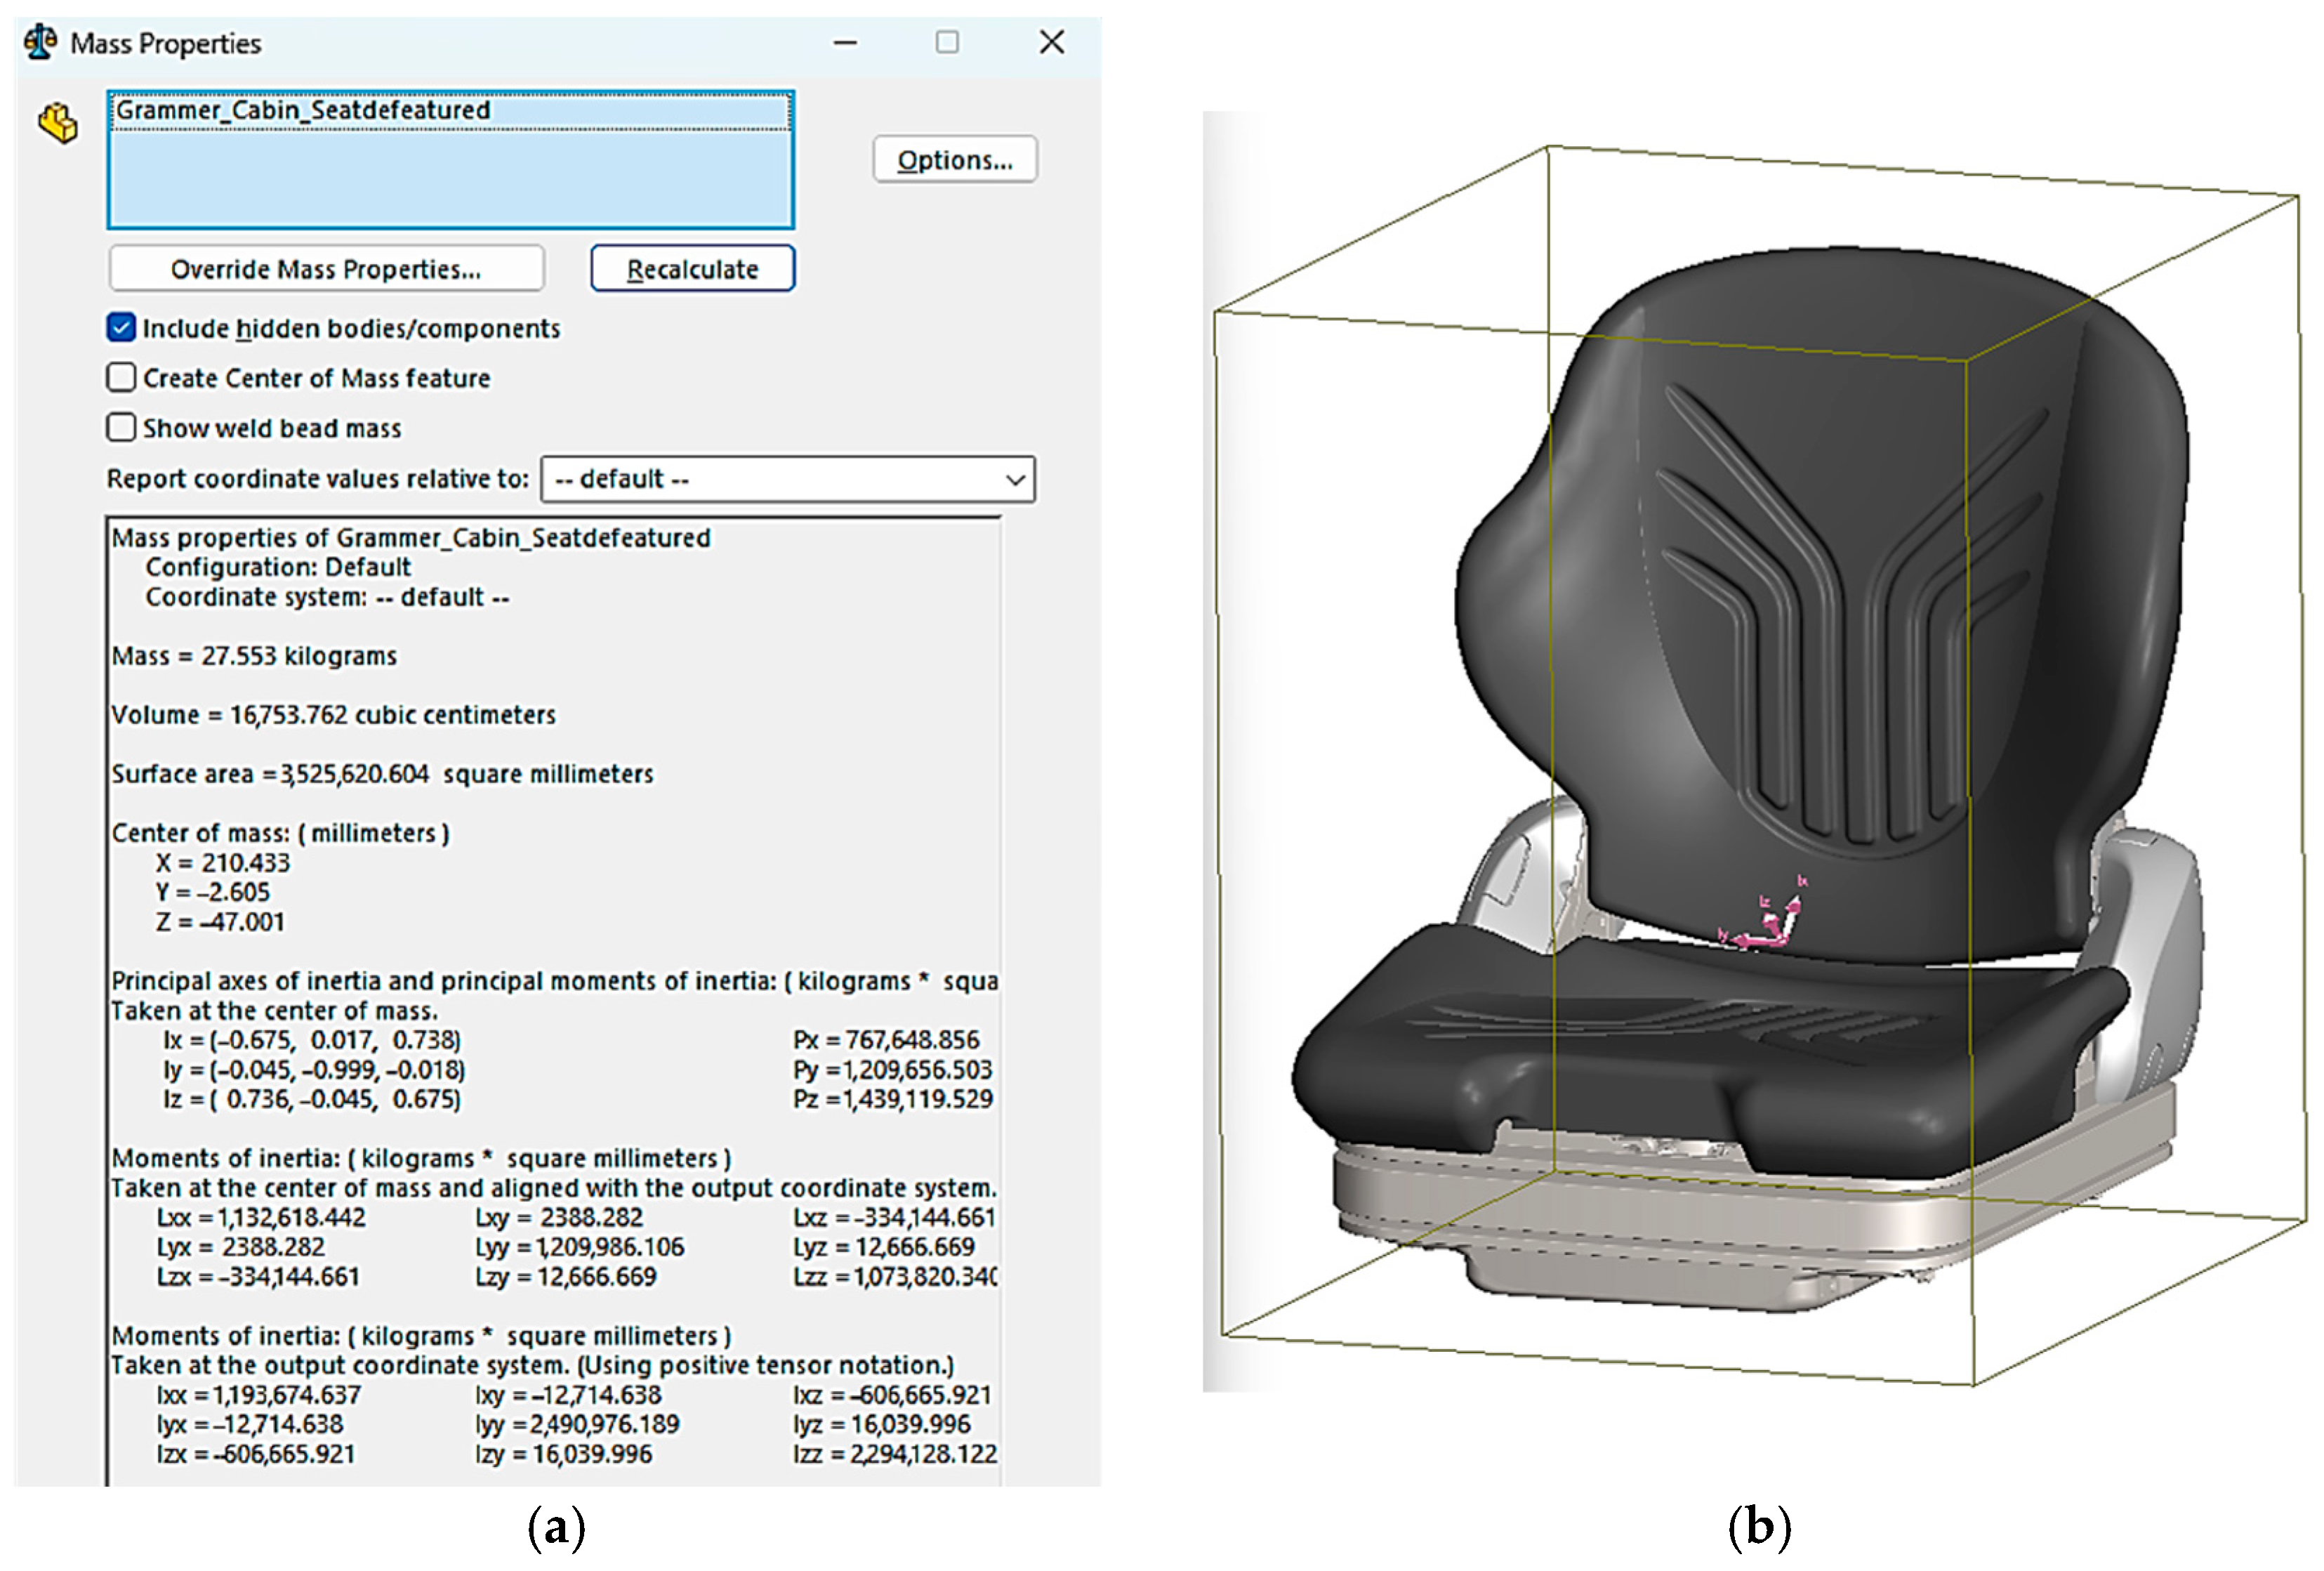
The total mass of the seat was calculated by accurately assigning materials to each component of the 3D model in SolidWorks CAD Software 2023. Based on the volume and density of the assigned materials, the total seat mass (Ms) was determined to be 27.553 kg.
As shown in
Figure 9, the seat mass properties comprise the volume, surface area, center of mass location, and inertia tensors with respect to the X, Y, and Z axes of the defined coordinate system.
The natural frequency of the seat suspension, as employed in the experimental tests, was analytically determined based on the schematic representation based on a simplified suspension system with a single degree of freedom, displayed in
Figure 10.
The natural frequency of the single-degree-of-freedom suspension system was analytically computed using the expression provided in relation (9):
where f—frequency of the damped harmonic oscillator, expressed in hertz (Hz);
k—stiffness constant of the system, expressed in N/m;
m—mass of the object, expressed in kg;
d—damping coefficient, expressed in Ns/m;
π—mathematical constant pi (≈3.14159);
k = 15 N/mm = 15.000 N/m;
d = 0.6 Ns/mm = 600 Ns/m;
m = 27.553 kg.
2.3. Modal Analysis
The model was exported from the SolidWorks modeling software into the Altair SimSolid simulation software [
41], where the following steps were carried out to perform the modal analysis.
2.3.1. Definition of Measurement Units
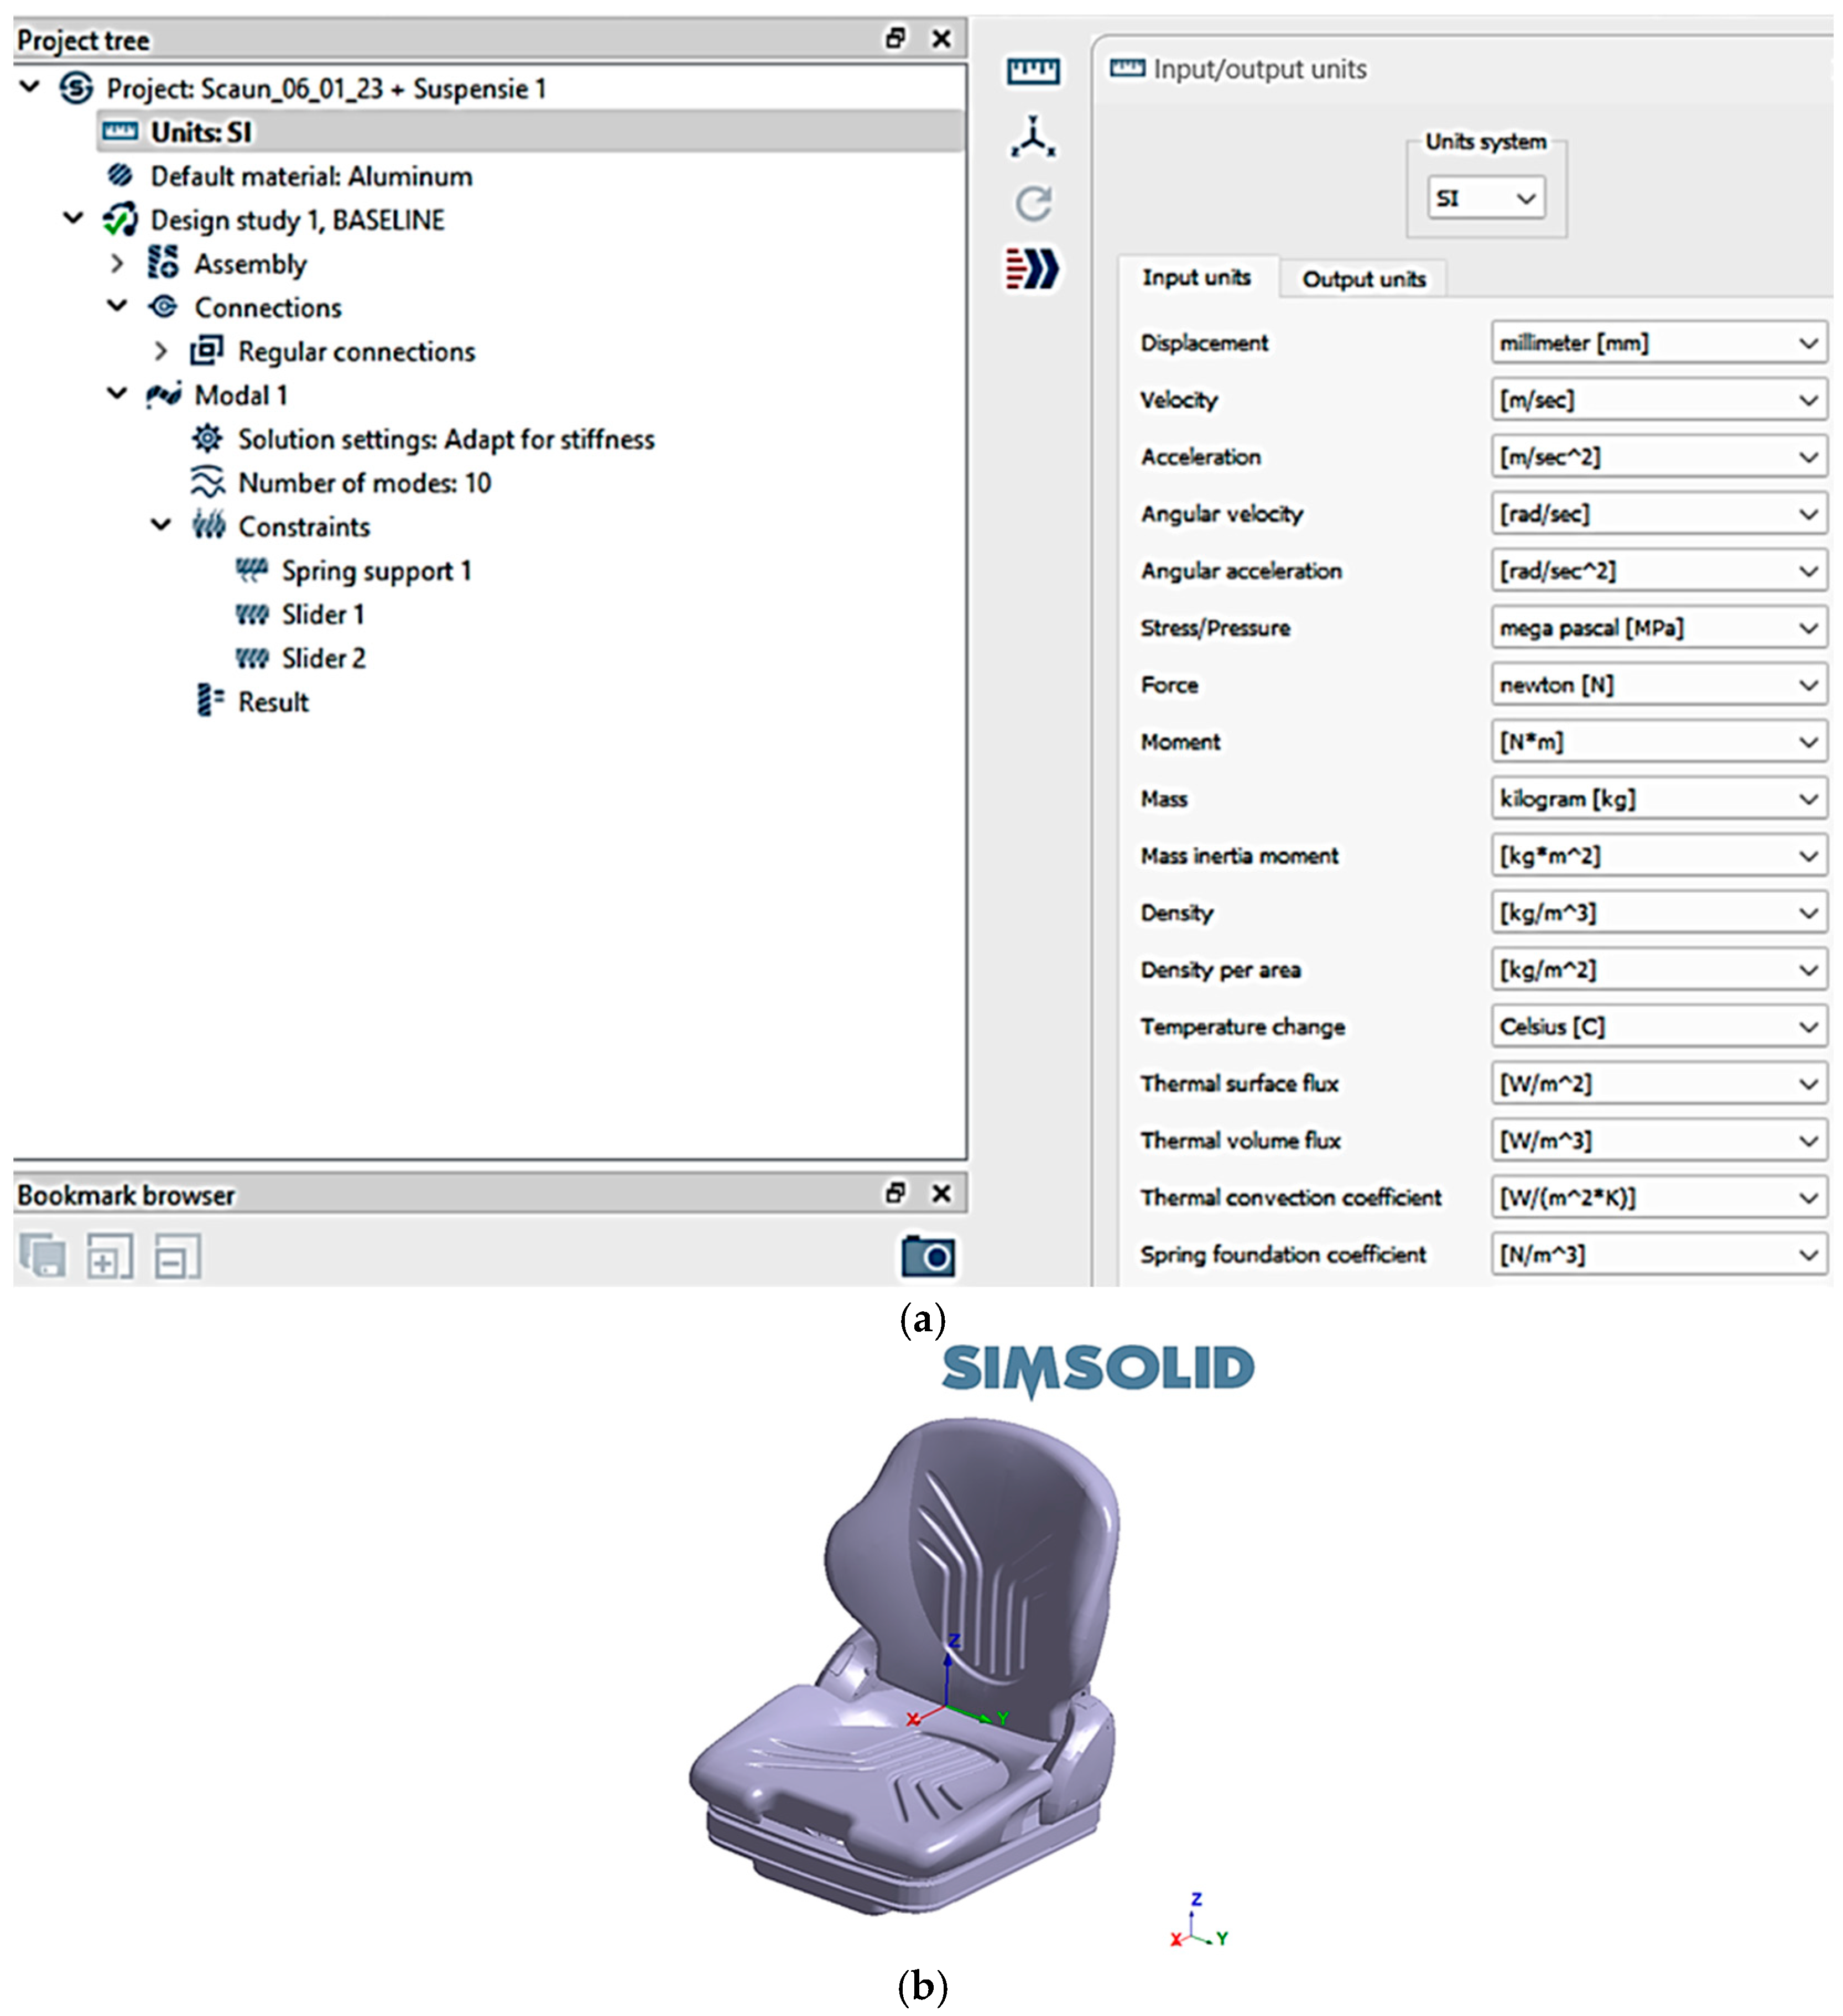
The International System of Units (SI) was adopted by default to guarantee consistency and precision in all numerical parameters employed during the analysis, as depicted in
Figure 11a. The global coordinate reference frame was defined at the geometric center of mass of the seat, with the longitudinal, transverse, and vertical orientations aligned along the X-, Y-, and Z-axes, respectively, as illustrated in
Figure 11b.
2.3.2. Adding Materials
During the analysis process, the selection of materials was performed using the material database available in the Altair SimSolid software 2024.
The main structural elements of the seat were defined as steel, while the cushions were modeled as rubber, and several additional components were defined as plastic.
Figure 12 presents the seat components grouped according to their material type.
2.3.3. Definition and Analysis of Connections
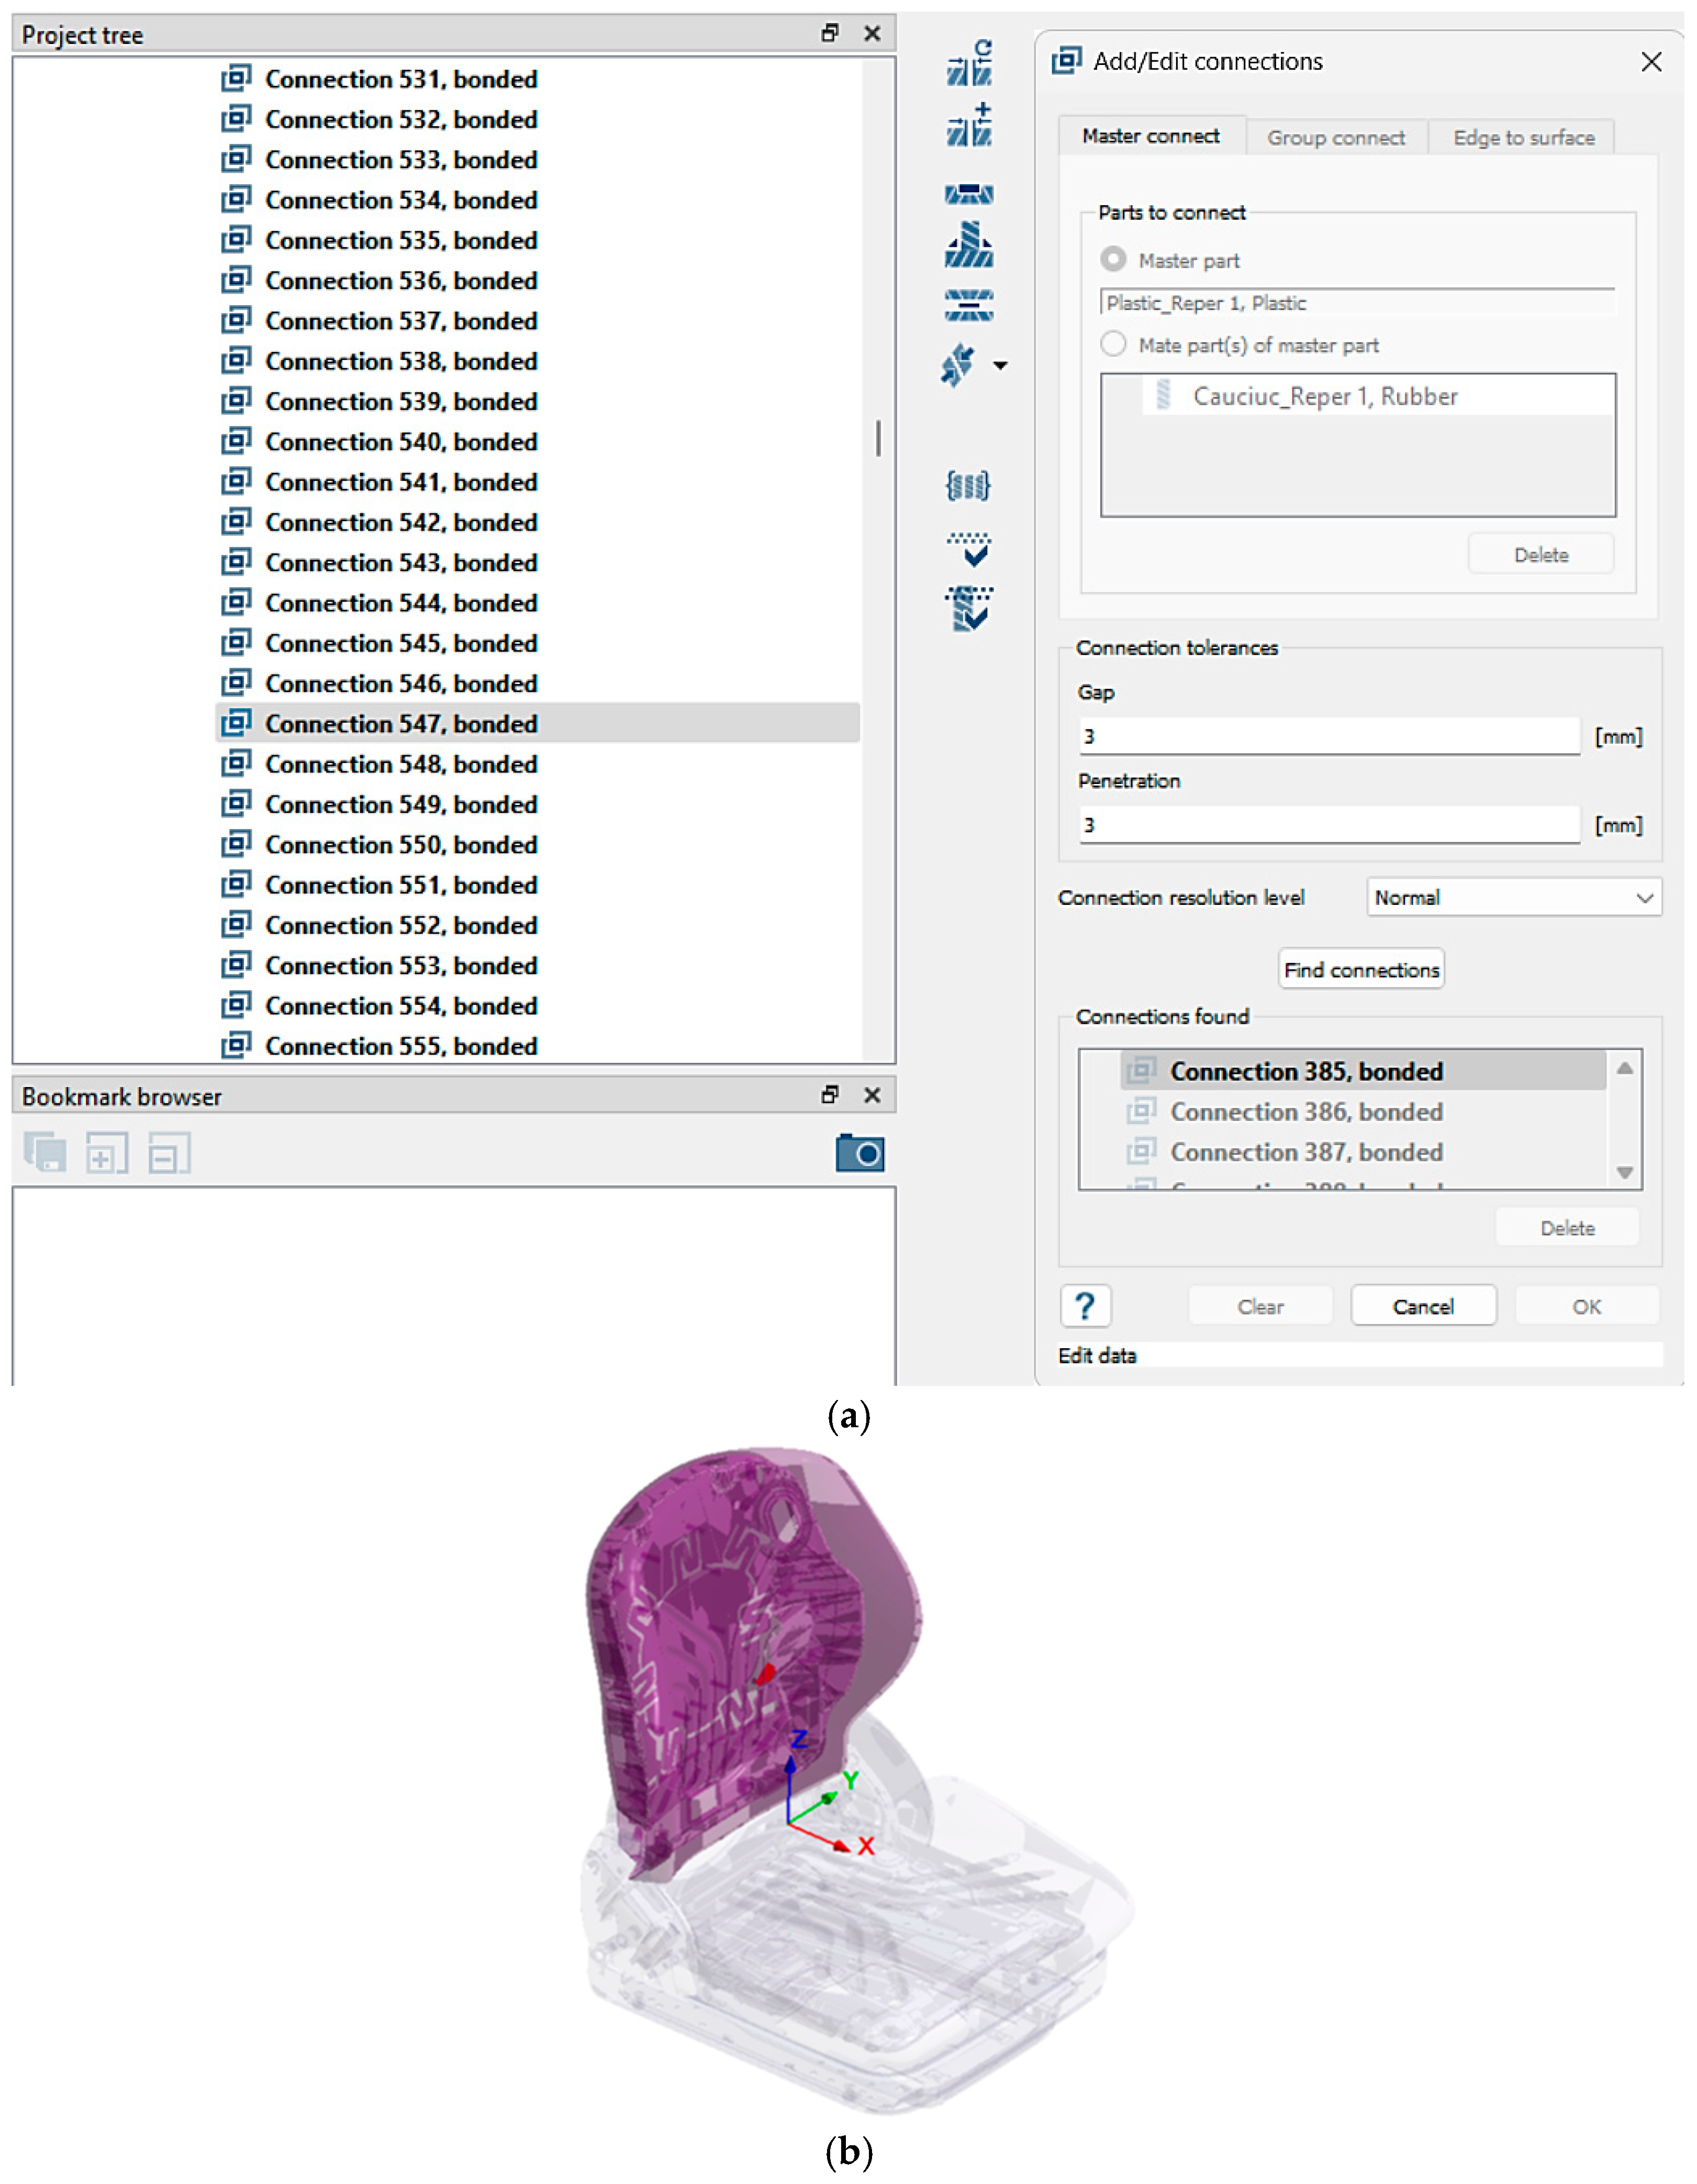
This process is essential and complex within the framework of the modal analysis. A total of 1482 connections were specified and validated in the seat analysis, thereby confirming the robustness of the model and the precision of the derived results.
Figure 13a presents the Altair SimSolid software 2024 highlights an example of a connection analysis between the cushion and the plastic cover of the seat, while
Figure 13b visually illustrates the virtual seat model with the selected connection between the plastic cover and the cushion (red point).
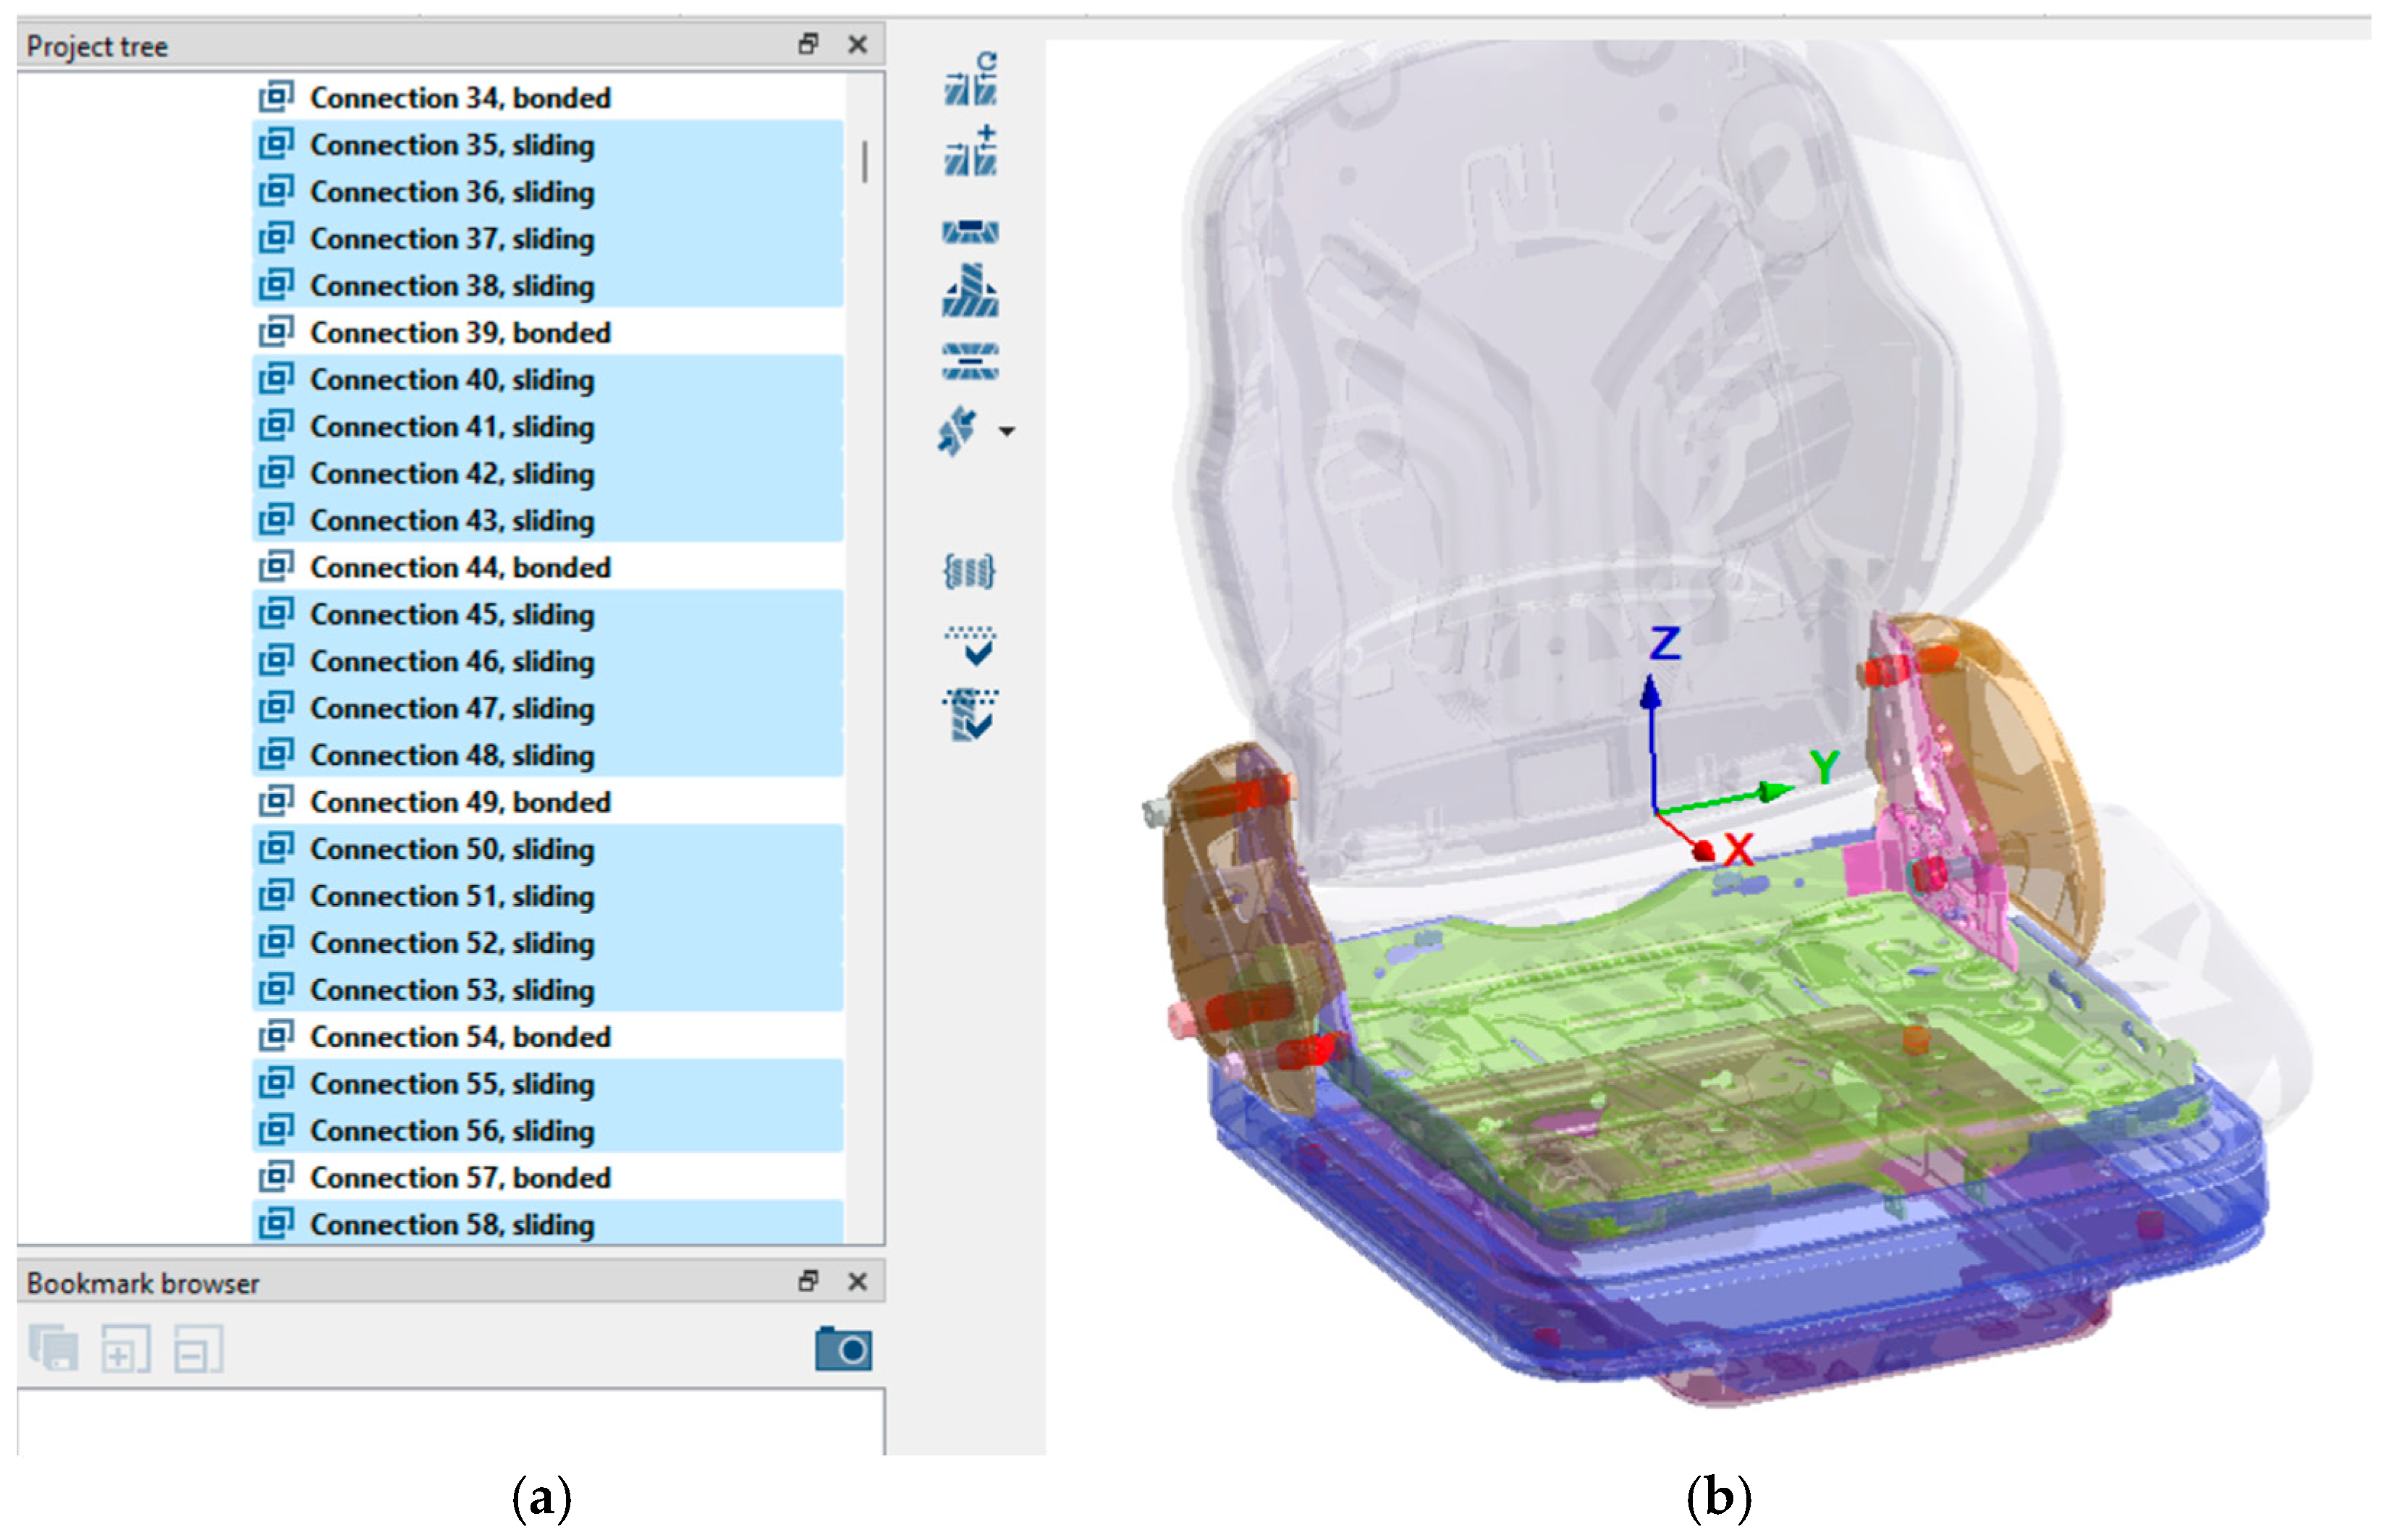
Figure 14a presents the comprehensive connection analysis performed in Altair SimSolid, whereas
Figure 14b displays the virtual seat model with the full set of connection points linking the constituent elements of the assembly. The assembly includes a total of 1491 connections, consisting of 9 bolt–nut connections, 224 sliding connections, and 1258 bonded connections. These connections are fundamental to the structural response of the seat when subjected to vibrational and mechanical excitations. They govern the pathways through which forces and oscillations are transmitted and dissipated across the components, thereby exerting a direct influence on the durability, stability, and ergonomic performance of the seating system.
2.3.4. Definition of Constraints
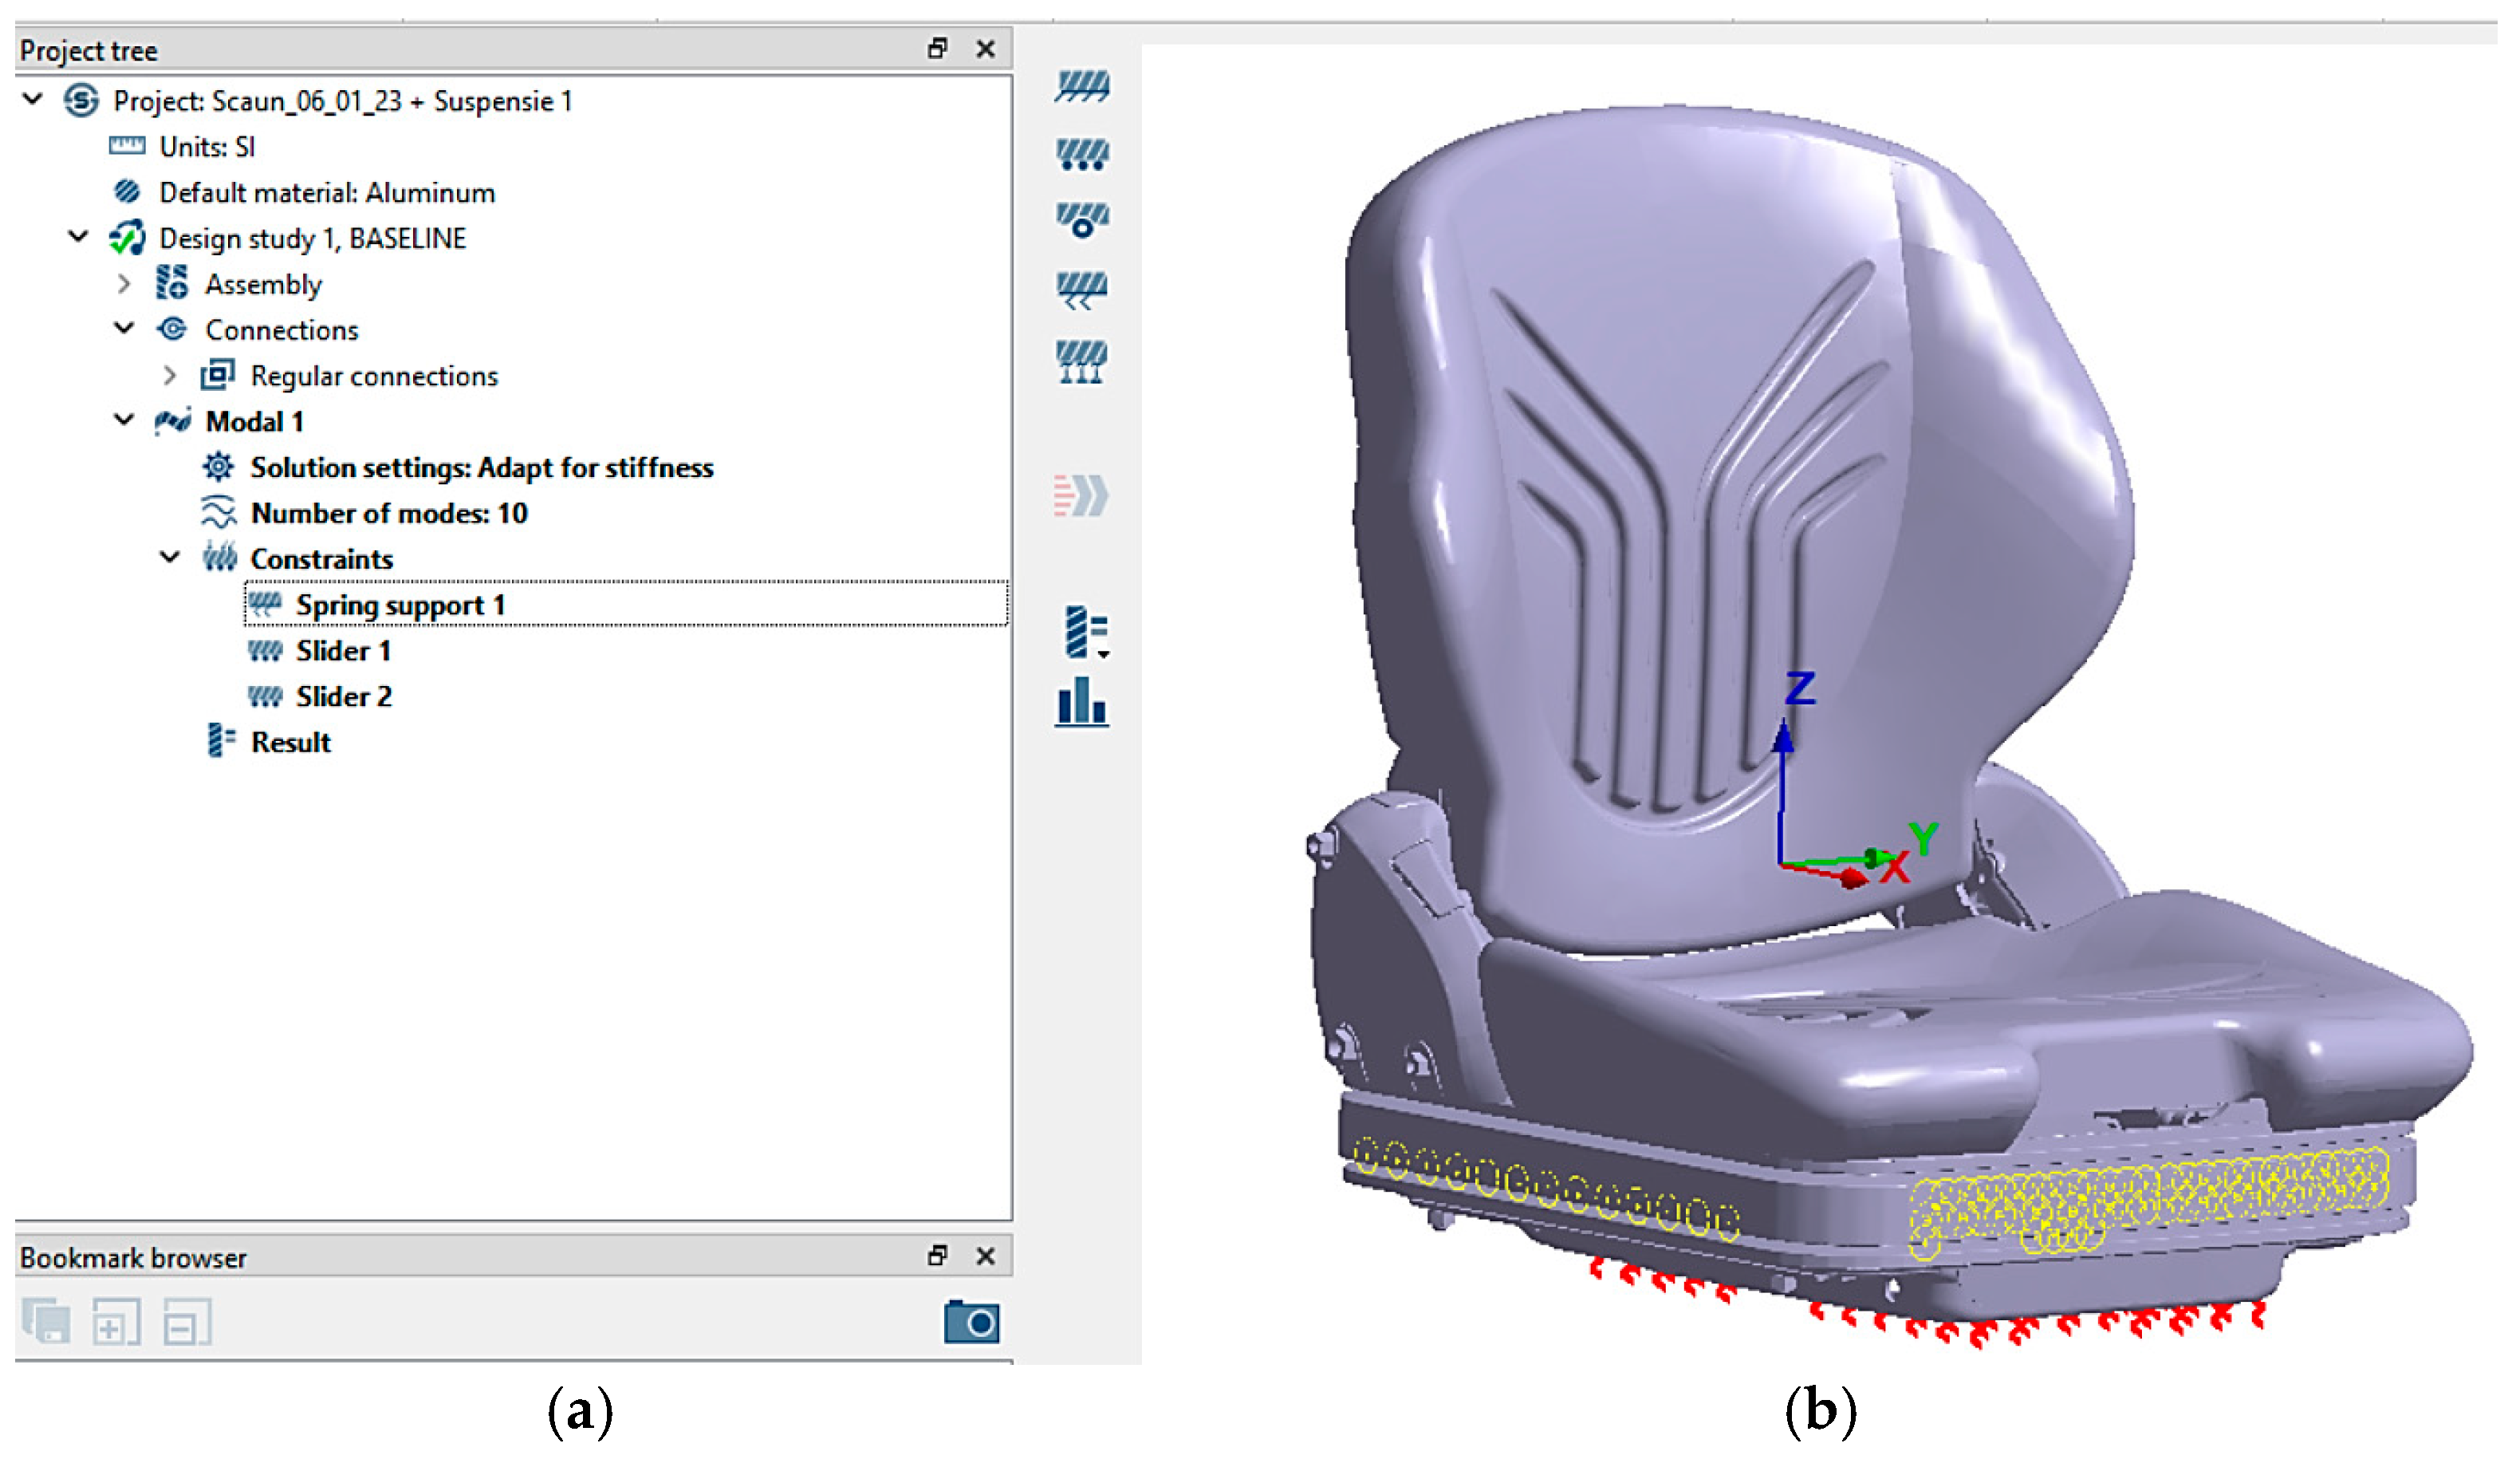
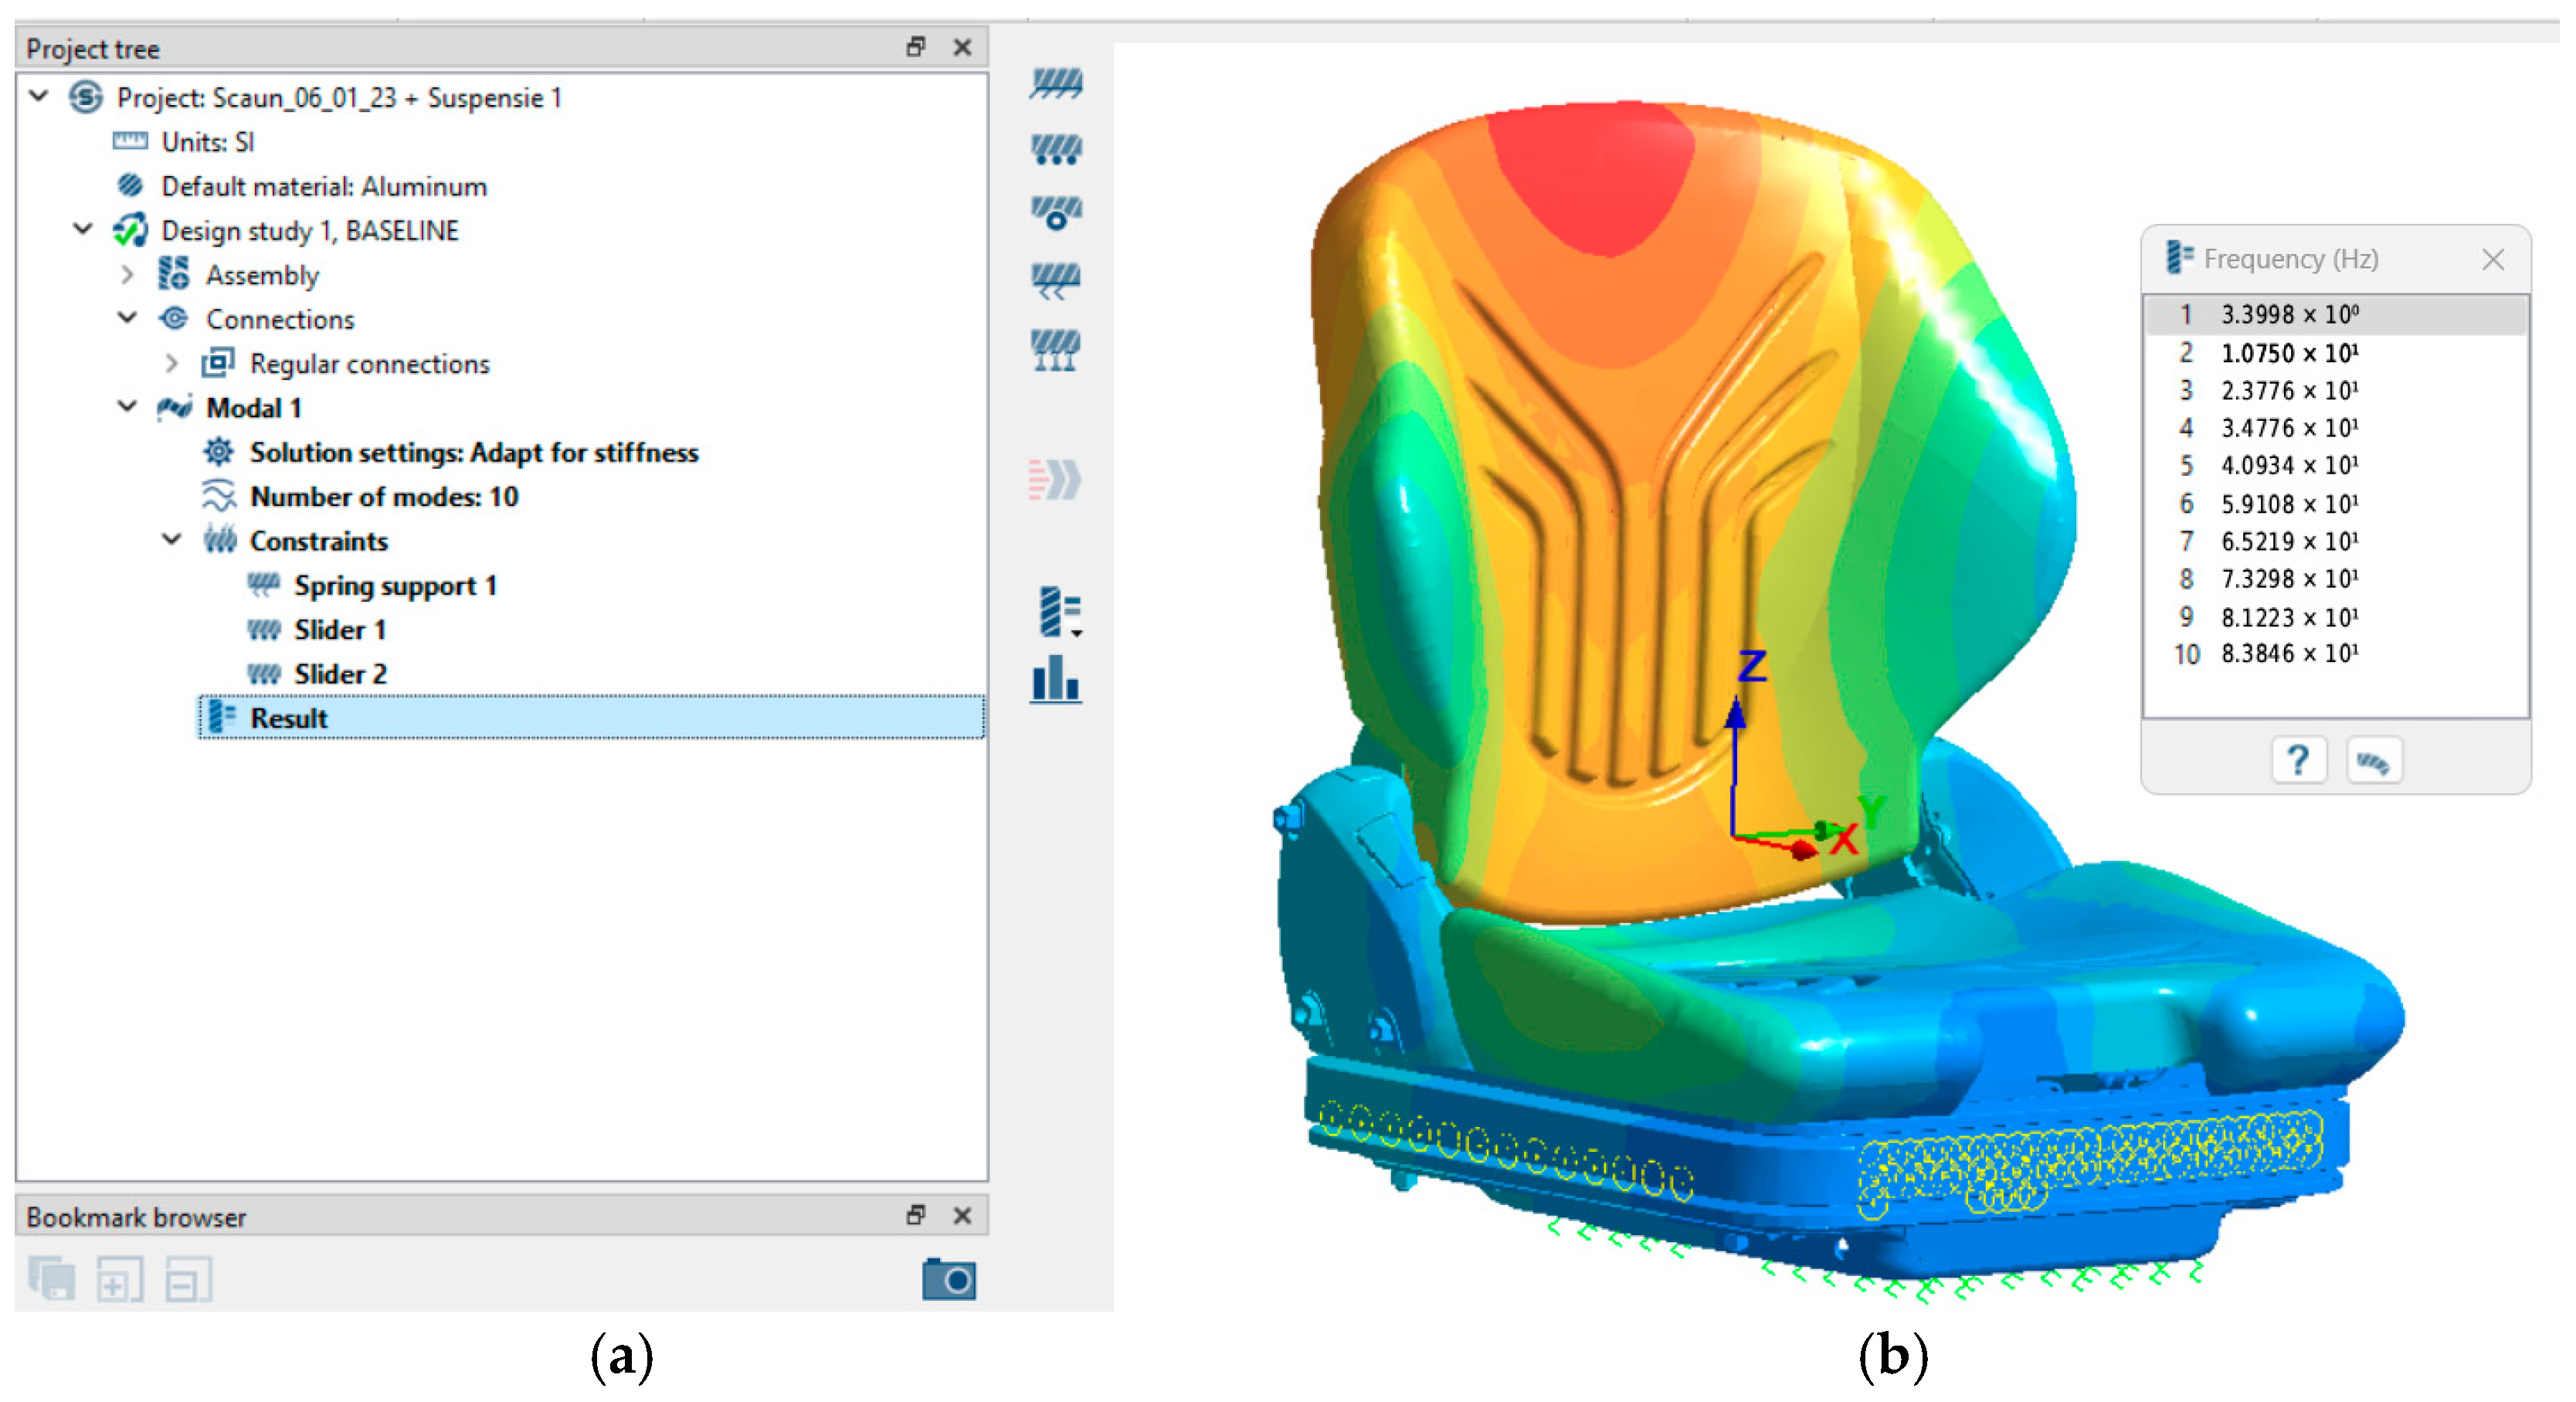
In
Figure 15a, the project tree view in Altair SimSolid illustrates the application of constraints in the “Spring Support 1” analysis, which is shown in
Figure 15b applied at the base of the seat along the Z-axis, with a value of 15 N/mm for the modal analysis of suspension 1 and 9.29 N/mm for the modal analysis of suspension 2.
The seat support was subjected to displacement constraints along the X and Y axes using two slider-type supports, highlighted in
Figure 15a. This configuration was implemented to ensure the stability of the seat and to enable a precise interpretation of the results obtained from the modal analysis.
2.3.5. Modal Analysis Results
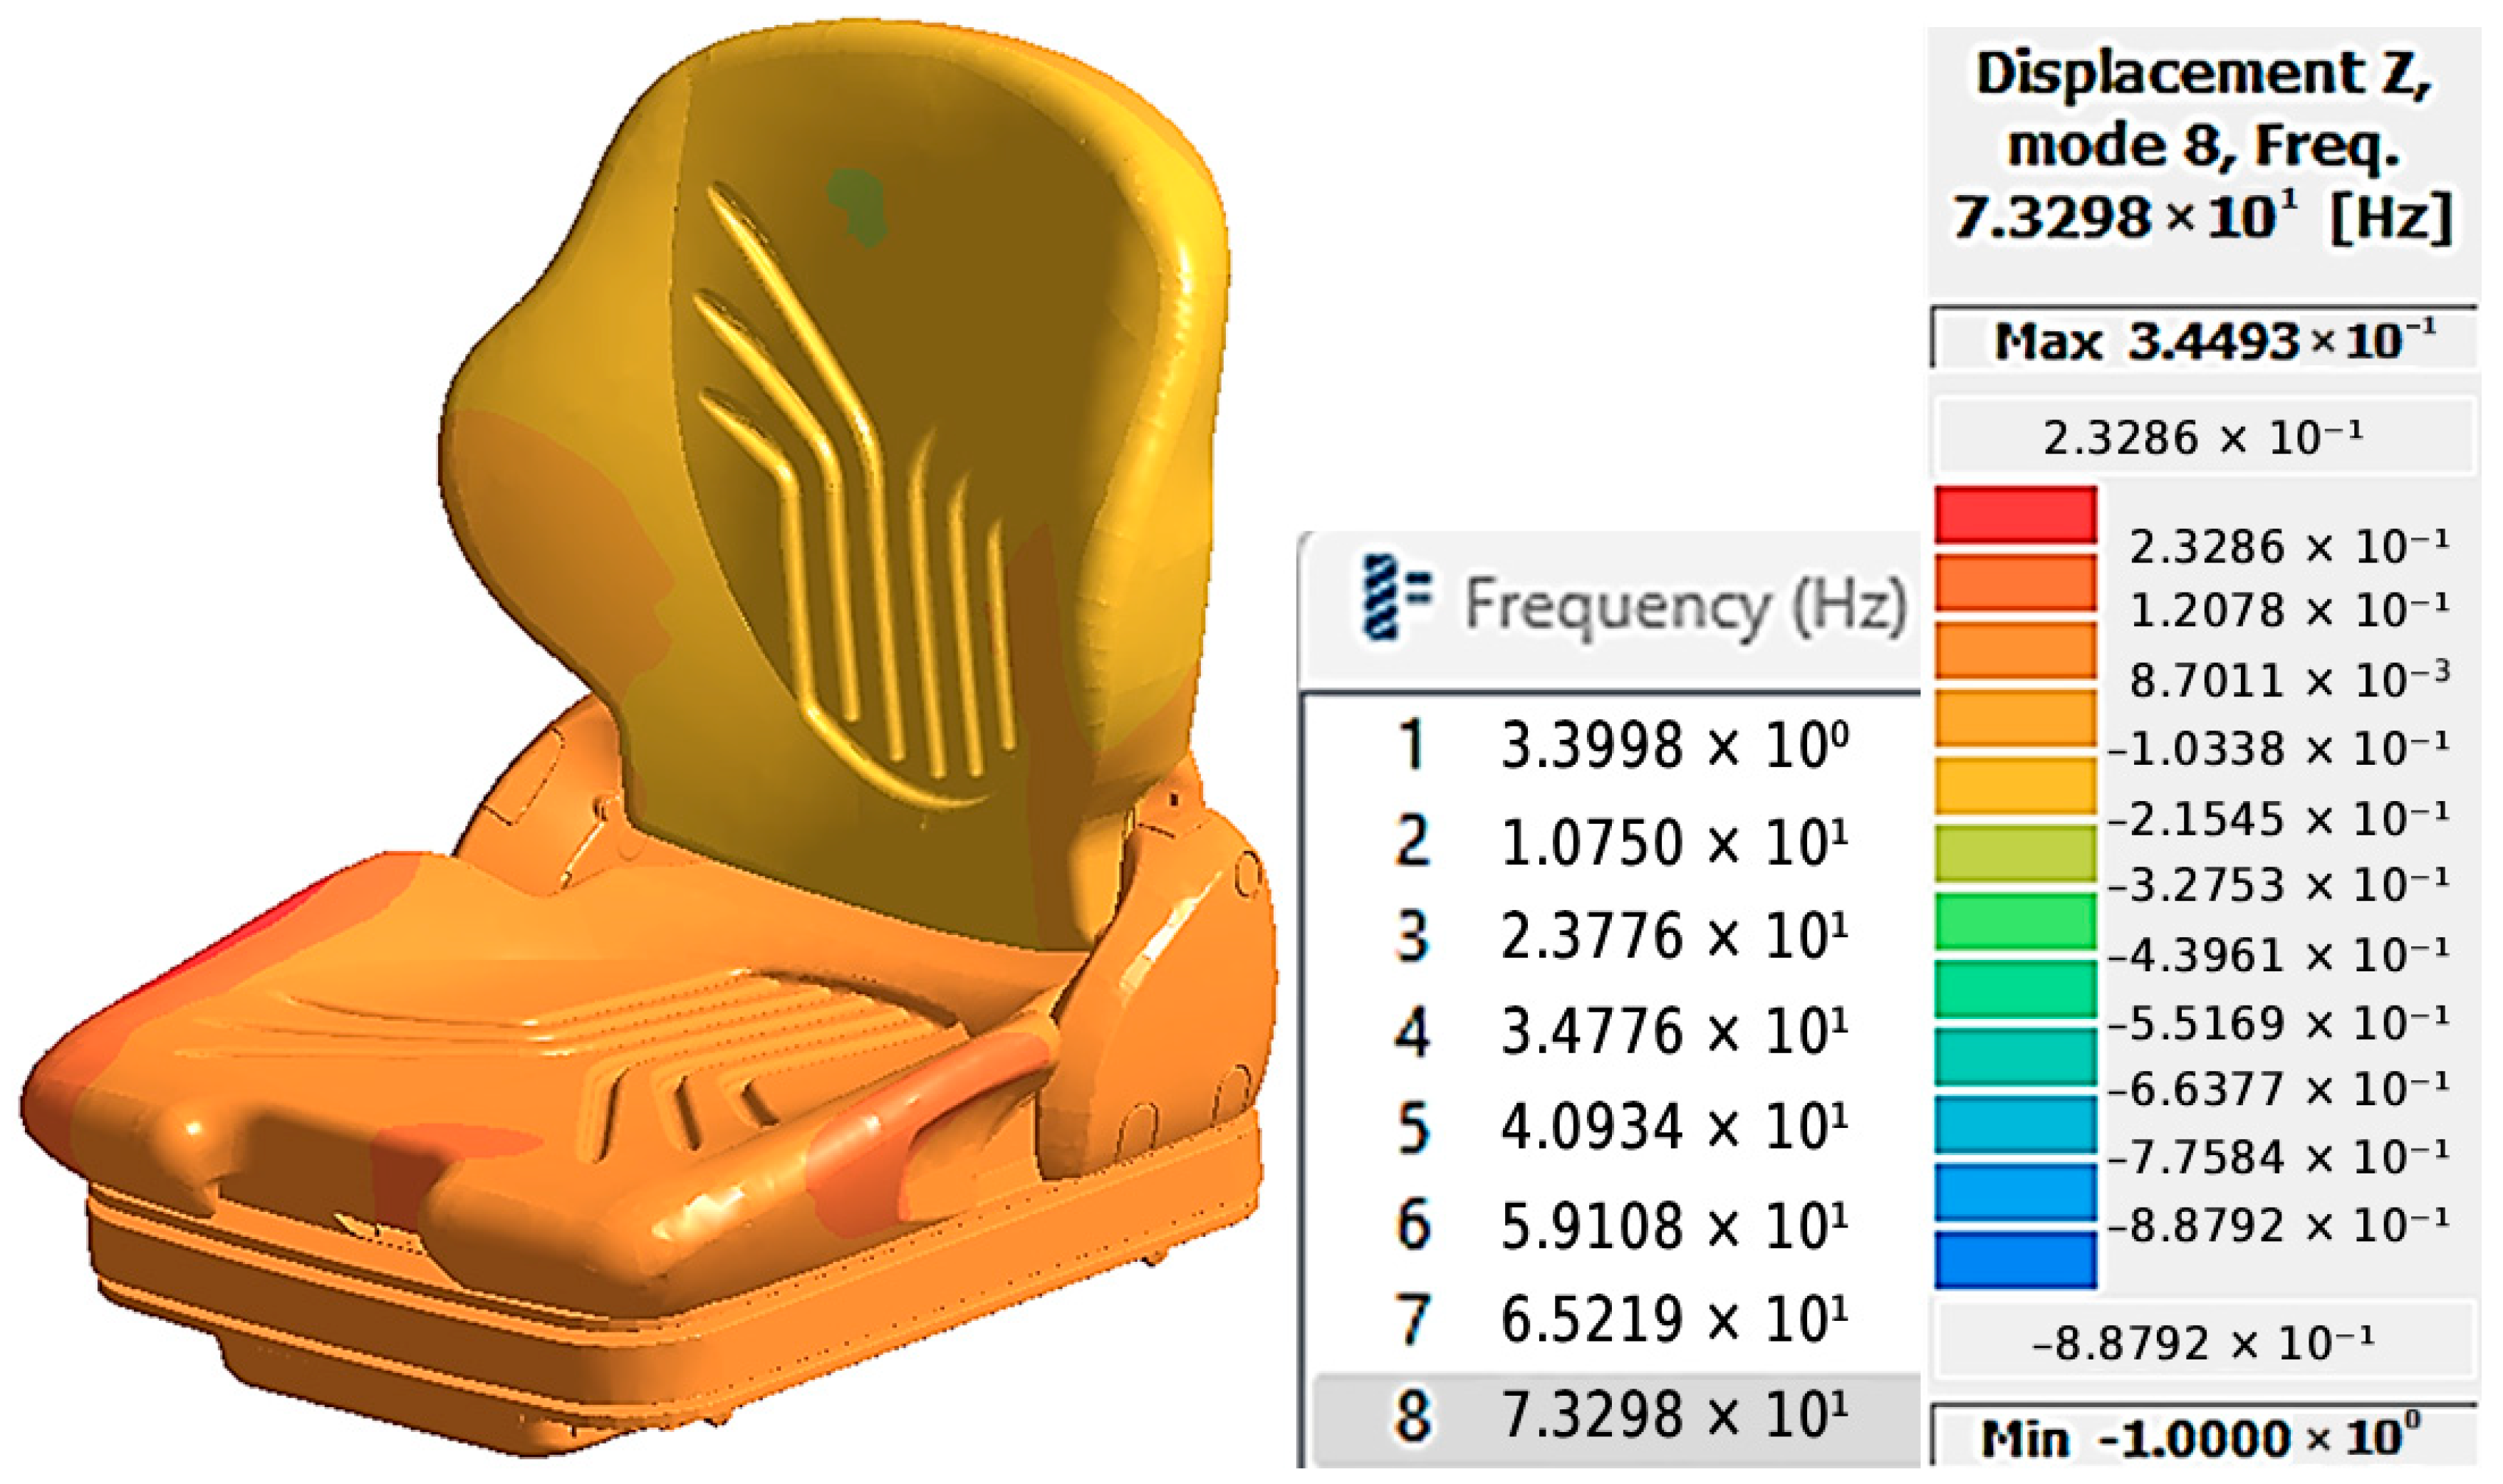
Modal characterization of the seat indicated eight fundamental vibration modes distributed across the 0–80 Hz frequency spectrum, in accordance with ISO 2631-1 guidelines. This was determined based on the maximum number of “10” modes set in the Altair SimSolid software for the stiff suspension configuration (S1 = 15 N/mm), as illustrated in
Figure 16a. This selection is critical for identifying all vibration modes with the potential to significantly impact seat performance and occupant comfort, thereby supporting a thorough and rigorous evaluation of its dynamic characteristics.
Figure 16b presents the virtual seat model, emphasizing the natural frequencies associated with each vibration mode.
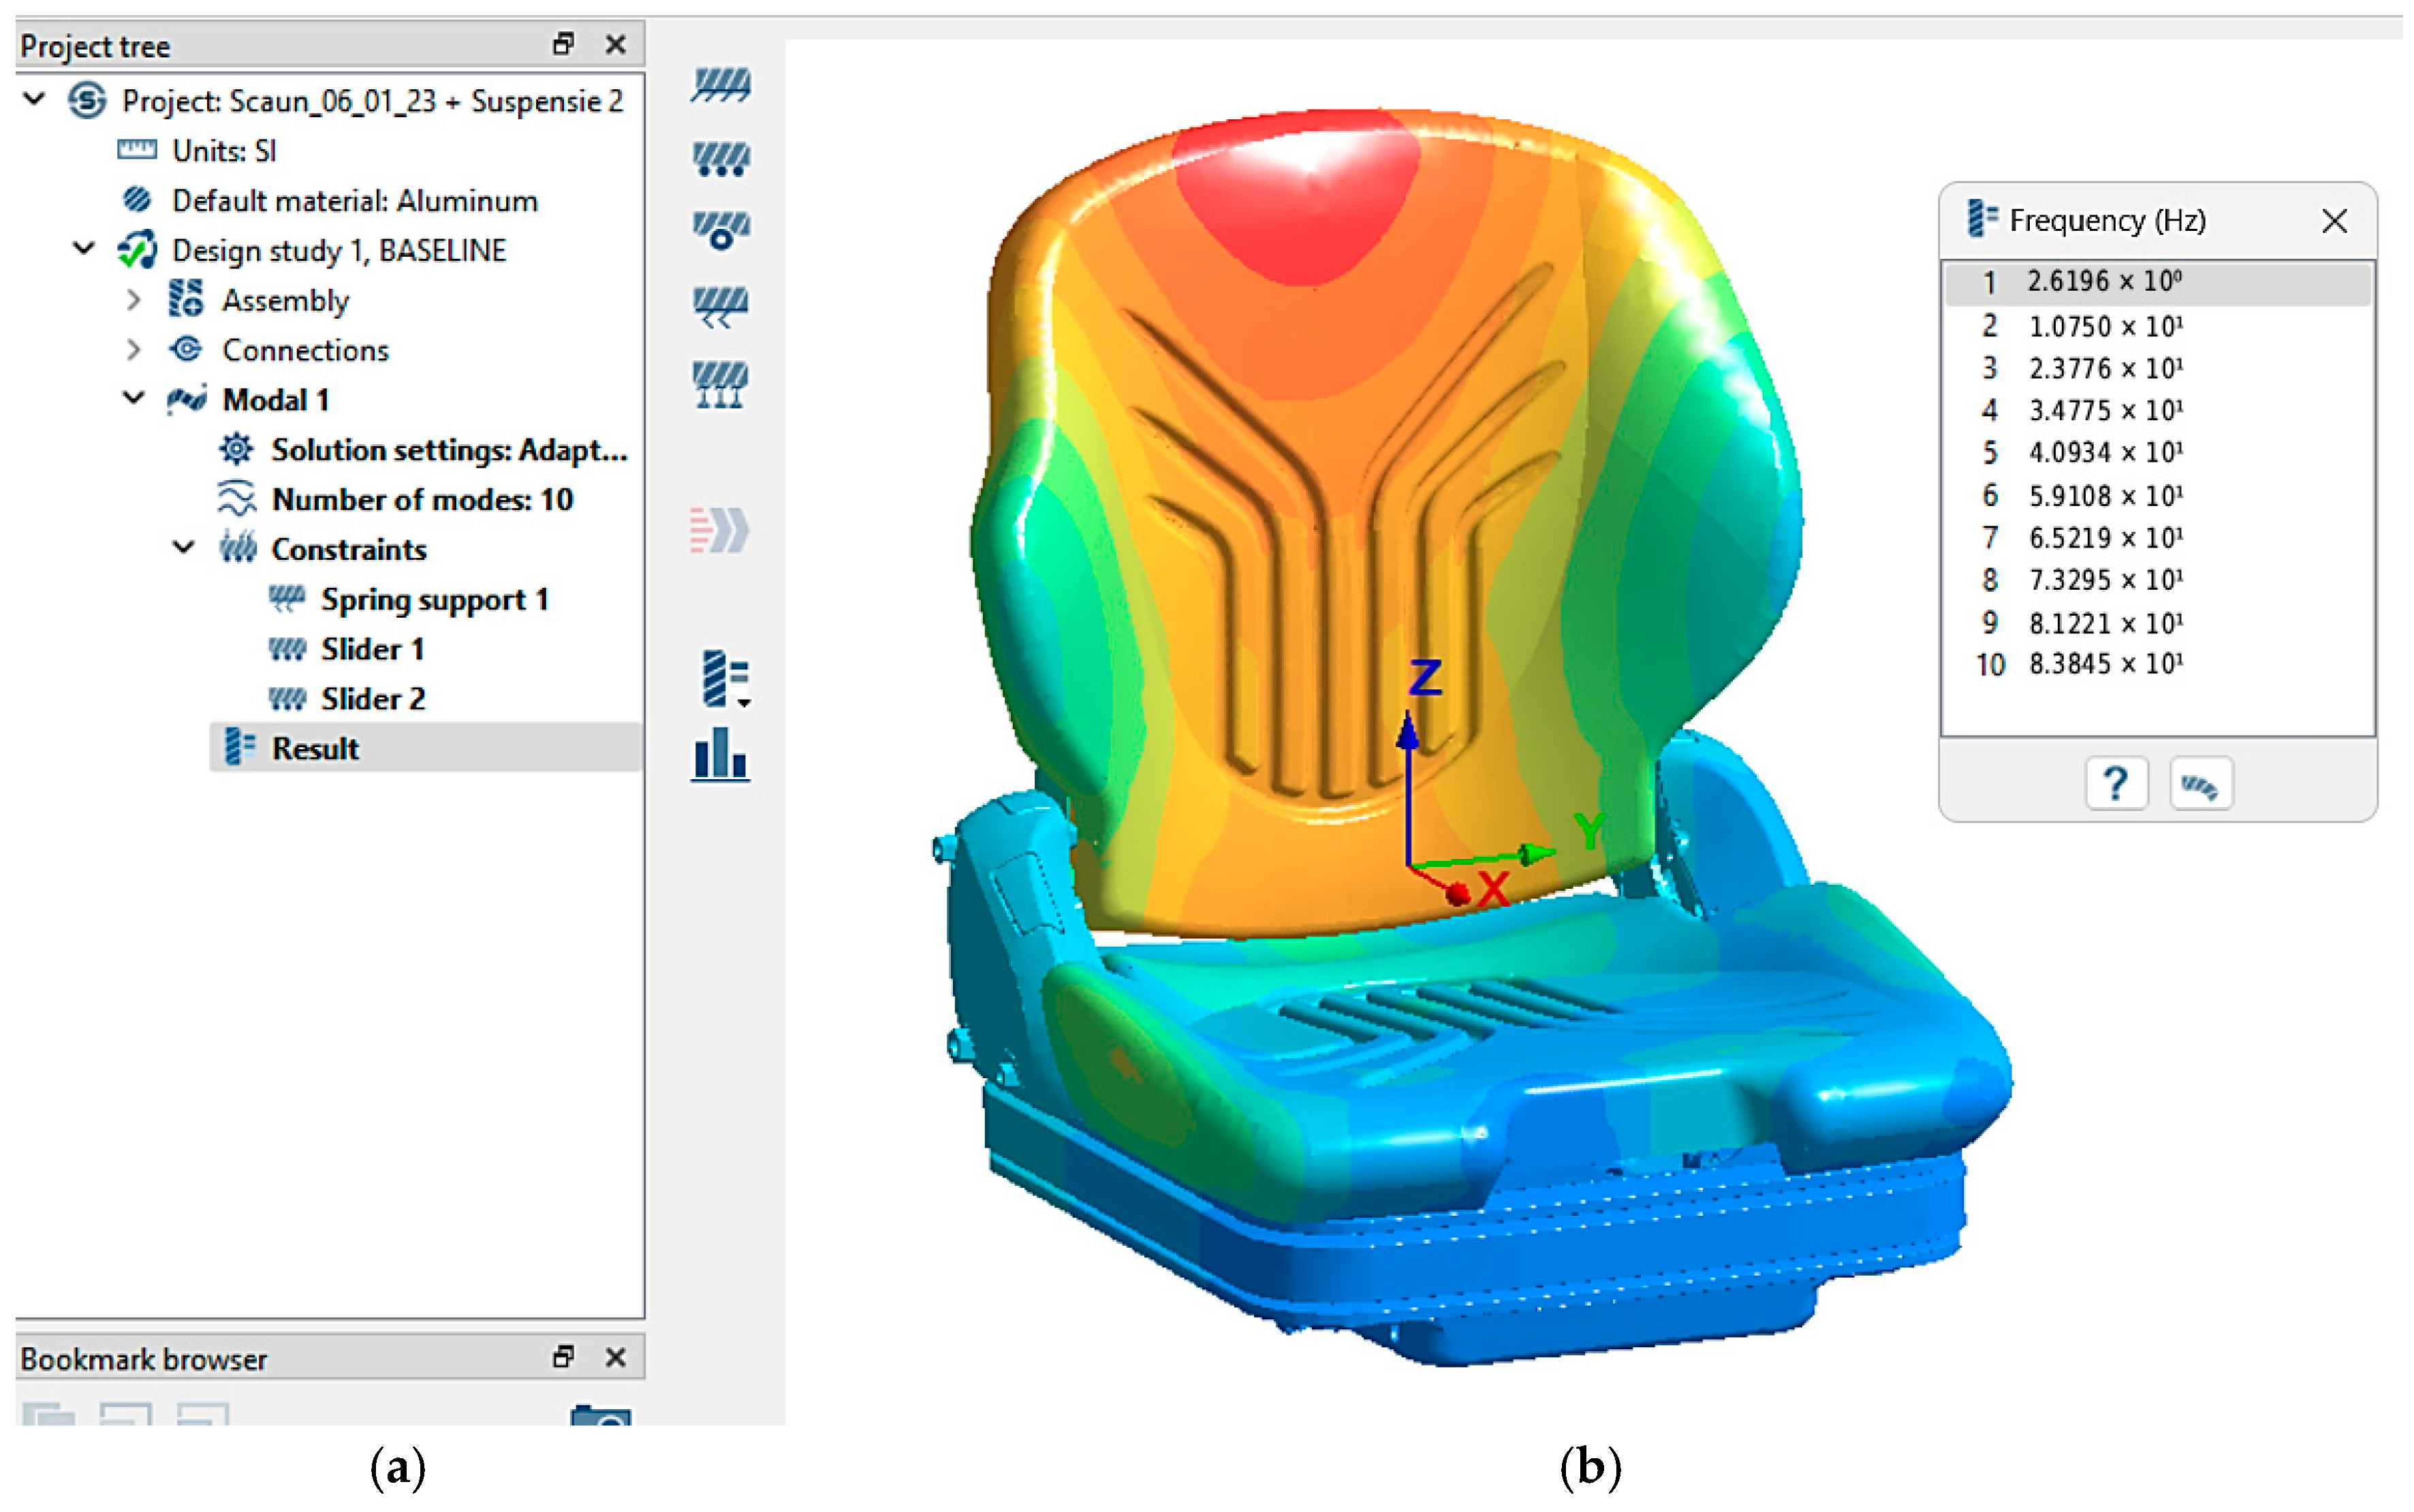
Figure 17a illustrates the computation of ten vibration modes for the S2 suspension stiffness configuration (S2 = 9.29 N/mm), while
Figure 17b presents the virtual seat model, emphasizing the natural frequencies determined for each recognized vibration mode.
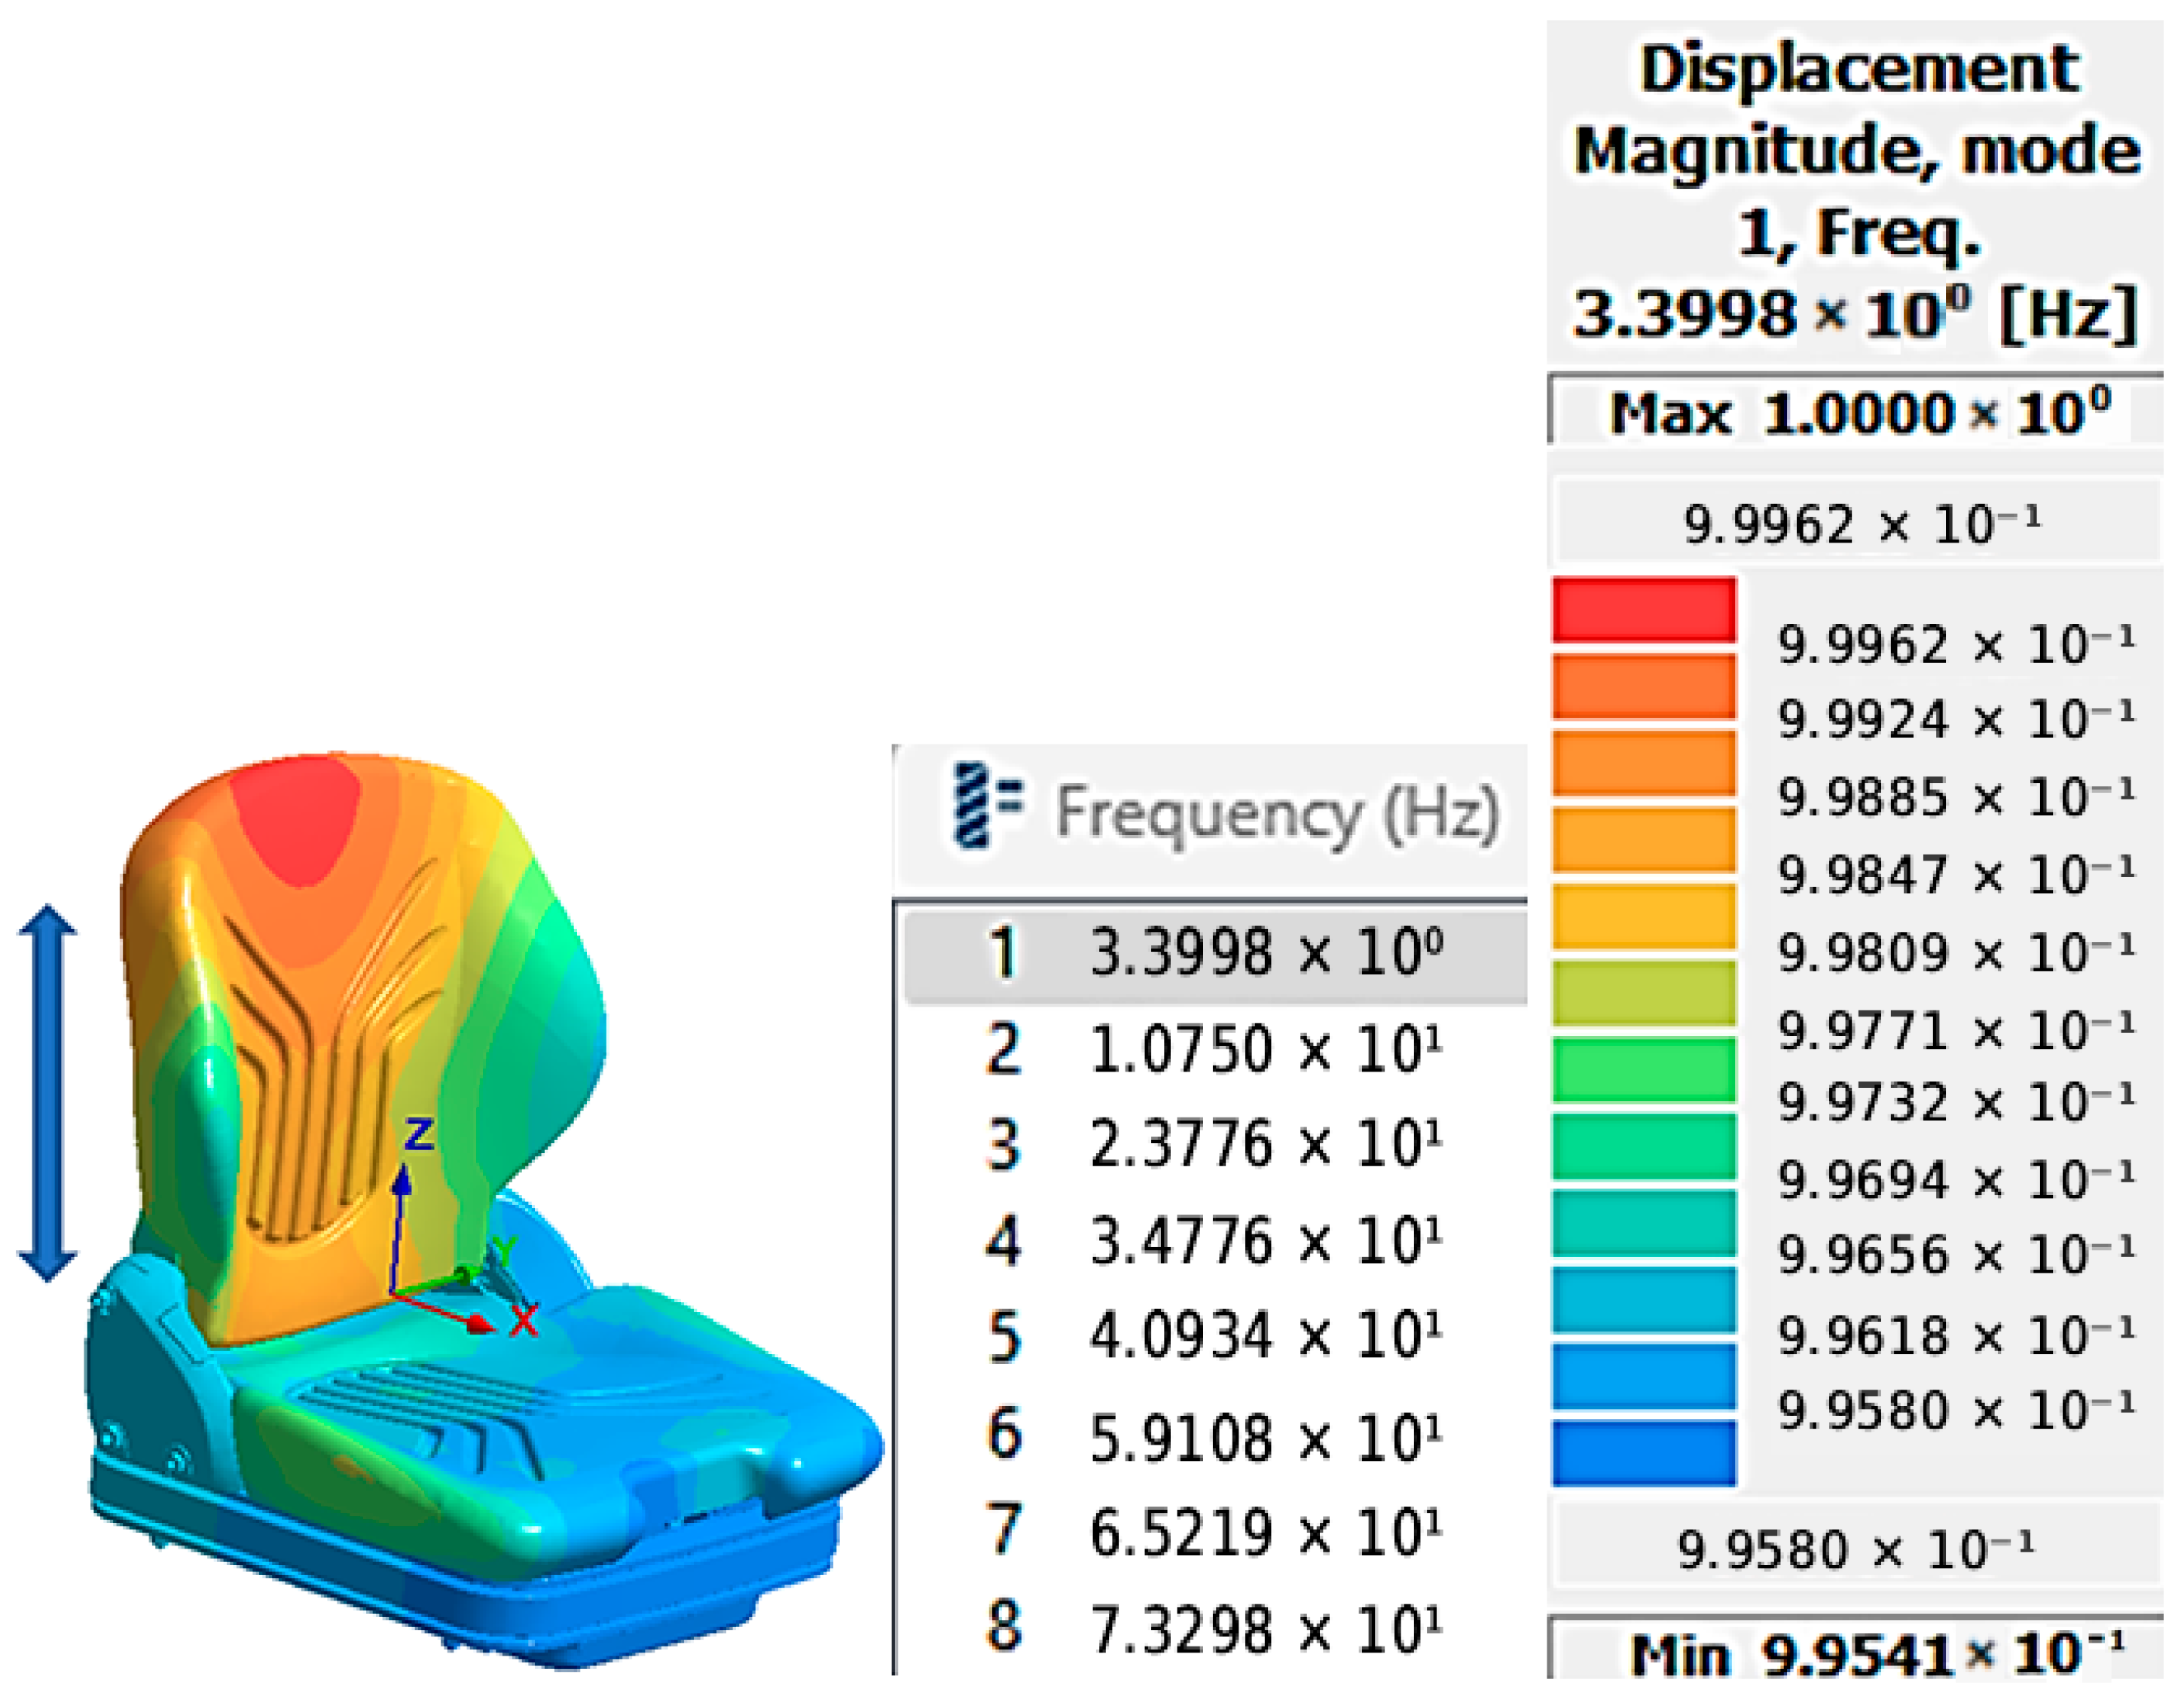
The difference between the two suspension configurations, S1 and S2, is clearly reflected in the first modal frequency of the seat. For the S1 suspension, with a stiffness of 15 N/mm, the first frequency corresponding to the motion along the Z-axis is identified at 3.39 Hz. In contrast, for the S2 suspension, with a lower stiffness of 9.29 N/mm, the first modal frequency occurs at 2.61 Hz. It is important to note that the other modal frequencies remain constant for both suspension configurations, maintaining the same vibration modes and the same influence levels of the modal participation factors.
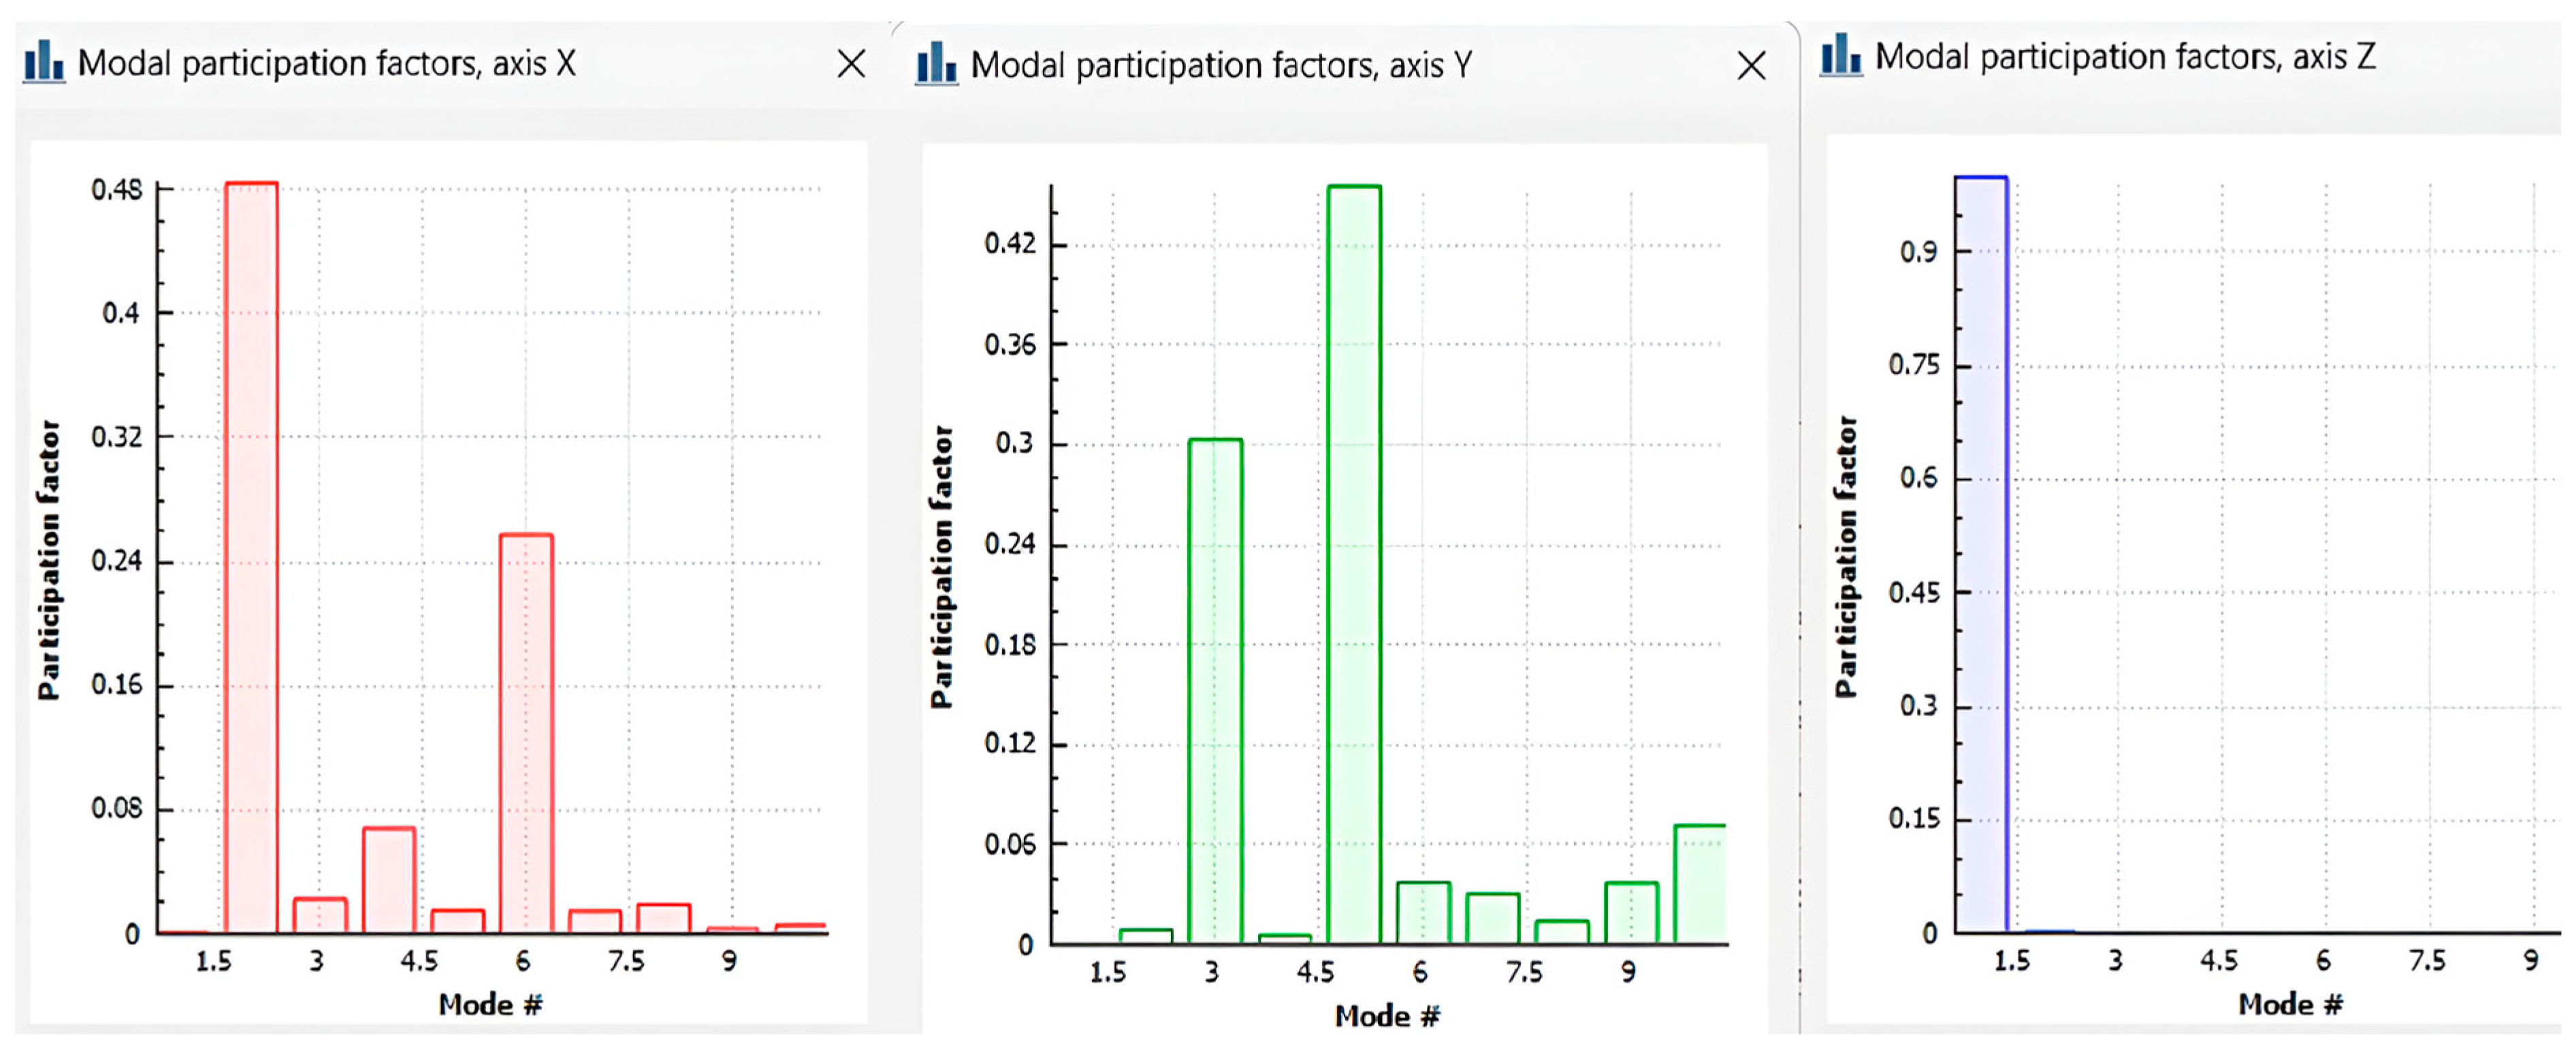
To analyze the impact of each vibration mode on the overall seat assembly, the modal participation factors were evaluated. These scalar values quantify the interaction between the vibration modes and the directional excitations within a given reference frame. Higher values of these factors indicate a significant contribution of the respective modes to the dynamic response of the system.
For the S1 suspension configuration, the modal participation factors across all three orthogonal axes (X, Y, Z) are presented in
Figure 18, highlighting the contribution of each vibration mode to the dynamic behavior of the seat.
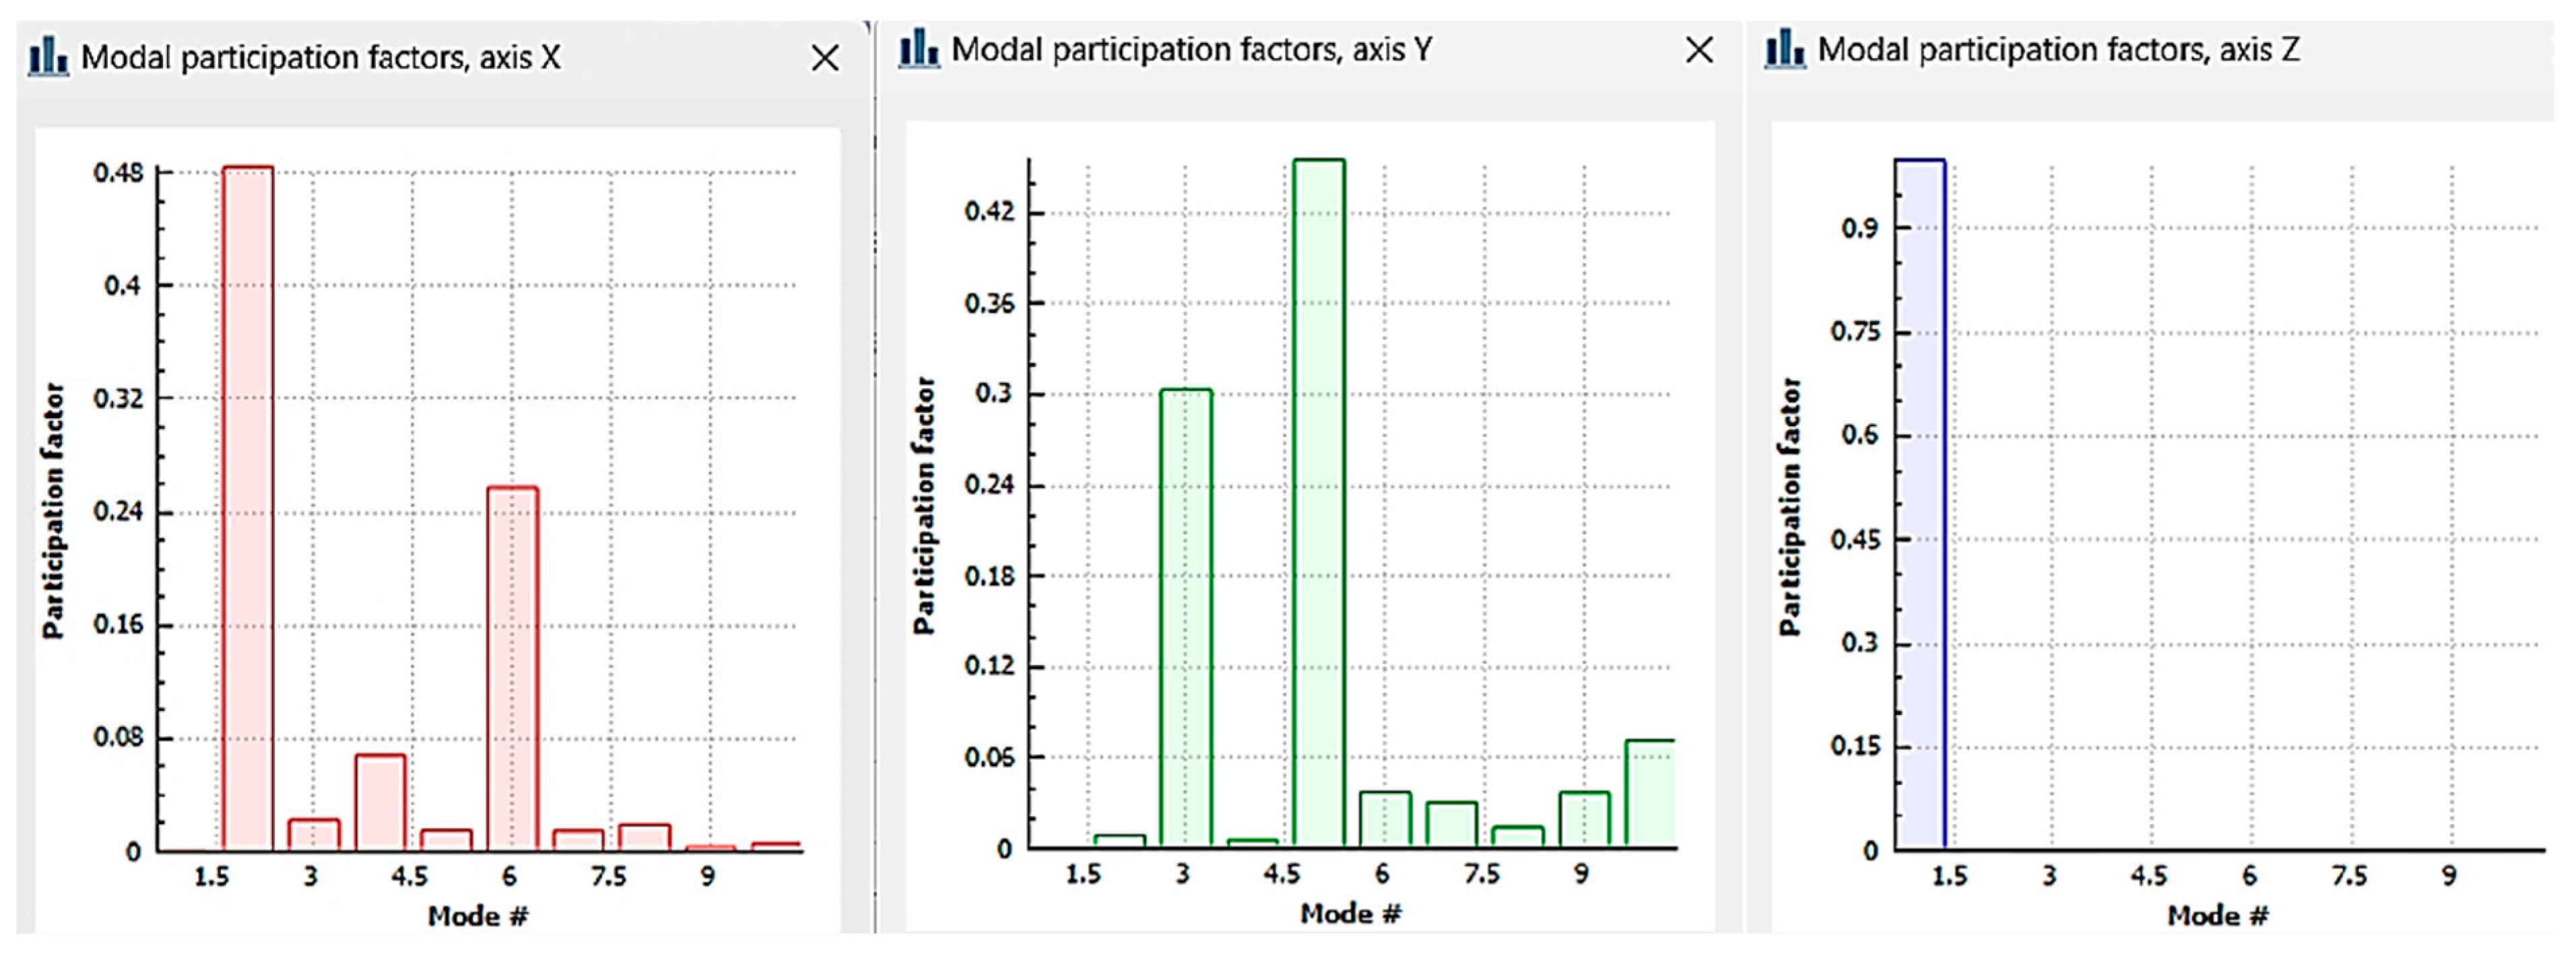
For the S2 suspension configuration, the modal participation factors across all three orthogonal axes (X, Y, and Z) are presented in
Figure 19.
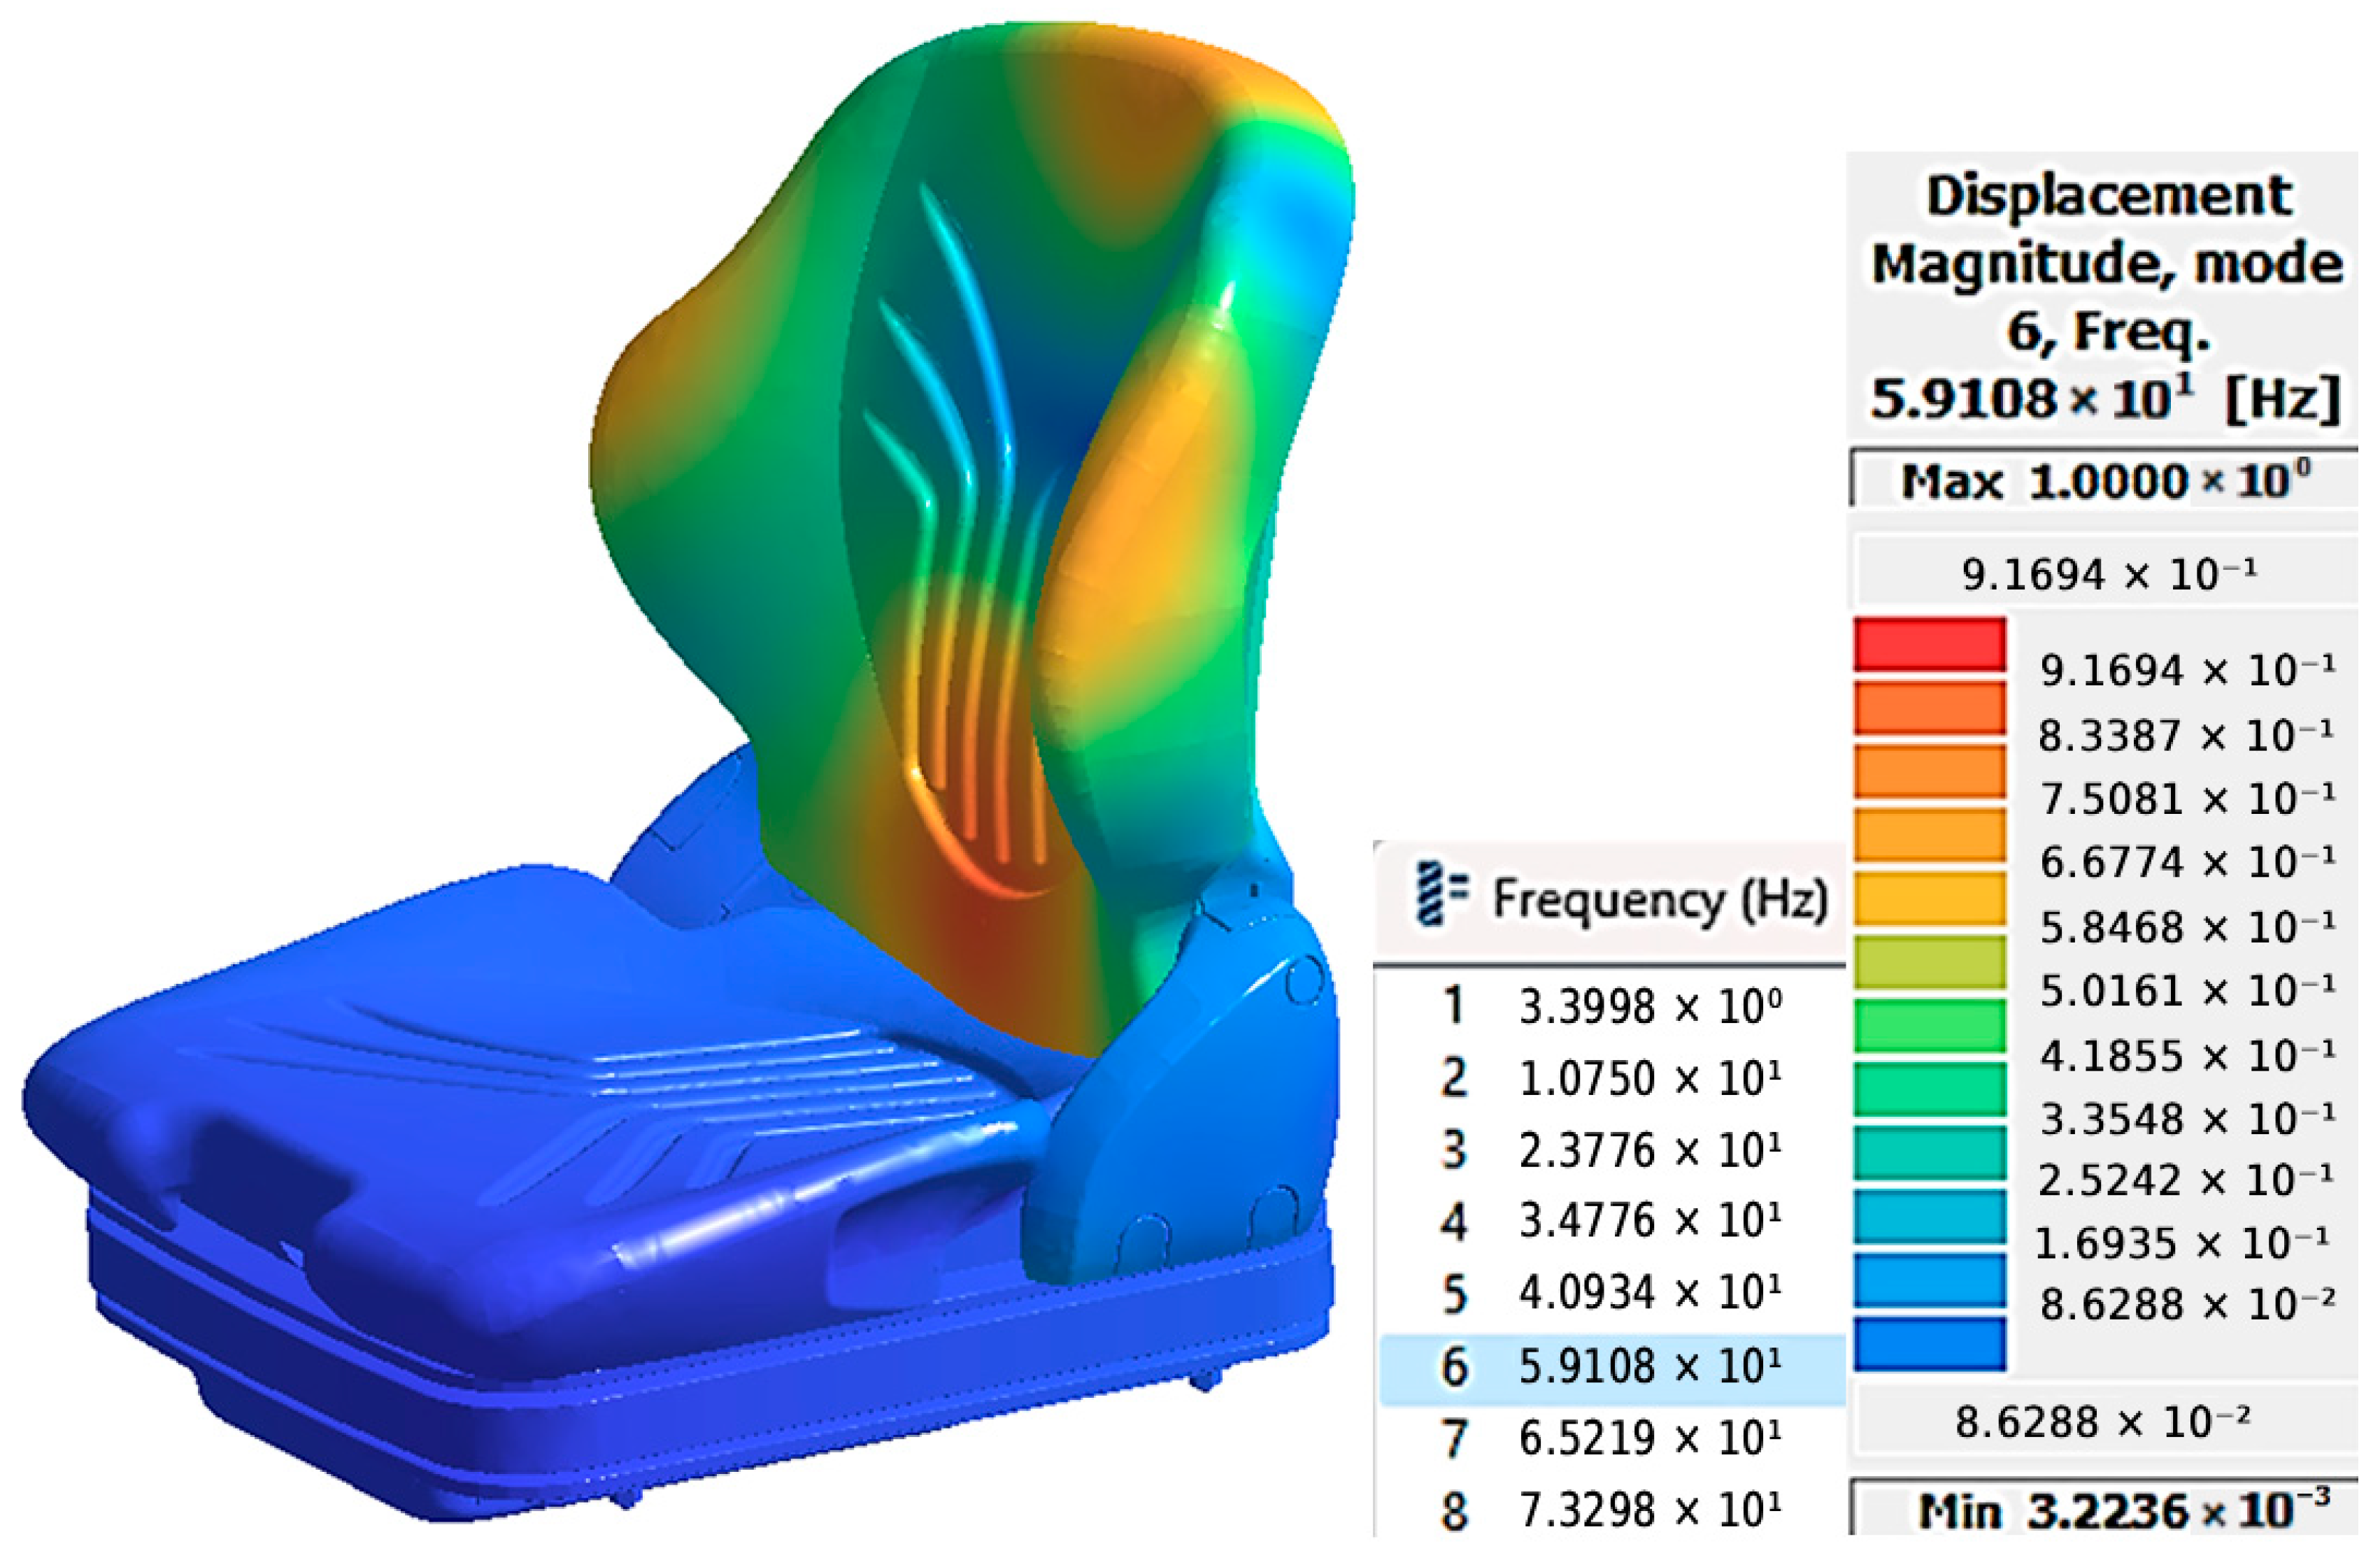
For the longitudinal axis (X-axis), the average participation factor for all 8 vibration modes is 0.110. Two frequencies tend to have a greater impact on the dynamic response:
- -
The 10.750 Hz frequency corresponds to the second vibration mode, with a participation factor of 0.480.
- -
The 59.110 Hz frequency corresponds to the sixth vibration mode, with a participation factor of 0.260.
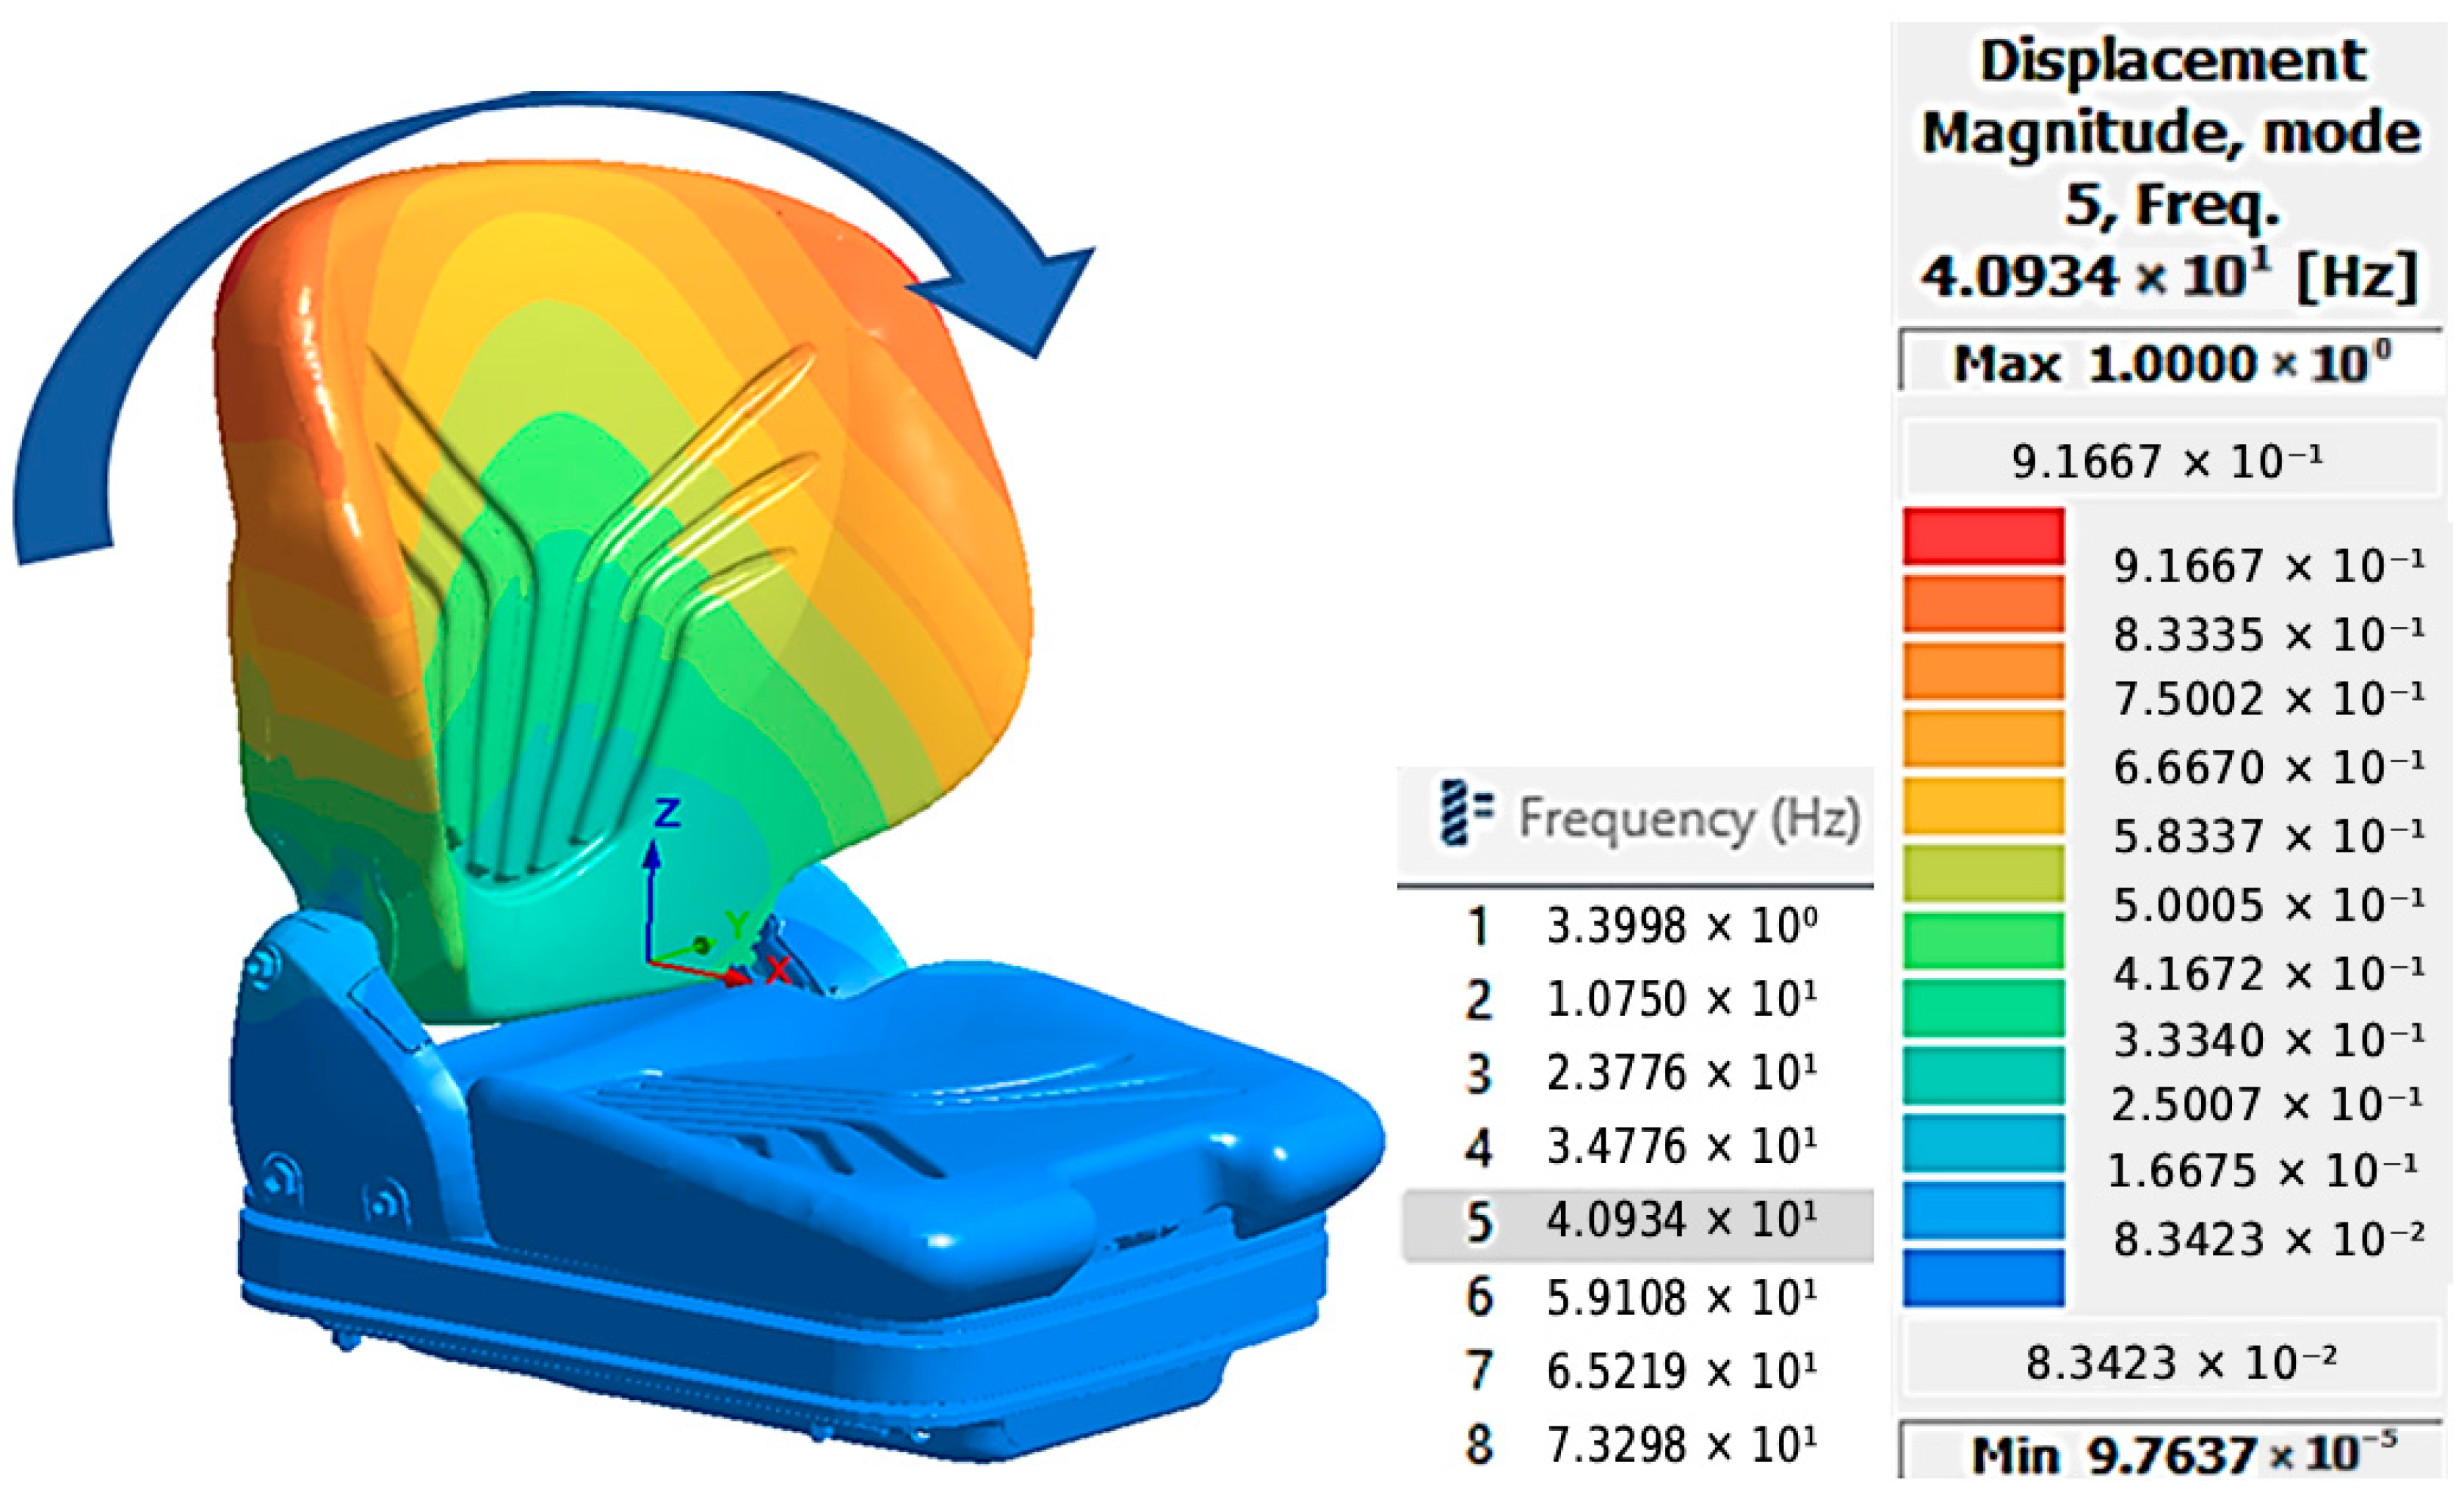
For the transverse axis (Y-axis), the average participation factor for all 8 vibration modes is 0.107. Two frequencies have a greater influence on the dynamic response:
- -
The 23.78 Hz frequency corresponds to the third vibration mode, with a participation factor of 0.300.
- -
The 40.93 Hz frequency corresponds to the fifth vibration mode, with a participation factor of 0.460.
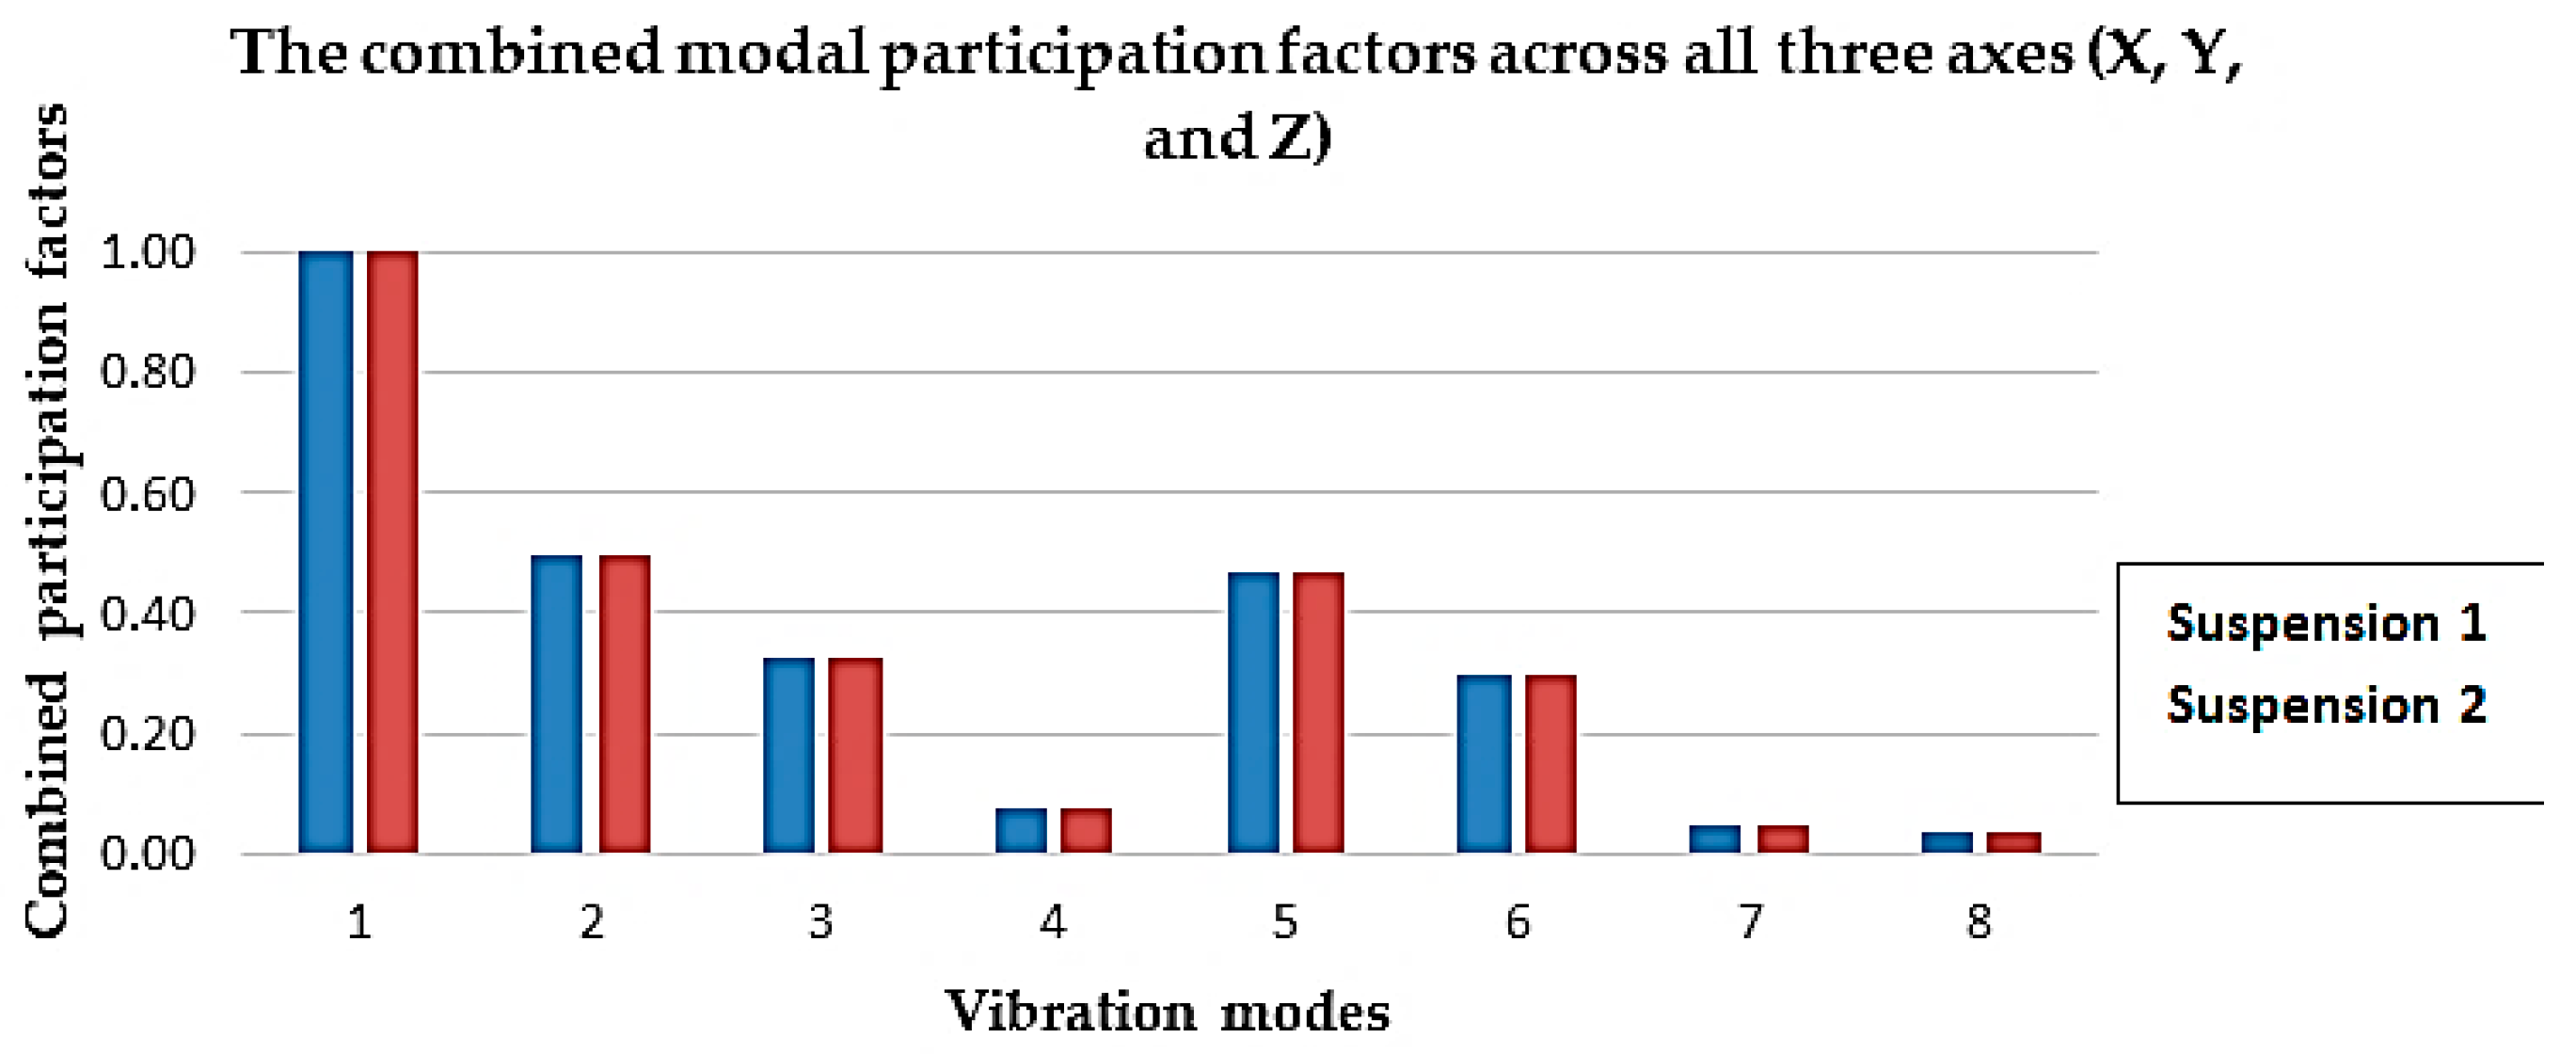
For the vertical axis (Z-axis), the average participation factor for all 8 vibration modes is 0.125. A single frequency shows a greater influence on the dynamic response:
- -
For the S1 suspension, the 3.40 Hz frequency corresponds to the first vibration mode, with a participation factor of 1.00.
- -
For the S2 suspension, the 2.61 Hz frequency corresponds to the first vibration mode, also with a participation factor of 1.00.
By summing the participation factors for each axis (X, Y, Z) at the same frequency, the most significant modal frequencies from the entire analysis were identified, as illustrated in
Figure 20.
4. Discussion
The vibration transmissibility amplitude was determined by processing the raw acceleration data collected from triaxial accelerometers mounted on the tractor cabin floor and the operator’s seat structure (seat pan and backrest). The data were first segmented according to each sensor location and filtered in the Biometrics software to isolate the vibration components corresponding to each measurement point. Subsequently, the processed acceleration signals were imported into the VATS (Vibration Analysis and Testing System) environment, where a Fast Fourier Transform (FFT) was applied to convert the time-domain data into the frequency domain. This approach enabled the evaluation of the transmissibility amplitude as the ratio between the seat response and the floor excitation. The results revealed localized amplification peaks in the 4–8 Hz range, consistent with the critical frequency band of human body resonance defined in ISO 2631-1:1997, confirming that the structural modes of the seat contribute to vibration amplification under specific operating conditions.
Building upon these findings, the experimentally identified frequency peaks were further used as reference indicators for the validation of the numerical model and for the evaluation of the vibrational performance of the two structural configurations of the seat suspension system implemented in the TE-0 self-propelled electric tractor. This correlation between the experimental transmissibility data and the simulation results allowed for a more accurate assessment of the dynamic behavior and vibration attenuation capacity of the seat design.
For the validation of the numerical model and the evaluation of the vibrational performance of the two structural configurations of the seat suspension system in the TE-0 self-propelled electric tractor, a comparative analysis was performed between the natural frequencies determined through the modal analysis using FEM and the values obtained from experimental measurements under real operating conditions on untilled terrain, using accelerometer sensors.
The consolidation of these data included the 8 natural vibration modes, highlighting, for each mode, the corresponding values of the frequencies and participation factors.
This provides a comprehensive overview of the dominant vibration transmission modes affecting the operator and is presented in
Table 5.
In the modal analysis, two suspension configurations, referred to as S1 and S2, were considered, differentiated by their stiffness and damping parameters. For each natural vibration mode, the characteristic frequencies corresponding to both configurations were determined, while, in parallel, the dominant frequencies were recorded from the accelerometer sensor signals. The modal participation associated with each mode was also evaluated to identify their influence on the overall dynamic response of the seat-operator system.
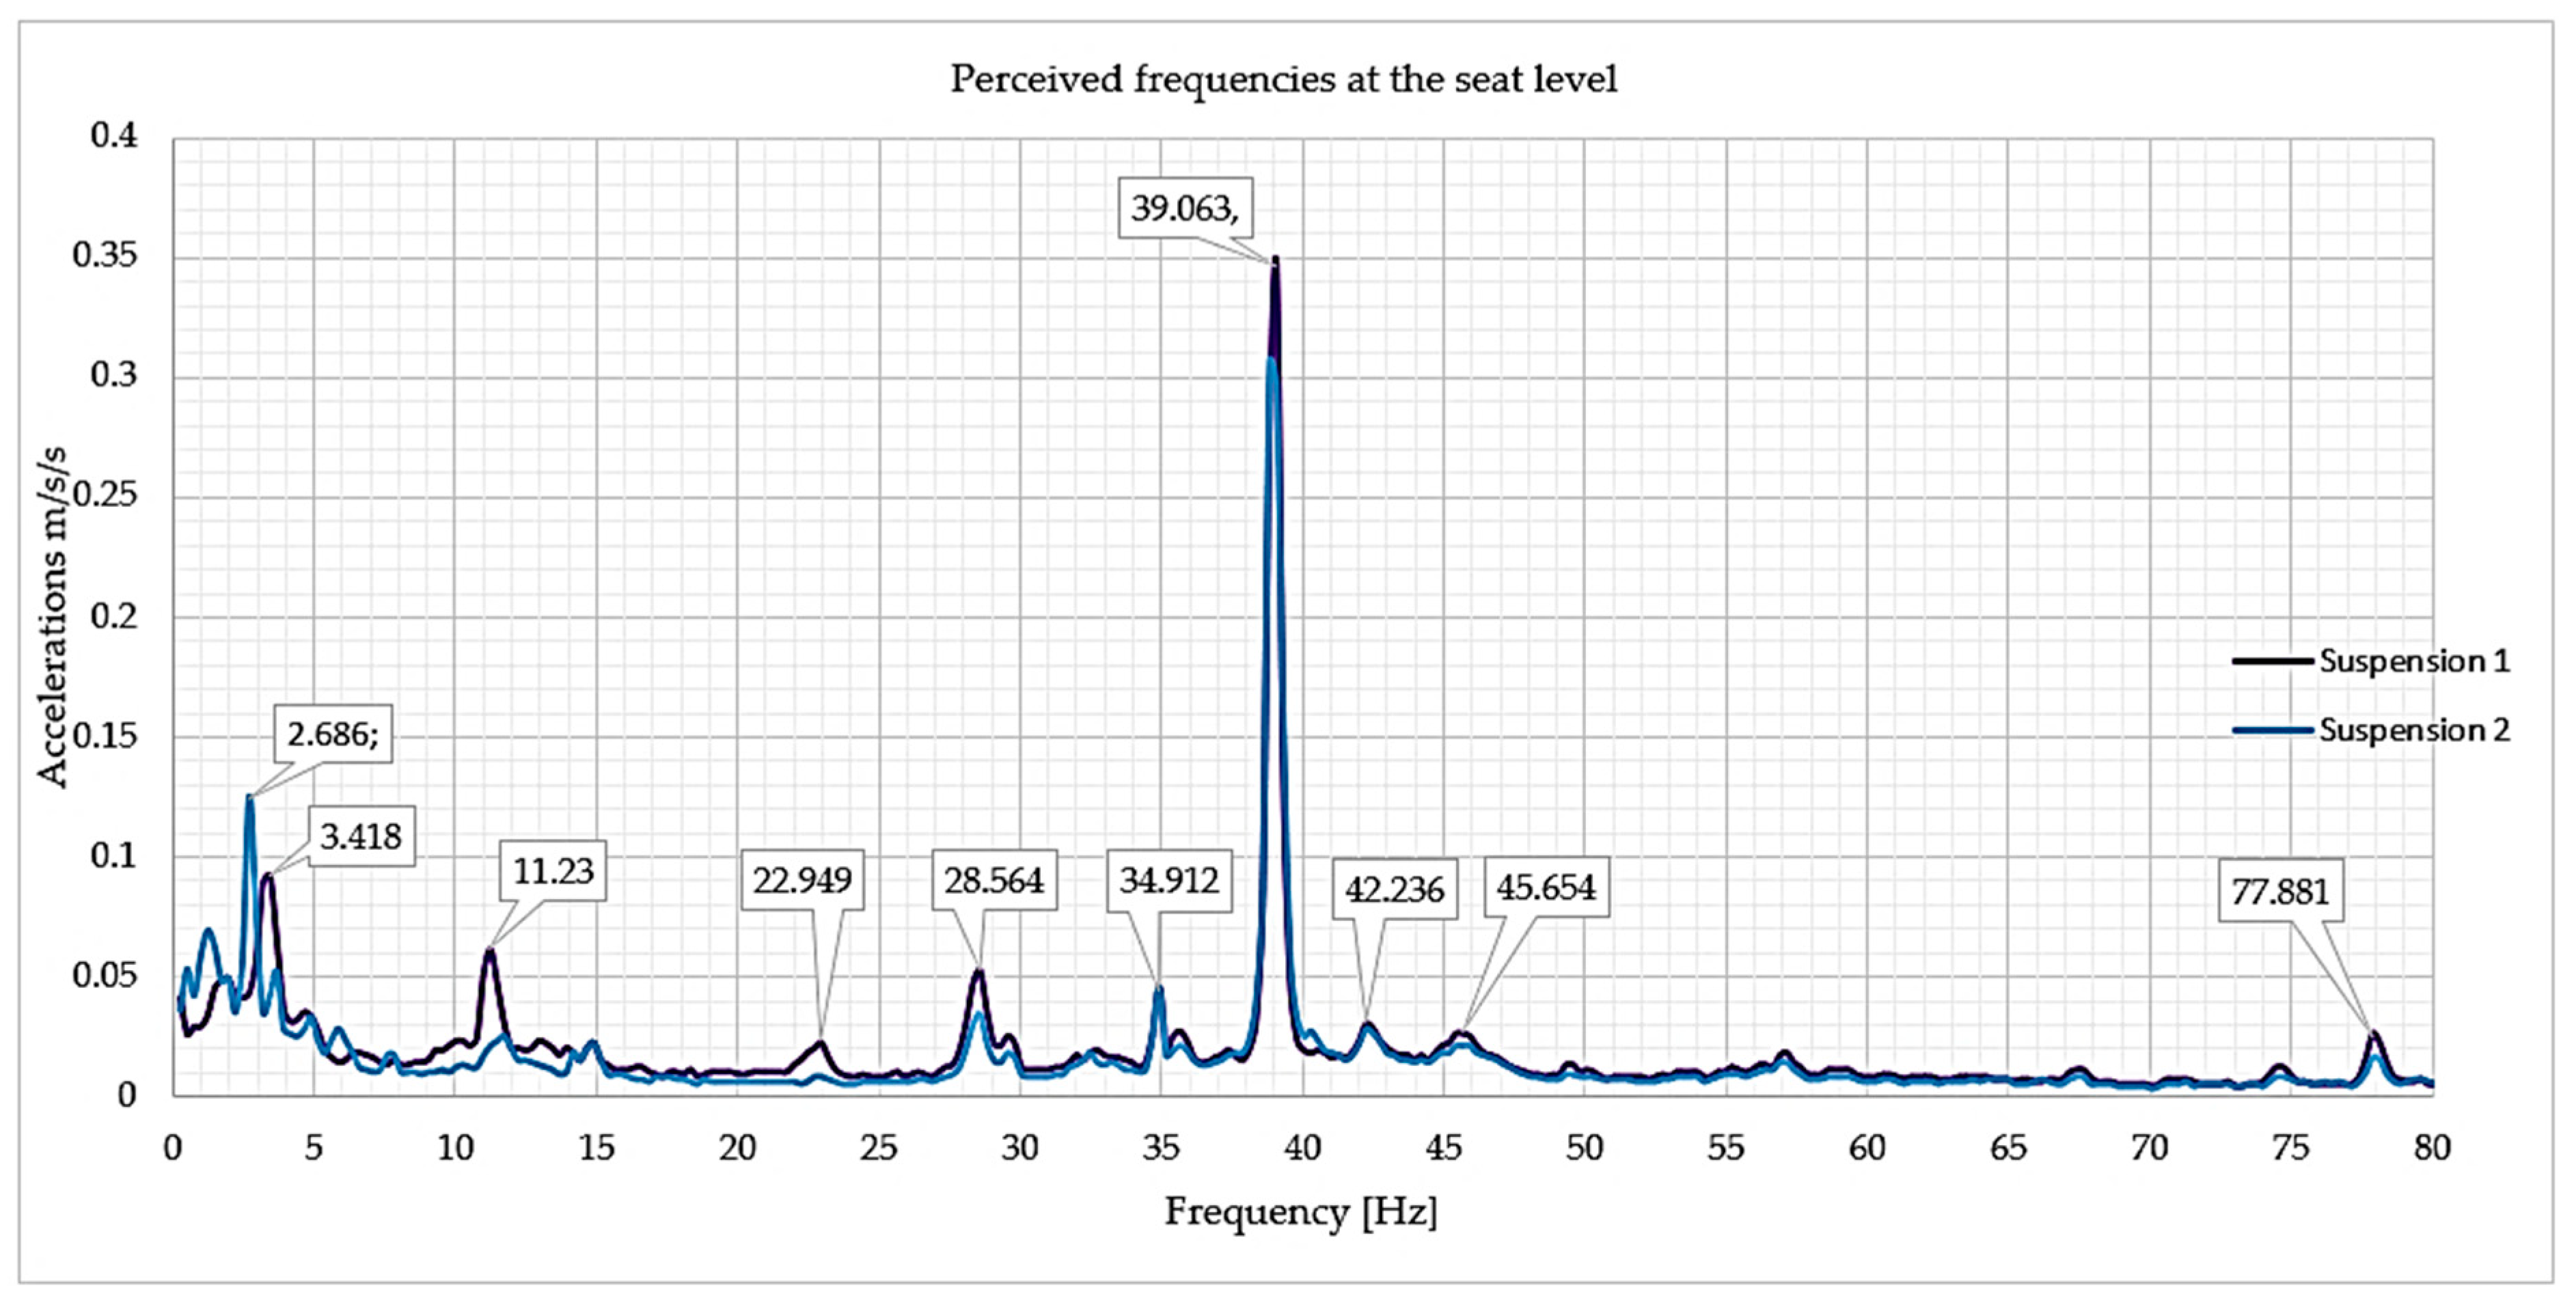
By comparing the natural frequencies estimated through FEM with those obtained experimentally, a strong correlation is observed for both the S1 and S2 seat suspension configurations. For example, for Mode 1, the calculated frequency for S2 is 2.61 Hz, compared to 2.686 Hz obtained experimentally, the difference being negligible, which suggests a high capability of the model to reproduce the real vibrational behavior in this critical low-frequency range. For S1, the calculated frequency is 3.39 Hz, while the measured value is 3.418 Hz, further confirming the accuracy of FEM estimations.
Moving to Mode 3, the obtained values are 23.78 Hz (S2, FEM) and 22.949 Hz (experimental), corresponding to a relative error of less than 4%. For S1, FEM value is 24.63 Hz, also showing close proximity to the measured data. In the case of Mode 4, a slightly larger deviation is observed: FEM—26.57 Hz (S2) versus 27.094 Hz (measured), a difference explained by the local influence of contact conditions and nonlinear damping effects. For S1, the simulated value is 27.37 Hz, which is also close to the experimental result. For Mode 5, the phenomenon becomes more complex due to the presence of multiple spectral components in the experimental signal—39.063 Hz, 42.236 Hz, and 45.654 Hz—suggesting possible modal overlaps or additional structural effects. In this frequency range, FEM estimates are 41.76 Hz for S2 and 42.64 Hz for S1, values positioned near the center of the experimental frequency band, indicating a good agreement and an accurate representation of the global phenomenon.
Beyond the 39 Hz frequency, associated with the nominal operating speed of the electric motor, the measured amplitudes decrease significantly, and the frequencies calculated in the modal analysis no longer exhibit a direct correlation with the experimental measurements.
However, this behavior is explained by the fact that the modal participation factors have very low values.
Another important aspect is the analysis of the modal participation factors, which highlights the dominant role of the fundamental mode (Mode 1) in the overall vibrational behavior, with a participation factor of 1.00. This value indicates that the largest portion of the vibration energy is concentrated in this mode, which is why optimizing the suspension to reduce this frequency is essential.
The evaluation of the measured amplitudes under the two suspension configurations (S1 and S2) revealed substantial differences in the seat’s dynamic response, particularly within the low-frequency domain. For the first modal mode, corresponding to the fundamental frequency of the seat–suspension system, the S2 configuration shows a much higher amplitude, approximately 1.125 m/s2, compared with only 0.09 m/s2 for the S1 configuration. The increased amplitude suggests a reduced stiffness and a possible local resonance at low frequencies. However, the S2 configuration provides superior vibration isolation in the critical 3–40 Hz range, which is relevant for terrain-induced excitations, wheel-ground contact, and the operating speed of the electric motor.
According to the ISO 2631-1:1997 standard, the frequency-weighted root mean square acceleration (aw) was calculated to evaluate the vibration exposure transmitted to the operator for both suspension configurations.
The results show that the S1 suspension exhibited an average weighted acceleration of 0.52 m/s2, while the S2 suspension recorded a lower value of 0.31 m/s2, demonstrating improved vibration isolation efficiency. These findings support the conclusion that the S2 configuration provides enhanced comfort and reduced biomechanical stress on the operator during tractor operation on uneven terrain.
Within this functional frequency range, the S2 configuration effectively reduces the amplitudes transmitted to the seat, compared with S1, suggesting a better dynamic damping capacity and a more efficient adaptation to real operating conditions. In the 40–80 Hz frequency range, which generally corresponds to higher-order vibration modes and high-frequency noise sources originating from structural components (e.g., seat frame, mechanical fastenings, auxiliary systems), the differences between S1 and S2 become vibrationally insignificant. This convergent behavior in the high-frequency domain suggests that the optimization provided by the S2 configuration acts primarily in the critical comfort range (below 40 Hz), while in the upper frequency range both configurations exhibit a comparable vibrational response, dominated by the global structural characteristics of the seat-vehicle assembly.
For a rigorous quantification of the correlation between the theoretical values and the experimental results, a relative error analysis was carried out for the relevant vibration modes and is presented in
Table 6.
This error was calculated using the formula in relation (10):
By correlating the natural frequencies identified in the modal analysis with those measured experimentally for the seat of the self-propelled electric tractor, and with the literature data on the effects of vibrations on the human body presented in
Table 7, a series of potential biomechanical risks and physiological discomforts associated with operation on untilled terrain can be outlined.
Although the present analysis focused primarily on short-term WBV exposure, the acceleration data recorded during the experimental tests provide the necessary parameters—including r.m.s. acceleration values, frequency spectra, and exposure duration—for estimating the daily equivalent acceleration (A(8)) and the cumulative vibration dose over longer timeframes.
According to ISO 2631-1 and ISO 2631-5 [
42], these indices can be integrated into predictive models to evaluate chronic biomechanical effects such as spinal loading, lumbar fatigue, and posture instability. The results obtained in this study thus represent the first step toward developing long-term risk assessment frameworks for operators exposed to sustained vibration conditions in electric agricultural tractors.
Table 7.
Adverse Health Effects Caused by Whole-Body Vibrations [
43].
Table 7.
Adverse Health Effects Caused by Whole-Body Vibrations [
43].
| Frequency (Hz) | Adverse Health Effects |
|---|
| 4–9 | Generalized sensation of discomfort |
| 13–20 | Symptoms affecting the head region |
| 6–8 | Symptoms in the lower jaw region |
| 13–20 | Speech impairment effects |
| 12–16 | Sensation of a lump in the throat |
| 5–7 | Thoracic pain |
| 4–10 | Abdominal discomfort |
| 10–18 | Increased urinary frequency |
| 13–20 | Muscle hypertonicity |
| 4–8 | Alteration of breathing dynamics |
| 4–9 | Muscular contractions |
In particular, the fundamental frequency of the seat-suspension system, ranging between 2.6 Hz and 3.4 Hz depending on the suspension configuration (S2 and S1, respectively), is located in the proximity of the 4–9 Hz interval, identified as a critical range associated with general discomfort, muscle contractions, and influence on respiratory movements.
This range is particularly sensitive, as it coincides with the natural frequencies of the human torso and the respiratory system, which may lead to an amplification of physiological reactions under prolonged exposure.
For the higher-order modal frequencies, ranging between 10 and 20 Hz, such as those identified in Modes 2, 3, and 4 (e.g., 11.23 Hz, 22.949 Hz, 28.564 Hz), the literature indicates a correlation with adverse effects such as chest pain (5–7 Hz), increased urge to urinate (10–18 Hz), sensation of a lump in the throat (12–16 Hz), and even speech impairment (13–20 Hz).
Although these symptoms may appear minor in the short term, they can become chronic under conditions of repeated daily exposure, particularly in agriculture, where operators spend long hours in the field, being continuously subjected to structural vibrations generated by uneven grass-covered terrain.
In the 6–8 Hz range, where the literature indicates the occurrence of symptoms in the lower jaw region, the secondary natural frequencies of the seat also partially align harmonically, being associated with possible complex interactions between the operator’s body mass and the suspension characteristics.
Even though these frequencies do not appear as dominant in the analyzed spectrum, they may become relevant under conditions of composite, irregular vibrations characteristic of real agricultural environments.
In the 40–80 Hz range, where the higher-order vibration modes are located (e.g., Modes 6–8), the literature does not report significant direct effects on the human body. This observation is further supported by the experimental results, which show that the differences between the S1 and S2 configurations become insignificant in this frequency domain, suggesting that the vibrational response is more strongly influenced by the global structural stiffness than by the suspension characteristics or the biomechanical behavior of the operator.
Therefore, the greatest health risks for the operator occur in the 4–20 Hz range, particularly in the proximity of the fundamental natural frequency and the lower-order vibration modes of the seat. These frequencies coincide with the resonance zones of various parts of the human body, and their effects may range from general discomfort and muscular fatigue to impairments of respiratory functions or internal organs.
Building upon the information presented in
Table 7, which summarizes the main adverse health effects caused by whole-body vibration exposure, it becomes essential to provide a quantitative reference framework that links the vibration frequency range and acceleration levels to the operator’s physiological and comfort responses.
To this end,
Table 8 presents a synthesis of the threshold values defined by ISO 2631-1:1997, illustrating the relationship between frequency, root mean square (r.m.s.) acceleration, and the direct health and performance indicators of the human operator. These threshold zones highlight the onset of discomfort, fatigue, reduced work efficiency, and potential long-term health risks under prolonged exposure conditions. By comparing the vibration frequencies identified through the experimental and numerical analyses with these standardized exposure limits, the biomechanical relevance of the measured data can be more accurately interpreted within the framework of occupational health and ergonomic safety.
As can be observed, several of the vibration frequencies and acceleration amplitudes identified during the experimental tests approach or slightly exceed the threshold levels defined by the ISO 2631-1:1997 standard for the onset of discomfort and fatigue.
These findings indicate that even under grass-covered soil conditions, specific modal responses of the seat structure may lead to localized amplification of vibration transmission toward the operator’s body.
Consequently, prolonged exposure to such vibration conditions may contribute to increased physical strain, postural instability, and reduced work efficiency, emphasizing the importance of continuous vibration monitoring and seat design optimization for agricultural vehicles operating in sensitive environments.
In agreement with previous WBV studies on agricultural tractors, our measurements on the grass-covered test track showed localized amplification within the ISO 2631-1 assessment band (0–80 Hz), with dominant peaks falling in the low-frequency range where whole-body resonance is expected; this is consistent with seat-level measurements reported under standardized ISO setups [
22]. When transmissibility was evaluated in the frequency domain (seat response over floor excitation), peak locations coincided with the numerically identified natural modes of the seat assembly, mirroring literature where dynamic substructuring and FEA-based models trace amplification back to specific suspension and coupling elements [
21]. Moreover, multi-body and FE analyses have shown that seat and cab suspension tuning markedly reshapes the vibration spectrum at the seat—reducing levels above approximately 1.6 Hz while leaving secondary peaks in the 6.3–12.5 Hz range—which matches the trend observed in our data and supports the focus on the 4–8 Hz sensitivity zone [
44]. Recent evaluations that include both diesel and electric tractor configurations confirm that drivetrain type has a limited influence compared to terrain irregularity and suspension setup in defining seat-level WBV exposure [
44,
45]. Finally, studies that link vibration spectra to operational conditions corroborate our finding that track unevenness and travel speed are the main drivers of operator vibration exposure [
46].
The convergence between our experimental spectra and the numerically predicted modes—together with published evidence on ISO-weighted seat responses and suspension dynamics—supports the validity of the proposed model for vibration mitigation analysis in protected horticultural operations [
21,
22,
44,
46].
Quantitatively, the ISO-weighted vibration levels recorded in this study along the vertical z-axis fall within the range typically reported for agricultural tractors operating on moderately uneven terrain, with r.m.s. values between 0.3 and 0.8 m/s
2 at travel speeds below 6 km/h [
22,
46]. Comparable amplitudes were observed by Pochi et al. [
22], who measured seat vibrations of approximately 0.45–0.70 m/s
2 on grass-covered and tilled soil tracks, confirming that low-speed operation combined with soft surfaces leads to dominant low-frequency excitation. Similarly, Barač et al. [
46] indicated that under similar soil and velocity conditions, the vertical component accounts for more than 70% of the total WBV exposure, emphasizing the influence of terrain irregularity on seat transmissibility. These consistencies support the reliability of the present measurements and demonstrate that the obtained acceleration spectra are in line with empirical data from recent field studies.
5. Conclusions
In this study, a comprehensive numerical–experimental approach was employed to evaluate the vibrational behavior of the operator’s seat in a self-propelled electric agricultural tractor operating on an uneven grass-covered surface. The integration of Finite Element Analysis (FEA) with experimental vibration measurements ensured a robust validation of the seat’s structural dynamics under realistic operating conditions.
The modal analysis revealed eight significant natural frequencies within the 0–80 Hz range, among which the dominant modes (2.6–30 Hz) correspond to the frequency band most strongly associated with whole-body resonance and operator discomfort according to ISO 2631-1.
Within this interval, specific frequencies—such as 3.40 Hz (S1) and 2.61 Hz (S2)—showed direct relevance to human sensitivity thresholds, as they overlap with resonance zones linked in the literature to physiological effects including muscular tension, abdominal discomfort, and respiratory strain.
In contrast, vibration components within the 40–80 Hz range exhibited minor influence on comfort and negligible differences between the two analyzed suspension configurations. This finding indicates that optimization strategies should primarily target the low-frequency domain (below 30 Hz), where vibrational effects are most perceptible to the human body.
During the correlation between the FEA-derived modal frequencies and experimental data obtained via triaxial accelerometers mounted on the seat cushion and backrest, a high degree of agreement was achieved. The relative deviation between simulated and measured results remained below 5%, demonstrating that the developed numerical model accurately reproduces the dominant structural modes and dynamic behavior of the seat–operator system. Frequencies predicted by the FEM model that were not confirmed experimentally were identified as hypothetical modes, lacking activation under the tested terrain and speed conditions, and thus having limited practical relevance.
From a quantitative perspective, the experimental analysis indicated that the maximum weighted acceleration measured at the seat cushion did not exceed 0.75 m/s2, while the average transmissibility amplitude between the seat and cabin floor was approximately 0.42, confirming the satisfactory vibration attenuation of the suspension system during low-speed operation on soft terrain.
The S2 suspension configuration exhibited consistently lower natural frequencies than S1, suggesting reduced structural stiffness and improved vibration isolation efficiency.
The substantial decrease in the first modal frequency—from 3.40 Hz (S1) to 2.61 Hz (S2)—has a meaningful impact on the transmitted vibration levels and contributes to enhanced operator comfort.
Furthermore, the analysis of modal participation factors emphasized that the fundamental mode exerts the greatest influence on the overall response of the system, highlighting its critical role in the optimization of seat suspension design for minimizing whole-body vibration exposure.
Overall, the results confirm that the proposed finite element model provides a realistic and validated representation of the dynamic behavior of the operator’s seat in a self-propelled electric tractor. The close agreement between the simulated and experimental outcomes confirms the reliability of the integrated numerical–experimental approach and validates its applicability in the design and optimization of ergonomic solutions aimed at reducing biomechanical risks and improving operator comfort in protected horticultural environments. Furthermore, the findings of this study demonstrate that optimizing the seat suspension design significantly enhances the low-frequency vibration isolation performance of the operator’s seat and the operational stability of the self-propelled electric agricultural tractor under real working conditions, providing a solid scientific foundation for future research and design improvements in agricultural machinery.
The insights gained from this study offer a valuable foundation for future research focused on refining seat suspension systems, incorporating adaptive damping elements, and extending numerical-experimental validation to diverse soil and operational conditions.
In quantitative terms, the experimental vibration measurements revealed that the dominant natural frequencies of the seat–operator system were concentrated in the 4–8 Hz range, corresponding to the critical zone of human body resonance defined by ISO 2631-1. The maximum weighted acceleration values recorded at the seat cushion did not exceed 0.75 m/s2, while the transmissibility amplitude between the seat and cabin floor showed an average ratio of 0.42, confirming efficient attenuation performance under low-speed operation on grass-covered terrain.


