Abstract
In Korea, apple (Malus domestica) is one of the major fruit crops. The area occupied by apple orchards has exhibited a consistent upward trend, increasing from 26,398 hectares in 2003 to 33,313 hectares in 2024, and production reached 460,088 tons in 2024. However, stable apple production is currently threatened by global challenges such as climate change and the decline in rural labor, which hinders timely and efficient orchard management. Under these circumstances, developing automated and data-driven technologies capable of rapidly predicting and responding to apple growth conditions is essential to enhancing management efficiency and ensuring consistent fruit quality and yield stability. In this study, unmanned aerial vehicle (UAV)-based multispectral imagery was acquired and used to analyze time series data. Vegetation indices (VIs) derived from this imagery were then applied to build models predicting fruit diameter and length, which reflect apple size. A total of nine VIs were calculated from the acquired data and utilized as input variables for model development. Based on these variables, four machine learning models—Gaussian process regression (GPR), the K-Nearest Neighbors (KNNs), Random Forest Regression (RFR), and Extreme Gradient Boosting (XGB)—were developed to predict the fruit diameter and length. Both RFR and XGB showed tendencies of overfitting, and although the KNNs demonstrated relatively stable performance (diameter: R2 ≥ 0.82, RMSE ≤ 7.61 mm, RE ≤ 12.53%; length: R2 ≥ 0.76, RMSE ≤ 8.85 mm, RE ≤ 15.08%), this model failed to follow the prediction line consistently. In contrast, GPR maintained stable performance in both the validation and calibration stages (diameter: R2 ≥ 0.79, RMSE ≤ 8.23 mm, RE ≤ 13.56%; length: R2 ≥ 0.72, RMSE ≤ 9.48 mm, RE ≤ 16.16%) and followed the prediction line relatively well, indicating that it is the most suitable model for predicting apple size. These results demonstrate that UAV-based multispectral imagery, combined with machine learning techniques, is an effective tool for predicting the size of apples, and it is expected to contribute to orchard management at different growth stages and improve apple productivity in the future.
1. Introduction
The apple (Malus domestica), rich in dietary fiber and antioxidants, is one of the most extensively cultivated fruits in the Republic of Korea, accounting for a substantial proportion of the national orchard area and fruit production [1,2]. In 2024, the area of apple orchards and production were approximately 33,313 hectares and 460,088 tons, respectively [3]. According to the most recent official statistics (2022), apples represented about 24% of Korea’s total fruit production value, highlighting their significant contribution to the national fruit industry [4]. The harvest quality of apples is largely determined by orchard management during the early stages of fruit development and is closely linked to the fruit diameter and length, which are considered critical growth indicators [5,6].
However, the stable production of high-quality apples is becoming increasingly difficult due to global agricultural challenges such as climate change and the decline in the availability of rural labor [7,8]. Therefore, it is essential to move beyond cultivation practices that are traditionally reliant on farmers’ intuition and experience and develop proactive technologies that rapidly predict information about fruit growth in a time series during cultivation, thereby maintaining and enhancing apple yields and quality at harvest [9]. As such, to establish a stable apple production environment, the utilization of digital data derived from sensors is a key feature of such proactive technologies. Weather and soil sensors enable continuous monitoring of crop growth environments and have been widely applied in decision-making regarding fertilization and irrigation [10]. Satellite imaging sensors have also been effectively utilized to periodically assess crop growth conditions over large areas [11].
Alongside the practical adoption of these various sensing technologies in agricultural fields, research on employing unmanned aerial vehicles (UAVs) for non-destructive crop growth monitoring has been particularly active [12,13]. High-resolution imagery acquired from multispectral sensors mounted on UAVs provides valuable spectral information for assessing crop growth conditions over large areas within a relatively short time, delivering detailed spatial information [14]. The extraction of spectral reflectance data from apple tree canopies, encompassing not only visible wavelengths but also near-infrared bands, enables the calculation of various vegetation indices (VIs), which provide critical information for quantifying and predicting crop growth and physiological characteristics [15,16].
Accordingly, researchers have developed various machine learning-based regression models using VIs to quantitatively predict information pertinent to fruit growth in orchards. One study was conducted to predict citrus yield using a CPSO-XGB model that integrated comprehensive learning particle swarm optimization (CPSO) with the Extreme Gradient Boosting (XGB) algorithm [17], while another study developed a yield prediction model for cherries using the decision tree (DT) algorithm [18]. Among these machine learning regression models, Gaussian process regression (GPR) is a nonparametric method capable of quantifying uncertainty through confidence interval estimation and flexibly modeling complex nonlinear relationships [19,20]. It is also less prone to overfitting and maintains stable performance even with small or imbalanced datasets, making it particularly useful in experimental settings such as precision agriculture [21].
Accordingly, this study aims to develop a model that quantitatively predicts apple diameter and length in a time series using VIs derived from canopy reflectance captured by UAV-based multispectral imagery, thereby contributing to the advancement of stable and sustainable apple orchard production systems.
2. Materials and Methods
2.1. Experimental Subjects and Locations
This study was conducted in 19 apple orchards located in Imha-myeon, Andong, Republic of Korea (36.4716596° N, 128.8936955° E; Figure 1). The study area has a mean annual temperature of 12.8 °C and a mean annual precipitation of 989.47 mm (Table 1). The major soil type in the area is sandy loam with moderate-to-good drainage, and the underlying bedrock mainly consists of Quaternary alluvium (Qa) (Table 1).
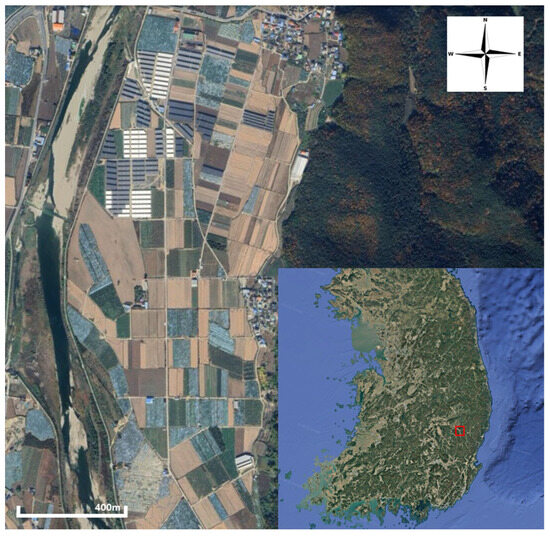
Figure 1.
Location of the study area.

Table 1.
Average climatic characteristics of the study area (2014–2023).
An average of three apple trees per orchard was selected for investigation. The survey included time series data for a total of 74 ‘Fuji’ trees, with some individuals repeatedly measured at different time points. ‘Fuji’ is the most representative apple cultivar in Korea, accounting for approximately 67% of the national apple cultivation area [25]. Due to the strong consumer demand for this variety and its excellent storability, this cultivar has been widely recognized for its reliability and stability, making it particularly suitable to being the primary subject of this study [26,27]. The orchards followed generally similar management practices, including pruning, thinning, fertilization, and pest control, according to standard guidelines for apple cultivation in Korea [5]. The typical tree spacing ranged from 1.2–1.5 m to 3–4 m, depending on the training form, including slender-spindle (1.5 × 4 m), bi-axial (1.2 × 3 m), and multi-axial (1.2–1.5 × 3 m) forms. These comparable management conditions and planting densities helped minimize potential environmental and structural variability among the orchards.
2.2. Multispectral Image Acquisition
Multispectral imagery was acquired using a fixed-wing UAV (TRINITY F90+, Quantum-Systems GmbH, Gilching, Germany) equipped with a multispectral sensor (Altum-PT, MicaSense, Seattle, WA, USA) (Table 2) [28]. Image acquisition was conducted on 20 June, 4 July, and 17 September 2024. The forward and side overlap ratios were both set to 75%, and flights were performed at an altitude of 150 m, collecting multispectral imagery with a spatial resolution of approximately 3.17 cm/pixel ground sampling distance (GSD) [28].
Table 2.
Multispectral image sensor.
Radiometric calibration of the multispectral images was performed using a calibrated reflectance panel (RP06, MicaSense, Seattle, WA, USA), and spectral reflectance correction was subsequently applied based on the reference reflectance values (Table 3) [29].
Table 3.
Standard reflectance panel.
2.3. Apple Data Collection
For the development of the fruit size prediction model, the transverse diameter and longitudinal length of the fruits were designated as the primary target variables in the growth survey [5]. The survey was conducted following standardized field survey procedures established by the Rural Development Administration (RDA) [30], with an average of three apple trees per orchard selected for measurement. For each sampled tree, a single representative fruit was selected from every primary branch, and both the transverse diameter at the widest part and the longitudinal length at the longest part were measured using vernier calipers with a precision of two decimal places, following the RDA guidelines (Figure 2) [30]. The number of primary branches varied among the trees, and all fruit-bearing branches were measured using the same method. The mean transverse diameter and longitudinal length of fruit from across the primary branches were calculated and used as representative values for each tree in subsequent analyses. The survey was scheduled to coincide with UAV image acquisition, ensuring consistency between the field measurements and multispectral imagery. A total of 74 orthomosaic datasets (each composed of five multispectral bands and one panchromatic band) were captured during the three UAV flights corresponding to the field surveys. Specifically, 13 images were captured on 20 June, 23 images on 4 July, and 38 images on 17 September 2024, corresponding to the early, mid, and pre-harvest growth stages, respectively (Table 4) [5]. The image acquisition schedule and the number of images captured for each date are presented in Table 4.
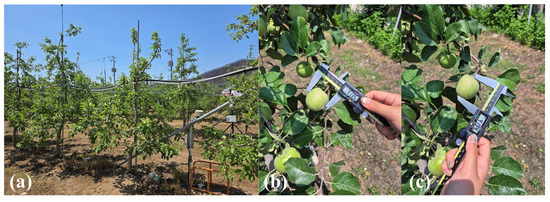
Figure 2.
Field investigation and measurement of apple fruits: (a) apple trees at the experimental site; (b) measurement of fruit transverse diameter using vernier calipers; (c) measurement of fruit longitudinal length using vernier calipers.
Table 4.
Summary of UAV flight missions and the number of orthomosaic images generated for ‘Fuji’ apple orchards.
2.4. Multispectral Image Processing
The acquired images were mosaicked using Pix4Dmapper 4.7.5 (Pix4D S.A., Prilly, Switzerland), in which five multispectral bands (blue, green, red, red edge, and NIR), along with a high-resolution panchromatic band, were co-registered to generate orthomosaic images [31]. The five multispectral bands captured by the Altum-PT sensor had a native spatial resolution of approximately 6.47 cm/pixel, whereas the panchromatic band provided a higher resolution of 3.17 cm/pixel [31,32]. To enhance the spatial detail of the multispectral imagery, the multispectral and panchromatic images were fused through pan-sharpening in QGIS 3.28 (Quantum GIS, Boston, MA, USA) [33]. This process yielded imagery with a final ground sampling distance (GSD) of approximately 3.17 cm/pixel. In addition, the trunk of each apple tree was marked as a point (Figure 3a), and to maintain consistency, a 1 m circular buffer was generated around each trunk point using the buffer function in QGIS to obtain the corresponding spectral images, as illustrated in Figure 3c [34]. Thereafter, the vegetation and background pixels were separated using the normalized difference vegetation index (NDVI) in ENVI 5.6 (Exelis Visual Solutions Inc., Charlottesville, VA, USA) (Figure 3d), and reflectance values for the canopy regions of the sampled apple trees were ultimately extracted in ENVI 5.6 by defining regions of interest (ROIs) for each tree (Figure 3e) [35,36].
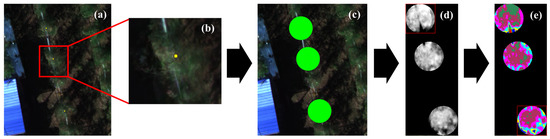
Figure 3.
Tree canopy reflectance extraction process: (a) center points of tree canopies; (b) enlarged view of the central point of the tree canopy; (c) buffer areas with a 1 m diameter; (d) normalized difference vegetation index (NDVI) image; and (e) ROI-based canopy analysis.
Equation (1) was calculated as above.
The reflectance values obtained from the apple tree canopies were used to calculate various vegetation indices (VIs), which enabled the quantitative assessment of the canopy condition and the normalization of spectral variations across the time series. A total of more than 30 VIs, including the NDVI, enhanced vegetation index (EVI), and visible atmospherically resistant index (VARI), were initially calculated from five spectral bands (blue, green, red, red edge, and NIR) to identify suitable predictors for apple fruit growth modeling. Considering the high multicollinearity among the VIs and the potential reduction in the prediction performance for fruit transverse diameter and longitudinal length, nine VIs (Table 5) were selected from the calculated indices and used to develop apple growth prediction models [16].
Table 5.
Selected vegetation indices.
2.5. Statistical Analysis
Statistical analyses were performed using the Python programming language (version 3.10; Python Software Foundation, Wilmington, DE, USA). Outliers in the transverse and longitudinal apple diameter data were identified using box plots and were removed based on the interquartile range (IQR) criterion [46]. Subsequently, the variance inflation factor (VIF) was calculated to assess the multicollinearity among the variables, and VIs with VIF values less than or equal to 10 (VIF ≤ 10) were retained, while those exceeding this threshold were removed [47].
The selected VIs were used as predictors, while the fruit transverse and longitudinal diameters were treated as response variables. Four machine learning regression models were then developed using the same dataset and validation procedure to predict these two traits. The algorithms applied for prediction model development were GPR [48], the K-Nearest Neighbors (KNNs) [49], Random Forest Regression (RFR) [50], and XGB [51]. Each model was trained using a grid search approach to identify the optimal combination of hyperparameters [52].
Model validation was performed using leave-one-out cross-validation (LOOCV), which provides stable performance with small sample sizes. The evaluation metrics included the coefficient of determination (R2), root mean squared error (RMSE), and relative error (RE) [53]. The calculation formulas for these statistical indicators are as follows:
In addition, Shapley Additive Explanation (SHAP) analysis was performed to interpret the influence of each vegetation index on the model predictions. SHAP analysis quantifies the contribution of each variable to a model’s predictions, providing an effective means of interpreting variable importance [54]. The overall analytical workflow of this study is shown in Figure 4.
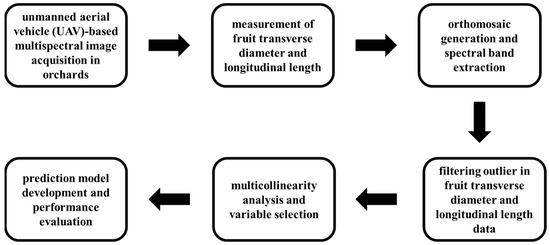
Figure 4.
Flowchart for developing apple fruit size prediction models using UAV-based multispectral imagery.
3. Results and Discussion
3.1. Model Performance Evaluation
For the transverse diameter models, the optimized hyperparameters were set as follows [52]: for GPR, α = 0.01 and kernel = 12 × DotProduct (σ0 = 1); for the KNNs, n_neighbors = 6; for RFR, n_estimators = 20; and for XGB, α = 10 and learning_rate = 0.1. For the longitudinal length models, the hyperparameter configurations were α = 0.01 and kernel = 12 × DotProduct (σ0 = 1) for GPR, n_neighbors = 9 for the KNNs, n_estimators = 10 for RFR, and α = 10 and learning_rate = 0.1 for XGB.
The calibration and validation performance results achieved by the models are presented in Table 6 and Figure 5 for the fruit transverse diameter and in Table 7 and Figure 6 for the fruit longitudinal length. For the fruit transverse diameter, both RFR and XGB achieved strong calibration performance with R2 ≥ 0.94, RMSE ≤ 4.34 mm, and RE ≤ 7.15%. However, during validation, their performance declined, resulting in R2 ≤ 0.73, whereas their RMSE increased to ≥9.36 mm and their RE increased to ≥15.42%, indicating a clear tendency toward overfitting [55]. Similar tendencies of ensemble tree-based models to exhibit unstable generalization under limited or imbalanced training data have been reported in the remote sensing literature, where Random Forests—although generally considered robust against overfitting due to ensemble averaging—have also shown performance degradation when sample sizes are small, spatial autocorrelation is pronounced, or class imbalance occurs [56]. In relative terms, the KNNs exhibited superior performance, achieving R2 = 0.87, RMSE = 6.56 mm, and RE = 10.80% during calibration and maintaining similar values of R2 = 0.82, RMSE = 7.61 mm, and RE = 12.53% during validation. The KNNs, therefore, showed the highest overall predictive accuracy among the models evaluated here.
Table 6.
Comparison of prediction performance for fruit diameter using different regression models based on vegetation indices.
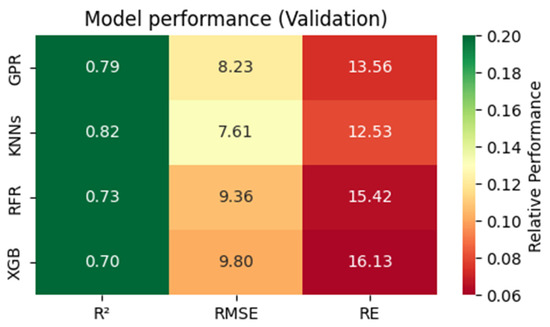
Figure 5.
Heatmap visualization of the relative performance metrics (R2, RMSE, and RE) for fruit diameter prediction among the four regression models.
Table 7.
Comparison of prediction performance for fruit length using different regression models based on vegetation indices.
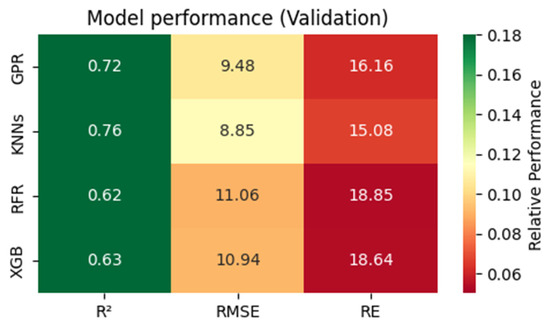
Figure 6.
Heatmap visualization of the relative performance metrics (R2, RMSE, and RE) for fruit length prediction among the four regression models.
Meanwhile, GPR achieved R2 = 0.82, RMSE = 7.61 mm, and RE = 12.53% during calibration and R2 = 0.79, RMSE = 8.23 mm, and RE = 13.56% during validation. Although these values represented the lowest performance metrics among the four models, GPR consistently maintained stable performance across both calibration and validation, suggesting superior model robustness and generalization capabilities. Consistent with prior UAV-based hyperspectral applications, GPR has been shown to deliver stable and reproducible predictions even with limited or unbalanced datasets. For example, in a comparable apple tree study, the GPR model produced determination coefficients in the range of approximately 0.7 for calibration and 0.6 for validation using only nine selected NIR bands, exhibiting accuracy comparable to full-spectrum models while maintaining computational efficiency [57]. In the present study, the GPR model also achieved slightly higher predictive reliability (R2 ≥ 0.79) despite the smaller dataset, further confirming its robustness and adaptability for multispectral modeling under orchard-scale conditions.
For the longitudinal length of fruits, all four models exhibited patterns broadly consistent with those observed for the transverse diameter, although the overall validation performance was slightly lower. Both RFR and XGB achieved strong calibration performance, with R2 ≥ 0.95, RMSE ≤ 4.15 mm, and RE ≤ 7.07%; however, during validation, their performance declined sharply, with R2 ≤ 0.63, while their RMSE increased to ≥10.94 mm and their RE increased to ≥18.64%, indicating a pronounced tendency toward overfitting. This decline likely stems from the models’ limited ability to generalize when trained on small-scale datasets characterized by complex canopy geometry and substantial intra-fruit spectral variability. Such variability arises from structural heterogeneity within the canopy—driven by differences in leaf area, foliage clumping, and canopy arrangement—which has been shown to increase reflectance variability and consequently reduce model stability in vegetation studies [58,59]. The KNNs achieved R2 = 0.80, RMSE = 8.01 mm, and RE = 13.65% during calibration and R2 = 0.76, RMSE = 8.85 mm, and RE = 15.08% during validation. Finally, GPR achieved R2 = 0.76, RMSE = 8.78 mm, and RE = 14.97% during calibration and R2 = 0.72, RMSE = 9.48 mm, and RE = 16.16% during validation. For the longitudinal length of fruits, both GPR and the KNNs maintained stable performance across the calibration and validation phases. Overall, the consistent performance trends across both traits further confirm the robustness and adaptability of the GPR model for orchard-scale fruit size prediction under limited sample conditions, while KNNs also exhibited relatively stable predictive performance.
Figure 7 illustrates the fitted regression lines for the GPR and KNNs prediction models. Regarding the KNNs models for fruit transverse diameter (Figure 7b) and longitudinal length (Figure 7d), the scatter plots showed horizontal clustering within certain fruit size ranges and a failure to follow the fitted regression line. In contrast, the GPR models for the diameter (Figure 7a) and length (Figure 7c) generally followed the fitted regression line across all ranges. Considering the potential risk of overfitting, both the numerical prediction metrics and the distribution patterns in the fitted plots were evaluated.
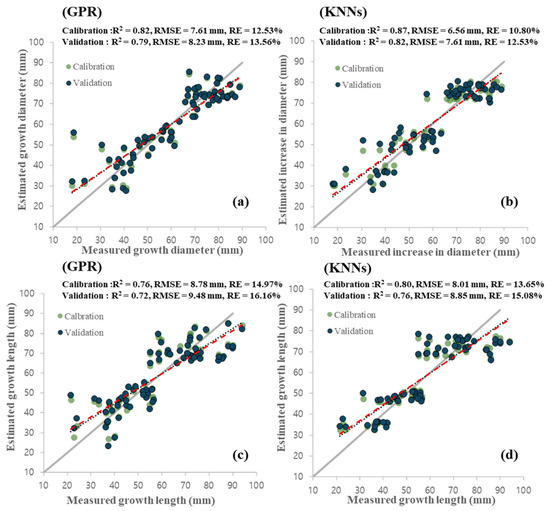
Figure 7.
Linear relationship between estimated and measured growth metrics and performance of Gaussian process regression (GPR) and K-Nearest Neighbors (KNNs) models for predicting apple fruit diameter and length: (a) GPR performance for diameter, (b) KNNs performance for diameter, (c) GPR performance for length, (d) KNNs performance for length.
Figure 8 compares the measured and predicted values obtained from the validation dataset for the GPR and KNNs models in predicting fruit diameter and length. Specifically, Figure 8a,b represent the transverse diameter predictions from the GPR and KNNs models, respectively, while Figure 8c,d illustrate the longitudinal length predictions. Both models successfully captured the overall growth trend of the measured values; however, the GPR model exhibited smoother fluctuations and closer alignment with the measured data compared with the KNNs model. These results indicate that GPR achieved more stable and consistent predictive performance across the validation samples. Based on these findings, GPR was considered the most suitable model for predicting both the transverse diameter and longitudinal length of apples, and subsequent model interpretation therefore centered on the GPR outcomes.
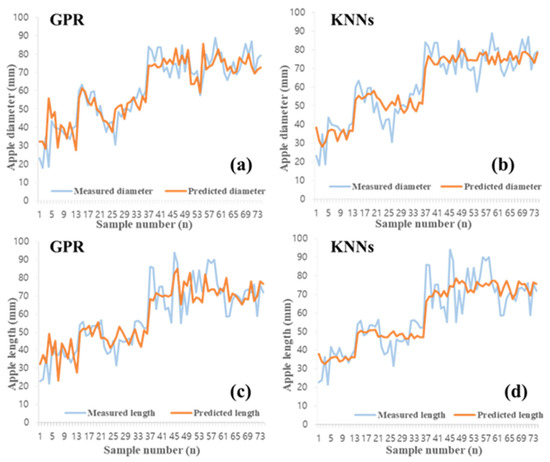
Figure 8.
Comparison of measured and predicted values between the Gaussian process regression (GPR) and K-Nearest Neighbors (KNNs) models using the validation dataset: (a) GPR model for fruit diameter, (b) KNNs model for fruit diameter, (c) GPR model for fruit length, and (d) KNNs model for fruit length.
Prior UAV-based or hyperspectral research on apple orchards focused primarily on nutrient estimation, canopy characterization, or fruit yield prediction, rather than continuous fruit size modeling. For instance, one UAV-based hyperspectral study on apple orchards achieved R2 values of 0.85–0.90 for carbon and chlorophyll estimation, while other macronutrients such as phosphorus, potassium, and calcium yielded R2 values ranging from 0.42 to 0.70 [13]. Another UAV-based apple yield study reported R2 values of 0.86 for calibration and 0.82 for validation using integrated spectral and structural features [12]. Beyond apples, UAV-based models for citrus yield prediction demonstrated calibration and validation R2 values of 0.91 and 0.87, respectively [17], while one study on cherry trees reported R2 = 0.81 for yield prediction and R2 = 0.79 for tree water status estimation under orchard conditions [18].
In contrast, the present study targeted continuous quantitative traits—apple fruit diameter and length—under UAV-based multispectral imaging conditions, where the spectral range is narrower and environmental variability is greater. Despite these constraints, the proposed GPR framework achieved R2 ≥ 0.79 for diameter and R2 ≥ 0.72 for length during validation, indicating stable generalization and robust predictive performance comparable to or exceeding previous UAV-based and hyperspectral studies. Collectively, these results suggest that the GPR-based modeling approach has strong potential as a reliable and generalizable framework for continuous, field-scale fruit size prediction using UAV-mounted multispectral imagery.
3.2. Impact Analysis of Vegetation Indices
For model interpretation, a SHAP analysis was performed on the GPR models that demonstrated superior generalization performance for both the fruit transverse diameter and longitudinal length (Figure 9). The results revealed that a few indices accounted for more than half of the total contributions to each model’s performance, indicating their role as key variables. Accordingly, the interpretation was centered on the indices with the greatest influence on the fruit size predictions.
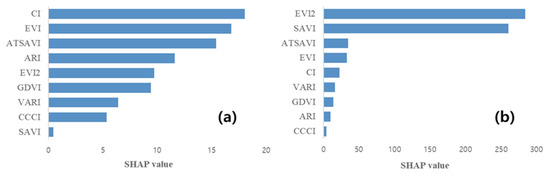
Figure 9.
Shapley additive explanation (SHAP) values for the Gaussian process regression model when predicting (a) the transverse diameter and (b) the longitudinal length of apples.
In the GPR model predicting transverse diameter (Figure 9a), the coloration index (CI), EVI, and adjusted transformed soil-adjusted vegetation index (ATSAVI) emerged as the most influential VIs affecting the predictions. The CI, an RGB-based index, is calculated by normalizing the difference in the reflectance between the red and blue bands using the red band as a reference. During fruit maturation, anthocyanin accumulation induces strong absorption in the blue band, resulting in lower reflectance than that in the red band [40,60], and this spectral behavior has been further supported by recent findings showing that the CI is strongly correlated with anthocyanin accumulation and serves as a reliable indicator of apple skin pigmentation during ripening [40]. Consequently, the increase in the CI values was interpreted as a key contributor to the model’s improved prediction performance. Another index, the EVI, is highly sensitive to the leaf area and the canopy’s structural characteristics, thereby reflecting the canopy’s density and photosynthetic capacity, which are closely associated with the prediction of the transverse diameter of fruits [41]. The ATSAVI is an index designed to correct for soil background effects, enabling a more accurate estimation of vegetation’s actual reflectance properties [38]. Since soil background factors significantly influence VIs [44], this correction is particularly important when calculating VIs for apple trees, whose canopy structures undergo continuous changes during the growing season [61]. As leaves senesce, the likelihood of mixed pixels containing both vegetation and soil increases, suggesting that the background correction provided by the ATSAVI contributed substantially to enhancing the model’s prediction performance.
In the GPR model for longitudinal length (Figure 9b), the two-band enhanced vegetation index (EVI2) and the soil-adjusted vegetation index (SAVI) emerged as the most influential VIs. The EVI2 exhibits similar characteristics to the EVI, despite excluding the blue band, and has been effectively applied under various vegetation density conditions [42]. Moreover, by eliminating the blue band, the EVI2 reduces atmospheric interference and maintains stability with fluctuations of only ±0.02, as reported in previous studies [42]. The blue band is particularly sensitive to atmospheric scattering and the external environmental conditions [62]. By relying solely on the near-infrared and red bands, the EVI2 minimizes atmospheric effects and multispectral sensor noise, thereby providing a more stable representation of canopy variation and physiological factors related to the fruit longitudinal length in apple trees. The SAVI corrects for soil background effects and enables stable extraction of vegetation signals in pixels with a low canopy density or in instances of soil mixing [44]. Similarly to the ATSAVI, its role becomes particularly important when the likelihood of mixed vegetation–soil pixels increases, thereby enhancing the reliability of the prediction model.
The SHAP analysis identified the CI, EVI, and ATSAVI as the key variables affecting the model’s transverse diameter prediction performance, whereas the EVI2 and SAVI were the most influential indices in longitudinal length prediction. These findings suggest that the prediction processes of the two models were governed by distinct growth characteristics and physiological drivers. Transverse diameter prediction was more strongly influenced by external and structural factors such as the chlorophyll content and canopy architecture, whereas longitudinal length prediction appeared to be more sensitive to intrinsic factors, including varietal traits and genetic characteristics.
Therefore, the proposed GPR-based modeling framework holds strong potential for broader applications in precision horticulture. The stable predictive performance of GPR under limited sample conditions and its ability to capture nonlinear relationships between canopy reflectance and fruit traits indicate that similar approaches could be effectively applied to other perennial fruit species—such as pears, grapes, and citruses—that exhibit comparable canopy spectral variability and complex morphological characteristics. For instance, UAV-based multispectral and hyperspectral imaging have been successfully employed to estimate berry size and yield components in grapevines [63] and fruit maturity and yield in citrus orchards [64], where spectral–thermal indicators reflected canopy structure, pigment content, and stress conditions—factors analogous to those influencing apple fruit development in this study. By integrating UAV-derived spectral features with soil, meteorological, and management variables, the proposed framework could be further extended to model yield formation, stress responses, and growth dynamics under diverse orchard environments, thereby advancing data-driven precision orchard management.
4. Conclusions
This study developed and compared four machine learning regression models—GPR, KNNs, RFR, and XGB—to predict the transverse diameter and longitudinal length of apples using UAV-mounted multispectral imagery. Among these models, GPR exhibited the highest stability and generalization performance, achieving an R2 ≥ 0.79 for fruit diameter and an R2 ≥ 0.72 for fruit length. Unlike tree-based ensemble models such as RFR and XGB, which showed overfitting tendencies when trained on small datasets with strong correlations among input variables, GPR maintained stable predictive accuracy owing to its nonparametric and probabilistic characteristics. Beyond quantitative accuracy, this study offers analytical insights into the spectral and physiological mechanisms governing apple fruit growth.
SHAP analysis revealed that the CI, EVI, and ATSAVI were key predictors of fruit diameter, reflecting the influence of canopy structure, chlorophyll content, and soil background correction. In contrast, EVI2 and SAVI were the main contributors to fruit length estimation, reflecting the indices’ sensitivity to intrinsic physiological activity and cultivar-specific genetic traits. These findings demonstrate that distinct biophysical factors influence apple size traits and underscore the interpretability of the developed models. In practical terms, the integration of UAV-based multispectral imagery with machine learning models offers a scalable and cost-efficient approach to orchard monitoring. The proposed GPR framework could potentially support decision-making regarding fruit thinning, fertilization scheduling, and harvest planning by enabling the near-real-time estimation of fruit size in future orchard applications. Such a predictive capability can help reduce the dependence on manual labor and improve the uniformity and market value of harvested apples, particularly in regions facing labor shortages.
This study contributes to precision horticulture by suggesting the potential of UAV-sourced multispectral datasets with limited samples for quantitative trait estimation through probabilistic modeling. The proposed methodological framework can be extended to other fruit crops and further combined with hyperspectral, soil, and meteorological datasets to enhance physiological interpretability and model scalability. Future research should focus on validating this model across multiple cultivars, orchard environments, and growing seasons to enhance generalizability. Furthermore, coupling UAV-based spectral data with soil, weather, and management information will allow for integrated modeling of apple growth dynamics under climate variability, thereby advancing data-driven precision orchard management.
Author Contributions
Conceptualization, D.H.A. and Y.S.K.; methodology, D.H.A. and Y.S.K.; software, Y.S.K.; validation, D.H.A., Y.S.K. and C.S.R.; formal analysis, Y.S.K.; investigation, C.H.P. and G.I.J.; resources, C.H.P.; data curation, C.H.P. and G.I.J.; writing—original draft preparation, D.H.A.; writing—review and editing, Y.S.K. and C.S.R.; visualization, D.H.A. and Y.S.K.; supervision, Y.S.K. and C.S.R.; project administration, Y.S.K. and C.S.R.; funding acquisition, C.S.R. All authors have read and agreed to the published version of the manuscript.
Funding
This study was funded by the Rural Development Administration (Project name: Developing quantity prediction models based on field data collection for three types of field crops (garlic, peppers, and apples) and standardizing metadata for key field crop growth information, Project Number: RS-2024-00398963).
Data Availability Statement
Data are contained within the article.
Acknowledgments
The authors appreciate all the staff who helped with this study at the Korea Institute of Future Agriculture, the Republic of Korea.
Conflicts of Interest
The authors declare no conflicts of interest.
References
- Hyson, D.A. A comprehensive review of apples and apple components and their relationship to human health. Adv. Nutr. 2011, 2, 408–420. [Google Scholar] [CrossRef] [PubMed]
- Lee, H.-A.; Choi, D.-W.; Lim, C.-R. A study on changes in productivity of apple farmers. J. Korea Acad. Ind. Coop. Soc. 2022, 23, 496–504. [Google Scholar] [CrossRef]
- Statistics Korea (KOSTAT). Results of the 2024 Autumn Production Survey for Cabbage, Radish, Soybean, Apple, and Pear; KOSTAT: Daejeon, Republic of Korea, 2024. (In Korean)
- Korea Rural Economic Institute (KREI). Agricultural Perspective 2024: Agriculture and Rural Areas in an Era of Uncertainty: Challenges and Future Prospects; KREI: Seoul, Republic of Korea, 2024; pp. 507–526. Available online: https://repository.krei.re.kr/bitstream/2018.oak/30725/1/E04-2024-2.pdf (accessed on 15 October 2025). (In Korean)
- Rural Development Administration (RDA). Apple Cultivation—Agricultural Technology Guide, 5th rev. ed.; Rural Development Administration: Jeollabuk-do, Republic of Korea, 2019.
- Li, M.; Chen, M.; Zhang, Y.; Fu, C.; Xing, B.; Li, W.; Qian, J.; Li, S.; Wang, H.; Fan, X.; et al. Apple fruit diameter and length estimation by using the thermal and sunshine hours approach and its application to the digital orchard management information system. PLoS ONE 2015, 10, e0120124. [Google Scholar] [CrossRef]
- Fang, P.; Wang, Y.; Abler, D.; Lin, G. Effects of aging on labor-intensive crop production from the perspectives of landform and life cycle labor supply: Evidence from Chinese apple growers. Agriculture 2023, 13, 1523. [Google Scholar] [CrossRef]
- Kim, S.; Heo, I.; Lee, S. Impacts of temperature rising on changing of cultivation area of apple in Korea. J. Korean Assoc. Reg. Geogr. 2010, 16, 201–215. Available online: https://www.koreascience.kr/article/JAKO201030853092608.page (accessed on 26 August 2025).
- Kaack, K.; Pedersen, H.L. Prediction of diameter, weight and quality of apple fruit (Malus domestica Borkh.) cv. ‘Elstar’ using climatic variables and their interactions. Eur. J. Hortic. Sci. 2010, 75, 60–70. [Google Scholar] [CrossRef]
- Jiang, X.; He, L. Investigation of effective irrigation strategies for high-density apple orchards in Pennsylvania. Agronomy 2021, 11, 732. [Google Scholar] [CrossRef]
- Yan, Y.; Tang, X.; Zhu, X.; Yu, X. Optimal time phase identification for apple orchard land recognition and spatial analysis using multitemporal Sentinel-2 images and random forest classification. Sustainability 2023, 15, 4695. [Google Scholar] [CrossRef]
- Chen, R.; Zhang, C.; Xu, B.; Zhu, Y.; Zhao, F.; Han, S.; Yang, G.; Yang, H. Predicting individual apple tree yield using UAV multi-source remote sensing data and ensemble learning. Comput. Electron. Agric. 2022, 201, 107275. [Google Scholar] [CrossRef]
- Kang, Y.S.; Ryu, C.S.; Cho, J.G.; Park, K.S. Predicting apple tree macronutrients using unmanned aerial vehicle-based hyperspectral imagery to manage apple orchard nutrients. Drones 2024, 8, 369. [Google Scholar] [CrossRef]
- Jemaa, H.; Bouachir, W.; Leblon, B.; LaRocque, A.; Haddadi, A.; Bouguila, N. UAV-based computer vision system for orchard apple tree detection and health assessment. Remote Sens. 2023, 15, 3558. [Google Scholar] [CrossRef]
- Candiago, S.; Remondino, F.; De Giglio, M.; Dubbini, M.; Gattelli, M. Evaluating multispectral images and vegetation indices for precision farming applications from UAV images. Remote Sens. 2015, 7, 4026–4047. [Google Scholar] [CrossRef]
- Xue, J.; Su, B. Significant remote sensing vegetation indices: A review of developments and applications. J. Sens. 2017, 2017, 1353691. [Google Scholar] [CrossRef]
- Xu, W.; Liu, X.; Dong, J.; Tan, J.; Wang, X.; Wang, X.; Wu, L. Improvement of citrus yield prediction using UAV multispectral images and the CPSO algorithm. Agronomy 2025, 15, 171. [Google Scholar] [CrossRef]
- Blanco, V.; Blaya-Ros, P.J.; Castillo, C.; Soto-Vallés, F.; Torres-Sánchez, R.; Domingo, R. Potential of UAS-based remote sensing for estimating tree water status and yield in sweet cherry trees. Remote Sens. 2020, 12, 2359. [Google Scholar] [CrossRef]
- Rasmussen, C.E.; Williams, C.K.I. Gaussian Processes for Machine Learning; MIT Press: Cambridge, MA, USA, 2006; Available online: https://www.gaussianprocess.org/gpml/ (accessed on 18 July 2025).
- Schulz, E.; Speekenbrink, M.; Krause, A. A tutorial on Gaussian process regression: Modelling, exploring, and exploiting functions. J. Math. Psychol. 2018, 85, 1–16. [Google Scholar] [CrossRef]
- Arefi, A.; Sturm, B.; von Gersdorff, G.; Nasirahmadi, A.; Hensel, O. Vis–NIR hyperspectral imaging along with Gaussian process regression to monitor quality attributes of apple slices during drying. LWT 2021, 152, 112297. [Google Scholar] [CrossRef]
- Korea Meteorological Administration (KMA). Daily Precipitation and Temperature Data. KMA Open Data Portal. Available online: https://data.kma.go.kr/stcs/grnd/grndRnList.do?pgmNo=69 (accessed on 16 October 2025). (In Korean).
- Rural Development Administration (RDA). Soil Environment Information System (Heuktoram). Available online: https://soil.rda.go.kr (accessed on 16 October 2025). (In Korean).
- Korea Institute of Geoscience and Mineral Resources (KIGAM). Geo Big Data Open Platform: Geological Map of Andong Region (1:250,000). Available online: https://data.kigam.re.kr/mgeo (accessed on 16 October 2025). (In Korean).
- Korea Rural Economic Institute (KREI). Agricultural Perspective 2023: Apple Industry Trends and Statistics; KREI: Seoul, Republic of Korea, 2023; pp. 543–544. Available online: https://repository.krei.re.kr/bitstream/2018.oak/29527/1/E04-2023-2.pdf (accessed on 27 August 2025). (In Korean)
- United States Department of Agriculture Foreign Agricultural Service (USDAFAS). 2021 Korea Apple Update, 2.0.2.1; GAINReport No KS2021-0029; USDAFAS: Washington, DC, USA, 2021. Available online: https://gain.fas.usda.gov (accessed on 27 August 2025).
- Varela, P.; Salvador, A.; Fiszman, S. Shelf-life estimation of ‘Fuji’ apples: Sensory characteristics and consumer acceptability. Postharvest Biol. Technol. 2005, 38, 18–24. [Google Scholar] [CrossRef]
- Simpson, J.E.; Holman, F.; Nieto, H.; Voelksch, I.; Mauder, M.; Klatt, J.; Fiener, P.; Kaplan, J.O. High Spatial and Temporal Resolution Energy Flux Mapping of Different Land Covers Using an Off-the-Shelf Unmanned Aerial System. Remote Sens. 2021, 13, 1286. [Google Scholar] [CrossRef]
- MicaSense Inc. MicaSense Image Processing Tutorials; MicaSense Inc.: Seattle, WA, USA, 2019. [Google Scholar]
- Rural Development Administration (RDA). Standard Manual for Crop Growth Survey; RDA: Jeonju, Republic of Korea, 2014.
- Richardson, C.; Sullivan, A.T.; Berube, F.B.; Jabari, S.; Moore, T. Towards Urban Heat Loss Modeling Using Building Digital Twin. Int. Arch. Photogramm. Remote Sens. Spatial Inf. Sci. 2025, XLVIII-M-8-2025, 35–42. [Google Scholar] [CrossRef]
- MicaSense. Altum-PT Integration Guide; MicaSense, Inc.: Seattle, WA, USA, 2024; Available online: https://support.micasense.com (accessed on 17 October 2025).
- Alcaras, E.; Parente, C.; Vallario, A. Automation of Pan-Sharpening Methods for Pléiades Images Using GIS Basic Functions. Remote Sens. 2021, 13, 1550. [Google Scholar] [CrossRef]
- Nowak, M.M.; Skowroński, J.; Słupecka, K.; Nowosad, J. Introducing tree belt designer—A QGIS plugin for designing agroforestry systems in terms of potential insolation. Ecol. Inform. 2023, 75, 102012. [Google Scholar] [CrossRef]
- Kang, Y.-S.; Kim, S.-H.; Kang, J.-G.; Hong, Y.-K.; Sarkar, T.K.; Ryu, C.-S. Estimation of leaf dry mass and nitrogen content for soybean using multi-spectral camera mounted on unmanned aerial vehicle. J. Agric. Life Sci. 2016, 50, 183–190. (In Korean) [Google Scholar] [CrossRef]
- Rouse, J.W., Jr.; Haas, R.H.; Schell, J.A.; Deering, D.W. Monitoring Vegetation Systems in the Great Plains with ERTS. In Third ERTS Symposium; NASA SP-351; NASA: Washington, DC, USA, 1973; Volume 1, pp. 309–317. [Google Scholar]
- Gitelson, A.A.; Merzlyak, M.N.; Zur, Y.; Stark, R.; Gritz, U. Non-destructive and remote sensing techniques for estimation of vegetation status. In Proceedings of the 3rd European Conference on Precision Agriculture, Montpellier, France, 18–20 June 2001; Grenier, G., Blackmore, S., Eds.; University of Nebraska–Lincoln: Lincoln, NE, USA, 2001; pp. 205–210. Available online: https://digitalcommons.unl.edu/natrespapers/273 (accessed on 2 August 2025).
- Baret, F.; Guyot, G. Potentials and limits of vegetation indices for LAI and APAR assessment. Remote Sens. Environ. 1991, 35, 161–173. [Google Scholar] [CrossRef]
- El-Shikha, D.M.; Barnes, E.M.; Clarke, T.R.; Hunsaker, D.J.; Haberland, J.A.; Pinter, P.J., Jr.; Waller, P.M.; Thompson, T.L. Remote sensing of cotton nitrogen status using the canopy chlorophyll content index (CCCI). Trans. Am. Soc. Agric. Biol. Eng. 2008, 51, 73–82. [Google Scholar] [CrossRef]
- Montanaro, G.; Petrozza, A.; Rustioni, L.; Cellini, F.; Nuzzo, V. Phenotyping key fruit quality traits in olive using RGB images and back propagation neural networks. Plant Phenomics 2023, 5, 61. [Google Scholar] [CrossRef]
- Huete, A.; Didan, K.; Miura, T.; Rodriguez, E.P.; Gao, X.; Ferreira, L.G. Overview of the radiometric and biophysical performance of the MODIS vegetation indices. Remote Sens. Environ. 2002, 83, 195–213. [Google Scholar] [CrossRef]
- Jiang, Z.; Huete, A.R.; Didan, K.; Miura, T. Development of a two-band enhanced vegetation index without a blue band. Remote Sens. Environ. 2008, 112, 3833–3845. [Google Scholar] [CrossRef]
- Sripada, R.P.; Heiniger, R.W.; White, J.G.; Meijer, A.D. Aerial color infrared photography for determining early in-season nitrogen requirements in corn. Agron. J. 2006, 98, 968–977. [Google Scholar] [CrossRef]
- Huete, A.R. A soil-adjusted vegetation index (SAVI). Remote Sens. Environ. 1988, 25, 295–309. [Google Scholar] [CrossRef]
- Gitelson, A.A.; Kaufman, Y.J.; Stark, R.; Rundquist, D. Novel algorithms for remote estimation of vegetation fraction. Remote Sens. Environ. 2002, 80, 76–87. [Google Scholar] [CrossRef]
- Yang, J.; Rahardja, S.; Fränti, P. Outlier detection: How to threshold outlier scores? In Proceedings of the International Conference on Artificial Intelligence, Information Processing and Cloud Computing (AIIPCC ’19), Sanya, China, 19–21 December 2019; pp. 1–6. [Google Scholar] [CrossRef]
- Belsley, D.A.; Kuh, E.; Welsch, R.E. Regression Diagnostics: Identifying Influential Data and Sources of Collinearity; Wiley: New York, NY, USA, 1980; p. 292. [Google Scholar] [CrossRef]
- Williams, C.K.I.; Rasmussen, C.E. Gaussian Processes for Regression. In Proceedings of the Advances in Neural Information Processing Systems 8 (NeurIPS 1995), Denver, CO, USA, 27–30 November 1995; Touretzky, D.S., Mozer, M.C., Hasselmo, M.E., Eds.; MIT Press: Cambridge, MA, USA, 1996; pp. 514–520. Available online: https://proceedings.neurips.cc/paper/1048-gaussian-processes-for-regression.pdf (accessed on 18 July 2025).
- Laaksonen, J.; Oja, E. Classification with learning k-nearest neighbors. In Proceedings of the International Conference on Neural Networks (ICNN ’96), Washington, DC, USA, 3–6 June 1996; pp. 1480–1483. [Google Scholar] [CrossRef]
- Segal, M.R. Machine Learning Benchmarks and Random Forest Regression. University of California, San Francisco, Center for Bioinformatics and Molecular Biostatistics. 2004. Available online: https://escholarship.org/uc/item/35x3v9t4 (accessed on 6 August 2025).
- Chen, T.; Guestrin, C. XGBoost: A scalable tree boosting system. In Proceedings of the 22nd ACM SIGKDD International Conference on Knowledge Discovery and Data Mining (KDD ’16), San Francisco, CA, USA, 13–17 August 2016; pp. 785–794. [Google Scholar] [CrossRef]
- Bergstra, J.; Bengio, Y. Random search for hyper-parameter optimization. J. Mach. Learn. Res. 2012, 13, 281–305. [Google Scholar]
- James, G.; Witten, D.; Hastie, T.; Tibshirani, R. An Introduction to Statistical Learning: With Applications in R; Springer: Berlin/Heidelberg, Germany, 2013. [Google Scholar] [CrossRef]
- Lundberg, S.M.; Lee, S.-I. A unified approach to interpreting model predictions. In Proceedings of the Advances in Neural Information Processing Systems 30 (NeurIPS 2017), Long Beach, CA, USA, 4–9 December 2017; MIT Press: Cambridge, MA, USA, 2017; pp. 4765–4774. [Google Scholar] [CrossRef]
- Hastie, T.; Tibshirani, R.; Friedman, J. The Elements of Statistical Learning: Data Mining, Inference, and Prediction, 2nd ed.; Springer: New York, NY, USA, 2009; ISBN 978-0-387-84857-0. [Google Scholar]
- Belgiu, M.; Drăguț, L. Random forest in remote sensing: A review of applications and future directions. ISPRS J. Photogramm. Remote Sens. 2016, 114, 24–31. [Google Scholar] [CrossRef]
- Kang, Y.-S.; Park, K.-S.; Kim, E.-R.; Jeong, J.-C.; Ryu, C.-S. Estimation of the Total Nonstructural Carbohydrate Concentration in Apple Trees Using Hyperspectral Imaging. Horticulturae 2023, 9, 967. [Google Scholar] [CrossRef]
- Asner, G.P. Biophysical and biochemical sources of variability in canopy reflectance. Remote Sens. Environ. 1998, 64, 234–253. [Google Scholar] [CrossRef]
- Dai, J.; König, M.; Jamalinia, E.; Hondula, K.L.; Vaughn, N.R.; Heckler, J.; Asner, G.P. Canopy-level spectral variation and classification of diverse crop species with fine spatial resolution imaging spectroscopy. Remote Sens. 2024, 16, 1447. [Google Scholar] [CrossRef]
- Solovchenko, A.; Dorokhov, A.; Shurygin, B.; Nikolenko, A.; Velichko, V.; Smirnov, I.; Khort, D.; Aksenov, A.; Kuzin, A. Linking tissue damage to hyperspectral reflectance for non-invasive monitoring of apple fruit in orchards. Plants 2021, 10, 310. [Google Scholar] [CrossRef]
- Yu, J.; Zhang, Y.; Song, Z.; Jiang, D.; Guo, Y.; Liu, Y.; Chang, Q. Estimating leaf area index in apple orchard by UAV multispectral images with spectral and texture information. Remote Sens. 2024, 16, 3237. [Google Scholar] [CrossRef]
- Zhen, Z.; Chen, S.; Yin, T.; Gastellu-Etchegorry, J.-P. Globally quantitative analysis of the impact of atmosphere and spectral response function on 2-band enhanced vegetation index (EVI2) over Sentinel-2 and Landsat-8. ISPRS J. Photogramm. Remote Sens. 2023, 205, 206–226. [Google Scholar] [CrossRef]
- Jewan, S.Y.Y.; Gautam, D.; Sparkes, D.; Singh, A.; Billa, L.; Cogato, A.; Murchie, E.; Pagay, V. Integrating Hyperspectral, Thermal, and Ground Data with Machine Learning Algorithms Enhances the Prediction of Grapevine Yield and Berry Composition. Remote Sens. 2024, 16, 4539. [Google Scholar] [CrossRef]
- Kwon, S.-H.; Ku, K.B.; Le, A.T.; Han, G.D.; Park, Y.; Kim, J.; Tuan, T.T.; Chung, Y.S.; Mansoor, S. Enhancing Citrus Fruit Yield Investigations through Flight Height Optimization with UAV Imaging. Sci. Rep. 2024, 14, 322. [Google Scholar] [CrossRef] [PubMed]
Disclaimer/Publisher’s Note: The statements, opinions and data contained in all publications are solely those of the individual author(s) and contributor(s) and not of MDPI and/or the editor(s). MDPI and/or the editor(s) disclaim responsibility for any injury to people or property resulting from any ideas, methods, instructions or products referred to in the content. |
© 2025 by the authors. Licensee MDPI, Basel, Switzerland. This article is an open access article distributed under the terms and conditions of the Creative Commons Attribution (CC BY) license (https://creativecommons.org/licenses/by/4.0/).