Article

Estimation of Kcb for Irrigated Melon Using NDVI Obtained Through UAV Imaging in the Brazilian Semiarid Region

by
Jeones Marinho Siqueira
1,
Gertrudes Macário de Oliveira
1,
Pedro Rogerio Giongo
2,
Jose Henrique da Silva Taveira
2,
Edgo Jackson Pinto Santiago
3,
Mário de Miranda Vilas Boas Ramos Leitão
4,
Ligia Borges Marinho
1,
Wagner Martins dos Santos
5,*,
Alexandre Maniçoba da Rosa Ferraz Jardim
6,*,
Thieres George Freire da Silva
5 and
Marcos Vinícius da Silva
7
1
Department of Technology and Social Sciences (DTCS), State University of Bahia (UNEB), Av., R. Edgar Chastinet, s/n—São Geraldo, Juazeiro 48900-000, BA, Brazil
2
Institute of Agricultural Sciences and Sustainability (IACAS), State University of Goiás (UEG), Southwest Campus, Quirinópolis, Goiás 75860-000, GO, Brazil
3
Department of Statistics and Informatics (DEINFO), Federal Rural University of Pernambuco (UFRPE), Rua Dom Manuel de Medeiros, s/n, Dois Irmãos—CEP, Recife 52171-900, PE, Brazil
4
Department of Agricultural and Environmental Engineering, University of Vale do São Francisco (UNIVASF), Av. Antônio C. Magalhães, 510, Country Club, Juazeiro 48902-300, BA, Brazil
5
Department of Agricultural Engineering, Federal Rural University of Pernambuco, Recife 52171-900, PE, Brazil
6
Institute of Biosciences, São Paulo State University (UNESP), Rio Claro 13506-900, SP, Brazil
7
Chapadinha Science Center, Federal University of Maranhão, Chapadinha 65500-000, MA, Brazil
*
Authors to whom correspondence should be addressed.
AgriEngineering 2025, 7(10), 340; https://doi.org/10.3390/agriengineering7100340
Submission received: 26 June 2025 / Revised: 20 September 2025 / Accepted: 25 September 2025 / Published: 10 October 2025

Abstract

In Northeast Brazil, climatic factors and technology synergistically enhance melon productivity and fruit quality. However, the region requires further research on the efficient use of water resources, particularly in determining the crop coefficient (Kc), which comprises the evaporation coefficient (Ke) and the transpiration coefficient (Kcb). Air temperature affects crop growth and development, altering the spectral response and the Kcb. However, the direct influence of air temperature on Kcb and spectral response remains underemphasized. This study employed unmanned aerial vehicle (UAV) with RGB and Red-Green-NIR sensors imagery to extract biophysical parameters for improved water management in melon cultivation in semiarid northern Bahia. Field experiments were conducted during two distinct periods: warm (October–December 2019) and cool (June–August 2020). The ‘Gladial’ and ‘Cantaloupe’ cultivars exhibited higher Kcb values during the warm season (2.753–3.450 and 3.087–3.856, respectively) and lower during the cool season (0.815–0.993 and 1.118–1.317). NDVI-based estimates of Kcb showed strong correlations with field data (r > 0.80), confirming its predictive potential. The results demonstrate that UAV-derived NDVI enables reliable estimation of melon Kcb across seasons, supporting its application for evapotranspiration modeling and precision irrigation in the Brazilian semiarid context.

1. Introduction

In Northeast Brazil, favorable climatic conditions combined with technological advances have boosted melon (Cucumis melo L.) productivity and fruit quality, which is home to primary melon production centers. Despite these advantages, there remains a pressing need for research on efficient water resource utilization in agriculture. This is particularly true for determining the crop coefficient (Kc), an essential index for water management. Various studies [1,2,3,4,5] have stressed the necessity of refining water management to boost productivity and ensure resource sustainability for the future [6].
Reliable estimates of crop evapotranspiration, obtained through the appropriate Kc for local climatic conditions, are essential. Although various methods for estimating evapotranspiration have been suggested [7,8], specific information for local conditions and management practices remains limited, especially in semiarid environments where site-specific crop coefficient data are lacking. To estimate the Kc value, [9] presented two components. The first combines the effects of crop transpiration and soil evaporation into a single Kc (simple Kc); the second defines the Kc value (Kc-dual) by considering the effects of crop transpiration separately from soil evaporation, using two coefficients: the crop basal coefficient (Kcb), which refers to plant transpiration, and the evaporation coefficient (Ke), which refers to soil evaporation. Thus, Kc (Kc-dual) is represented by the equation: Kc = Kcb + Ke, this dual approach has gained prominence in precision irrigation due to its ability to distinguish plant and soil water use.
Traditional methods, such as lysimeters, are costly, require technical expertise, and take longer to process Kc data. Alternatively, remote sensing combined with artificial intelligence has shown promise [10,11]. Utilizing UAVs and optical sensors, digital agriculture has enabled the efficient collection of vegetation indices and biophysical parameters, thus facilitating crop monitoring [10,12]. The use of UAVs in agriculture is more dynamic and adaptable to climatic conditions, area size, and the integration of various sensors [13,14].
Remote sensing has proven effective in various applications [15,16,17,18,19,20,21], including pasture coverage assessment [22] and water quality identification [23]. UAV imagery and NDVI show promise for Kc estimation [10,24]. NDVI is a simple and reliable tool that determines the green area coverage and correlates with plant photosynthetic activity and is commonly and easily applied through remote sensing. NDVI as a way of obtaining kcb, combines more precise conditions of the leaf condition of different phenological phases and even the water condition of the crops, thus improving the application of more precise slides regarding water needs.
The NDVI obtained by aerial images is directly related to crop development [25,26]. Considering ways to improve leaf condition and application to water management of melon crops. This study aims to estimate the basal crop coefficient (Kcb) using UAV-derived NDVI, providing a practical tool for water management in melon cultivation under semiarid conditions in northern Bahia.

2. Materials and Methods

The study was conducted in the experimental area of the Department of Technology and Social Sciences (DTCS) at the State University of Bahia (UNEB), in the Juazeiro municipality. The geographic coordinates of the site are 09°24′ 50″ S latitude and 40°30′10″ W longitude, at an altitude of 368 m (Figure 1). Field experiments were conducted from October to December 2019 (the warm season) and from June to August 2020 (the cool season). The regional climate is classified as semiarid, type BSwh’, according to the Köppen–Geiger classification system [27].
Two melon (Cucumis melo L.) cultivars, namely ‘Gladial’ and Caribbean Gold (‘Cantaloupe’), were selected for the experiment. These were grown in beds with a spacing of 2.0 m between rows and 0.40 m between plants. The cultivation beds were covered with mulch to conserve moisture, and drip irrigation was employed. The soil texture of the experimental area was sandy loam. A drip irrigation system was installed on raised beds, with emitters spaced at 0.20 m intervals, delivering 1.75 L h−1 at 1.0 kgf cm−2 pressure. The water distribution uniformity test was conducted using the methodology of [28], presenting a distribution uniformity coefficient of 90%.
Irrigation was performed daily, using crop evapotranspiration values (ETc, mm day−1) obtained through water balance drainage lysimeter evapotranspiration meters. Reference evapotranspiration (ETo) was estimated using the Penman-Monteith method, following FAO guidelines [9]. Data for both ETc and ETo were collected from equipment installed in the experimental area.
The experimental design used a randomized block design (RBD) in a split-plot arrangement. The main plots comprised three distinct irrigation depths: T1, which relied on daily crop ETc measurements from constant water table evapotranspiration meters situated at the experimental area’s center; T2, where ETc was calculated using the Kc and ETo as estimated by the Penman-Monteith method (FAO-56); and T3, which determined ETc using Kc and ETo estimated by the Hargreaves-Samani method [29]. For treatments T2 and T3, the Kc values proposed by [30] were adopted.
The subplots comprised two melon cultivars, ‘Gladial’ and Caribbean Gold (‘Cantaloupe’), each with four replications, totaling 24 experimental units.
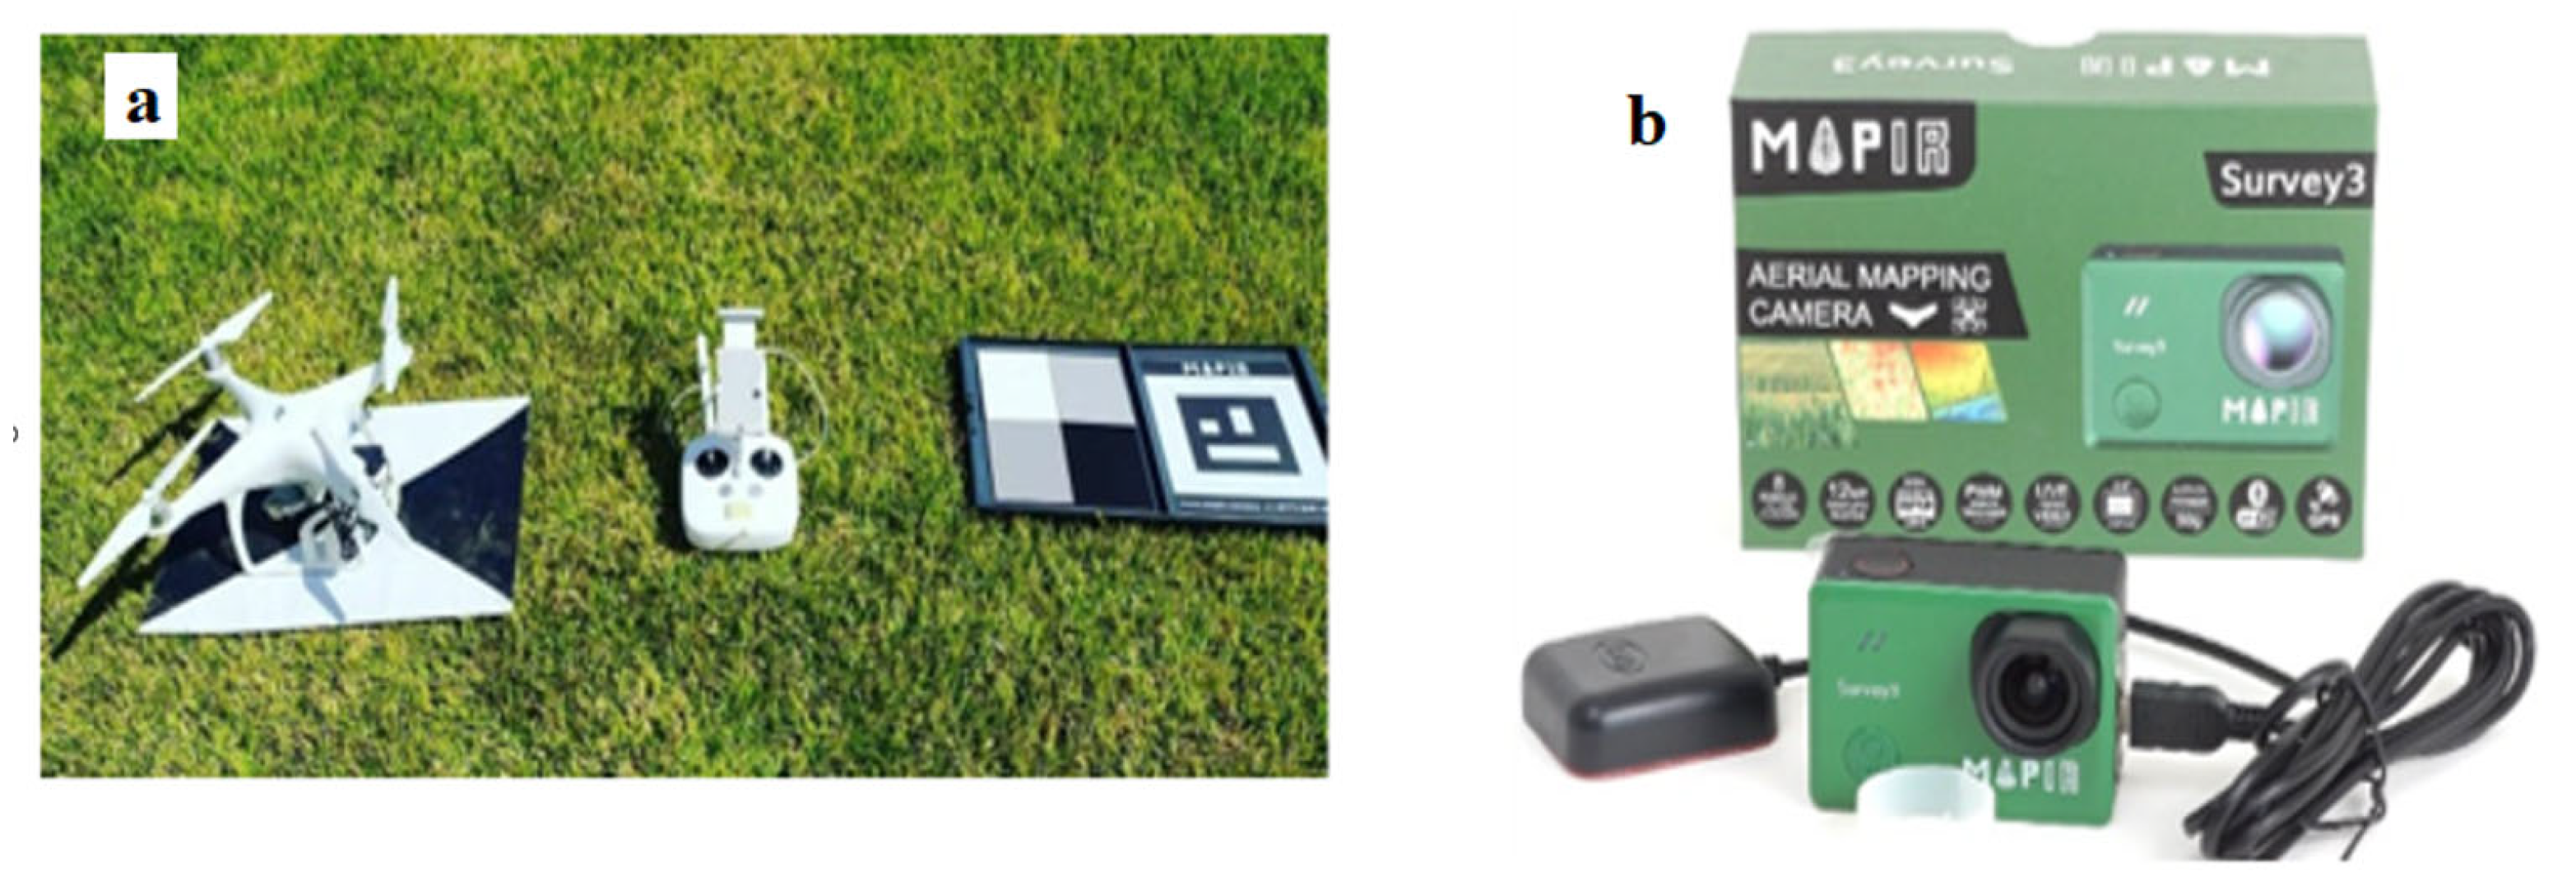
Images were captured using a Phantom 4 UAV (Figure 2a) equipped with a Mapir Survey3 multispectral sensor (Figure 2b). UAV flights occurred between 10:00 and 14:00 local time. The sensor configuration comprised three bands in the Red-Green-Near-Infrared spectral range with central wavelengths of 550, 650, and 850 nm and widths of 15, 15, and 30 nm, respectively. Images were acquired with the Mapir Survey 3 sensor (Figure 2b), had a resolution of 12 Megapixels (4000 × 3000 px) and were georeferenced. Image capture was programmed at a rate of one second per image. The image format was RAW + JPG, with RAW images in a 12-bit per channel format. The UAV included a Lens Optics 87° HFOV (Horizontal Field of View”) (19 mm) with an f/2.8 aperture. The ISO was set at 100, and the shutter speed was 1/500.
Table 1 describes the melon development stages and their corresponding durations according to [31]. It also specifies the periods when the experiments took place.
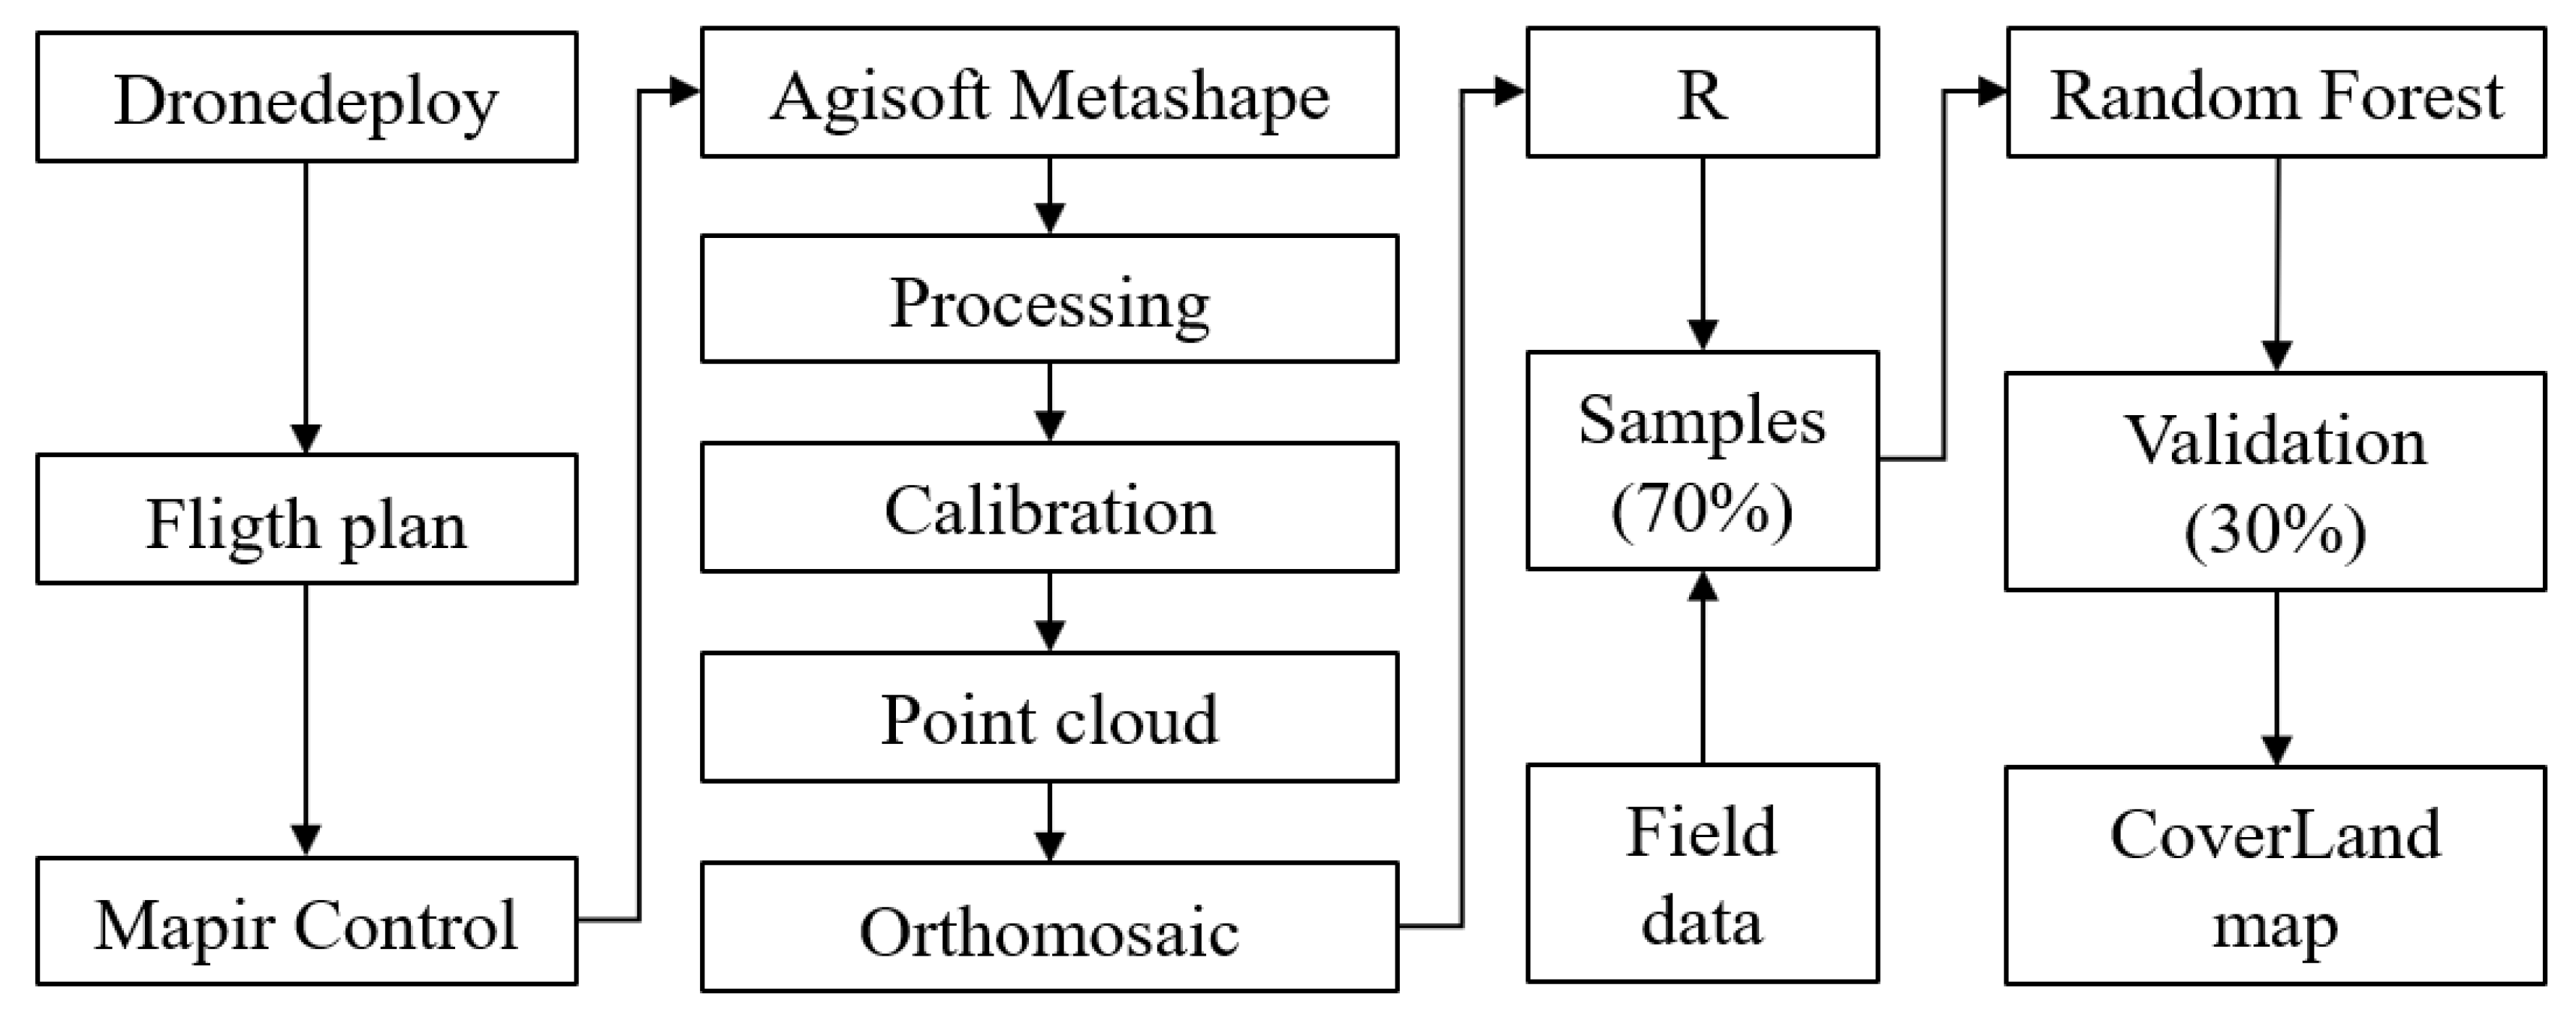
To capture images throughout the crop cycle, automated flight plans were conducted using the DroneDeploy application (Figure 3), installed on a Smartphone. The defined flight height was 40 m, with 80% frontal overlap and 75% lateral overlap, resulting in an image with a 2 cm pixel ground sample distance (GSD). This procedure facilitated the identification of corresponding points in the images during the processing using Agisoft Metashape software v. 2.1.
After the flight, the images were calibrated using Mapir Control software v.2.1. A photograph of the calibration panel (calibration ground target) was captured before each flight (Figure 3). These images were processed to standardize reflectances and to perform calibration, ensuring accurate analysis and the subsequent generation of the orthomosaic.
After calibration, the images were imported into Agisoft Metashape software v. 2.1, where the photographs underwent alignment, point cloud densification, and orthophoto mosaic generation. This process facilitated the creation of a georeferenced and detailed representation of the study area, which aided in analyzing the biophysical parameters of the melon crop.
After obtaining the orthophoto, the NDVI was calculated using the RStudio software (version 2022.02.2) with R core v. 4.2.0 [32], following the methodology proposed by [33]. The NDVI was calculated using the following equation:
NDVI   = ρ nir ρ r ρ nir + ρ r
where ρnir is the near-infrared reflectance, and ρr is the red reflectance.
After obtaining the NDVI, we performed pixel-by-pixel classifications using the Random Forest classifier [34], a supervised machine learning method, in R software. We configured the Random Forest classifier with 100 Ntree and set the Mtry parameter to the square root of the number of input variables, which corresponded to the number of treatments [35]. We discriminated among the following treatments: CT1 (‘Cantaloupe’ at irrigation depth T1), CT2 (‘Cantaloupe’ at irrigation depth T2), CT3 (‘Cantaloupe’ at irrigation depth T3), GT1 (‘Gladial’ at irrigation depth T1), GT2 (‘Gladial’ at irrigation depth T2), GT3 (‘Gladial’ at irrigation depth T3), mulching, and exposed soil.
To discriminate between treatments accurately, representative samples were required to classify each class. Representative samples were selected from regions of interest (ROIs) manually delineated over known treatment areas, using the distinct spectral profiles in the Red and NIR bands. The discrimination performance among the thematic treatments was assessed using producer accuracy, user accuracy, global accuracy, and the kappa index or kappa coefficient, as indicated by the confusion matrix (Table 2) [36]. In each iteration of the Random Forest classifier, 70% of the samples were randomly allocated for training, and the remaining 30% were used for validation within each thematic class. Classification accuracy was evaluated using the confusion matrix, which details the correctly classified pixels, the total number of pixels, and the accuracies of both producer and user. The kappa index or kappa coefficient, a statistical measure of agreement between predicted and reference classifications, was also calculated [36]. These statistical measures are widely used to gauge the performance of classification routines in remote sensing applications and provide insight into the accuracy of classification results.
The global accuracy ( θ 1 ) is defined as the sum of correctly classified values by the total number of classified values, and can be expressed by:
θ 1 = i = 1 c p i , i
Producer accuracy is the probability of correctly classifying a given class, or the ratio (%) of “correct class scores” to the “actual class total.”, which represents the “error omission”. It is expressed by:
Class   Producer   Accuracy   j   =   p j , j p + j
User accuracy is defined as the probability (%) that an element classified to a predicted class actually belongs to that classification, that is, the ratio of “hits for the class” to “total classified in the class” which represents the “commission error”. expressed by:
Class   User   Accuracy   i =   p i , i p i +
The kappa coefficient [37] is a statistical measure that assesses agreement between classifiers. It accounts for the expected agreement by chance and ranges from −1 to 1, with 1 indicating perfect agreement and 0 signifying agreement due to chance alone. The kappa coefficient is a reliable measure of classification accuracy, particularly when applied to unadjusted classification models. It evaluates classifier performance and offers a succinct summary of the achieved agreement level. Table 3 presents the likely kappa coefficients for the classification results, indicating the agreement between the classifiers and the true treatments. This coefficient is represented by:
K = θ 1 θ 2 1 θ 2
where θ 2 is expressed as the following equation:
θ 2 = i = 1 c P i + P + i
Ref. [38] proposed a classification scheme for interpreting kappa coefficient values, providing insights into classification quality. The interpretation, summarized in Table 3, indicates the level of agreement based on kappa coefficient values. This scheme aids in assessing the reliability and accuracy of classification results.
The classification and validation of UAV images involved the following steps: (1) image acquisition; (2) processing; (3) NDVI; (4) classification; (5) field data; (6) training samples 70%; (7) Random Forest classifier; (8) validation samples 30%; and (9) land use and land cover map (Figure 4).
The Kc was calculated by ratio between the ETc obtained from a water balance drainage lysimeter by the ETo estimated using the Penman-Monteith method: Kc-FAO = ETc/ETo. A moving average was calculated using a 5-day interval based on the daily Kc data, following the methodology proposed by [28].
To derive NDVI values for the melon crop, we conducted five flights per season: at 14, 17, 29, 46, and 56 days after transplanting (DAT) during the warm period and at 22, 44, 59, 62, and 66 DAT throughout the cool period. We utilized Kc-FAO values, obtained via a moving average, for the melon cultivars ‘Gladial’ and ‘Cantaloupe’ on corresponding flight dates to construct linear regression models. The aim was to estimate Kcb based on the NDVI.
The leaf area index (LAI), representing the ratio of plant surface area to the area occupied by a plant, was determined using equations developed by [39] for yellow melon and ‘Cantaloupe’ cultivars. The average number of leaves per plant was counted at 20, 26, 36, and 57 DAT during the warm period and at 28, 34, 45, and 64 DAT during the cool period.
The linear regression models were assessed using RStudio software version 2022.02.2 with R core version 4.2.0 [32]. This evaluation involved determining the significance of the regression coefficients via t-tests at a 5% probability level. Furthermore, the coefficient of determination was computed to evaluate the models’ goodness of fit.
Refs. [40,41] proposed statistical indicators, including mean absolute deviation (MAD), mean bias error (MBE), root mean square error (RMSE), and mean absolute percentage error (MAPE), to evaluate the accuracy and performance of models derived from remote sensing data. These indicators were employed to assess the predictive capabilities of the models (Equations (7)–(10)).
MAD = t = 1 n At     Ft n
MBE = 1 n t = 1 n At     Ft
RMSE = t = 1 n At     Ft 2 n
MAPE = t = 1 n At     Ft At n   ×   100
Here, Ft represents the estimated values; At is the measured values; and n is the number of observations.
The statistical indices mentioned facilitate the evaluation of predicted values against actual values. RMSE provides insights into the dispersion of the evaluated data. Researchers commonly use rRMSE, calculated as RMSE multiplied by 100, as a scale to assess model accuracy [42,43]. The rRMSE classifications are as follows: excellent if rRMSE is less than 10%, good if rRMSE ranges from 10% to 20%, acceptable if rRMSE is between 20% and 30%, and poor if rRMSE exceeds 30%.
The Willmott index (d), proposed by [44], is determined by Equation (11).
d =   1   t = 1 n Ft     At 2 t = 1 n Ft     O     At     O 2
where Ft corresponds to the estimated values, At to the measured values, and O to the average of the measured values. The “d” values can range from 0, indicating no agreement, to 1, indicating perfect agreement.
The coefficient c, proposed by [45], combines both the strength of correlation (correlation coefficient) and agreement Willmott index) between predicted and observed values, offering a consolidated measure of model performance. Its interpretation is as follows: great (c > 0.85), very good (0.76 ≤ c ≤ 0.85), good (0.66 ≤ c ≤ 0.75), average (0.61 ≤ c ≤ 0.65), poor (0.51 ≤ c ≤ 0.60), bad (0.41 ≤ c ≤ 0.50), and terrible (c < 0.40).

3. Results and Discussion

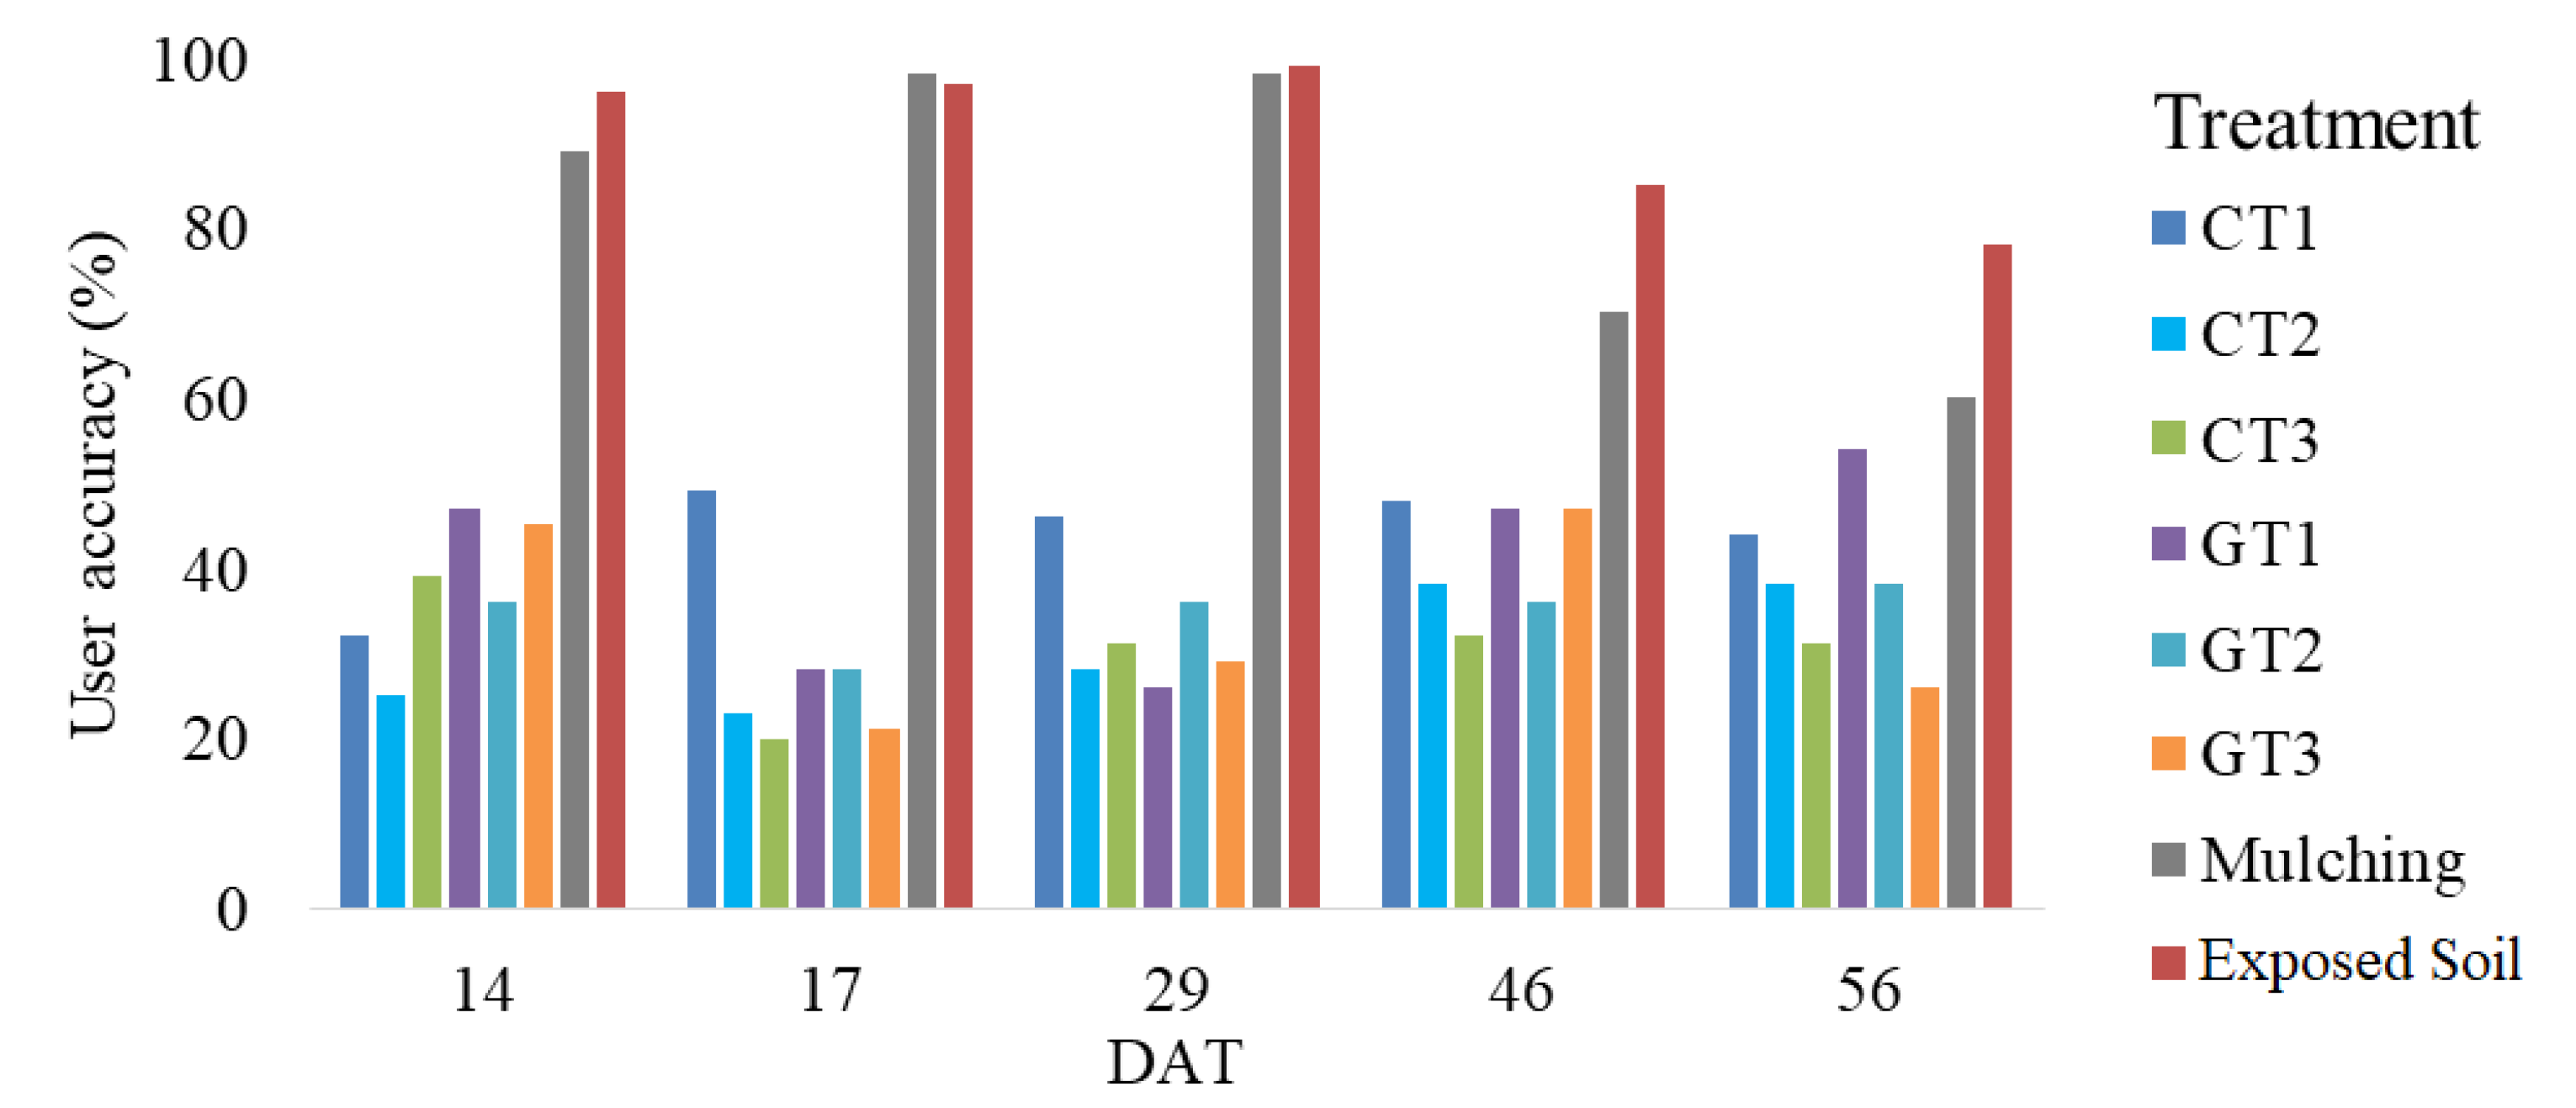
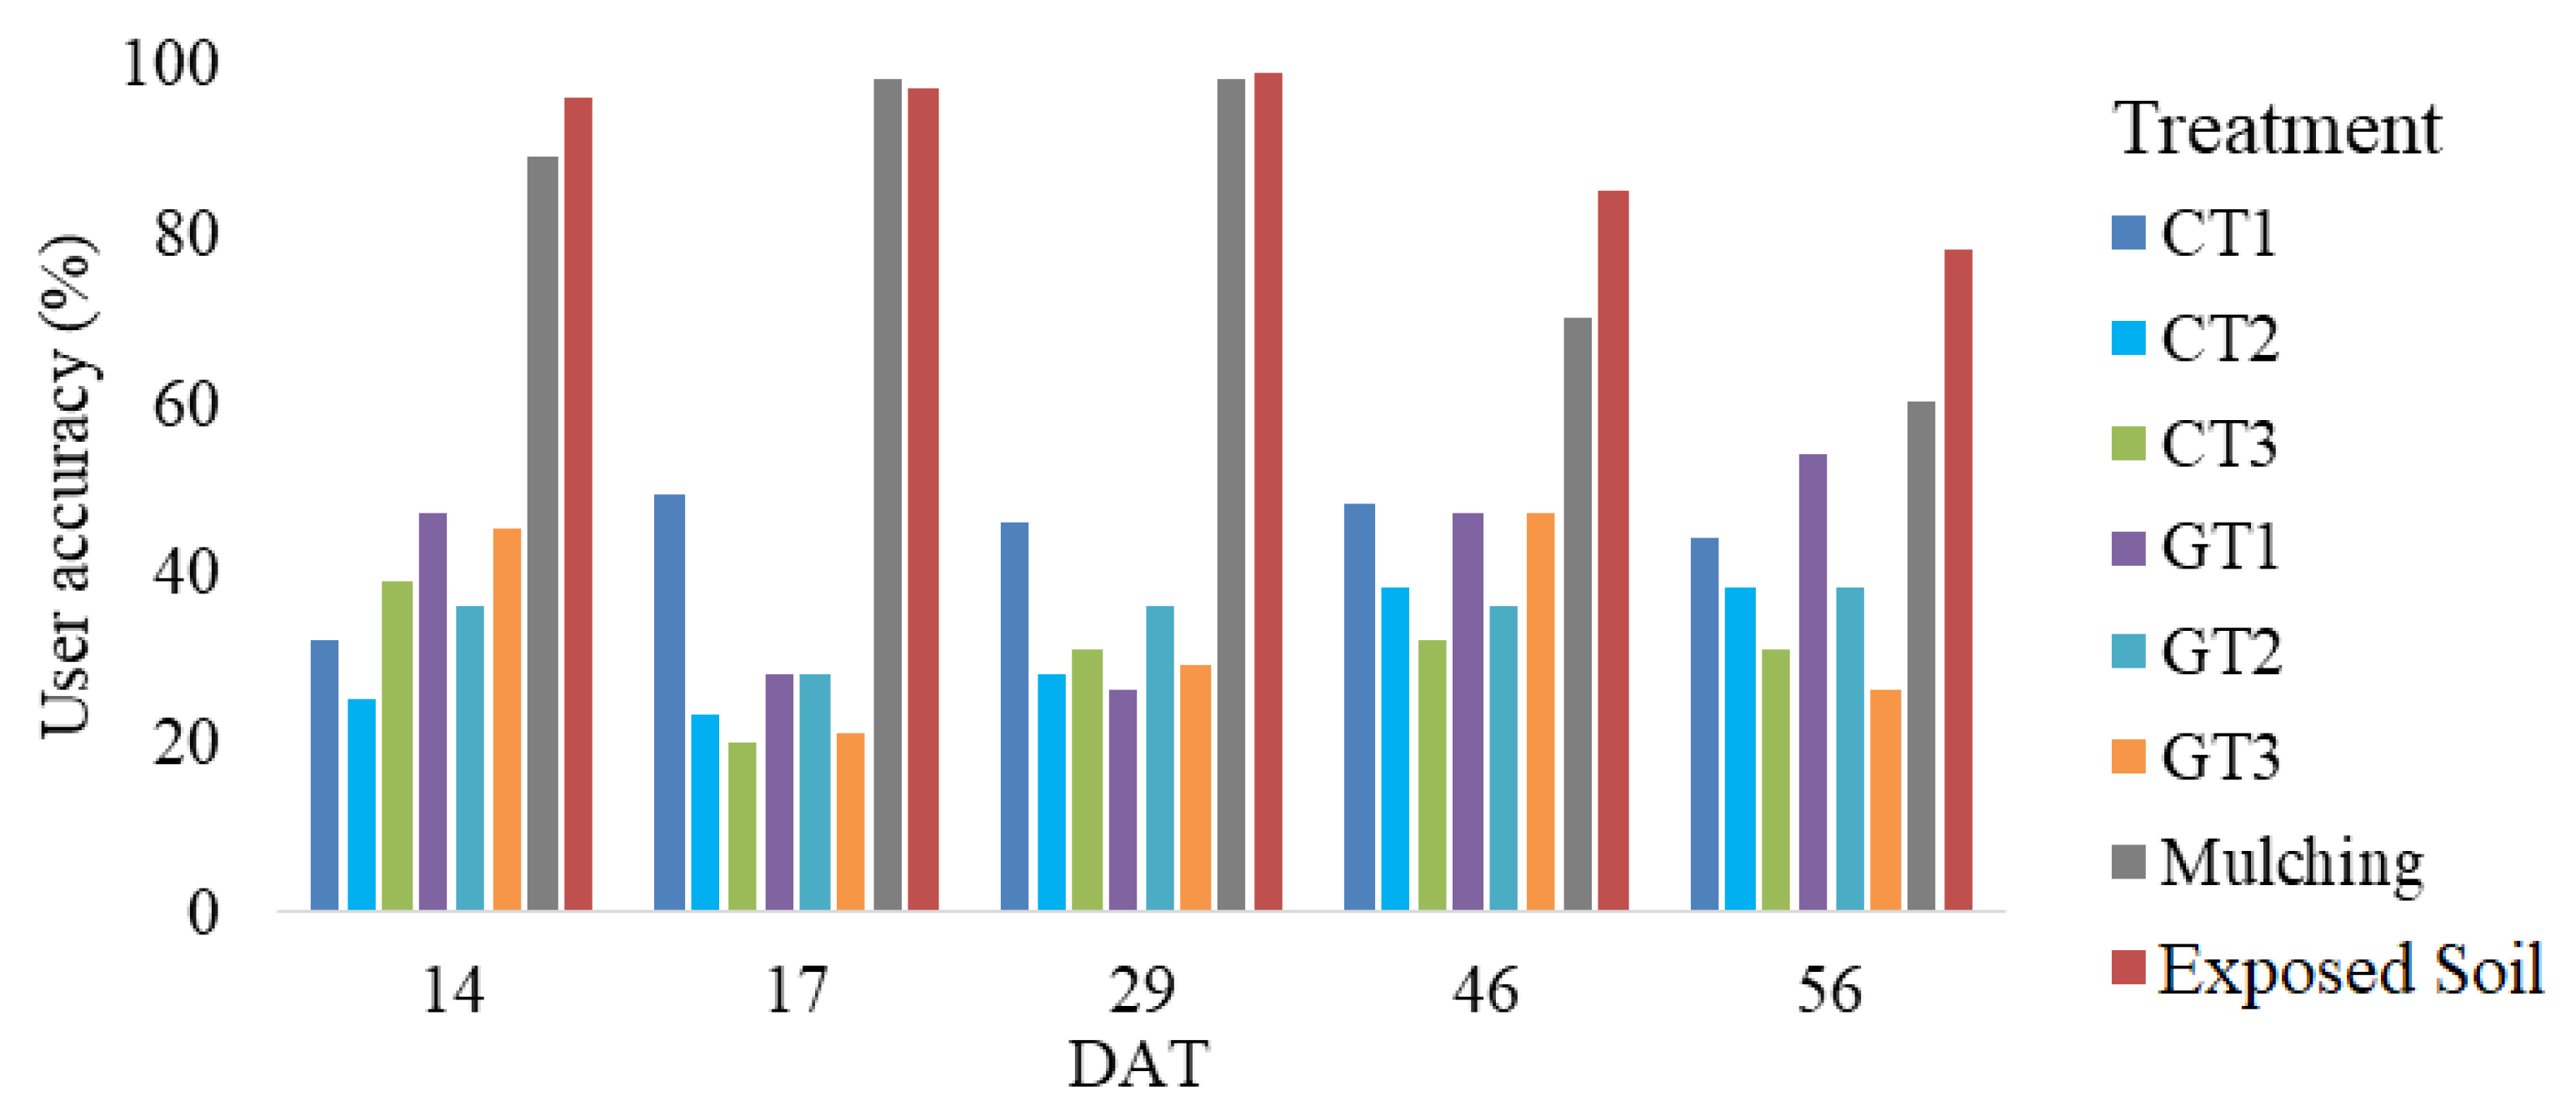
Analysis of user and producer accuracy in the classifications (Figure 5 and Figure 6) revealed that the highest accuracy was achieved for the thematic treatments of exposed soil and mulching across all DAT during the warm period. Specifically, DAT 29 showed the highest accuracy rates, with user accuracy reaching 98% for mulching and 99% for exposed soil. Producer accuracy was 99% for the exposed soil class and 77% for the mulching class. Generally, the most favorable user accuracy outcomes for the other treatments occurred at DAT 46, with values of 46%, 48%, 38%, 32%, 47%, 36%, and 47% for treatments CT1, CT2, CT3, GT1, GT2, and GT3, respectively. The highest producer accuracy rates were recorded at DAT 17, with values of 78%, 66%, 38%, 57%, 78%, and 58% for treatments CT1, CT2, CT3, GT1, GT2, and GT3, respectively. Notably, these variations in accuracy are significant. Ref. [46] indicated that user and producer precision can be effectively derived from the confusion matrix in classification applications. Additionally, the performance and applications of the Random Forest classifier have been underscored by other researchers [34,47,48,49].
On average, treatments CT1 and GT1 exhibited the highest hit rates, with user accuracies of 44% and 40%, respectively. Similarly, GT2 and GT1 demonstrated the highest producer accuracies, with average rates of 56% and 48%, respectively. During the cool period, the thematic treatments of exposed soil and mulching showed the best performance for user and producer accuracies across all evaluated DATs (Figure 7 and Figure 8), this is likely due to the distinct spectral signatures of non-vegetative surfaces compared to crop treatments, which show greater spectral overlap. Specifically, DAT 59 had the highest user accuracies, with mulching at 95% and exposed soil at 94%. The producer accuracies for these treatments were 99% for exposed soil and 77% for mulching. Generally, the optimal outcomes for the other treatments in terms of user accuracy occurred at DAT 44, with values of 86%, 50%, 54%, 67%, 66%, and 69% for treatments CT1, CT2, CT3, GT1, GT2, and GT3, respectively. The highest producer accuracies were recorded at DAT 44, with values of 78%, 66%, 38%, 57%, 78%, and 58% for treatments CT1, CT2, CT3, GT1, GT2, and GT3, respectively.
The treatments exhibiting the highest average user accuracies were CT1 and GT2, with rates of 50% and 52%, respectively. The highest average producer accuracies were also observed for treatments CT1 and GT2, with rates of 47% and 56%, respectively, indicating that 47% and 56% of the CT1 and GT2 treatments, respectively, were correctly classified.
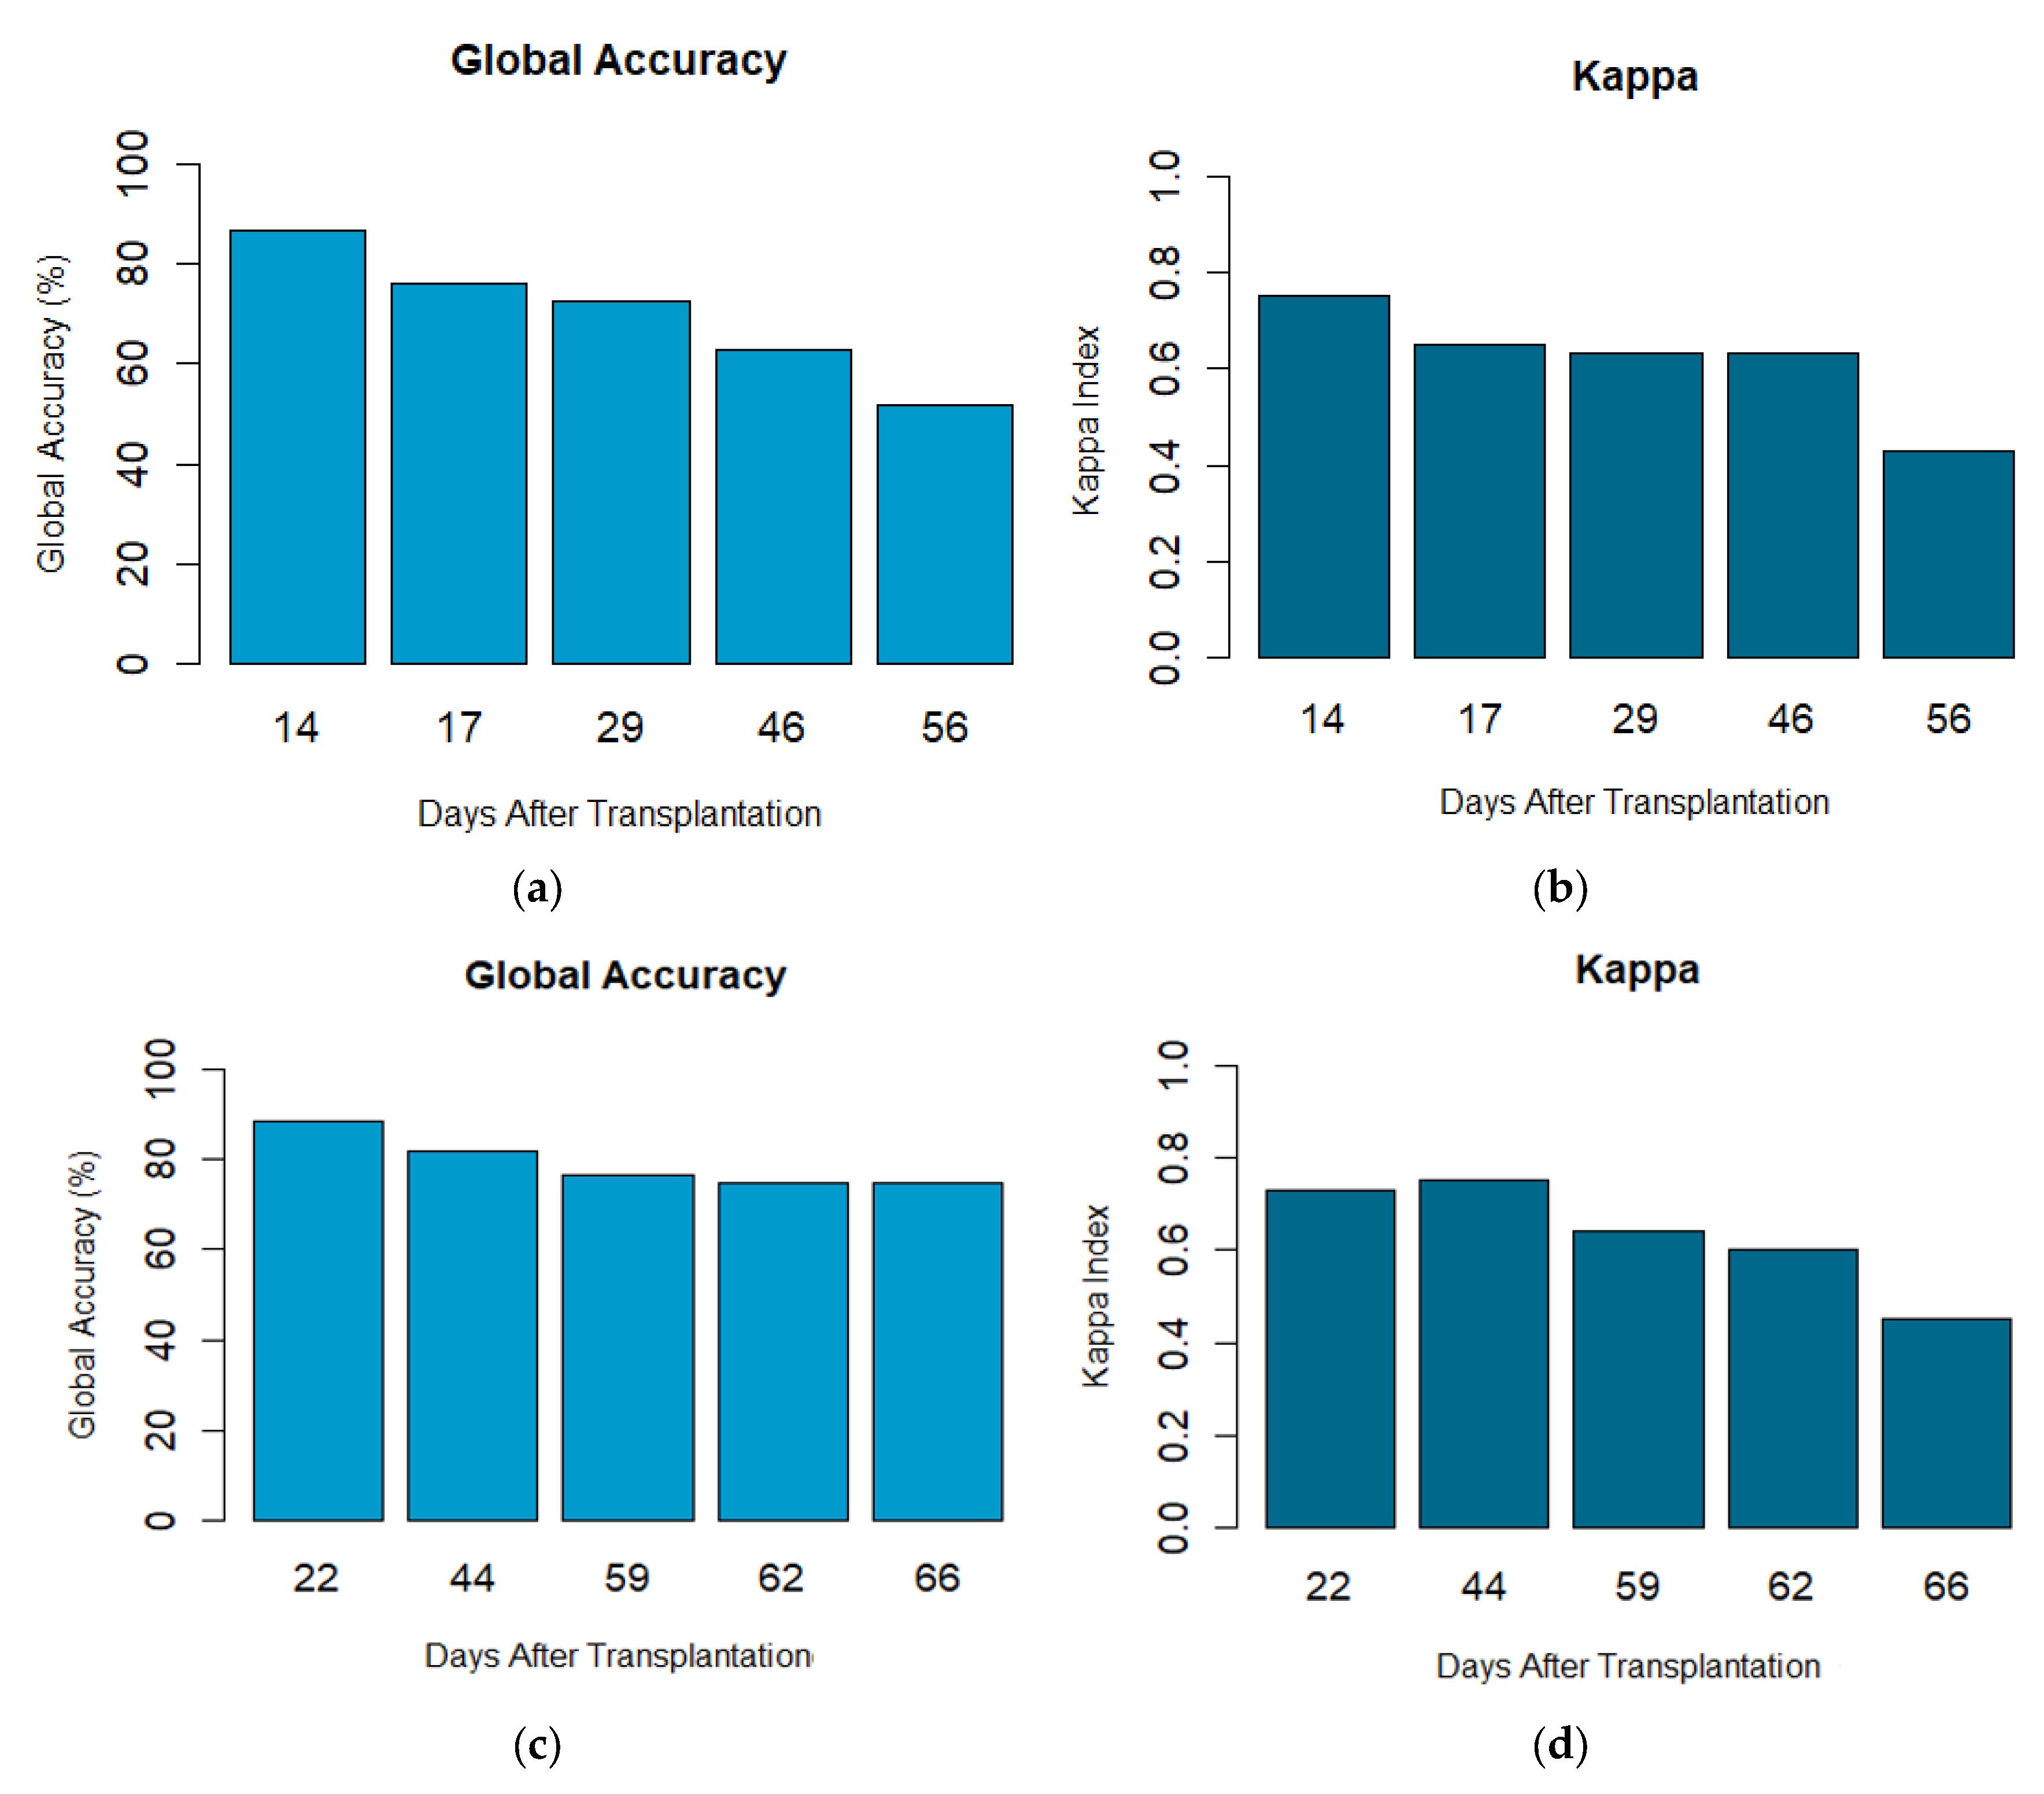
During the warm period, pixel-by-pixel classification using the Random Forest classifier demonstrated moderate to substantial agreement, with classification quality ranging from good to very good (Figure 9). Global accuracy varied from 51.78% to 86.68%, closely aligning with the findings of [47], who reported land cover maps with moderate to high accuracy and an overall accuracy exceeding 84.31% across eight datasets.
Regarding the Kappa coefficient, the results ranged from 0.43 to 0.75 (Figure 9b), indicating that only one of the five images had a value below 0.60. Ref. [46] caution against the routine use of Kappa in accuracy assessment or comparison, emphasizing that a highly accurate classification can be associated with a wide range of Kappa values. Despite these limitations, the observed kappa values aligned with those expected for moderate to high classification performance.
For the cool period (Figure 9c), similar to the warm period, there was moderate to substantial agreement and good to very good classification quality. The global accuracy ranged from 74.69% to 88.41%, indicating a consistent classification performance, indicating a classification from very good to great, according to the references in Table 3. The Kappa values (Figure 9d) ranged from 0.45 to 0.73 (very good, according to the references in Table 3), further supporting the overall agreement between the predicted and reference treatments.
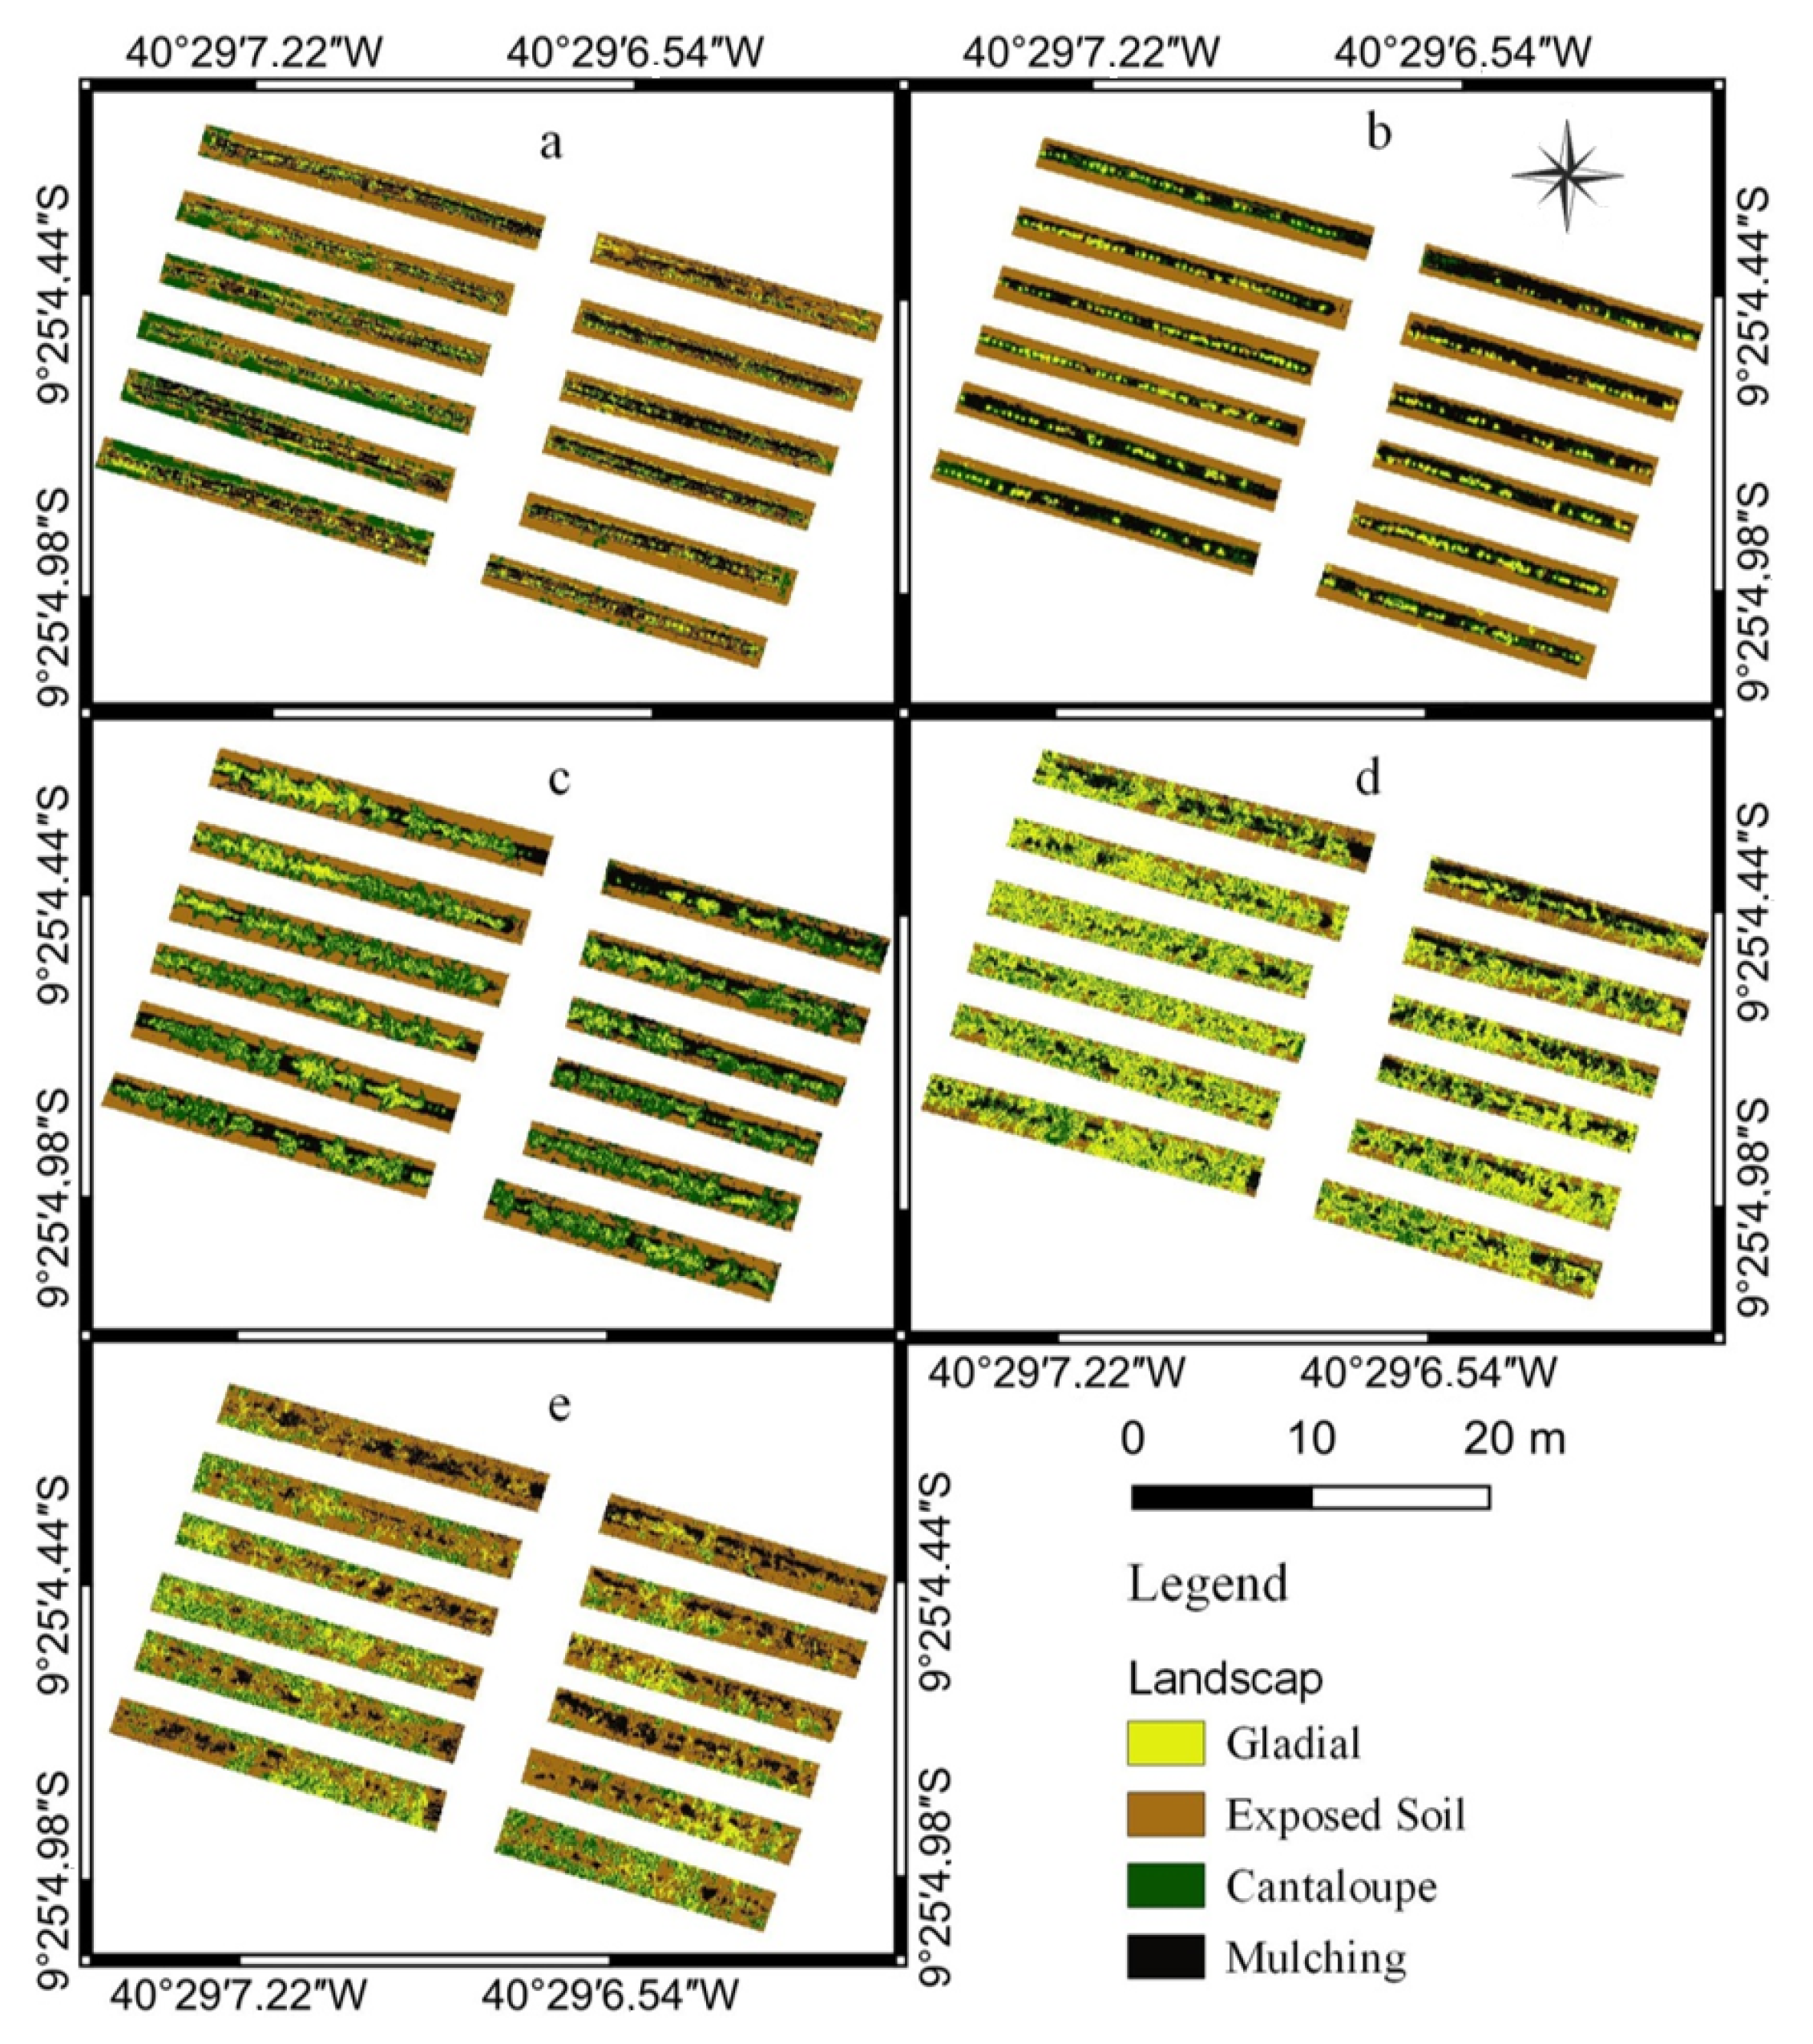
There was no significant variation in global accuracy or the Kappa index for the two studied periods (Figure 9). This suggests that the methodology yielded consistent classification results effectively. This consistency is evident in Figure 10 and Figure 11, which depict the land use and cover maps of the melon study area for the warm and cool periods, respectively.
Figure 12 and Figure 13 present the thematic maps of NDVI for the melon crop, highlighting the observed variations during the warm and cool periods. During the warm period, NDVI values ranged from 0.22 to 0.42, whereas in the cool period, these ranged from 0.03 to 0.45. Lower values, shown in red, correspond to exposed soil and/or plastic mulch, as both exhibit similar reflectance in the Red and NIR wavelengths. Conversely, higher values, depicted in green, indicate melon vegetation and reflect photosynthetic activity.
The results of this study differ from those reported by [50], who evaluated the impact of recycled paper coverings on the evaporation and evapotranspiration of Italian zucchini using NDVI. Oliveira et al. reported mean NDVI values ranging from 0.17 to 0.80. These discrepancies may be due to various factors, such as differences in crop type, cultivation techniques, and the distance between the sensor and the target. In our study, we obtained NDVI measurements using a modified sensor mounted on a UAV, which was programmed to fly at a height of 40 m. Ref. [50], on the other hand, utilized a portable sensor with a height range of 0.8 to 1.2 m. Additionally, our findings differ from those of [51], who reported an average NDVI value of 0.47 for melon leaves using a portable spectroradiometer sensor.
Table 4 and Table 5 present the average NDVI values and Kc-FAO for the ‘Gladial’ and ‘Cantaloupe’ melon cultivars across various flight dates during the warm and cool periods. During the warm period, there was a general increase in NDVI values concurrent with an increase in Kc for both cultivars. Refs. [52,53,54] explain that canopy development leads to a higher ratio of transpiration to evapotranspiration, owing to the increased interception of radiant energy by the foliage, which results in most light being absorbed before it reaches the ground.
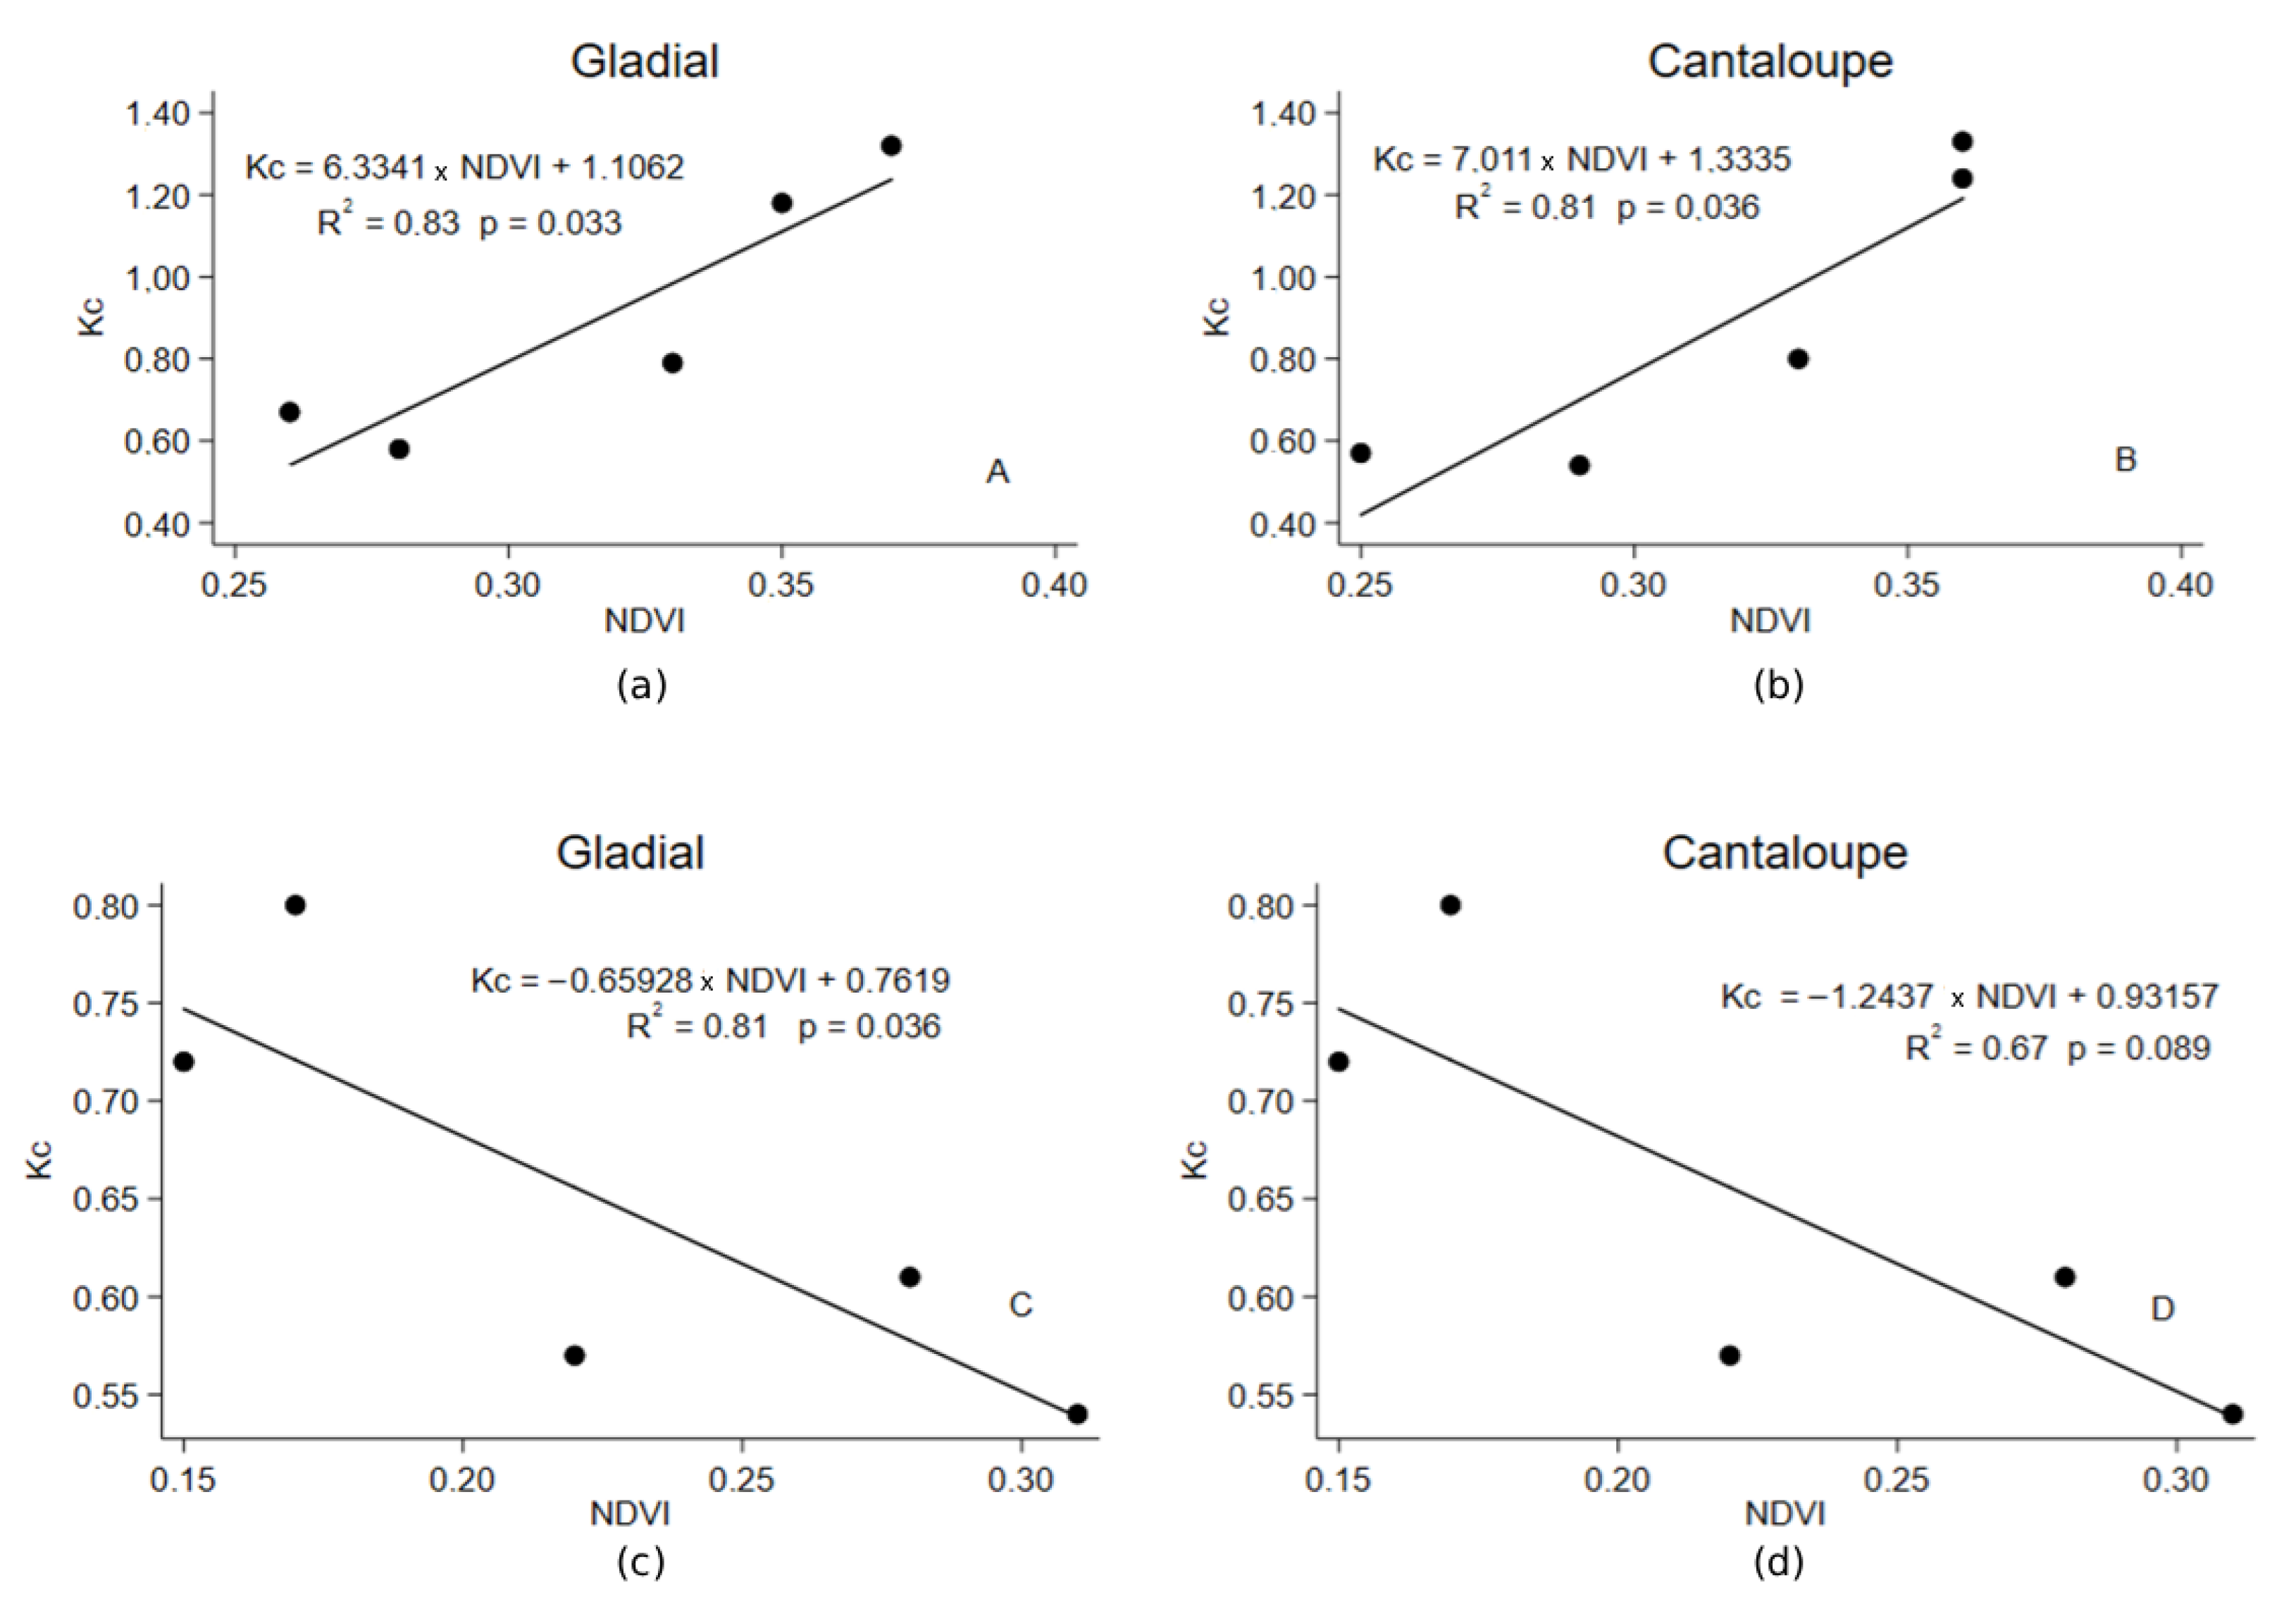
Figure 4 and Figure 5 further illustrate that during the warm period, the ‘Gladial’ cultivar exhibits notably higher Kc values compared to the ‘Cantaloupe’ cultivar. However, during the cool period, this trend reverses, with ‘Cantaloupe’ displaying higher Kc values. A reduction in Kc was observed for both melon cultivars as the NDVI increases during the cool period.
Figure 14 displays the linear regression models between Kc-FAO and NDVI for the two periods. During the warm period, both melon cultivars exhibited an increasing and statistically significant linear relationship (p < 0.05). Specifically, the ‘Gladial’ cultivar demonstrated the highest coefficient of determination (R2 = 0.83), indicating that 83% of the variation in Kc was explained by the variation in NDVI. Conversely, during the cool period, an inverse correlation was observed for both cultivars, with ‘Gladial’ displaying a correlation of R2 = 0.81. The regression explained 81% of Kc variability, leaving 19% unexplained. Notably, the regression model was only significant (p < 0.05) for ‘Gladial’ during this period.
The determination coefficients obtained in this study, except for the ‘Cantaloupe’ cultivar during the cool period, exceeded those reported by [55], who estimated the Kc from NDVI for the Italian zucchini crop and found an R2 of 0.73.
The inverse behavior of the Kc-NDVI ratio observed during the cool period (Figure 14c,d) was attributed to the climatic conditions experienced during this period. Figure 15a shows that during the hot period, except for a few isolated days with rainfall, there was consistently high global solar radiation, with an average of 20.9 MJ m−2 day−1. In contrast, the cool period had a lower incidence of solar radiation due to both naturally lower levels and a greater number of rainy days (Figure 15b). The average solar radiation during this period was 14.2 MJ m−2 day−1, which was very close to the critical lower limit considered for the melon crop (14 MJ m−2 day−1), while the upper limit was 23.7 MJ m−2 day−1 [30].
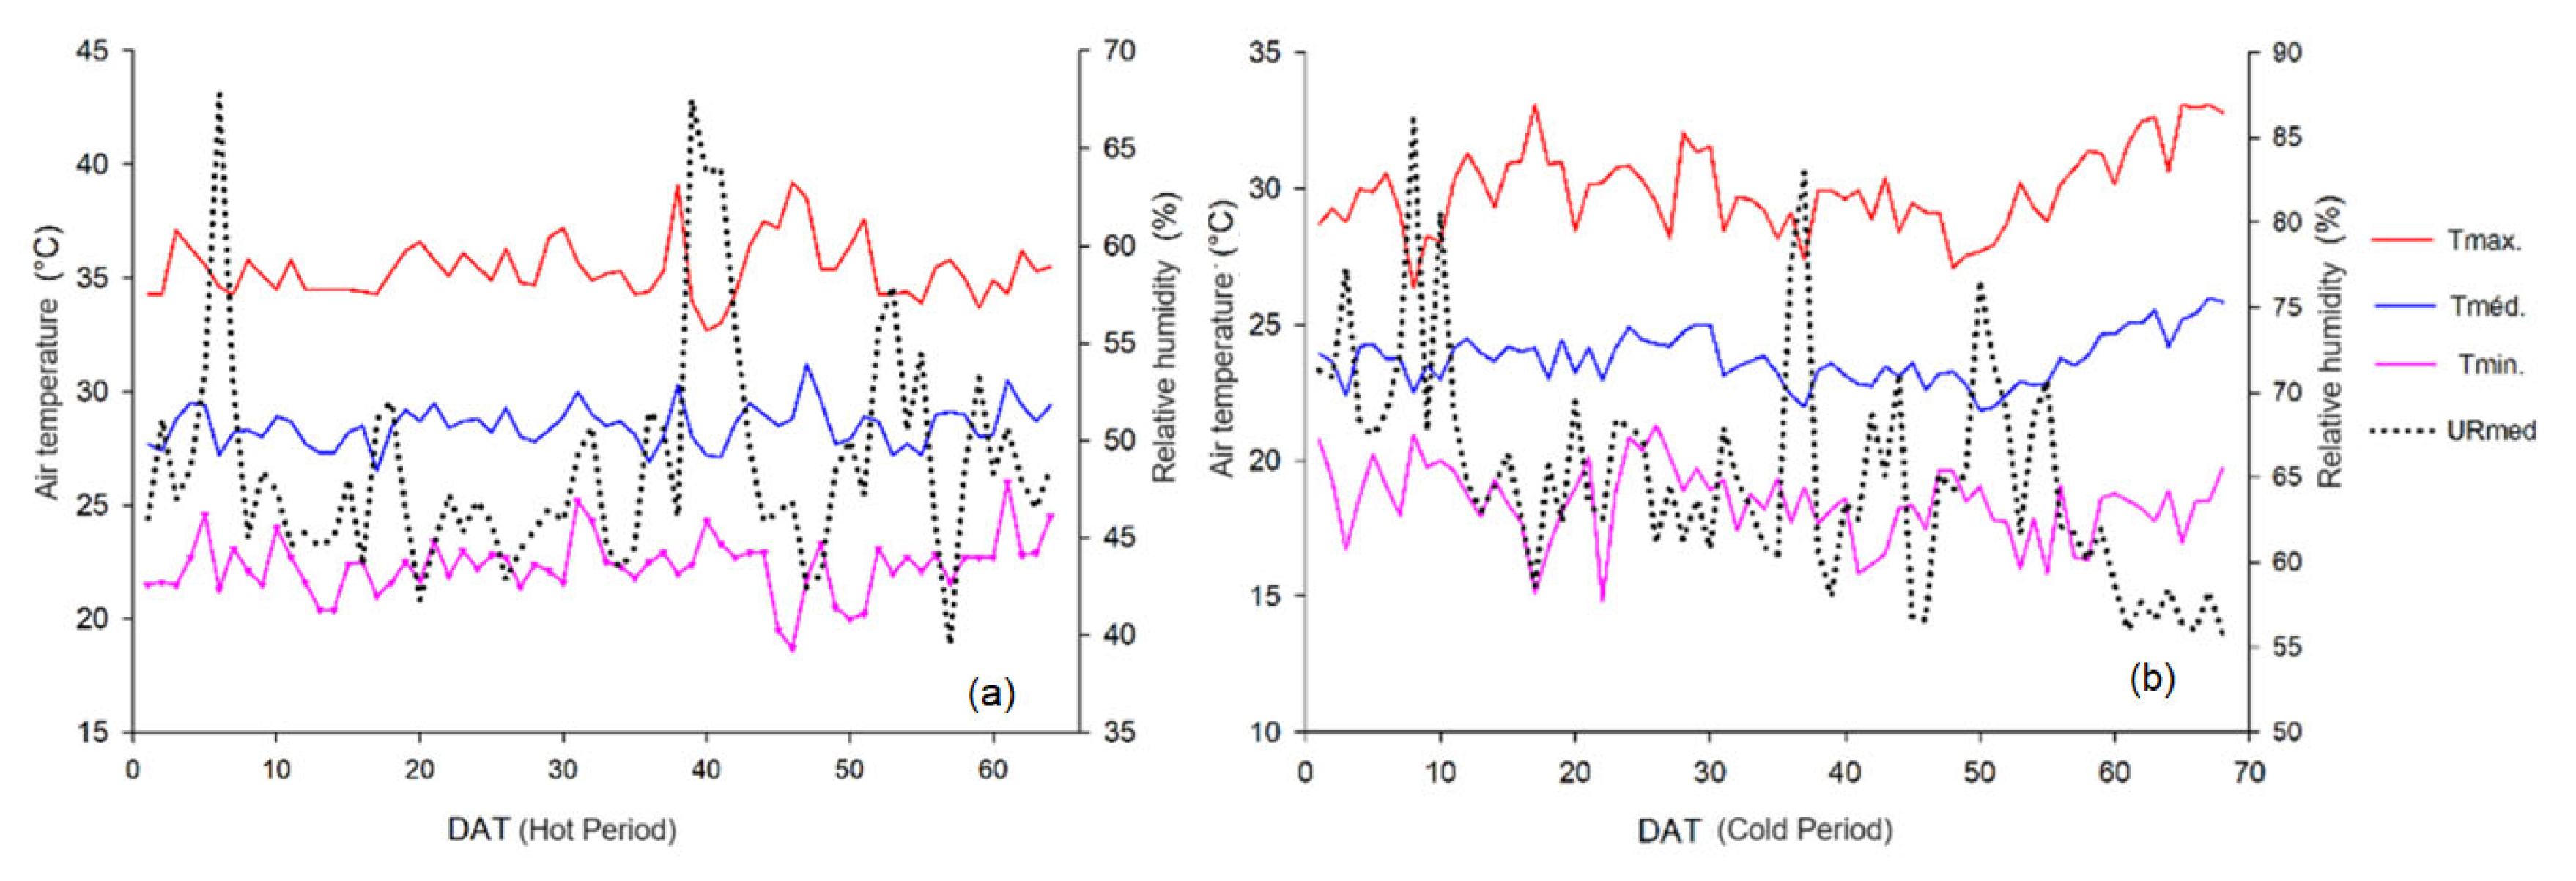
Figure 16b shows that the cool period featured high relative humidity and low air temperatures. At the start of the experiment, these conditions led to reduced evapotranspiration rates (ETo) and, as a result, increased Kc. Ref. [56] suggest that the changes in Kc during the crop cycle are affected by factors that are climate-dependent, such as aerodynamic resistance due to wind speed, stomatal regulation, and canopy structure.
Furthermore, melon cultivation requires specific climatic conditions for optimal development. These include high temperatures, high solar radiation, low relative humidity, and low rainfall [30]. Such favorable conditions were observed during the warm period (Figure 16a).
Air temperature analysis revealed that during the warm period (Figure 16a), the maximum temperature reached 39.2 °C, while the minimum was 18.7 °C, resulting in a thermal amplitude of 20.5 °C. The average temperature for this period was 28.5 °C. Conversely, during the cool period (Figure 16b), the maximum temperature recorded was 33.1 °C, the minimum was 14.8 °C, and the thermal amplitude was 18.3 °C, with an average temperature of 23.8 °C. Both periods fall within the optimal temperature range for melon crop cultivation, i.e., 25 to 30 °C [30].
Figure 16b indicates that the relative humidity during the cool period was higher, averaging 65%, compared to the warm period, which averaged 48.9%. Such high relative humidity is deemed unfavorable for melon cultivation [30]. Relative humidity exceeding 75% may produce small, inferior-quality fruits with low soluble solid content due to the increased incidence of fungal diseases. The ideal relative humidity range for melon cultivation lies between 65% and 75%.
Table 6 presents statistical indicators of the goodness of fit of the Kc-FAO linear regressions compared to NDVI. The RMSE values for the ‘Gladial’ and ‘Cantaloupe’ cultivars were 0.12 and 0.14, respectively, for the warm period, indicating a good fit (10% < rRMSE < 20%). For the cool period, the models were classified as very good (rRMSE < 10%). The coefficient of determination values were also evaluated, and the models were classified as very good (c between 0.76 and 0.85) for the warm period. In the cool period, the performance of the model was very good for the ‘Gladial’ cultivar and good (c between 0.66 and 0.75) for the ‘Cantaloupe’ cultivar. These indicators suggest that the regression models used to estimate the Kc for melon cultivars performed well for both the warm and cool periods.
Figure 17 demonstrates that the non-linear adjustment models for the LAI of the ‘Gladial’ and ‘Cantaloupe’ melon cultivars as a function of DAT were statistically significant (p < 0.05) for both the warm and cool periods. The LAI, which represents the leaf coverage of the land, is an important parameter for analyzing the growth of melon cultivars and its impact on light interception [50,57].
During the warm period, both cultivars demonstrated increased growth in LAI at 42 DAT. Conversely, in the cool period, ‘Gladial’ attained peak growth at 50 DAT, whereas ‘Cantaloupe’ reached its maximum LAI at 42 DAT. The disparity in LAI dynamics and performance between the cultivars may be due to a range of factors, such as environmental climate conditions, leaf morphology, canopy architecture, and crop cycle length.
The findings indicate that the growth and development of melon cultivars, as reflected by the LAI, are affected by various factors, and the optimal growth timing may differ based on the cultivar and environmental conditions throughout the growing season.
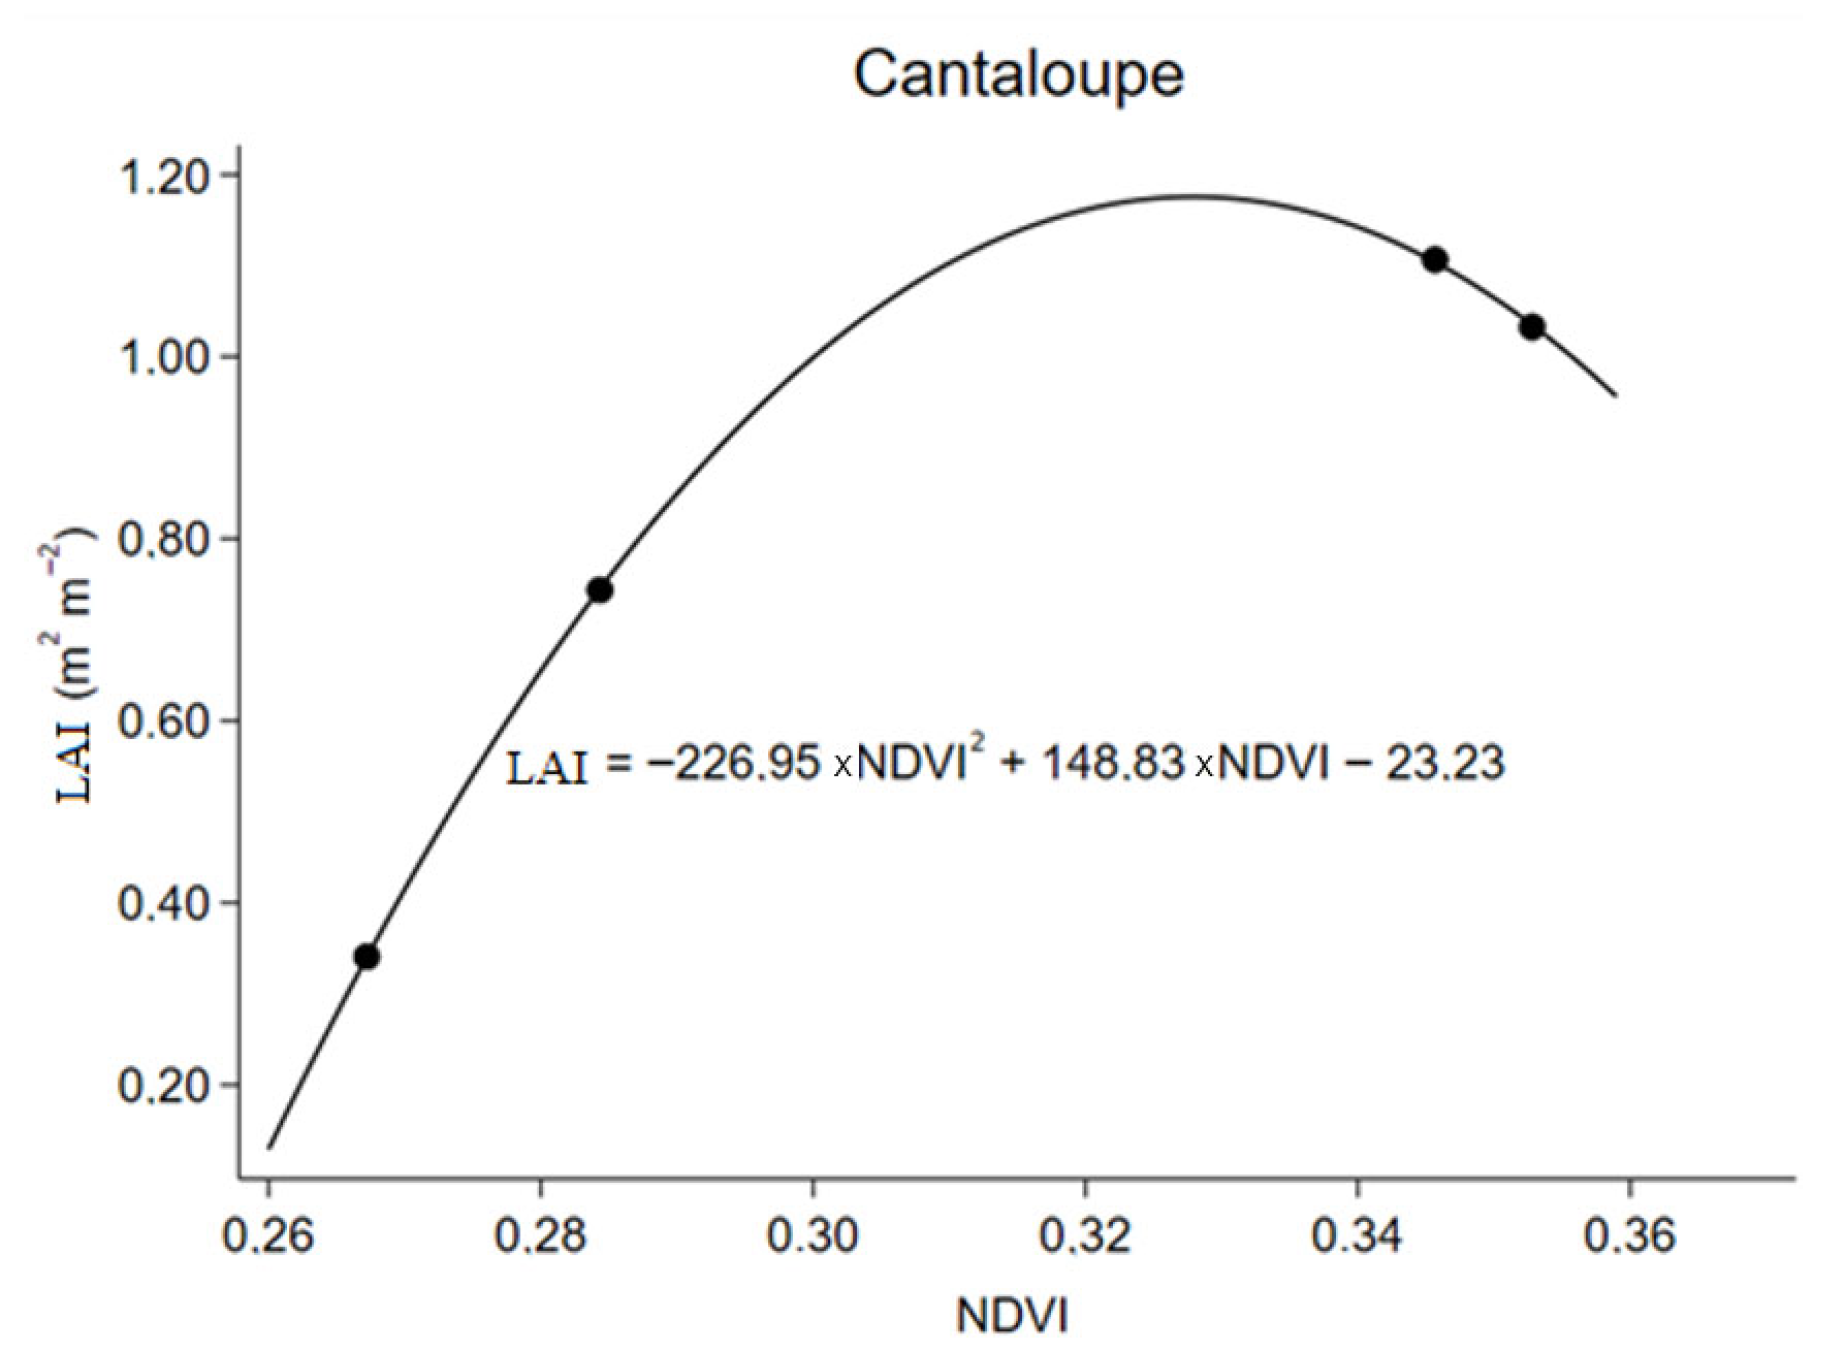
The polynomial regression analysis between LAI and NDVI, as shown in Figure 18, yielded an excellent coefficient of determination (R2 = 1.0) for the ‘Cantaloupe’ cultivar in the warm period, and this correlation was statistically significant (p < 0.05). The correlation was not significant for ‘Gladial’ in the warm period, nor for either cultivar during the cool period.
LAI is a critical factor influencing vegetation reflectance, with a robust relationship between LAI and vegetation reflectance. Consequently, numerous studies have employed vegetation reflectance indices, such as NDVI, to estimate LAI [58,59,60]. However, the climatic conditions during the cool period in this study may have been a determining factor in the observed lack of correlation between LAI and vegetation reflectance. The lack of correlation between NDVI and LAI in cold periods for melon crops may be linked to the slower growth rate of the crop, as well as proportionally reflecting the increase in leaf biomass throughout the cycle, which reduces the sensitivity of NDVI to additional increases in LAI, therefore not having the same relationship as hot periods.
Ref. [61] estimated LAI in vine canopies and found that the best estimates were obtained based on NDVI, resulting in a high coefficient of determination of 0.98. Although NDVI did not explain Kc in some scenarios, LAI dynamics suggested physiological activity under certain conditions, indicating the relationship between NDVI and LAI in crop cultivation.

4. Conclusions

This study has shown that NDVI, obtained using UAV technology, enables accurate estimation of the Kcb in melon plants during both warm and cool periods. The spectral models developed for estimating Kcb displayed consistent linear behavior, increasing during the warm period and decreasing during the cool period.
The estimated Kcb values for the ‘Gladial’ cultivar ranged from 2.753 to 3.450 during the warm period and from 0.815 to 0.993 during the cool period. For the ‘Cantaloupe’ cultivar, the Kcb values obtained during the warm period ranged from 3.087 to 3.856, while these ranged from 1.118 to 1.317 during the cool period.
The use of UAV imaging and NDVI-based approaches to estimate evapotranspiration in melon cultivars is highly promising, especially under the challenging environmental conditions of semiarid regions in Brazil. This technology offers a valuable and efficient method for estimating Kc and monitoring the water requirements of melon cultivation.
Leveraging remote sensing capabilities enables farmers and researchers to manage irrigation effectively and optimize water usage in melon production. This approach yields significant benefits for water efficiency and sustainable agricultural practices in water-limited regions.
Further research and validation studies are recommended to broaden the applicability of NDVI-based methods for estimating Kc values and evapotranspiration in melon cultivation across various regions and climatic conditions. Integrating UAV imagery with other data sources and advanced modeling techniques can enhance the accuracy and reliability of these estimations, ultimately improving water management strategies in melon production systems.

Author Contributions

Conceptualization, J.M.S., G.M.d.O. and M.d.M.V.B.R.L.; Data curation, E.J.P.S., T.G.F.d.S. and M.V.d.S.; Formal analysis, J.M.S., G.M.d.O., A.M.d.R.F.J., T.G.F.d.S. and M.V.d.S.; Funding acquisition, J.M.S., G.M.d.O., L.B.M. and T.G.F.d.S.; Investigation, J.M.S., G.M.d.O., J.H.d.S.T. and E.J.P.S.; Methodology, J.M.S., G.M.d.O., P.R.G., J.H.d.S.T., W.M.d.S. and A.M.d.R.F.J.; Project administration, G.M.d.O.; Resources, M.d.M.V.B.R.L., T.G.F.d.S. and M.V.d.S.; Software, J.M.S., E.J.P.S., M.d.M.V.B.R.L., W.M.d.S. and T.G.F.d.S.; Supervision, L.B.M., W.M.d.S., A.M.d.R.F.J. and M.V.d.S.; Validation, J.M.S., P.R.G., J.H.d.S.T., L.B.M., W.M.d.S., A.M.d.R.F.J. and M.V.d.S.; Visualization, J.M.S., P.R.G., M.d.M.V.B.R.L., L.B.M., A.M.d.R.F.J. and M.V.d.S.; Writing—original draft, J.M.S., G.M.d.O. and L.B.M.; Writing—review and editing, P.R.G., J.H.d.S.T., E.J.P.S., M.d.M.V.B.R.L., W.M.d.S., A.M.d.R.F.J., T.G.F.d.S. and M.V.d.S. All authors have read and agreed to the published version of the manuscript.

Funding

This research received no external funding.

Institutional Review Board Statement

Not applicable.

Informed Consent Statement

Not applicable.

Data Availability Statement

The data presented in this study are available on request from the corresponding author. (The reason for this comment is to gauge people’s interest in our research, increase partnerships, and, if there are any questions regarding the analyses, so we can answer them more clearly.)

Conflicts of Interest

The authors declare no conflicts of interest.

References

  1. Bausch, W.C.; Neale, C.M.U. Crop coefficients derived from reflected canopy radiation: A concept. Trans. ASAE 1987, 30, 703–0709. [Google Scholar] [CrossRef]
  2. Campos, I.; Neale, C.M.; Suyker, A.E.; Arkbauer, T.J.; Gonçalves, I.Z. Reflectance-based crop coefficients REDUX: For operational evapotranspiration estimates in the age of high producing hybrid varieties. Agric. Water Manag. 2017, 187, 153. [Google Scholar] [CrossRef]
  3. Choudhury, B.; Ahmed, N.; Idso, S.; Reginato, R.; Daughtry, C. Relations between evaporation coefficients and vegetation indices studied by model simulations. Remote Sens. Environ. 1994, 50, 1–17. [Google Scholar] [CrossRef]
  4. Gomes, M.D.d.A. Coeficiente de Cultivo Para a Videira Com Base no Índice de Vegetação Por Diferença Normalizada Obtido Com Uso de VANT. Tese (Doutorado), Agronomia (Irrigação e Drenagem)—FCA. 2019. Available online: http://hdl.handle.net/11449/183600 (accessed on 23 March 2022).
  5. González Piqueras, J. Evapotranspiración de la Cubierta Vegetal Mediante la Determinación del Coeficiente de Cultivo por Teledetección. Extensión a Escala Regional: Acuífero 08.29 Mancha Oriental; Universitat de València: València, Spain, 2006; p. 337. Available online: http://hdl.handle.net/10550/14928 (accessed on 20 February 2025).
  6. Drerup, C.M.; Herbet, A.L.; Monk, K.R.; Nechiporuk, A.V. Regulation of mitochondria-dynactin interaction and mitochondrial retrograde transport in axons. Elife 2017, 6, e22234. [Google Scholar] [CrossRef]
  7. Malakinezhad, H.; Firoozi, F.; Rahimi, K. Estimating crop coefficients for pistachios and grapes using SEBAL and simple reference evapotranspiration methods in the Central basin of Iran. Arab. J. Geosci. 2022, 15, 1572. [Google Scholar] [CrossRef]
  8. Panme, F.A.; Sethi, L.N. Estimation of Crop Water Requirements and Irrigation Scheduling for Major Crops Grown in India’s North-Eastern Region. Curr. Appl. Sci. Technol. 2023, 23, 10-55003. [Google Scholar] [CrossRef]
  9. Allen, R.G.; Pereira, L.S.; Raes, D.; Smith, M. Crop Evapotranspiration-Guidelines for Computing Crop Water Requirements; FAO Irrigation and Drainage Paper 56; FAO: Rome, Italy, 1998; Volume 300, p. D05109. [Google Scholar]
  10. Shao, G.; Han, W.; Zhang, H.; Zhang, L.; Wang, Y.; Zhang, Y. Prediction of maize crop coefficient from UAV multisensor remote sensing using machine learning methods. Agric. Water Manag. 2023, 276, 108064. [Google Scholar] [CrossRef]
  11. Kaplan, G.; Fine, L.; Lukyanov, V.; Malachy, N.; Tanny, J.; Rozenstein, O. Using Sentinel-1 and Sentinel-2 imagery for estimating cotton crop coefficient, height, and Leaf Area Index. Agric. Water Manag. 2023, 276, 108056. [Google Scholar] [CrossRef]
  12. Cattani, C.E.V.; Garcia, M.R.; Mercante, E.; Johann, J.A.; Correa, M.M.; Oldoni, L.V. Spectral-temporal characterization of wheat cultivars through NDVI obtained by terrestrial sensors. Rev. Bras. Eng. Agrícola Ambient. 2017, 21, 769–773. [Google Scholar] [CrossRef]
  13. Arantes, L.T.; Arantes, B.H.T.; Giongo, P.R.; Ceccato, G.Z.; Moraes, V.H.; Saito, Y.K.; Gomes, L.F.; Castro, A.C.O. Comportamento espectral e detecção de laranjeiras (Citrus sinensis l. osbeck) com estresse hídrico, por meio de drone. Rev. Bras. Geogr. Física 2020, 13, 3625–3635. [Google Scholar] [CrossRef]
  14. Rasmussen, J.; Ntakos, G.; Nielsen, J.; Svensgaard, J.; Poulsen, R.N.; Christen, S. Are vegetation indices derived from consumer-grade cameras mounted on UAVs sufficiently reliable for assessing experimental plots? Eur. J. Agron. 2016, 74, 75–92. [Google Scholar] [CrossRef]
  15. Al-Bakri, J.T.; D’Urso, G.; Calera, A.; Abdalhaq, E.; Altarawneh, M.; Margane, A. Remote Sensing for Agricultural Water Management in Jordan. Remote Sens. 2022, 15, 235. [Google Scholar] [CrossRef]
  16. Johnson, L.F.; Herwitz, S.; Dunagan, S.; Lobitz, B.; Sullivan, D.; Slye, R. Collection of ultra high spatial and spectral resolution image data over California vineyards with a small UAV. In Proceedings of the 30th International Symposium on Remote Sensing of Environment, Honolulu, HI, USA, 10–14 November 2003; International Society of Photogrammetry and Remote Sensing: Paris, France, 2003; Volume 20, pp. 845–849. [Google Scholar]
  17. Mokhtari, A.; Sadeghi, M.; Afrasiabian, Y.; Yu, K. OPTRAM-ET: A novel approach to remote sensing of actual evapotranspiration applied to Sentinel-2 and Landsat-8 observations. Remote Sens. Environ. 2023, 286, 113443. [Google Scholar] [CrossRef]
  18. Parmar, S.H.; Patel, G.R.; Tiwari, M.K. Assessment of Crop Water Requirement of Maize Using Remote Sensing and GIS. Smart Agric. Technol. 2023, 4, 100186. [Google Scholar] [CrossRef]
  19. Rana, V.K.; Suryanarayana, T.M.V. Evaluation of SAR speckle filter technique for inundation mapping. Remote Sens. Appl. Soc. Environ. 2019, 16, 100271. [Google Scholar] [CrossRef]
  20. Silva, M.V.; Pandorfi, H.; Jardim, A.M.D.R.F.; de Oliveira-Júnior, J.F.; da Divincula, J.S.; Giongo, P.R.; Lopes, P.M.O. Spatial modeling of rainfall patterns and groundwater on the coast of northeastern Brazil. Urban Clim. 2021, 38, 100911. [Google Scholar] [CrossRef]
  21. Giongo, P.R.; Orlandini, J.D.; Arantes, B.H.T.; Gomes, L.F.; Moraes, V.H.; Costa ARda Ribon, A.A. Predição de dados agronômicos em goiabeiras e separação de alvos por meio de Veículo Aéreo Não Tripulado. Sci. Plena 2020, 16, 040202. [Google Scholar] [CrossRef]
  22. Giongo, P.R.; de Morais, K.C.B.; da Silva, M.V.; Santos, A.J.M.; Backes, C.; Ribon, A.A.; Pandorfi, H. Chemical and granulometric characterization of soil and its influence on the bromatologic composition of pastures in savannah region, Central Brazil. J. S. Am. Earth Sci. 2022, 114, 103703. [Google Scholar] [CrossRef]
  23. Oliveira, M.E.G.; da Silva, M.V.; de Almeida, G.L.P.; Pandorfi, H.; Lopes, P.M.O.; Manrique, D.R.C.; de Oliveira-Júnior, J.F. Investigation of pre and post environmental impact of the lockdown (COVID-19) on the water quality of the Capibaribe and Tejipió rivers, Recife metropolitan region, Brazil. J. S. Am. Earth Sci. 2022, 118, 103965. [Google Scholar] [CrossRef]
  24. Zhang, Y.; Han, W.; Zhang, H.; Niu, X.; Shao, G. Evaluating maize evapotranspiration using high-resolution UAV-based imagery and FAO-56 dual crop coefficient approach. Agric. Water Manag. 2023, 275, 108004. [Google Scholar] [CrossRef]
  25. Alface, A.B.; Pereira, S.B.; Filgueiras, R.; Cunha, F.F. Sugarcane spatial-temporal monitoring and crop coefficient estimation through NDVI. Rev. Bras. Eng. Agrícola Ambient. 2019, 23, 330–335. [Google Scholar] [CrossRef]
  26. Perry, E.; Sheffield, K.; Crawford, D.; Akpa, S.; Clancy, A.; Clark, R. Spatial and temporal biomass and growth for grain crops using NDVI Time Series. Remote Sens. 2022, 14, 3071. [Google Scholar] [CrossRef]
  27. Beck, H.E.; Zimmermann, N.E.; McVicar, T.R.; Vergopolan, N.; Berg, A.; Wood, E.F. Present and future Köppen-Geiger climate classification maps at 1-km resolution. Sci. Data 2018, 5, 180214. [Google Scholar] [CrossRef] [PubMed]
  28. Hargreaves, G.H.; Samani, Z.A. Reference crop evapotranspiration from temperature. Appl. Eng. Agric. 1985, 1, 96–99. [Google Scholar] [CrossRef]
  29. Stetson, L.E.; Mecham, B.Q. Irrigation, 6th ed.; Irrigation Association: Fairfax, VA, USA, 2011; pp. 495–546. [Google Scholar]
  30. EMBRAPA. Sistema de Produção do Melão. Available online: http://sistemasdeproducao.cnptia.embrapa.br (accessed on 20 February 2025).
  31. Allen, R.G.; Pereira, L.S.; Raes, D.; Smith, M. Evapotranspiration del Cultivo: Guias Para la Determinación de los Requerimientos de Agua de Los Cultivos; Estudio Riego e Drenaje Paper; FAO: Rome, Italy, 2006; n56; p. 298. Available online: http://www.fao.org/docrep/009/x0490s/x0490s00.htm (accessed on 22 February 2022).
  32. Team, R. Core R: A Language and Environment for Statistical Computing; R Foundation for Statistical Computing: Vienna, Austria, 2022; Available online: https://www.R-project.org/ (accessed on 10 July 2022).
  33. Rouse, J., Jr.; Haas, R.; Schell, J.; Deering, D. Monitoring Vegetation Systems in the Great Plains with ERTS. NASA Special Publication, 351, 309, 1974. Available online: https://ntrs.nasa.gov/api/citations/19740022614/downloads/19740022614.pdf?utm_source (accessed on 22 February 2022).
  34. Liaw, A.; Wiener, M. Classification and Regression by random Forest. R News 2002, 2, 18–22. [Google Scholar]
  35. Gislason, P.O.; Benediktsson, J.A.; Sveinsson, J.R. Random Forests for land cover classification. Pattern Recognit. Lett. 2006, 27, 294–300. [Google Scholar] [CrossRef]
  36. Congalton, R.G.; Green, K. Assessing the accuracy of remotely sensed data. Biom. JSTOR 1977, 33, 159–174. [Google Scholar]
  37. Cohen, J.A. Coefficient of agreement for nominal scales. Educ. Psychol. Meas. 1960, 20, 37–46. [Google Scholar] [CrossRef]
  38. Landis, R.; Koch, G.G. The measurement of observer agreement for categorical data: Principles and Practices. Biometrics 1977, 33, 159–174. [Google Scholar] [CrossRef] [PubMed]
  39. Maia, C.E.; Silva Neto, J.M.; Braga, A.Q.C. Estimativa da área foliar do meloeiro irrigado em função do número de folhas. Rev. Ibero Am. Ciências Ambient. 2020, 11, 85–91. [Google Scholar] [CrossRef]
  40. Roessler, E.B.; Pangborn, R.M.; Sidel, J.L.; Stone, H. Expanded statistical tables for estimating significance in paired—Preference, paired–difference, duo–trio and triangle tests. J. Food Sci. 1978, 43, 940–943. [Google Scholar] [CrossRef]
  41. Iqbal, M. An Introduction to Solar Radiation; Academic Press: New York, NY, USA, 1983; p. 387. Available online: https://books.google.com.br/books?id=3_qWce_mbPsCandlpg=PP1andots=h6vZZrJ2Pqanddq=An%20Introduction%20to%20Solar%20Radiation%20andlrandhl=pt-BRandpg=PR7#v=onepageandq=An%20Introduction%20to%20Solar%20Radiationandf=false (accessed on 20 February 2025).
  42. Jamieson, P.D.; Porter, J.R.; Wilson, D.R. A test of the computer simulation model ARC—WHEAT1 on wheat crops grown in New Zealand. Field Crops Res. 1991, 27, 337–350. [Google Scholar] [CrossRef]
  43. Heinemann, A.B.; Van Oort, P.A.; Fernandes, D.S.; Maia, A.D.H.N. Sensitivity of APSIM/ORYZA model due to estimation errors in solar radiation. Bragantia 2012, 71, 572–582. [Google Scholar] [CrossRef]
  44. Willmott, C.J.; Ackleson, S.G.; Davis, R.E.; Feddema, J.J.; Klink, K.M.; Legates, D.R.; O’Donnell, J.; Rowe, C.M. Statistics for the evaluation and comparison of models. J. Geophys. Res. Ocean. 1985, 90, 8995–9005. [Google Scholar] [CrossRef]
  45. Camargo, A.P.; Sentelhas, P.C. Avaliação do desempenho de diferentes métodos de estimativa da evapotranspiração potencial no estado de São Paulo. Rev. Bras. Agrometeorol. Santa Maria 1997, 5, 89–97. [Google Scholar]
  46. Foody, G.M. Explaining the unsuitability of the kappa coefficient in the assessment and comparison of the accuracy of thematic maps obtained by image classification. Remote Sens. Environ. 2020, 239, 111630. [Google Scholar] [CrossRef]
  47. Phan, T.N.; Kuch, V.; Lehnert, L.W. Land cover classification using Google Earth Engine and random forest classifier—The role of image composition. Remote Sens. 2020, 12, 2411. [Google Scholar] [CrossRef]
  48. Zhang, L.; Liu, Z.; Ren, T.; Liu, D.; Ma, Z.; Tong, L.; Li, S. Identification of seed maize fields with high spatial resolution and multiple spectral remote sensing using random forest classifier. Remote Sens. 2020, 12, 362. [Google Scholar] [CrossRef]
  49. Collins, L.; McCarthy, G.; Mellor, A.; Newell, G.; Smith, L. Training data requirements for fire severity mapping using Landsat imagery and random forest. Remote Sens. Environ. 2020, 245, 111839. [Google Scholar] [CrossRef]
  50. Oliveira, R.M.D.; Cunha, F.F.D.; Silva, G.H.D.; Andrade, L.M.; Morais, C.V.D.; Ferreira, P.M.O.; Oliveira, R.A.D. Evapotranspiration and crop coefficients of Italian zucchini cultivated with recycled paper as mulch. PLoS ONE 2020, 15, e0232554. [Google Scholar] [CrossRef]
  51. Hernández, E.I.; Encarni, I.; Pastor-Melendez, I.; Gomez, I. Spectral indices for the detection of salinity effects in melon plants. Sci. Agric. 2014, 71, 4324–4330. [Google Scholar] [CrossRef]
  52. Bergamaschi, H.; Bergonci, J.I. As Plantas e o Clima: Princípios e Aplicações; Agrolivros: Guaíba, Brazil, 2017; 352p. [Google Scholar]
  53. Kamble, B.; Kilic, A.; Hubbard, K. Estimating crop coefficients using remote sensing-based vegetation index. Remote Sens. 2013, 4, 1588–1602. [Google Scholar] [CrossRef]
  54. Tefera, A.T.; Banerjee, B.P.; Pandey, B.R.; James, L.; Puri, R.R.; Cooray, O.; Rosewarne, G.M. Estimating early season growth and biomass of field pea for selection of divergent ideotypes using proximal sensing. Field Crops Res. 2022, 277, 108407. [Google Scholar] [CrossRef]
  55. Draper, N.; Smith, H. Applied Regression Analysis, 3rd ed.; John Wiley and Sons: Hoboken, NJ, USA, 1998. [Google Scholar]
  56. Pereira, L.S.; Perrier, A.; Allen, R.G.; Alves, I. Evapotranspiration: Concepts and future trends. J. Irrig. Drain. Eng. 1999, 125, 45–51. [Google Scholar] [CrossRef]
  57. Oliveira, L.E.M.; Mesquita, A.C.; Freitas, R.B. Análise de Crescimento de Plantas; Universidade Federal de Lavras: Lavras, Brazil, 2002; 9p, Available online: http://www.dbi.ufla.br/Fvegetal/Analise%20Crescimento.pdf (accessed on 8 November 2011).
  58. Dong, T.; Liu, J.; Shang, J.; Qian, B.; Ma, B.; Kovacs, J.M.; Shi, Y. Assessment of red-edge vegetation indices for crop leaf area index estimation. Remote Sens. Environ. 2019, 222, 133–143. [Google Scholar] [CrossRef]
  59. Berger, R.; Silva, J.A.A.D.; Ferreira, R.L.C.; Candeias, A.L.B.; Rubilar, R. Índices de vegetação para a estimativa do índice de área foliar em plantios clonais de Eucalyptus saligna Smith. Ciência Florest. 2019, 29, 885–899. [Google Scholar] [CrossRef]
  60. Solís-Silvan, R.; Sanchez-Gutiérrez, F.; Islas-Jesús, R.E.; del Carmen Gerónimo-Torres, J.; Pozo-Santiago, C.O.; Sanchez-Díaz, B. Estimation of the leaf area index from Sentinel images in Eucalyptus grandis W. Hill plantations. Hill plantations. Rev. Tecnol. Marcha 2022, 35, 39–47. [Google Scholar] [CrossRef]
  61. Towers, P.C.; Strever, A.; Poblete-Echeverría, C. Comparison of vegetation indices for leaf area index estimation in vertical shoot positioned vine canopies with and without grenbiule hail-protection netting. Remote Sens. 2019, 11, 1073. [Google Scholar] [CrossRef]
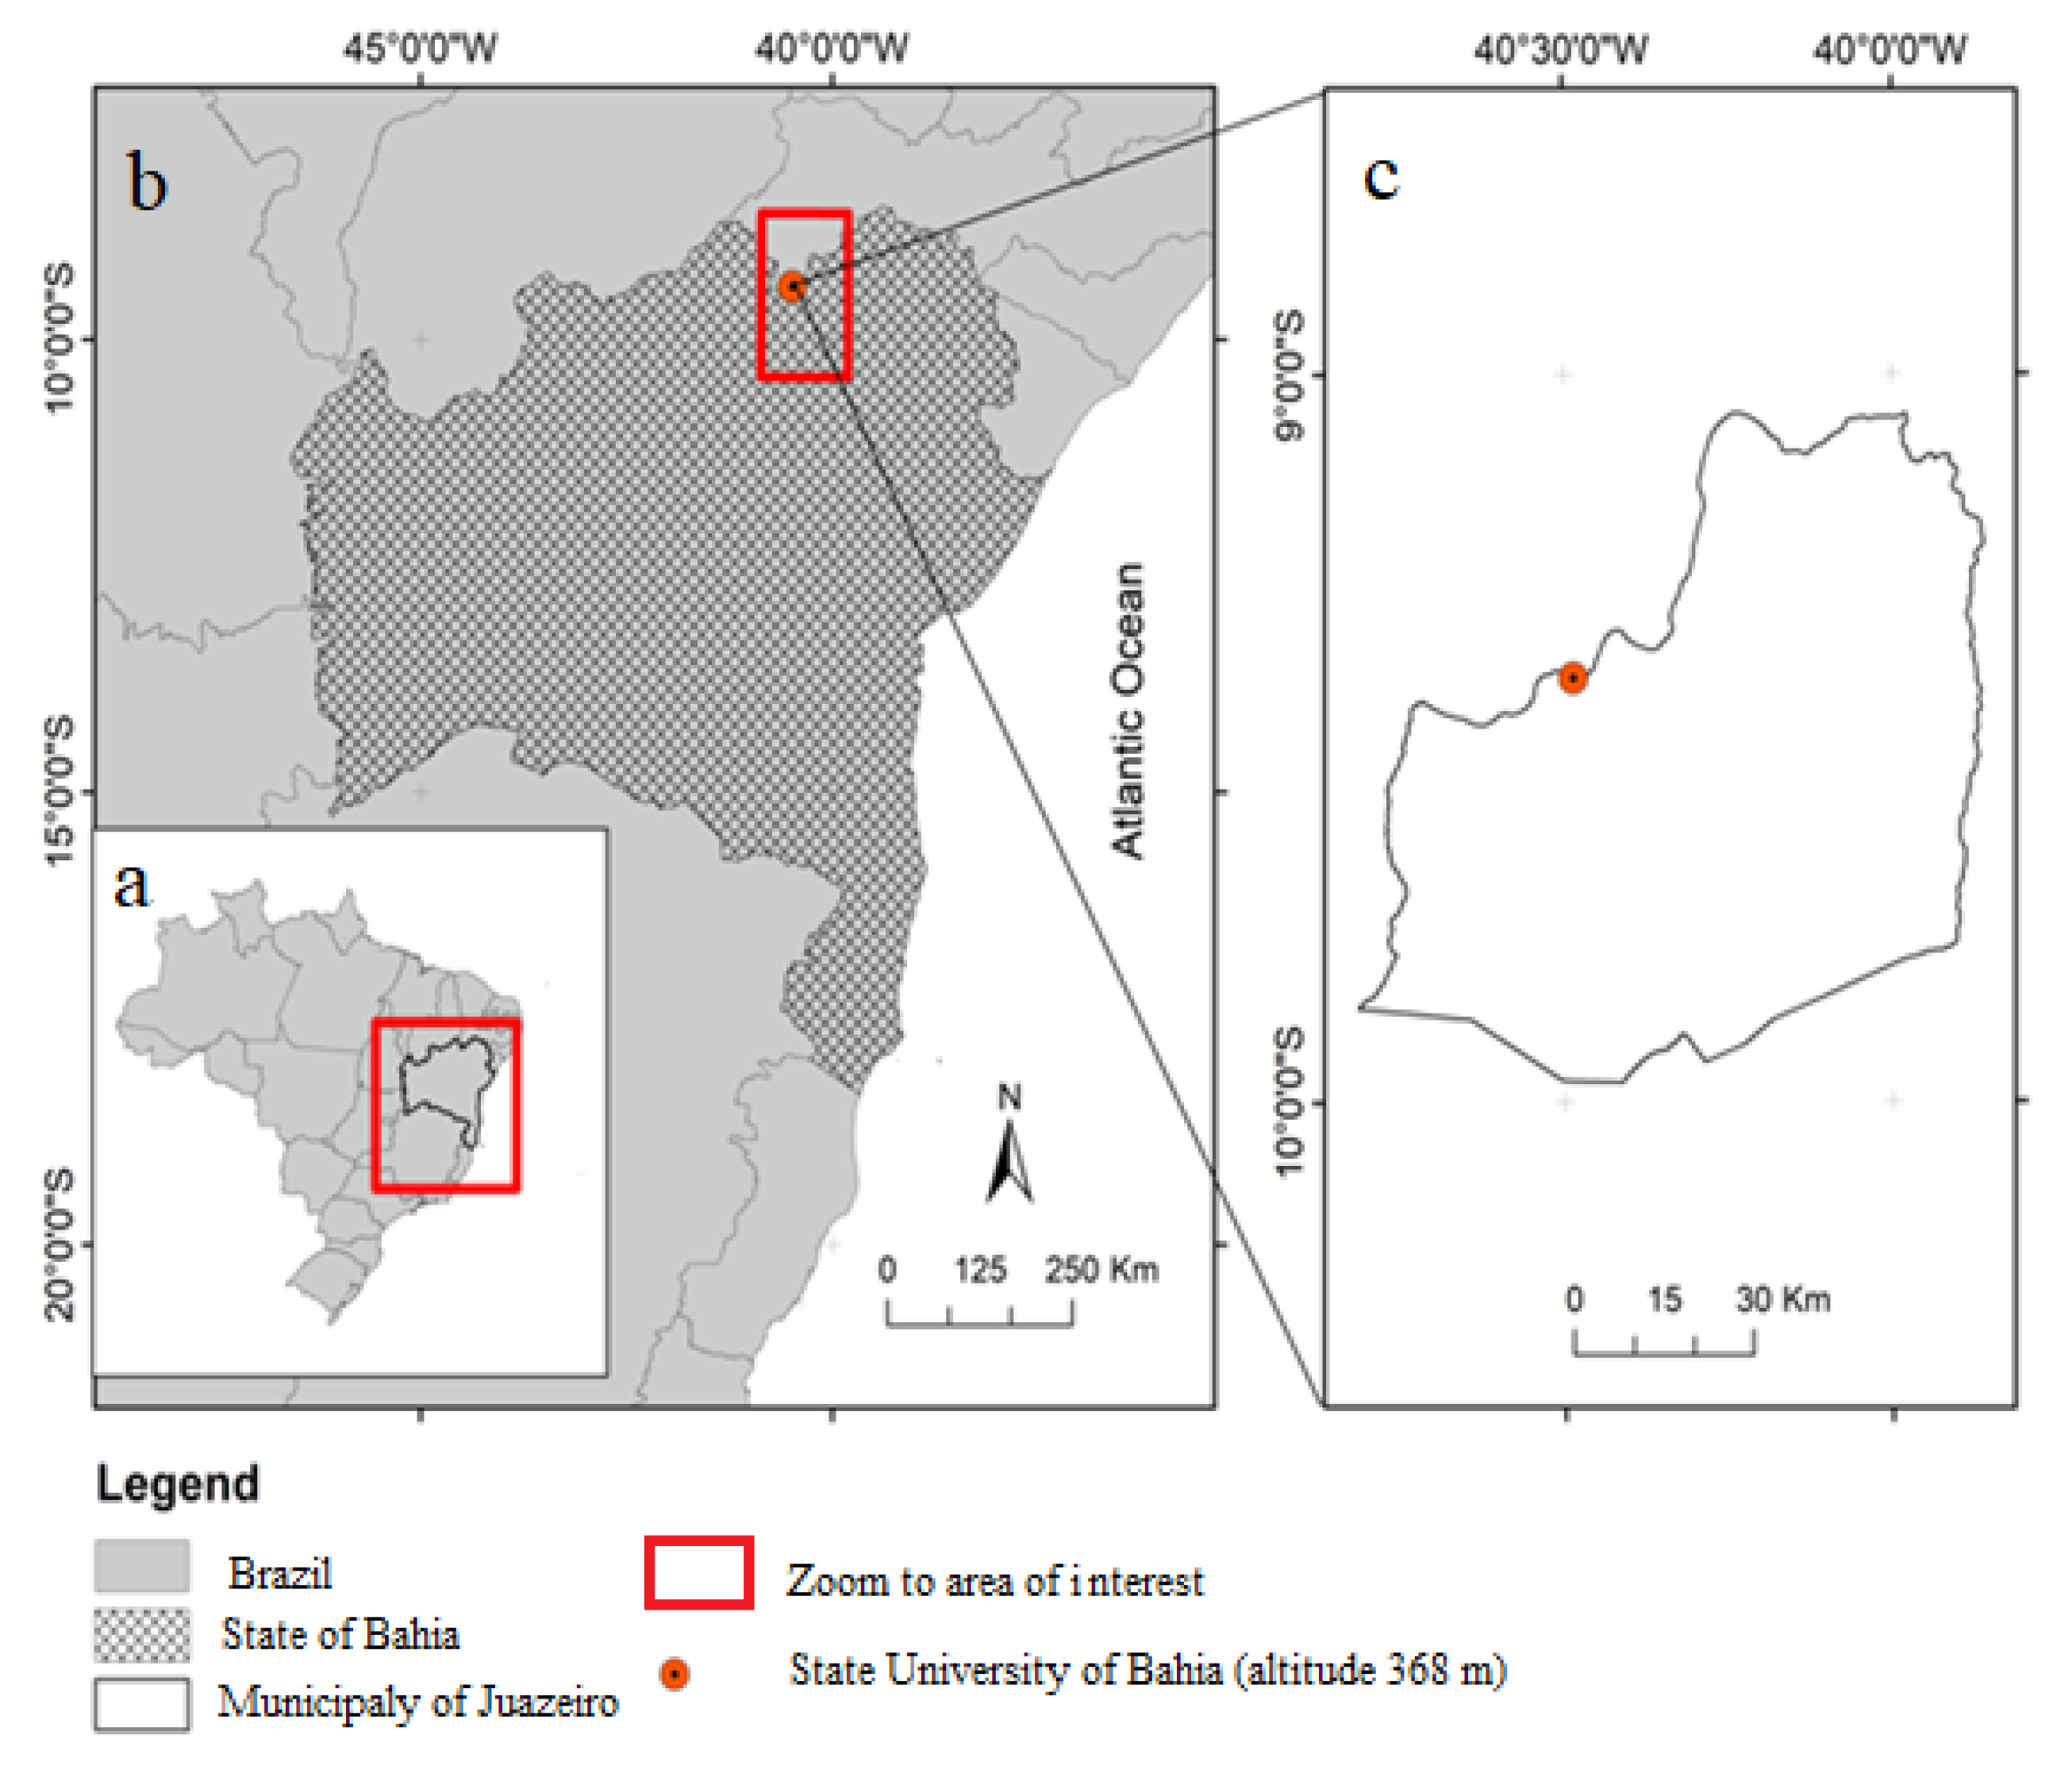
Figure 1. Location geography of Brazil (a), State of Bahia (b) and study area (c).
Agriengineering 07 00340 g001
Figure 2. DJI Phantom 4 multirotor UAV, (a) Radio Control and Calibration Panel; (b) Mapir Survey 3 (R-G-NIR) Multispectral Camera.
Agriengineering 07 00340 g002
Figure 3. Flight planning flowchart.
Agriengineering 07 00340 g003
Figure 4. Flowchart of classification and validation of UAV images.
Agriengineering 07 00340 g004
Figure 5. User accuracies for the thematic treatments analyzed, days after transplanting (DAT), in melon grown the hot period.
Agriengineering 07 00340 g005
Figure 6. Producer accuracies for the analyzed thematic treatments, days after transplanting (DAT), in melon grown the hot period.
Agriengineering 07 00340 g006
Figure 7. User accuracy for the thematic treatments analyzed, days after transplanting (DAT), in melon grown the cold period.
Agriengineering 07 00340 g007
Figure 8. Producer accuracy for the thematic treatments analyzed, days after transplanting (DAT), in melon grown the cold period.
Agriengineering 07 00340 g008
Figure 9. Global Accuracy (%) and Kappa Index of the analyzed thematic treatments, as a function of the days after transplanting (DAT) of the melon plant, hot period (a,b), cold period (c,d).
Agriengineering 07 00340 g009
Figure 10. Map of use and coverage of the study area for different treatments and DAT (a)—14, (b)—17, (c)—29, (d)—46, (e)—56, of melon, hot period.
Agriengineering 07 00340 g010
Figure 11. Map of use and coverage of the study area for different treatments and DAT: (a)—22, (b)—44, (c)—59, (d)—62, (e)—66, of melon, Cold period.
Agriengineering 07 00340 g011
Figure 12. NDVI maps for and DAT (a)—14, (b)—17, (c)—29, (d)—46, (e)—56, in melon cultivated in the municipality of Juazeiro-BA (Brazil). Warm period: October to December 2019.
Agriengineering 07 00340 g012
Figure 13. NDVI maps for DAT: (a)—22, (b)—44, (c)—59, (d)—62, (e)—66, in melon cultivated in the municipality of Juazeiro-BA (Brazil). Cold period: June to August 2020.
Agriengineering 07 00340 g013
Figure 14. Linear regressions between Kc-FAO (moving average) of melon cultivars and NDVI, for two seasons: hot period (a,b) and cold period (c,d).
Agriengineering 07 00340 g014
Figure 15. Average daily values of solar radiation (MJ m−2 day−1) and total rainfall (mm), for the hot period (a) and cold period (b), melon cultivation.
Agriengineering 07 00340 g015
Figure 16. Average (Tmed), minimum (Tmin) and maximum (Tmax) values of air temperature and average values of relative humidity (URmed) for the hot period (a) and cold period (b), melon cultivation.
Agriengineering 07 00340 g016
Figure 17. Non-linear adjustments of the leaf area index as a function of days after transplanting, for cv. ‘Gladial’ and cv. ‘Cantaloupe’, for hot and cold periods.
Agriengineering 07 00340 g017
Figure 18. Relationship between leaf area index (LAI) and NDVI for cv. ‘Cantaloupe’ in the hot period.
Agriengineering 07 00340 g018
Table 1. Phenological stages, event, dates and days after transplanting (DAT) of melon.
Hot Period
Phenological StagesEventsDateDAT
I—InitialPlanting25 October 20197
II—Development10% ground cover13 November 201919
III—Reproductive80% ground cover4 December 201921
IV—FinalBeginning of fruit maturation harvest21 December 201917
Total cycle (days) 64
Cold Period
I—InitialPlanting26 June 20209
II—Development10% ground cover16 June 202020
III—Reproductive80% ground cover5 August 202020
IV—FinalBeginning of fruit maturation harvest24 August 202019
Total cycle (days) 68
Table 2. Confusion matrix with observation proportions within the map of treatments i and true treatments j.
True Class
j = 1j = cTotal
Expected class ii = 1P1,1 P 1 + = j = 1 c P 1 , j
Pi,j P i + = j = 1 c P i , j
i = cPc,1 P c = j = 1 c P c , j
Total P + 1 = i = 1 c P i , 1 P + j = j = 1 c P i , 1 P + 1 = i = 1 c P i , 1 i = 1 c j = 1 c P i , j = 1
Table 3. Kappa index and its interpretation and classification quality.
Kappa ValuesInterpretationRating Quality
<0.00Absence of agreementTerrible
0.00–0.20Poor concordanceBad
0.20–0.40Light concordanceReasonable
0.40–0.60Moderate concordanceGood
0.60–0.80Substantive agreementVery good
0.80–1.00Almost perfect concordanceGreat
Table 4. Flight date, days after transplanting (DAT), NDVI and Kc-FAO values (moving average) for cv. Gladial, referring to the hot and cold periods.
Hot Period
Flight DayDATNDVI
(Average ± sd)
Kc-FAO
(Moving Average)
1 November140.26 ± 0.020.67
4 November170.28 ± 0.010.58
16 November290.33 ± 0.010.79
3 December460.37 ± 0.011.32
13 December560.35 ± 0.011.18
Cold period
6 July220.09 ± 0.020.71
28 July440.08 ± 0.020.74
12 August590.27 ± 0.020.59
15 August620.18 ± 0.020.58
19 August660.35 ± 0.010.55
sd—standard deviation.
Table 5. Date of flight, days after transplanting (DAT), NDVI and Kc-FAO values (moving average) for cv. ‘Cantaloupe’, referring to the hot and cold periods.
Hot Period
Flight DayDATNDVI
(Average ± sd)
Kc-FAO
(Moving Average)
1 November140.25 ± 0.020.57
4 November170.29 ± 0.020.54
16 November290.33 ± 0.010.80
3 December460.36 ± 0.011.33
13 December560.36 ± 0.021.24
Cold period
6 July220.15 ± 0.020.73
28 July440.17 ± 0.020.76
12 August590.28 ± 0.020.63
15 August620.22 ± 0.020.52
19 August660.31 ± 0.020.60
sd—standard deviation.
Table 6. Statistical indicators of adjusted linear regressions for each period and cultivar: mean absolute deviation (MAD); mean estimation error (MSE); square root of mean square error (RMSE) and percent error (rRMSE); mean absolute percentage error (MAPE); correlation coefficient (r) and coefficient of determination (R2); Willmott index (d) and coefficient c.
Statistical IndicatorsHot PeriodCold Period
cv. ‘Gladial’cv. ‘Cantaloupe’cv. ‘Gladial’cv. ‘Cantaloupe’
MAD0.110.140.030.05
MSE0.000.000.000.00
RMSE0.120.140.030.05
rRMSE12.0014.003.005.00
MAPE6.864.1618.6314.14
R20.830.810.810.67
r0.910.910.910.82
d0.920.900.890.85
c0.760.730.730.69
Disclaimer/Publisher’s Note: The statements, opinions and data contained in all publications are solely those of the individual author(s) and contributor(s) and not of MDPI and/or the editor(s). MDPI and/or the editor(s) disclaim responsibility for any injury to people or property resulting from any ideas, methods, instructions or products referred to in the content.