Abstract
Soil electrical conductivity (EC) and water content are key indicators of soil health, influencing nutrient availability, salinity stress, and crop productivity. Monitoring these parameters is critical for precision agriculture. However, most existing measurement systems are costly, which restricts their use in practical field conditions. The aim of this study was to develop and validate a low-cost, portable system for simultaneous measurement of soil EC, water content, and temperature, while maintaining accuracy comparable to laboratory-grade instruments. The system was designed with four electrodes arranged in two pairs and employed an AC bipolar pulse method with a constant-current circuit, precision rectifier, and peak detector to minimize electrode polarization. Experiments were carried out in sandy loam soil at water contents of 13%, 18%, and 22% and KNO3 concentrations of 0, 0.1, 0.2, and 0.4 M. Measurements from the developed system were benchmarked against a professional impedance analyzer (E4990A). The findings demonstrated that EC increased with both frequency and water content. At 100 Hz, the mean error compared with the analyzer was 8.95%, rising slightly to 9.98% at 10 kHz. A strong linear relationship was observed between EC and KNO3 concentration at 100 Hz (R2 = 0.9898), and for the same salt concentration (0.1 M KNO3) at 100 Hz, EC increased from ~0.26 mS/cm at 13% water content to ~0.43 mS/cm at 22%. In conclusion, the developed system consistently achieved <10% error while maintaining a cost of ~€55, significantly lower than commercial devices. These results confirm its potential as an affordable and reliable tool for soil salinity and water content monitoring in precision agriculture.
1. Introduction
Maintaining healthy, fertile soil requires frequent and rapid monitoring of electrical conductivity (EC), soil water content, and temperature, because EC is a direct indicator of soluble-salt content—and thus salinity stress—while temperature and water availability regulate microbial activity and nutrient uptake, ultimately affecting crop establishment and yield [1,2,3,4].
Several methods have been proposed for measuring soil EC. A widely used approach relies on electrode-based techniques, in which the measurement is performed directly in contact with the soil [5,6,7,8,9,10,11]. This approach is simple and low-cost, yet its accuracy can be degraded by electrode polarization and resistance at the soil–electrode interface. Time domain reflectometry provides simultaneous measurement of soil water content and EC but requires more complex and expensive instrumentation [12,13]. Impedance spectroscopy has also been employed to characterize soil EC across a wide frequency range, offering rich information at the expense of higher cost and complexity [14]. Despite these limitations, electrode-based AC techniques remain attractive for agricultural applications due to their simplicity, low cost, and portability—provided that proper circuit design and calibration are used to mitigate polarization and interface effects. Recent work further supports the reliability of this class of methods when improved electronic circuits and data-processing algorithms are adopted [15].
Soil water content is equally important and can be determined using gravimetric or volumetric procedures as well as dielectric sensors. Although gravimetric drying is the laboratory reference for soil-water-content determination, it is labor-intensive and time-consuming, whereas dielectric techniques—such as frequency- and capacitance-based sensors—enable rapid measurements suitable for repeated field use [11,16,17,18]. Notably, recent years have seen growing reliance on wireless sensor networks in field deployments, enabling spatially distributed, real-time monitoring of soil water content and related parameters [19,20,21].
Integrated and portable systems that assess soil temperature, soil water content, and EC together can substantially benefit precision agriculture, allowing practitioners to adapt promptly to changing soil conditions and optimize resource use. Various circuits have been developed to measure soil EC, often incorporating wireless communication units, microcontrollers, or signal-processing modules, and their reliable operation depends on careful design and implementation [22]. In addition, recent studies indicate that the frequency used for EC measurements is related to salt concentration in the soil, and precise monitoring therefore requires understanding the interplay among frequency, ion concentration, and soil water content [23].
Therefore, the objective of this study was to design and validate a low-cost, portable system for the simultaneous measurement of soil electrical conductivity, soil water content, and temperature using an AC bipolar pulse technique to minimize polarization effects and benchmark its performance against laboratory-grade measurements.
This study presents a dependable, lightweight, portable system for direct field measurement of soil temperature, soil water content, and EC. The device integrates a soil temperature sensor, a capacitive sensor for soil water content, and an AC bipolar pulse technique for impedance measurement determined by the constant current and voltage across the electrodes [24,25]. Four electrodes, arranged in two pairs, serve as EC and water-content sensors. The AC bipolar pulses used for EC monitoring are generated by a circuit that includes a peak detector, a precision half-wave rectifier, and a constant-current bipolar stage, which together minimize ion build-up and electrode corrosion and thus improve stability and accuracy.
An impedance analyzer was used both to benchmark the developed circuit and extract useful information across soil types, while the study investigated how frequency, EC, soil water content, and salt concentration are interrelated; at lower frequencies, the influence of parasitic capacitive and inductive effects in the electrode path is reduced, supporting more stable measurements.
While numerous soil EC measurement methods have been reported, ranging from direct-current probes to wireless sensing systems [26,27], the present work introduces a novel low-cost solution based on a custom analog architecture. Its originality lies in the implementation of an AC bipolar pulse technique, generated via a precision summing-amplifier configuration, to minimize electrode polarization and enhance signal stability. Unlike approaches that rely on ready-made modules or simplified excitation sources, the system features a dedicated analog front end that combines a constant-current generator, a precision rectifier, and a peak detector. This design enables accurate EC measurements over a wide frequency range (100 Hz to 10 kHz), making the approach suitable for diverse soil conditions. Moreover, the system’s performance was validated directly against a professional impedance analyzer (E4990A), with mean errors consistently below 10% across all test frequencies and salt concentrations. This comparison, rarely found in low-cost designs, demonstrates the system’s reliability.
The remainder of this paper is structured as follows: Section 2 presents the materials and methods used for the design and implementation of the proposed sensor system, including details on the experimental setup, electronic circuits, and measurement procedure. Section 3 discusses the results obtained from the experiments, including performance evaluation and comparison with a commercial impedance analyzer. Finally, Section 4 summarizes the conclusions and outlines future directions for improvement and application of the system.
2. Materials and Methods
2.1. The Experimental Setup
The experimental setup for measuring the soil conductivity, water content, and temperature sensors is presented in Figure 1, where (a) the sensors are outside the soil, and (b) the sensors are placed in the soil. It consists of a portable electronic circuit on a PCB (Printed Circuit Board) that uses a microcontroller to generate bipolar pulses of specific frequencies, displays the results on a screen, and sends the data to other devices via the SPI (Serial Peripheral Interface).
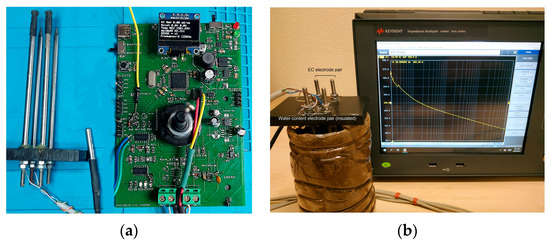
Figure 1.
(a) Measurement system with PCB (Printed Circuit Board) circuit and sensor design; (b) sensors placed in soil.
The design of the soil conductivity and water-content sensor was based on four metallic electrodes divided into two pairs. The first pair measures the soil resistance, and the second pair measures the soil capacitance, as shown in Figure 2.
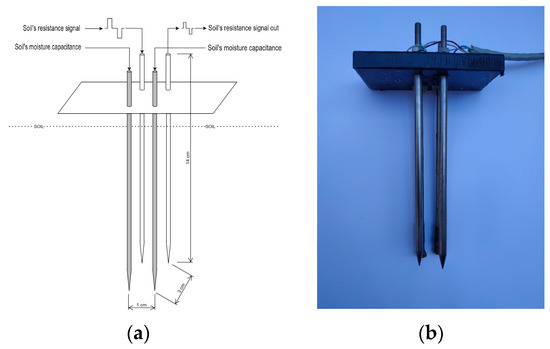
Figure 2.
Resistance and water content measurement of the soil sensor: (a) design; (b) real.
Two electrodes were used for the soil resistance measurements. The first electrode introduces a pulse current of constant amplitude into the soil, while the second electrode measures the voltage drop between the two electrodes caused by the current pulse through the soil resistance. The voltage measurement is amplified by an operational amplifier using the soil resistance as Rgain, resulting in the amplifier’s output being proportional to the soil resistance.
For soil water content measurement, the second pair of electrodes was used to measure the capacitance, which was affected by the soil water content. The second pair of electrodes had an insulating cover to ensure that only the capacitance arising from the electrostatic field between them was measured, ensuring that the measurement was exclusively influenced by electrostatic effects and not by soil conductivity. The distance between the electrodes within each pair was 1 cm, while the distance between the two pairs was 3 cm to minimize the noise and the interactions between the two pairs caused by the resistance measurement.
The length of the electrodes in this sensor is 14 cm, while only 12 cm are placed in the soil. It should be noted that the current implementation of the sensor, while effective in controlled conditions, presents certain practical limitations. The choice of long electrodes (12–14 cm insertion) was not arbitrary; it resulted from several iterations and practical experiments. During preliminary testing, we evaluated a range of electrode lengths to identify the optimal trade-off between measurement stability and sensitivity. We observed that shorter electrodes (<10 cm) produced higher signal variability and less representative measurements of the bulk soil properties, while excessively long electrodes (>14 cm) significantly increased sensor resistance and noise, particularly in soils with lower conductivity. Thus, the selected length was chosen to provide more stable and representative measurements over a larger soil volume while avoiding excessive resistance.
The measurement system scheme is presented in Figure 3. The BQ24075 integrated circuit was chosen to accurately control charging and discharging, ensuring the safety and performance of the battery. The DS18B20 temperature sensor was used to measure the soil temperature, providing measurements with an accuracy of ±0.5 °C. The MAX1771 IC was used in the voltage boosting circuit, the ICL7660 IC was selected to convert the positive voltage to negative, and the L7808 and L7908 voltage regulators were used to produce stable voltages of ±8 V, ensuring a stable power supply to produce bipolar AC pulses. AMS1117 reduces the voltage, providing a steady output with a maximum current of 1 A.
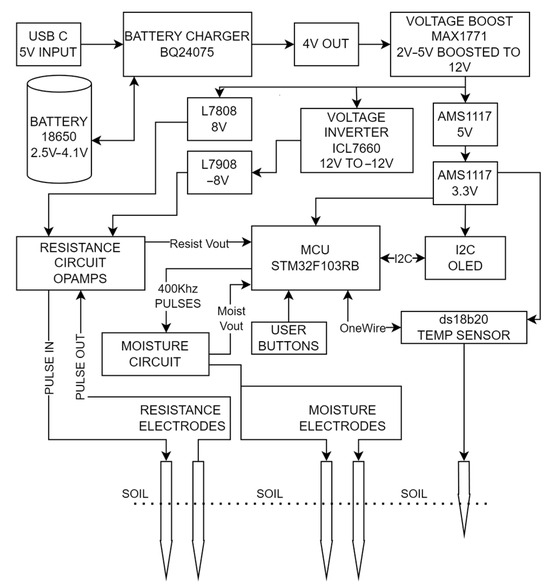
Figure 3.
Measurement system scheme.
The total cost of the proposed soil measurement system is around €55. This includes all the key components, such as the STM32F103RB microcontroller, signal-processing ICs, voltage regulators for ±8 V operation, the DS18B20 temperature sensor, stainless steel electrodes, a custom-made PCB (Printed Circuit Board), a small display module and casing materials. In comparison, most commercially available portable systems that measure soil EC and moisture—such as the Decagon 5TE, Vegetronix VH400, or Hanna HI98331—typically cost more than €150.
2.2. EC Sensor Circuit
A block diagram of the entire process and steps for measuring soil resistance is presented in Figure 4.
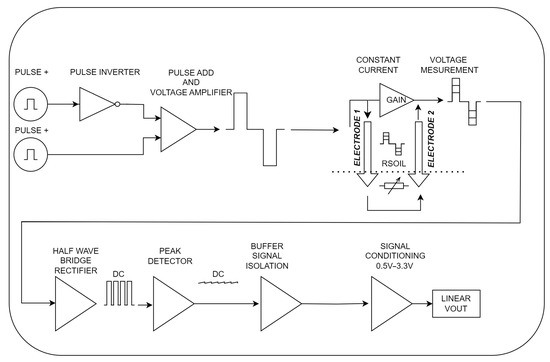
Figure 4.
Diagram of resistance measurement circuit.
In the first stage, two sequential DC pulses from two different outputs of the microcontroller (STM32F103RB) were received, each with an output voltage of 3.3 V, as shown in Figure 4. To prevent polarization of the electrodes, which causes the accumulation of soil ions on their surface, bipolar AC pulses were generated. This technique helps to increase the lifespan of the electrodes and ensures more accurate and stable measurements. Using this method, the electrodes can withstand longer periods without oxidation, even under harsh environmental conditions.
To achieve this, the first microcontroller output, which is shown in Figure 5 as source V1, is connected to an inverting amplifier (U1A) to change the polarity. The output of the second microcontroller (V2) is not inverted but has a time delay. Subsequently, the two pulses were directed to an inverting summing amplifier (U1B) to merge and amplify them to reach the highest possible potential (Equation (1)). (Supply voltages VSS = +7.8 V, VDD = −7.8 V)
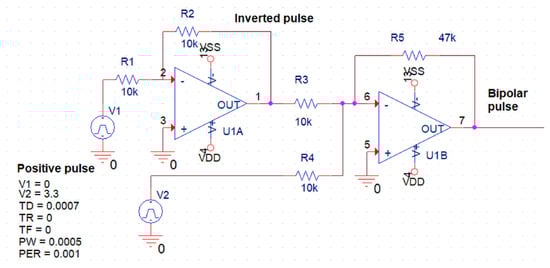
Figure 5.
Bipolar pulse generator circuit.
The simulation results for the combined pulses are shown in Figure 6.
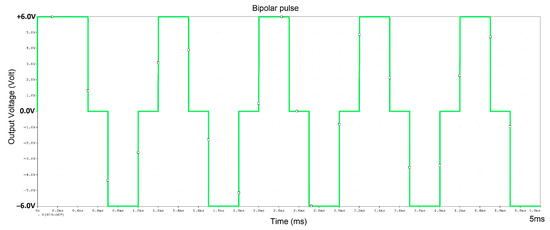
Figure 6.
Bipolar pulse simulated output voltage.
The next stage was a soil conductivity sensor amplifier, which consisted of an inverting amplifier that used the conductivity of the sensor inside the soil. The bipolar pulse of the first stage was applied to the resistor R6. As shown in Figure 6, both the positive and negative parts of the bipolar pulse were at a constant potential of ±6 V. The symmetric potential applied to resistor R6 causes a symmetric current through R6 at a constant value of ±0.5 mA. This current passes through the electrodes to the soil and produces a voltage difference depending directly on the soil resistance according to Ohm’s law. Consequently, the input pulse voltage was amplified by the factor of (−Zsensor/R6) (Equation (2)). Impedance, known as Z, can exhibit both real ohmic and capacitive behavior, reflecting the complex nature of a circuit element. Figure 7 shows the conductivity amplifier circuit of the soil.
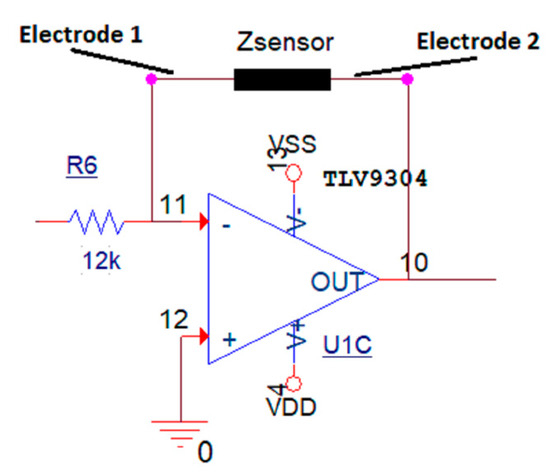
Figure 7.
Soil conductivity amplifier circuit inducing constant pulse current through sensor.
The usual values of the soil resistance for the usual moisture measured between the two electrodes were 10–3000 Ω. Figure 8 shows the simulated voltage output of the soil sensor amplifier circuit over time using different soil resistance values (10–3000 Ω) as the variable parameters. Additionally, a linear behavior was observed as the soil resistance value increased, which is significant for reliable measurements of the circuit.
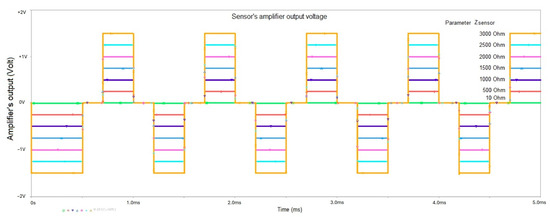
Figure 8.
Simulated soil conductivity amplifier output for Zsensor values 10 to 3000 Ω.
In the next stage, after estimating the soil resistance in the form of AC voltage pulses, it was necessary to convert the signal to DC for further processing. Therefore, a half-wave rectifier circuit with an operational amplifier was used to ensure high accuracy in the output voltage, as shown in Figure 9.
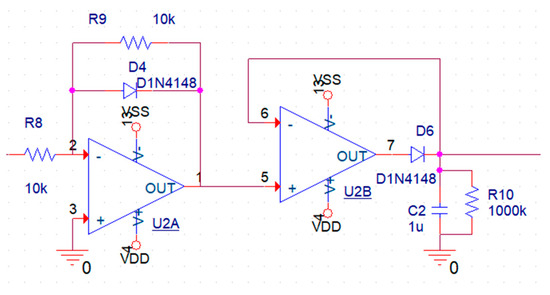
Figure 9.
Signal semi rectification and peak detection.
At this point, it is important to note that although the half-wave rectifier suppresses the negative parts of the signal; it does not affect the process because the resistance is estimated with a positive pulse.
The half-wave rectifier (U2A) is used to cut off the negative voltages (below −0.6 V), and with the next circuit, which is a peak detector implemented by an operation amplifier (U2B), the signal is stabilized at its peak value. Capacitor C2 is used to smooth and hold the voltage, and resistor R10 is connected to allow a small capacitor discharge current so that the system can show a lower voltage if a new measurement has a smaller output.
Figure 10 shows the simulated output of the operational amplifier U2B, which maintains the peak voltage.
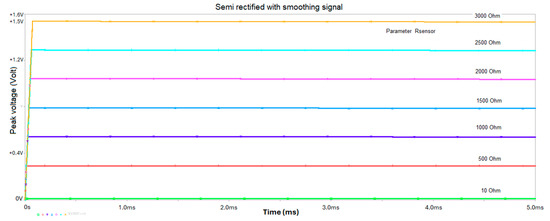
Figure 10.
Simulated voltage output of semi rectification and peak detector.
Finally, the stabilized signal was directed to a buffer (U2C) to isolate the stages, as shown in Figure 10.
The soil resistance input area was 10–3000 Ω. For these values as input, the soil conductivity amplifier, using Equation (2), outputs 0.005 V to 1.5 V, respectively. Finally, the desired limits at the circuit output U2D were 0.5 V to 3 V, respectively. For these values and VDD = 7.8 V, the calculated resistor values are R11 = 7.538 kΩ, R12 = 200 kΩ, R13 = 100 kΩ, and R14 = 73.527 kΩ, as shown in Figure 11.
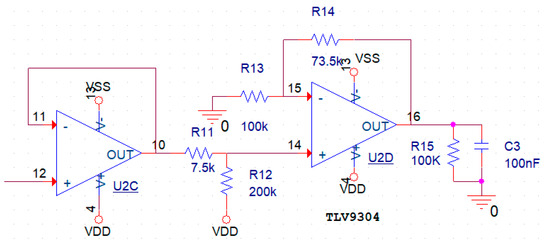
Figure 11.
Conditioning circuit at the final stage.
The simulated output voltages are shown in Figure 12. The minimum voltage is 0.2 V due to an offset voltage that is induced at U1D and U2B. The maximum voltage was 3.05 V and is very close to the desired value.
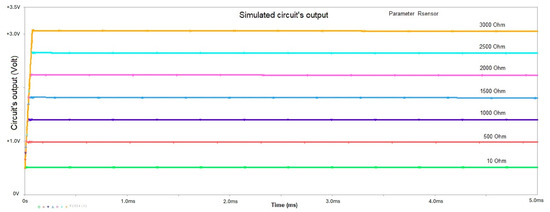
Figure 12.
Simulated voltages at the circuit’s output.
2.3. Soil-Water-Content Sensor Circuit
To estimate the water content in the soil, a circuit was initially developed that includes a high-frequency source, as shown in Figure 13, and is based on the circuit proposed by [28]. The microcontroller generated a square-wave signal with a frequency of approximately 400 kHz and a duty cycle of 50%.
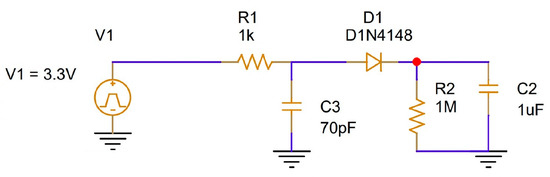
Figure 13.
Soil-water-content sensor circuit.
This signal was fed into a low-pass filter, which was designed to attenuate high-frequency signals while allowing low-frequency signals to pass. The filter consists of a 1 kΩ resistor (R1) and a capacitor (C3).
In this context, the capacitor C3 is actually a capacitive sensor immersed in the soil, consisting of two electrodes that have an insulating cover to prevent direct contact between the metal, soil, and water. The capacitance of the soil is measured based on the amount of water it contains, because the presence of water affects the dielectric constant of the soil and alters its capacitance. As the soil capacitance changed, the cutoff frequency of the low-pass filter also changed. When the soil capacitance increased, the signal amplitude was attenuated. This method allows for the estimation of water content changes in the soil.
Subsequently, the signal from the filter is directed to a peak detector, which converts alternating current (AC) to direct current (DC). The triangular output signal from the low-pass filter was fed into the half-wave rectification circuit, which consisted of a 1N4148 diode connected in series to produce a DC signal. To improve the signal and reduce the ripple, a 1 MΩ resistor is connected in parallel with a 1 µF capacitor. The ends of the resistor and capacitor are connected to the grounding electrode. The series connection of the diode prevents the full discharge of the capacitor when the signal has low voltage, causing the capacitor to discharge only through the 1 MΩ resistor. This resulted in a discharge time constant of one second, providing a reliable and stable measurement of soil water content that can be fed into an analog input of the microcontroller to provide the percentage water content in the soil.
As shown in Figure 14, the sensor output (V) decreases monotonically as the gravimetric water content (θv, ref, %) increases from 10% to 50%. Throughout the manuscript, we denote volumetric water content as θv and the gravimetric reference as θv, ref.
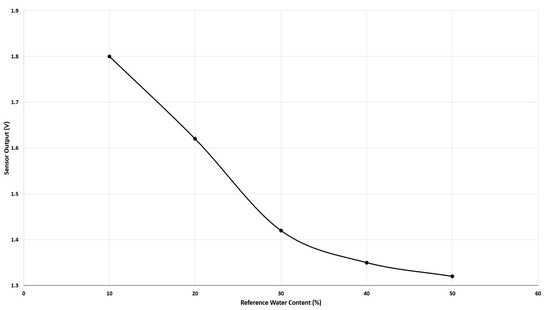
Figure 14.
Sensor output voltage (V) versus gravimetric water content (θv, ref, %). Measurements show a strictly monotonic decrease of Vout as θv, ref increases from 10% to 50%.
Specifically, for a water content of 10%, the output voltage of the sensor is 1.8 V, and for a content of 50%, the voltage decreases to 1.32 V. This inverse relationship suggests that the sensor can detect changes in soil moisture, providing lower voltages for higher water content. The voltage line shows a steady decrease as the water content increases, confirming the sensitivity of the sensor to changes in moisture. The practical detection limit of the proposed device is estimated at around 60%, beyond which the measurements become less reliable due to signal saturation. Beyond this range, the output voltage approaches the lower detection limit of the system, making it difficult to distinguish further increases in water content.
2.4. Measurement Methods
To ensure reliable and standardized calibration of the soil water-content sensor, the gravimetric method was used as the reference. Specifically, a known volume of soil (600 cm3) was dried in an oven at 105 °C for 24 h to obtain its dry mass. Deionized water was then added in controlled quantities to reach the desired water content levels. This procedure enabled accurate calculation of the volumetric water content (θv), which was subsequently used to calibrate the capacitive soil water-content sensor.
A specific type of soil was selected for the experiments, consisting of 72% sand, 21% silt, and 5% clay (sandy loam). Experiments were conducted at a constant soil temperature of 23 °C. Previous studies have shown that soil EC varies by approximately 2% per °C in the temperature range 15–35 °C [29]. A specific volume of soil equal to 600 cm3 was selected for all experiments, which was dried in an oven at 105 °C for 24 h.
In the experiments each soil sample received a specific volume of deionized water to reach the target water content (θv = 13%, 18%, or 22%). For each experimental group the required mass of KNO3 was first dissolved in this volume of deionized water to achieve the desired final concentration (0, 0.1, 0.2, or 0.4 M) in the soil solution. In the case of 0 M, only deionized water was added, without any KNO3. The resulting KNO3 solution was then added to the dry soil and thoroughly mixed to ensure even distribution throughout the sample. This procedure ensured that both the soil moisture and the KNO3 concentration were precisely controlled according to the experimental method.
Soil EC measurements were performed using two different measuring instruments for comparison: an impedance analyzer and a circuit. The impedance analyzer was an E4990A with a frequency range of 20 Hz to 20 MHz. We used it for measurements from 100 Hz to 100 kHz to study the impedance between the two electrodes. The circuit is used for frequency measurements from 100 Hz to 10 kHz, because at higher frequencies, the circuit faces operational limitations owing to power amplifiers.
The EC was calculated from the impedance measurements, using the method for resistivity determination described in [30]. No temperature correction was applied to normalize EC values to the standard reference temperature of 25 °C. Future versions of the measurement system could implement an automated temperature correction function, which is standard practice in laboratory EC meters.
Experiments were performed at four different concentrations with three water content levels (13%, 18%, and 22%). A water content of 13% was considered as tillage moisture, and 22% represented field capacity [31]. These water content levels correspond to the sandy loam soil used in the experiments, as the values of tillage moisture and field capacity depend on the soil type.
To measure the water content, the sensor was initially calibrated according to a previous study [32]. The volumetric amount of water contained in the sample was calculated from capacitance measurements between the two insulated electrodes. A temperature sensor was placed in the soil and used to ensure temperature consistency during the measurements. In this study, measurements were conducted at a constant temperature of 23 °C to minimize temperature-related variability.
We then calibrated the probe against a gravimetric reference (oven-dry at 105 °C; fixed soil volume of 600 cm3). Nine moisture levels spanning approximately 10–50% θv (≈ 5% steps) were prepared, and at each level, the sensor output voltage (Vout) was recorded. A linear calibration model was fitted to predict θv from Vout, θv = a + b·Vout.
This research focused on studying the correlation between signal frequency, salt concentration, and water content, while also analyzing the errors between the two measuring instruments. The results are presented in the next section.
3. Results and Discussion
For the water-content sensor performance versus the gravimetric reference, the calibration yielded the linear model θv(%) = 141.06 − 74.26·Vout (V), with 95% CIs [111.77, 170.35] for the intercept and [−93.72, −54.80] for the slope (9 moisture levels). Goodness-of-fit metrics were R2 = 0.921, RMSE = 3.63% θv, MAE = 3.02% θv, and negligible bias (~0.00% θv). The slope corresponds to a sensitivity of −74.26% θv per volt (≈−0.01347 V per 1% θv). Leave-one-out cross-validation yielded RMSE = 4.67% θv and MAE = 3.91% θv, providing a conservative estimate of out-of-sample performance with limited data. The response was strictly monotonic, decreasing across 10–50% θv, which defines the tested operating range. Table 1 shows the four different concentrations (M) of KNO3 used in the experiments.

Table 1.
Potassium nitrate concentrations used to assess salinity effects on sensor readings: 0, 0.1, 0.2, 0.4 M.
Three levels were used to measure the water content by volume, as presented in Table 2.
Table 2.
Target volumetric water content (θv, %) levels set gravimetrically: A = 13% θv, B = 18% θv, C = 22% θv.
Figure 15 shows the graph showing the relationship between EC and frequency in Hertz (Hz) for two different measuring instruments: the circuit and the impedance analyzer. Conductivity was measured at four different salt concentrations (C1, C2, C3, and C4) for a constant water content of 13%.
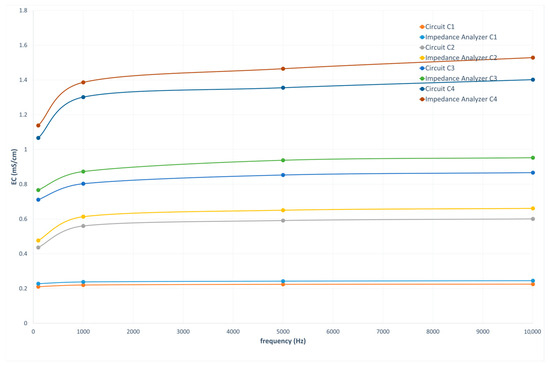
Figure 15.
Plot of EC in mS/cm versus frequency (Hz) for four different concentrations (C1 = 0 M, C2 = 0.1 M, C3 = 0.2 M, C4 = 0.4 M) at θv = 13%. Comparison between the developed circuit and an impedance analyzer. EC increases with frequency and with salt concentration; analyzer reports slightly higher EC than the circuit.
The general trend observed was that EC increased with increasing frequency for all salt concentrations for both gauges. In addition, it appears that the impedance analyzer shows slightly higher conductance values than the circuit for the same concentrations and frequencies. This suggests that the soil exhibits various levels of polarization and ion mobility that affect conductivity at different frequencies. The curves show that EC was higher for higher salt concentrations (C4 > C3 > C2 > C1). This is expected because a higher ion concentration (due to more salts) leads to higher conductivity. The circuit exhibited limitations at higher frequencies (above 10 kHz). Table 3 presents the average errors per frequency for all concentrations between the circuit and the impedance analyzer.
Table 3.
Mean relative error (%) of EC measured by the developed circuit versus an impedance analyzer at each frequency: 8.95% (100 Hz), 8.99% (1 kHz), 9.44% (5 kHz), 9.98% (10 kHz). Errors remain <10% across the tested band.
A gradual increase in mean error was observed as the frequency increased. At low frequencies the impedance has negligible capacitive and inductive behavior. At higher frequencies, parasitic effects (e.g., inductance and capacitance) and electromagnetic noise become more pronounced. With a high degree of confidence, we can assume that resistance Z approaches ohmic. The average error increases from 8.95% at 100 Hz to 9.98% at 10,000 Hz. The errors remain relatively low and close to each other at all frequencies, indicating that the two instruments have similar deviations, regardless of the measurement frequency. The stability and comparatively low increase in error with increasing frequency show that the two instruments measure consistently; however, there is a slight increase in deviations at higher frequencies. This may be a result of the properties of the ingredients or the measurement conditions.
The mean error observed in this study falls within the typical accuracy range reported for portable soil EC measurement devices in both recent and earlier research. Previous studies have demonstrated that portable sensor systems, including those based on advanced techniques such as time domain transmissiometry, can still exhibit measurement errors influenced by soil type, salinity levels, and environmental variability. The accuracy achieved by the proposed system is therefore consistent with values reported in the literature for comparable low-cost EC sensor designs, indicating that it is suitable for practical agricultural applications requiring rapid and reliable estimation of soil salinity [12,22].
Figure 16 shows the relationship between EC and frequency in Hertz (Hz) for three different sets of water content measurements (A, B, C) at a concentration of 0.1 M using two instruments: the implemented circuit and the impedance analysis analyzer.
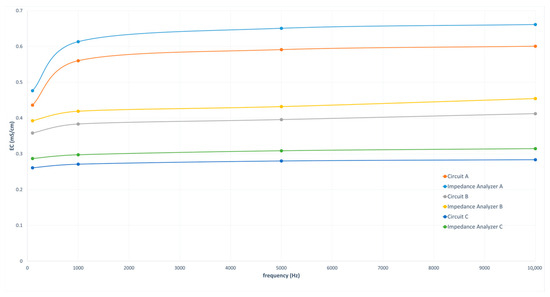
Figure 16.
EC (mS/cm) versus frequency (Hz) at 0.1 M KNO3 for three water content sets: A = 13%, B = 18%, C = 22%. Both instruments show increasing EC with frequency; analyzer values systematically exceed circuit values.
In all cases, EC increased with frequency, a trend consistently observed across all measurements, regardless of the instrument or dataset. The impedance analyzer generally reported higher conductance values than the developed circuit for the same datasets and frequencies, indicating a systematic discrepancy between the two instruments. Among the measurement sets, conductivity varied, with set A showing the highest values and set C the lowest, reflecting differences in salt concentration or other sample characteristics.
A general trend of increasing error with increasing frequency was observed, particularly for C2 with a water content of 22%. The errors were relatively similar at all frequencies, with the largest deviation observed at 10,000 Hz for the C content. Errors remained below 11% across all frequencies and concentrations.
Figure 17 illustrates the relationship between electrical conductivity (EC, mS/cm) and frequency (Hz) for four salt concentrations (C1–C4) at a water content of 22%. An algorithmic trend line fitted to the C1 data yielded a coefficient of determination of R2 = 0.932, indicating that 93.2% of the variability in EC was explained by frequency. This strong correlation confirms the reliability of the measurement approach for the C1 condition.
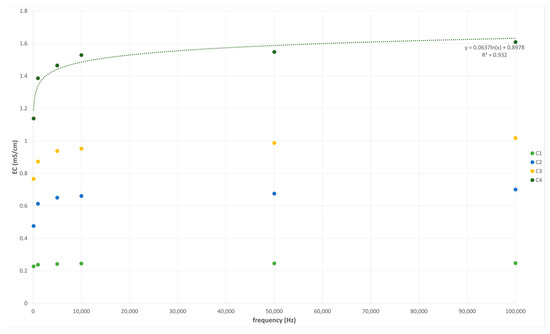
Figure 17.
Plot of EC versus frequency (Hz) for four different salt concentrations (C1, C2, C3, and C4) at water content of 22%.
Figure 18 presents the relationship between EC (mS/cm) and frequency (Hz) for three measurement sets (A, B, and C) at a salt concentration of 0.4 M. For dataset A, the logarithmic trend line achieved a coefficient of determination of R2 = 0.932, indicating that frequency accounted for 93.2% of the variation in EC, thus confirming a strong correlation between the two variables.
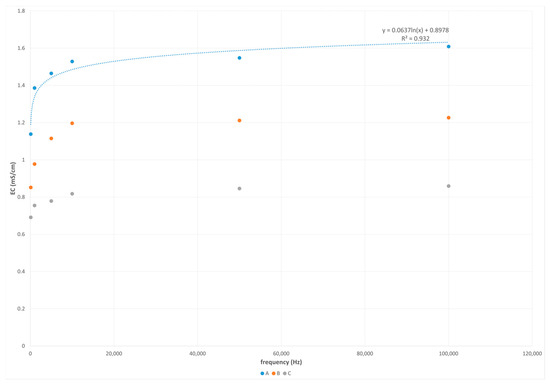
Figure 18.
EC versus frequency (Hz) for three different sets of measurements (A, B, and C) at a 0.4 M concentration.
The plot in Figure 19 illustrates the relationship between KNO3 concentration (M) and EC in mS/cm at a frequency of 100 Hz. The linear voltage line is described by the following equation:
with a coefficient of determination of R2 = 0.9898.
Y = 2.2822x + 0.253
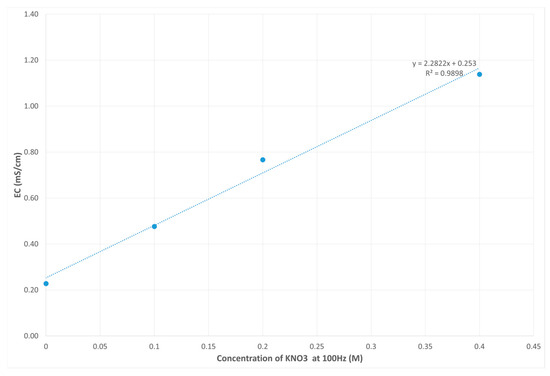
Figure 19.
EC (mS/cm) versus KNO3 concentration (M) at 100 Hz. Linear fit shows EC rising linearly with salt concentration.
EC increased linearly with KNO3 concentration at 100 Hz, as confirmed by the trend line equation, highlighting the strong influence of salt concentration on solution conductivity.
The graph in Figure 20 illustrates the relationship between water content in percentage (%) and EC in mS/cm for four different salt concentrations (C1, C2, C3, and C4) at a frequency of 100 Hz.
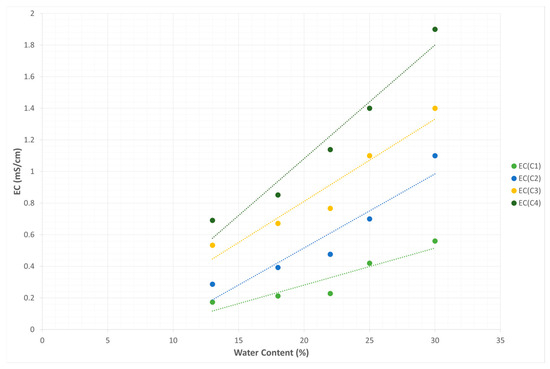
Figure 20.
EC (mS/cm) versus water content % at 100 Hz for C1–C4 (0–0.4 M KNO3). EC increases approximately linearly with water content % for all concentrations.
The trend lines show that there is a linear relationship between water content and EC for all salt concentrations. Conductivity increased as the water content increased.
4. Conclusions
This study demonstrated the effectiveness of a portable system for measuring soil EC, water content, and temperature. The study included experiments with different concentrations of KNO3 and moisture levels in a sandy loam soil using two measuring instruments: an impedance analyzer and a specially designed circuit. Although the system was validated only on sandy loam, future work will focus on other soil types to confirm the generalizability and robustness of the method. The main findings of the research include that EC increases with increasing frequency for all salt concentrations for both gauges. The impedance analyzer showed slightly higher conductance values than those of the circuit for the same concentration and frequency. The circuit faced limitations at higher frequencies (above 10 kHz). A gradual increase in the mean error was observed as the frequency increased from 8.95% at 100 Hz to 9.98% at 10,000 Hz. The errors remain relatively low and close to each other at all frequencies, indicating that the two instruments have similar deviations, regardless of the measurement frequency.
EC increased with increasing salt concentration and water content. The trend lines show that there is a linear relationship between water content and EC for all salt concentrations. The system developed provides reliable and accurate real-time measurements, and it is a useful tool for agricultural and environmental monitoring.
The correlations between frequency, salt concentration and water content contribute to a better understanding of soil dynamics and can help make better agricultural decisions. This study demonstrated that modern electronic systems and measurement methods can significantly improve soil health monitoring and sustainable agriculture by providing accurate and reliable real-time information.
In the future, we plan to test the system with a wider range of frequencies and to add automated temperature compensation. We also want to see how it performs in different soil types and under various weather conditions. Another goal is to connect it with wireless IoT monitoring networks and explore options for energy-autonomous operation. These steps would help make the system more practical and easier to scale for use in precision agriculture and environmental monitoring.
Author Contributions
Conceptualization, E.T., K.T., A.T.H., and S.S.; methodology, E.T., K.T., A.T.H., and S.S.; software, E.T., K.T., A.T.H., and S.S.; validation, E.T., K.T., A.T.H., and S.S.; formal analysis, E.T., K.T., A.T.H., and S.S.; investigation, E.T., K.T., A.T.H., and S.S.; resources, E.T., K.T., A.T.H., and S.S.; data curation, E.T., K.T., A.T.H., and S.S.; writing—original draft preparation, E.T., K.T., A.T.H., and S.S.; writing—review and editing, E.T., K.T., A.T.H., and S.S.; visualization, E.T., K.T., A.T.H., and S.S.; supervision, E.T., K.T., A.T.H., and S.S.; project administration, E.T., K.T., A.T.H., and S.S. All authors have read and agreed to the published version of the manuscript.
Funding
This research received no external funding.
Data Availability Statement
The data presented in this study are available on request from the corresponding author.
Conflicts of Interest
The authors declare no conflicts of interest.
References
- Corwin, D.L.; Lesch, S.M. Apparent soil electrical conductivity measurements in agriculture. Comput. Electron. Agric. 2005, 46, 11–43. [Google Scholar] [CrossRef]
- Hossain, M.S. Present Scenario of Global Salt Affected Soils, its Management and Importance of Salinity Research. Int. Res. J. Biol. Sci. 2019, 1, 1–3. [Google Scholar]
- Witkowski, J.S.; Grobelny, A.F. Dual-Frequency Soil Moisture Meter Method for Simultaneous Estimation of Soil Moisture and Conductivity. Sensors 2024, 24, 2969. [Google Scholar] [CrossRef]
- Ratke, R.F.; Zuffo, A.M.; Steiner, F.; Aguilera, J.G.; de Godoy, M.L.; Gava, R.; de Oliveira, J.T.; Filho, T.A.d.S.; Viana, P.R.N.; Ratke, L.P.T.; et al. Can Soil Moisture and Crop Production Be Influenced by Different Cropping Systems? AgriEngineering 2023, 5, 112–126. [Google Scholar] [CrossRef]
- Xiao, D.; Gu, H.; Yang, L.; Lyu, H.; Cheng, Y.; Pan, L.; Fu, Z.; Cui, L.; Zhang, L. A method of electrical conductivity compensation in a low-cost soil moisture sensing measurement based on capacitance. Measurement 2020, 150, 107052. [Google Scholar] [CrossRef]
- Zhou, M.; Wang, J.; Cai, L.; Fan, Y.; Zheng, Z. Laboratory Investigations on Factors Affecting Soil Electrical Resistivity and the Measurement. IEEE Trans. Ind. Appl. 2015, 51, 5358–5365. [Google Scholar] [CrossRef]
- Datsios, Z.; Mikropoulos, P.; Karakousis, I. Laboratory characterization and modeling of DC electrical resistivity of sandy soil with variable water resistivity and content. IEEE Trans. Dielectr. Electr. Insul. 2017, 24, 3063–3072. [Google Scholar] [CrossRef]
- Han, Y.; Yang, W.; Li, M.; Meng, C. Comparative Study of Two Soil Conductivity Meters Based on the Principle of Current-Voltage Four-Terminal Method. IFAC-PapersOnLine 2019, 52, 36–42. [Google Scholar]
- Unal, I.; Kabas, O.; Sozer, S. Real-Time Electrical Resistivity Measurement and Mapping Platform of the Soils with an Autonomous Robot for Precision Farming Applications. Sensors 2020, 20, 251. [Google Scholar] [CrossRef] [PubMed]
- Rhoades, J.D. Inexpensive four-electrode probe for monitoring soil salinity. Soil Sci. Soc. Am. J. 1979, 43, 817–818. [Google Scholar]
- Abdulraheem, M.I.; Chen, H.; Li, L.; Moshood, A.Y.; Zhang, W.; Xiong, Y.; Zhang, Y.; Taiwo, L.B.; Farooque, A.A.; Hu, J. Recent Advances in Dielectric Properties-Based Soil Water Content Measurements. Remote Sens. 2024, 16, 1328. [Google Scholar] [CrossRef]
- Kojima, Y.; Matsuoka, M.; Ariki, T.; Yoshioka, T. Time Domain Transmissiometry-Based Sensor for Simultaneously Measuring Soil Water Content, Electrical Conductivity, Temperature, and Matric Potential. Sensors 2023, 23, 2340. [Google Scholar] [CrossRef]
- Noborio, K. Measurement of soil water content and electrical conductivity by time domain reflectometry: A review. Comput. Electron. Agric. 2001, 31, 213–237. [Google Scholar] [CrossRef]
- de Jong, S.M.; Heijenk, R.A.; Nijland, W.; van der Meijde, M. Monitoring Soil Moisture Dynamics Using Electrical Resistivity Tomography under Homogeneous Field Conditions. Sensors 2020, 20, 5313. [Google Scholar] [CrossRef] [PubMed]
- Acho, L.; Pujol-Vázquez, G.; Gibergans-Báguena, J. Electronic Device and Data Processing Method for Soil Resistivity Analysis. Electronics 2021, 10, 1281. [Google Scholar] [CrossRef]
- Songara, J.C.; Patel, J.N. Calibration and Comparison of Various Sensors for Soil Moisture Measurement. Measurement 2022, 197, 111301. [Google Scholar] [CrossRef]
- Rasheed, M.W.; Tang, J.; Sarwar, A.; Shah, S.; Saddique, N.; Khan, M.U.; Imran Khan, M.; Nawaz, S.; Shamshiri, R.R.; Aziz, M.; et al. Soil Moisture Measuring Techniques and Factors Affecting the Moisture Dynamics: A Comprehensive Review. Sustainability 2022, 14, 11538. [Google Scholar] [CrossRef]
- Sheng, Z.; Liao, Y.; Zhang, S.; Ni, J.; Zhu, Y.; Cao, W.; Jiang, X. A Portable Pull-Out Soil Profile Moisture Sensor Based on High-Frequency Capacitance. Sensors 2023, 23, 3806. [Google Scholar] [CrossRef]
- Lloret, J.; Sendra, S.; Garcia, L.; Jimenez, J.M. A Wireless Sensor Network Deployment for Soil Moisture Monitoring in Precision Agriculture. Sensors 2021, 21, 7243. [Google Scholar] [CrossRef]
- Khan, M.S.I.; Rahman, A.; Islam, S.; Nasir, M.K.; Band, S.S.; Mosavi, A. IoT and Wireless Sensor Networking-based Effluent Treatment Plant Monitoring System. Acta Polytech. Hung. 2021, 18, 205–224. [Google Scholar] [CrossRef]
- Chavanne, X.; Frangi, J.-P. A Sensor to Monitor Soil Moisture, Salinity, and Temperature Profiles for Wireless Networks. J. Sens. Actuator Netw. 2024, 13, 32. [Google Scholar] [CrossRef]
- Rêgo Segundo, A.K.; Martins, J.H.; Monteiro, P.M.d.B.; De Oliveira, R.A.; Freitas, G.M. A Novel Low-Cost Instrumentation System for Measuring the Water Content and Apparent Electrical Conductivity of Soils. Sensors 2015, 15, 25546–25563. [Google Scholar] [CrossRef] [PubMed]
- Horváth, J.; Kátai, L.; Szabó, I.; Korzenszky, P. An Electrical Conductivity Sensor for the Selective Determination of Soil Salinity. Sensors 2024, 24, 3296. [Google Scholar] [CrossRef]
- Lasia, A. Definition of Impedance and Impedance of Electrical Circuits. In Electrochemical Impedance Spectroscopy and Its Applications; Springer: New York, NY, USA, 2014; pp. 7–66. [Google Scholar]
- Igboama, W.N.; Ugwu, N.U. Fabrication of resistivity meter and its evaluation. Am. J. Sci. Ind. Res. 2011, 2, 713–717. [Google Scholar] [CrossRef]
- Song, R.; Zhang, M. Design and Performance Evaluation of an In Situ Online Soil Electrical Conductivity Sensor Prototype Based on the High-Performance Integrated Chip AD5941. Appl. Sci. 2024, 14, 7788. [Google Scholar] [CrossRef]
- Tagarakis, A.C.; Kateris, D.; Berruto, R.; Bochtis, D. Low-Cost Wireless Sensing System for Precision Agriculture Applications in Orchards. Appl. Sci. 2021, 11, 5858. [Google Scholar] [CrossRef]
- Okasha, A.M.; Ibrahim, H.G.; Elmetwalli, A.H.; Khedher, K.M.; Yaseen, Z.M.; Elsayed, S. Designing Low-Cost Capacitive-Based Soil Moisture Sensor and Smart Monitoring Unit Operated by Solar Cells for Greenhouse Irrigation Management. Sensors 2021, 21, 5387. [Google Scholar] [CrossRef] [PubMed]
- Ma, R.; McBratney, A.; Whelan, B.; Minasny, B. Comparing Temperature Correction Models for Soil Electrical Conductivity Measurement. Precis. Agric. 2011, 12, 55–66. [Google Scholar] [CrossRef]
- Hong, C.-H.; Chong, S.-H.; Cho, G.-C. Theoretical Study on Geometries of Electrodes in Laboratory Electrical Resistivity Measurement. Appl. Sci. 2019, 9, 4167. [Google Scholar] [CrossRef]
- Shittu, K.A.; Oyedele, D.J.; Babatunde, K.M. The effects of moisture content at tillage on soil strength in maize production. Egypt. J. Basic Appl. Sci. 2017, 4, 139–142. [Google Scholar] [CrossRef]
- Nagahage, E.A.A.D.; Nagahage, I.S.P.; Fujino, T. Calibration and Validation of a Low-Cost Capacitive Moisture Sensor to Integrate the Automated Soil Moisture Monitoring System. Agriculture 2019, 9, 141. [Google Scholar] [CrossRef]
Disclaimer/Publisher’s Note: The statements, opinions and data contained in all publications are solely those of the individual author(s) and contributor(s) and not of MDPI and/or the editor(s). MDPI and/or the editor(s) disclaim responsibility for any injury to people or property resulting from any ideas, methods, instructions or products referred to in the content. |
© 2025 by the authors. Licensee MDPI, Basel, Switzerland. This article is an open access article distributed under the terms and conditions of the Creative Commons Attribution (CC BY) license (https://creativecommons.org/licenses/by/4.0/).