Article

Impact of Wetting-Drying Cycles on Soil Intra-Aggregate Pore Architecture Under Different Management Systems

by
Luiz F. Pires
1,*,
Jocenei A. T. de Oliveira
1,
José V. Gaspareto
1,
Adolfo N. D. Posadas
2 and
André L. F. Lourenço
2
1
Laboratory of Physics Applied to Soils and Environmental Sciences, Department of Physics, State University of Ponta Grossa, Ponta Grossa 84030-900, Brazil
2
AgriEntech Ltda., São Carlos 13560-460, Brazil
*
Author to whom correspondence should be addressed.
AgriEngineering 2025, 7(1), 9; https://doi.org/10.3390/agriengineering7010009
Submission received: 21 October 2024 / Revised: 10 December 2024 / Accepted: 19 December 2024 / Published: 30 December 2024

Abstract

:
In many soil processes, including solute and gas dynamics, the architecture of intra-aggregate pores is a crucial component. Soil management practices and wetting-drying (W-D) cycles, the latter having a significant impact on pore aggregation, are two key factors that shape pore structure. This study examines the effects of W-D cycles on the architecture of intra-aggregate pores under three different soil management systems: no-tillage (NT), minimum tillage (MT), and conventional tillage (CT). The soil samples were subjected to 0 and 12 W-D cycles, and the resulting pore structures were scanned using X-ray micro-computed tomography, generating reconstructed 3D volumetric data. The data analyses were conducted in terms of multifractal spectra, normalized Shannon entropy, lacunarity, porosity, anisotropy, connectivity, and tortuosity. The multifractal parameters of capacity, correlation, and information dimensions showed mean values of approximately 2.77, 2.75, and 2.75 when considering the different management practices and W-D cycles; 3D lacunarity decreased mainly for the smallest boxes between 0 and 12 W-D cycles for CT and NT, with the opposite behavior for MT. The normalized 3D Shannon entropy showed differences of less than 2% before and after the W-D cycles for MT and NT, with differences of 5% for CT. The imaged porosity showed reductions of approximately 50% after 12 W-D cycles for CT and NT. Generally, the largest pores (>0.1 mm3) contributed the most to porosity for all management practices before and after W-D cycles. Anisotropy increased by 9% and 2% for MT and CT after the cycles and decreased by 23% for NT. Pore connectivity showed a downward trend after 12 W-D cycles for CT and NT. Regarding the pore shape, the greatest contribution to porosity and number of pores was due to triaxial-shaped pores for both 0 and 12 W-D cycles for all management practices. The results demonstrate that, within the resolution limits of the microtomography analysis, pore architecture remained resilient to changes, despite some observable trends in specific parameters.

1. Introduction

The structure of soil is crucial for various processes that occur within this porous system. It is formed by the bonding of primary particles present in the soil, as well as the action of organic material, iron and aluminum oxides, and soil fauna, among other factors [1]. Soil structure directly impacts plant growth, water retention, erosion resistance, and the availability of water and nutrients to plants.
Soil structure directly influences the pore arrangement within it [2]. This structure can be easily changed due to physical processes, which affect the shape, arrangement, and continuity of the pores within the soil [3]. Different soil management practices also have a direct impact on soil structure. For instance, conventional tillage (CT) significantly affects the topsoil due to intense mobilization caused by turning over the soil surface [4].
In contrast, practices like no-tillage (NT) and minimum tillage (MT) minimize topsoil disturbance. NT, in particular, preserves soil structure by maintaining vegetation cover and surface residues, involving little to no soil disruption [5]. Due to these characteristics, NT and MT are often regarded as conservation practices.
In addition to management practices, wetting and drying (W-D) cycles also cause significant changes in the soil’s pore structure [6]. These cycles, in combination with organic matter, play a key role in soil aggregation [7]. However, W-D cycles can also affect soil aggregates, thereby influencing pore distribution [8]. Since aggregates are integral to soil structure, understanding their behavior under repeated W-D cycles is essential [9]. Soil aggregates are particularly important for processes such as aeration, plant growth, water infiltration, carbon sequestration, and other critical soil functions.
More scientific research is needed to assess the changes in intra-aggregate pores, particularly during wetting and drying cycles, since they significantly impact water retention and redistribution [10]. In this context, noninvasive image analysis techniques, such as X-ray micro-computed tomography (X- μ CT), are necessary for studying the dynamics of soil pore architecture at a high resolution [11].
X- μ CT offers a significant advantage over traditional techniques. It allows for measurements on the same sample and the assessment of different pore sizes in the soil [12,13]. Furthermore, it allows for detailed analyses of pore distribution within samples [14]. X- μ CT also provides insights into pore continuity and tortuosity, both of which are essential for understanding solute dynamics in soil [15]. The ability to easily measure morphological and geometric parameters of soil pores makes X- μ CT an attractive tool for characterizing soil aggregates.
Despite this, the parameters classically obtained by X- μ CT are often not sufficient to express the changes in soil pore architecture, especially those related to pore complexity. For this, we rely on advanced mathematical tools such as fractal [16] and multifractal analysis [17]. Multifractal analysis presents a spectral view of the structural heterogeneity in soils. Other parameters, such as entropy and lacunarity, are also alternatives for characterizing the soil pore system [18].
Numerous studies in the scientific literature characterize the morphological properties of soil aggregates. Zhao et al. [19] showed how natural processes such as freeze-thaw cycles induce the formation of large, elongated pores and how heavy rainfall reduces the porosity and connectivity of intra-aggregate pores. Gao et al. [20] compared intra-aggregate porosity for soil subjected to different management practices, showing that those that turn the soil tend to decrease porosity, with reductions mainly in the larger pores. Kravchenko et al. [21] observed that soil management over long periods affects the distribution and structure of intra-aggregate pores. Long-term conventional tillage tends to increase the number of small pores and the complexity of the pore system. Peth et al. [22] demonstrated that management practices such as CT tend to decrease nodal pore volumes, throat surface areas, and path lengths, limiting water and gas transport in the soil.
Recent studies have shown that W-D cycles can cause significant changes in the pore structure of the soil. Ma et al. [9] found that an increase in W-D cycles increases intra-aggregate porosity, the amount of larger pores, and the number of elongated pores in the soil, significantly impacting soil processes. Diel et al. [6] showed that W-D cycles affect intra-aggregate porosity and are influenced by factors such as organic matter content and the amount of clay in the soil. The organic matter content tends to affect crack densities and dimensions. Menon et al. [23] found that a stable pore system tends to influence the resilience of soil aggregates to change. These authors observed that management practices that turn the soil tend to have less stable aggregates, impacting intra-aggregate porosity.
Compared to previously published studies, this paper introduces detailed analyses of changes in the pore architecture of small aggregates of highly weathered soil, investigates the influence of wetting and drying cycles on the intra-aggregate pore scale, and evaluates the behavior of soils under different management practices in response to wetting and drying cycles. Furthermore, techniques that use multifractal analysis are important tools for evaluating dynamic processes in the soil. In this paper, we discuss how the structure of soil pores is impacted by wetting and drying cycles at the microscopic level within soil aggregates. We aimed to examine how different soil management practices affect the soil structure when exposed to wetting and drying cycles. We characterized the soil’s porous system by examining its various morphological and geometric properties. Additionally, we analyzed its complexity using multifractal analysis, entropy, and lacunarity. Thus, this study, focused on the effects of W-D cycles, is based on the following hypotheses: (1) at the intra-aggregate pore scale, modifications in pore architecture tend to be small, and (2) intra-aggregate pore distribution expresses multifractal behavior.
The structure of this article is as follows. Section 2 details the experimental methodology and mathematical framework, outlining the equations and all material resources used. Section 3 presents the numerical results, while Section 4 provides an in-depth discussion of these findings. Finally, Section 5 summarizes the main conclusions drawn from the study, highlighting the key results.

2. Materials and Methods

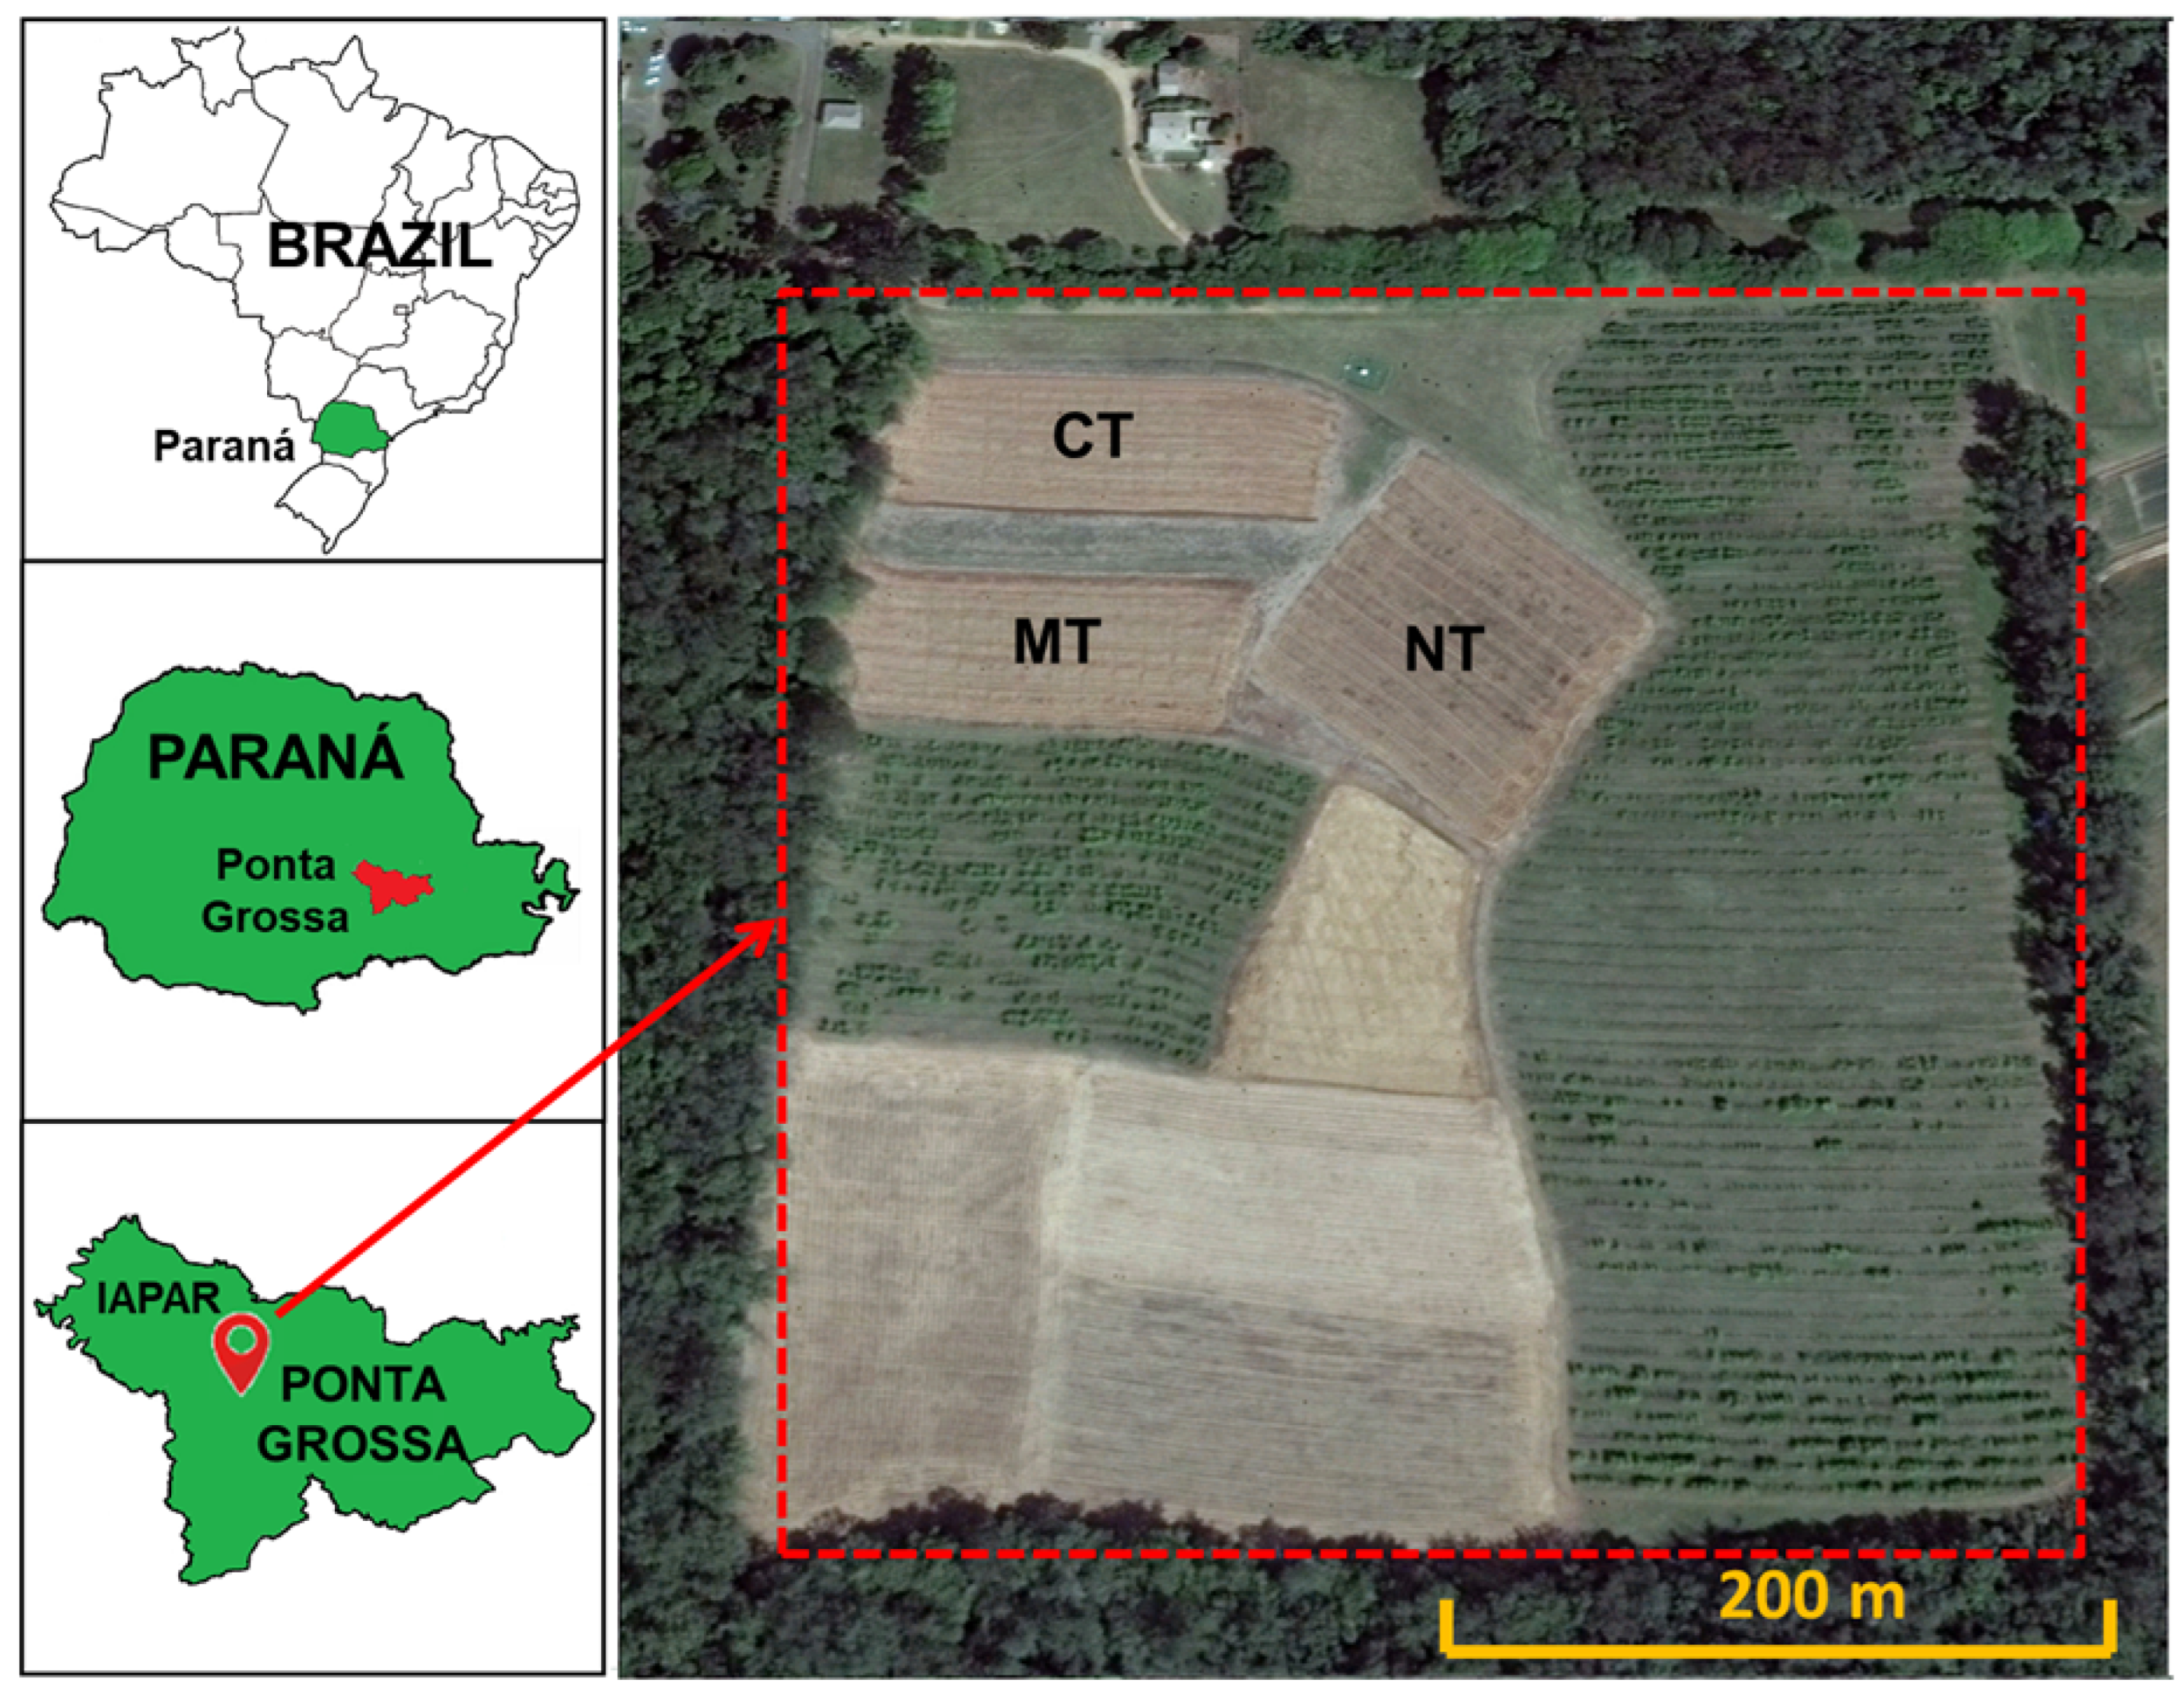
2.1. Experimental Area and Soil Sampling

The soil samples analyzed in this study were collected from Rhodic Hapludox (Soil Survey Staff) at the IAPAR (Instituto de Desenvolvimento Rural do Paraná) experimental farm (Figure 1), located in Ponta Grossa, Paraná, Brazil (25°06’ S, 50°09’ W; 875 m asl). The experimental plots are characterized by long, gentle slopes, with gradients ranging from 2 to 7%. The soil formation is derived from the clastic sediments of the Devonian period, exhibiting a distinctive mixture of Ponta Grossa shale [24]. The experimental site displays deep, highly structured profiles, characterized by high porosity and good internal drainage [25]. The textural composition of the soil consists of 14% sand, 28% silt and 58% clay. According to the soil textural chart, the soil is classified as clay. In accordance with the Köppen classification, the climate of the region is characterized as humid mesothermal Cfb-subtropical, with relatively mild summers [26]. The region experiences an average annual rainfall of approximately 1550 mm, with a maximum average annual temperature of 22 °C and a minimum of 18 °C. Frost is a common occurrence during the coldest months (June to August).
The experimental area was subjected to different soil management practices for over 40 years, divided into plots managed by conventional tillage (CT), minimum tillage (MT), and no-tillage (NT). The experimental plots under consideration here have areas of approximately 1.0 hectares (NT) and approximately 0.6 hectares (CT and MT). In the CT treatment, the soil was subjected to discing at a depth of 25 cm, followed by harrowing to a depth of 10 cm on two occasions per year, following the summer and winter harvests. In the MT treatment, the soil was prepared using a chisel cultivator at a depth of 25 cm, followed by narrow disking to a depth of 10 cm, which caused minimal soil disturbance. The crop residues were maintained at the soil surface. In the NT treatment, no soil disturbance was applied. In 2017, undisturbed soil samples were collected from the topsoil layer (0–10 cm) using steel cylinders (approximately 5 cm in diameter and 5 cm in height). In these areas (Figure 1), crop rotations were carried out with the cultivation of oats (Avena strigosa), vetch (Vicia sativa), or wheat (Triticum aestivum L.) in the winter and corn (Zea mays) and soybean (Glycins max) in the summer. Standard agricultural machinery was employed for soil preparation, including operations such as clearing, cutting, plowing, harrowing, and planting.
A total of 18 soil samples were analyzed, with each sample subjected to one of two W-D cycle treatments: no cycles (0 W-D) or twelve cycles (12 W-D). The samples were further divided across the three different management practices (CT, MT, and NT), with three samples analyzed per treatment combination (2 W-D cycles × 3 management practices × 3 samples per combination).

2.2. Wetting and Drying (W-D) Cycles

The collected core samples were wrapped in plastic film to protect them from potential damage during transport and handling in the laboratory. Upon arrival, the samples underwent a trimming process, during which excess soil was carefully removed using a knife. Half of the samples (three from each management practice) were then saturated for 48 h using the traditional capillary rise method. This method involved placing a 5 mm layer of water at the base of each sample, gradually adding 5 mm of water per hour until it reached the top edge of the steel cylinder. Once fully saturated, the samples were transferred to an Eijkelkamp 08.01 Sandbox, where they were subjected to a 6 kPa matric potential until they reached thermodynamic equilibrium, which took approximately 3 to 4 days. After each drying phase, the samples were re-saturated, and this process was repeated 12 times (12 W-D cycles). The number of W-D cycles was selected to correspond to the average number of annual rainfall events exceeding 30 mm. These rainfall amounts were selected because they maintain the soil at field capacity, which is essential for better soil management without environmental damage.

2.3. X-ray Micro-Computed Tomography (X- μ CT)

After completing the W-D cycles, soil aggregates measuring approximately 1–2 cm were carefully extracted from the steel cylinders after being dried at 40 °C in an oven for several days (see Figure A1). Extracting the aggregates was necessary to enhance the resolution of the images compared to those obtained from the intact samples in the cylinders (results not covered in this paper). Once dried, the most stable aggregates were scanned using a GE Nanotom X-ray Computed Tomography (X- μ CT) system installed at the Hounsfield Facility, University of Nottingham, Sutton Bonington Campus, UK [27].
The X- μ CT system, rated at 180 kV/15 W, was configured to operate at 90 kV and 70 μ A, with an acquisition time of 250 ms per sample. To minimize beam hardening effects, a 0.1 mm copper (Cu) filter was placed near the X-ray source. The images were initially captured in 32-bit grayscale and subsequently cropped using ImageJ 1.42 software [28] to eliminate border effects. Before 3D reconstruction, the images were processed with a Median 3D filter (2-pixel radius selected) to reduce noise, followed by the application of a Unsharp Mask filter (size 0.8) to sharpen the solid portions of the aggregates.
After filtering the 900 TIFF images with a voxel size of 5.3 μ m, the grayscale images were processed using ImageJ 1.42 software [28] with the Otsu’s non-parametric method. This method separates gray tones into distinct classes by forming a histogram. When two distinct classes of gray tones are present due to material characteristics, the histogram is bimodal, showing two characteristic peaks. This allows for the selection of a binary threshold, segmenting and converting the 32-bit grayscale images into 8-bit binary images, where white represents the solid areas and black the pores. The initial threshold value was determined using Otsu’s algorithm [29] and then refined through a visual inspection of the histogram.

2.4. Quantification of Physical and Morphometric Properties Analyzed Using 3D Imaging

Briefly, 3D lacunarity, Λ ( ε ) , describes the distribution patterns of empty spaces within a porous medium and reflects the degree of heterogeneity in pore clusters. To quantify the 3D lacunarity of soil aggregates, a Matlab® R2018a (2018) [30] script was developed based on Equation (1) and the box counting method. The analysis was conducted using cubic box sizes ε = {1, 2, 3, 4, 5, 6, 10, 12, 15, 20, 25, 30, 50, 60, 75, 100, 150, 300}. Lacunarity is defined as follows:
Λ ( ε ) = s s 2 P ( s , ε ) s s P ( s , ε ) 2 ,
P ( s , ε ) = n ( s , ε ) N ( ε ) ,
where s represents the number of voxels corresponding to pores within each box of size ε , and P ( s , ε ) (Equation (2)) denotes the probability distribution of s for each box size ε . A cubic box of length ε is selected, and its number of occupied voxels (pore count) within the box (denoted by s) is determined. The box is then moved along the data set, and the process is repeated over the entire set. This produces a frequency distribution of box masses, n ( s , ε ) , which is converted into the probability distribution P ( s , ε ) by dividing it by the total number of boxes N ( ε ) of size ε .
The 3D multifractal analysis was conducted by examining the multifractal spectra of the samples, based on Equations (3) and (4) [18,31,32], calculated using the NASS (Nonlinear Analysis Scaling System) software [33]. The analysis employed selected box sizes, ε = {50, 60, 75, 90, 150, 180, 300, 450}, with statistical moments (q-values) ranging from 0.5 to 2.0 , in regular increments of 0.1 . The multifractal spectrum was then calculated as follows [17]:
f ( α ( q ) ) = lim ε 0 i μ i ( q , ε ) log e μ i ( q , ε ) log e ε ,
α ( q ) = lim ε 0 i μ i ( q , ε ) log e P i ( ε ) log e ε ,
where μ i represents the partition function or normalized measure of the distribution, q is the statistical moment that characterizes the scaling properties, f ( α ( q ) ) is the multifractal singularity spectrum, α ( q ) refers to the Lipschitz-Hölder exponent associated with the singularity strength, and P i ( ε ) denotes the probability of finding pores within a box i of size ε . The singularity spectrum f ( α ( q ) ) provides a description of the distribution of singularities, while α ( q ) quantifies the intensity or regularity of the measure at different locations within the medium.
Additionally, NASS computes the normalized Shannon entropy, based on Equation (5), which provides further insights into the distribution heterogeneity. Normalized Shannon entropy measures the uncertainty or unpredictability in counting voxels corresponding to pores within a volume of size ε × ε × ε . Because it is a scale-dependent property, it is extremely sensitive and can reveal the heterogeneity of the pore system within aggregates to some extent [18,34]. These cubic box sizes were ε = { 1–10, 12, 15, 18, 20, 25, 30, 36, 45, 50, 60, 100, 225}. Due to the sensitivity of this entropy, additional boxes were added for better refinement.
H * ( ε ) = H ( ε ) H M ( ε ) = i = 0 P i ( ε ) log P i ( ε ) log ( ε 3 + 1 ) ,
Another geometric property NASS provides is the generalized fractal dimension ( D q ) (Equation (6)), which serves as a parameter for measuring and analyzing the geometric aspects of porous systems.
D q = 1 q 1 lim ε 0 i = 1 log 2 μ i ( q , ε ) log 2 ε ,
The porosity, degree of anisotropy, connectivity, and tortuosity of the pores were analyzed using ImageJ 1.42 software [28]. The voxel counter plugin was employed for measuring the imaged porosity ( Φ ):
Φ porosity ( % ) = i = 1 n V i , pore V total ,
where V i , pore is the volume of pores and V total is the aggregate volume (300 × 300 × 900 voxels or 1.6 × 1.6 × 5.8 mm3).
To better analyze the contribution of different pore sizes to the imaged porosity, the pores were divided into the following volume ranges: 0.0001–0.01 ( Φ 1 ), 0.01–0.1 ( Φ 2 ), 0.1–1.0 mm3 ( Φ 3 ), and >1.0 mm3 ( Φ 4 ). The pores were also classified in terms of shape using the classification suggested by Bullock et al. [35]. The pores were divided into the following shapes: equant, triaxial, prolate, and oblate. The shape of the pores was defined by calculating the ratio between the semi-axes of ellipsoids inscribed within the pores [36]. The contribution of each type of pore to the imaged porosity was analyzed, as was the contribution of the number of pores. All these parameters were calculated using the Particle Analyzer function in ImageJ. The degree of anisotropy ( D A ) and the aggregate volume connectivity (C) were determined by the BoneJ plugin [37]:
D A = 1 λ min λ max ,
E C = n v C v ,
C = 1 E C ,
where E C refers to Euler–Poincaré characteristic, n v is the number of isolated pores (disconnected parts) in the sample volume, C v is the pore connectivity, and the minimum ( λ min ) and maximum ( λ max ) eigenvalues correspond to the shortest and longest radii of an ellipsoid along the x, y, and z axes. D A is a parameter that expresses how a porous medium is isotropic ( D A = 0 ) or anisotropic ( D A = 1 ). In the case of pores, it may provide its preferential directions. C is a geometric attribute that reveals a degree of interconnection between pores, i.e., how connected or disconnected the pores are from one another [37].
Pore tortuosity ( τ ) is another geometric attribute that describes the degree of sinuosity in the porous system. This parameter was calculated as the ratio between the geodetic distance ( L G ) and the Euclidean distance ( L E ) between two points connected within the pore network [38]:
τ = L G L E
The impact of the treatments (W-D) on the soil morphological parameters was evaluated using a one-way analysis of variance (ANOVA) followed by a t-test. The results were classified as statistically significant at p < 0.05 . The statistical analysis was conducted using PAST software version 4.03 [39].

3. Results

3.1. Image Analysis

The X- μ CT images of the MT samples taken before (Figure 2a) and after (Figure 2b) the application of 12 W-D cycles reveal slight visual differences in pore distribution or overall porosity. No noticeable concentrations of pores are observed in specific regions of the samples. However, after 12 W-D, the pores appear more interconnected, particularly in the top portion of the image. Additionally, the post-W-D image shows a higher percentage of isolated pores, suggesting an increase in the total number of pores.
For the samples under CT (Figure 2c,d), a noticeable reduction in porosity can be observed after 12 W-D cycles (Figure 2d). Following the W-D cycles, there is a higher concentration of pores in the upper region of the image, whereas in the 0 W-D sample, pores are more concentrated in the central region. These variations in pore concentration could influence the anisotropy of the pore system. The darker regions in the images indicate areas of higher pore density, which may reflect increased connectivity, as seen in the 0 W-D case. Additionally, the application of W-D cycles led to a rise in the number of isolated pores, suggesting an overall increase in pore count.
For the samples under NT (Figure 2e,f), a reduction in porosity after 12 W-D cycles (Figure 2f) is noticeable, similar to the trend observed for CT. In the 0 W-D sample, there is a higher concentration of pores in specific regions (upper, middle, and lower portions of the image). The darker regions in the 0 W-D image also suggest a higher pore concentration and potentially greater connectivity between pores. However, unlike in the CT condition, the presence of isolated pores in the NT condition remains relatively consistent before and after the W-D cycles.

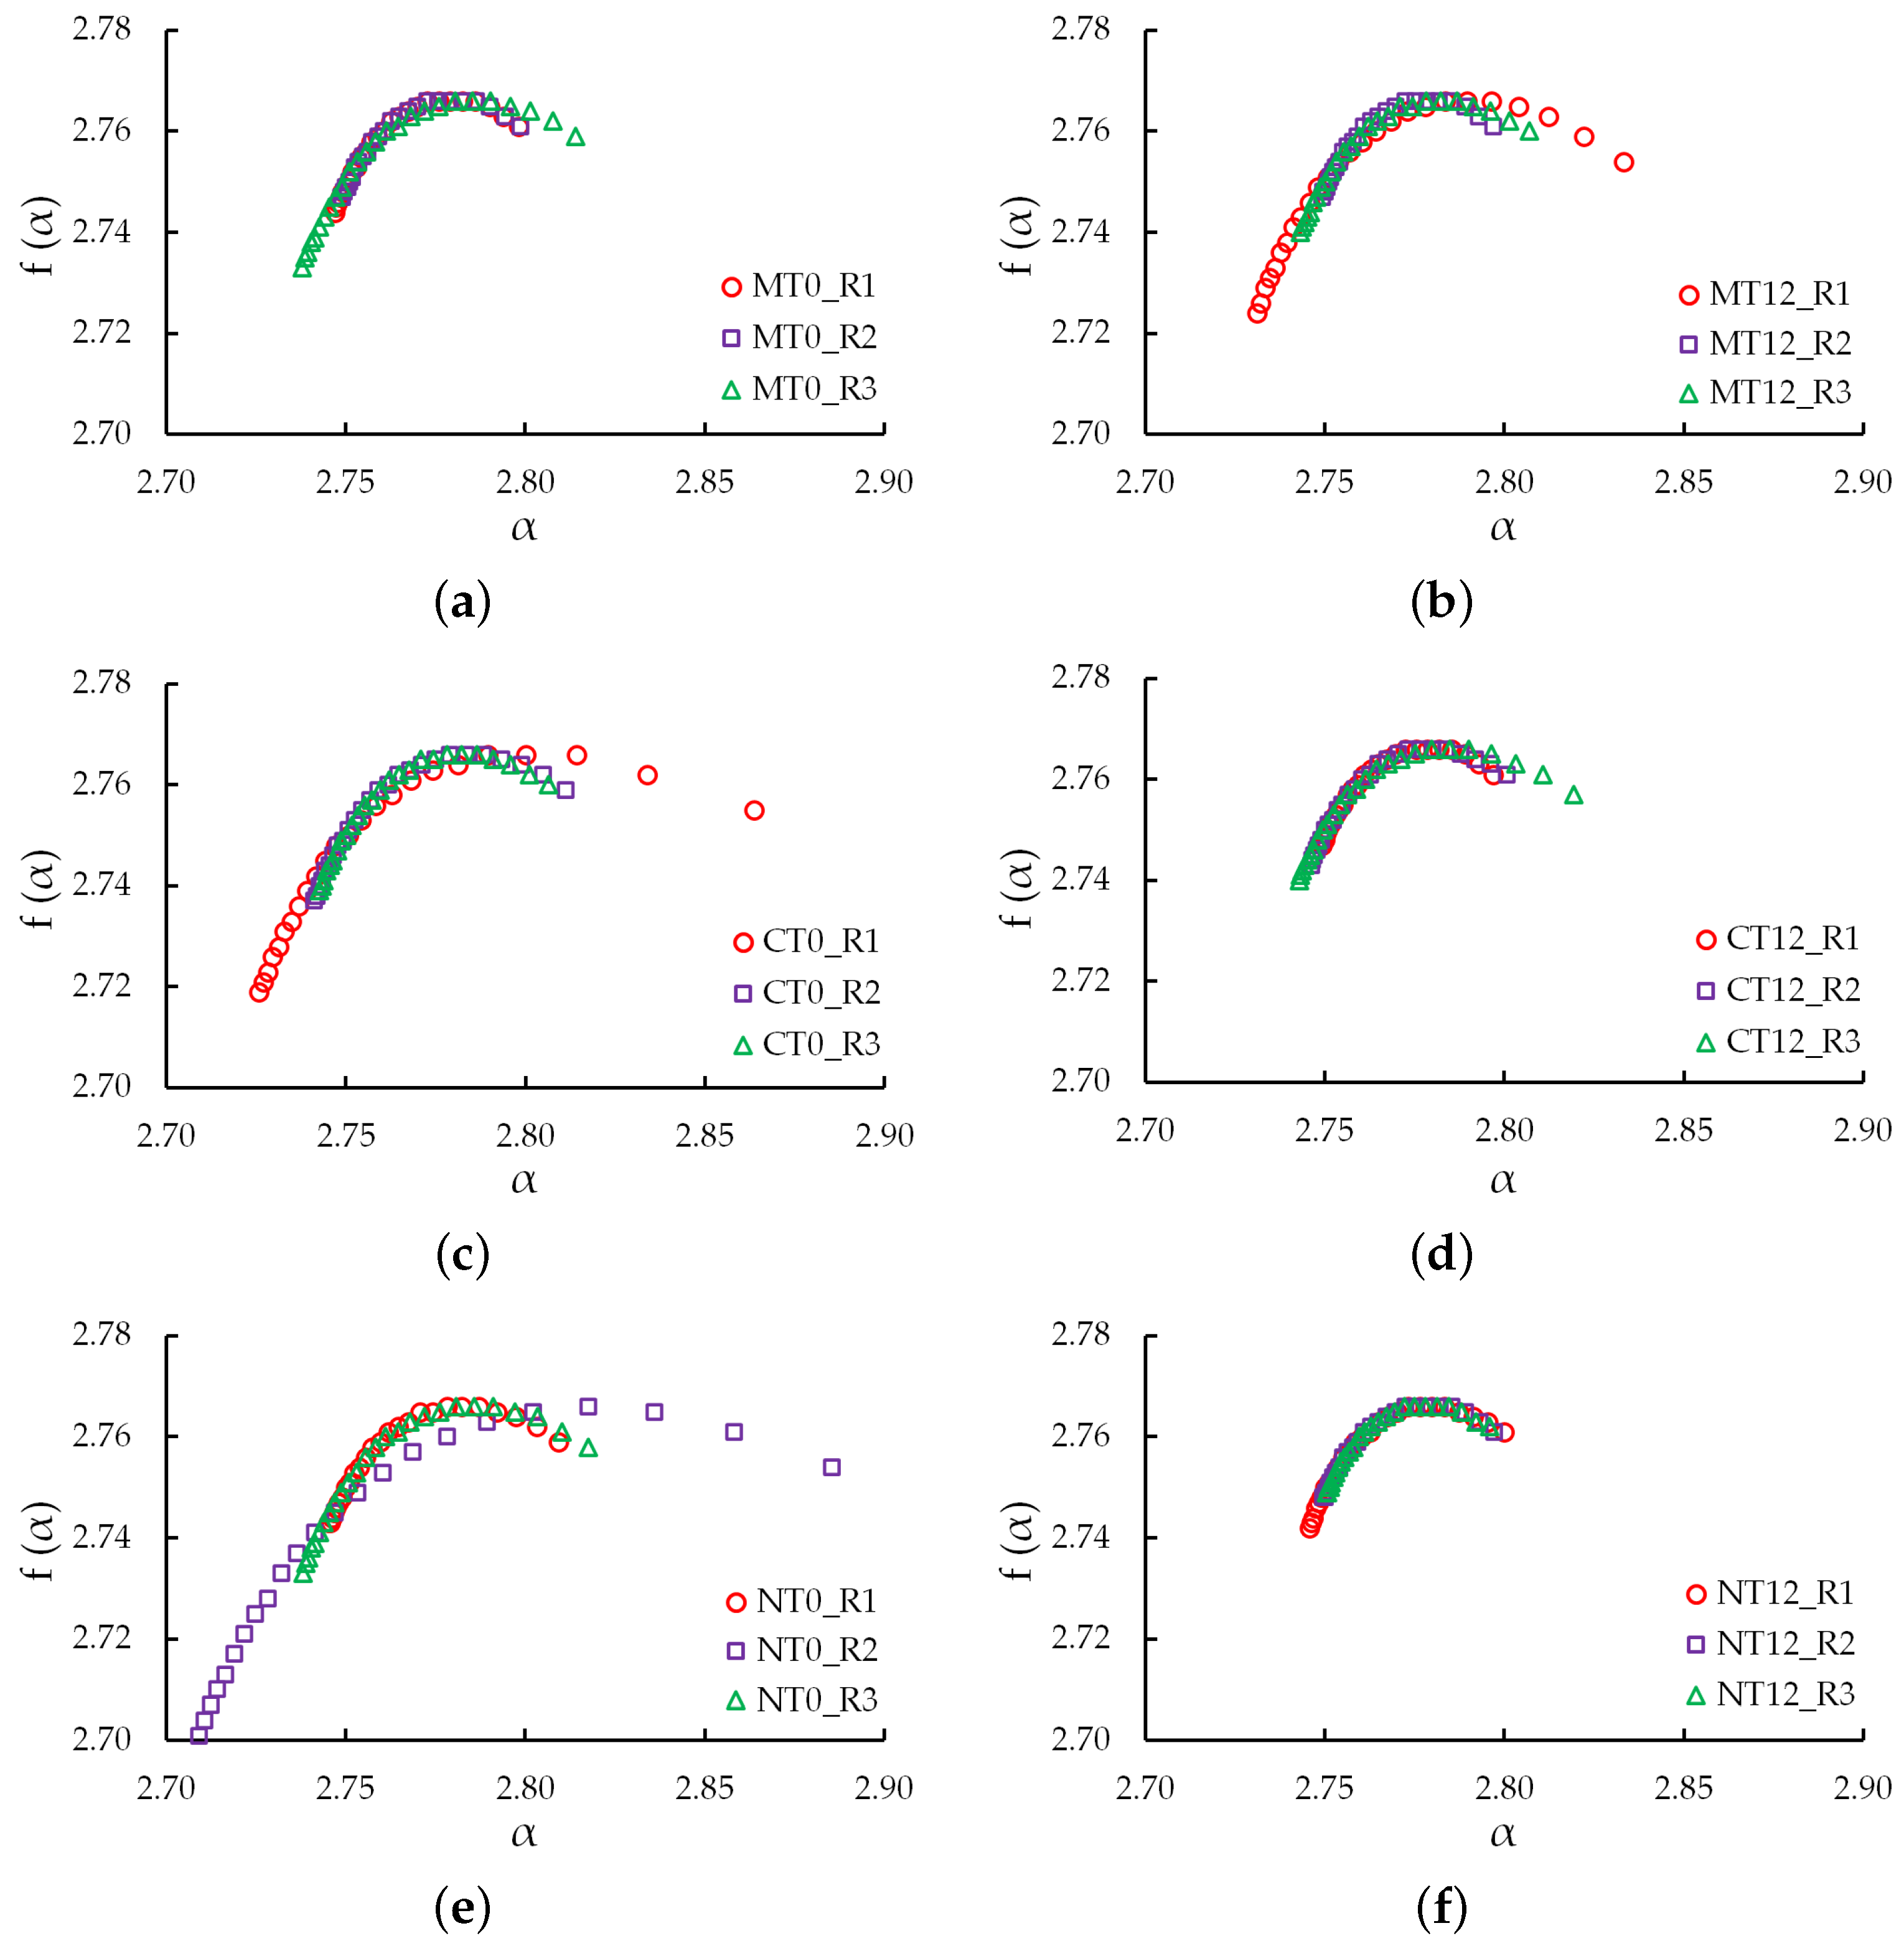
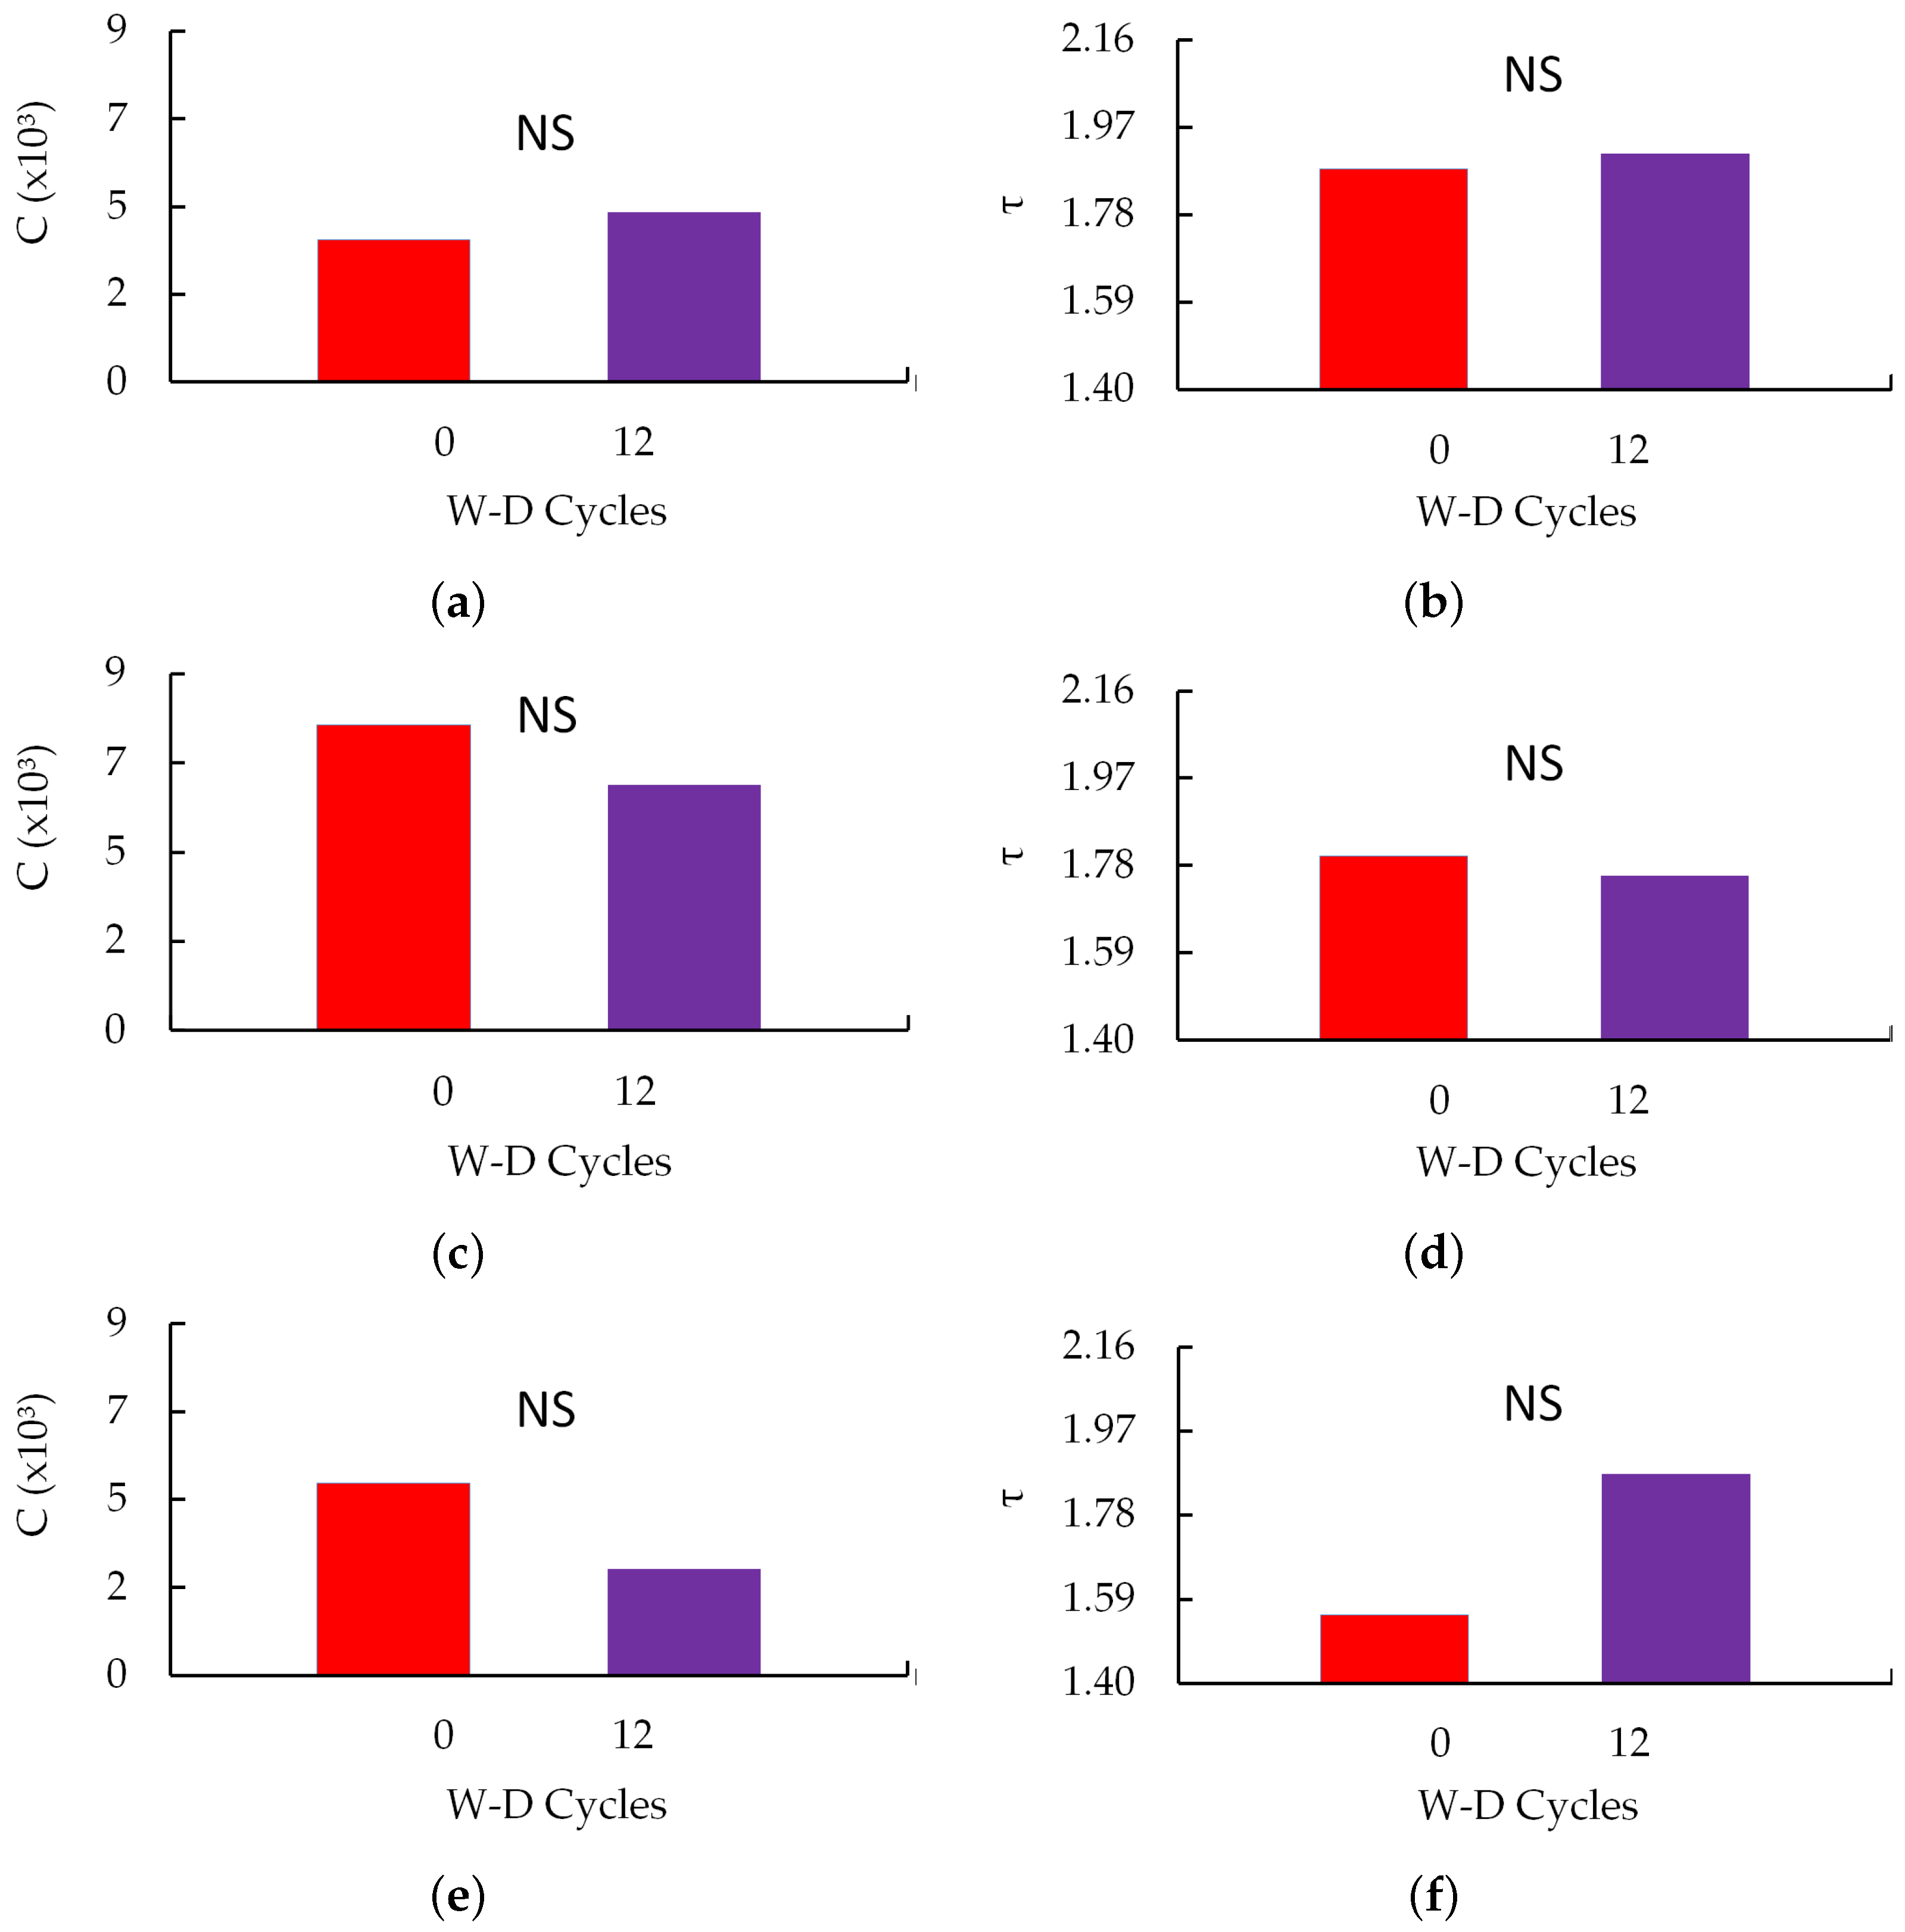
3.2. Three-Dimensional Lacunarity, Normalized Shannon Entropy, Three-Dimensional Multifractal Spectra, and Generalized Fractal Dimensions

The 3D lacunarity (Figure 3a,c,e) exhibited a decrease following 12 W-D cycles for the CT and NT samples. In contrast, the MT samples displayed an increase in lacunarity after the same number of cycles. The area beneath the lacunarity curves indicates that, for CT (Figure 3c) and NT (Figure 3e), the difference between the measurements taken at 0 and 12 W-D cycles was approximately 2.9 and 18.9 times greater, respectively. Conversely, for MT (Figure 3a), the samples subjected to 12 W-D cycles revealed an area roughly 4.1 times larger than that observed under 0 W-D cycles. Nonetheless, when accounting for the variability represented by the error bars in the lacunarity values across samples, it becomes evident that there were no significant differences between the samples before and after the W-D cycles.
The normalized 3D Shannon entropy (Figure 3b,d,f) exhibited minimal variations among the samples subjected to W-D cycles, particularly in the smallest box sizes. The area calculations beneath the curves revealed nearly identical values for MT (Figure 3b) and NT (Figure 3f) both before and after the W-D cycles, with differences of less than 2%. In contrast, for CT condition (Figure 3d), there was a 5% difference in areas, accompanied by a reduction following the application of 12 W-D cycles. For MT and NT, a slight increase was noted after 12 W-D cycles. Notably, for the largest box sizes, the values for samples subjected to both 0 and 12 W-D cycles remained unchanged. These findings indicate that, for the analyzed soil aggregates, W-D cycles did not significantly alter pore complexity.
The assessment of the generalized fractal dimension (Figure 4) indicated no significant differences ( p > 0.05 ) among the samples after the W-D cycles. This consistent finding across all analyzed management practices suggests that multifractality is absent for the studied aggregate sizes. The data for the generalized fractal dimensions, obtained from the multifractal spectra (see Figure A2), typically displayed only slight variations among the samples, which fell within the range of statistical error, for all management practices examined (see Table A1).

3.3. Physical Properties: Porosity, Degree of Anisotropy and Number of Pores

Analysis of the imaged porosity (Figure 5a,c,e) showed that there were no significant differences ( p > 0.05 ) before and after the W-D cycles for all the management practices studied. The imaged porosity values for MT were approximately 7.5% before and after the W-D cycles. For CT and NT conditions (Figure 5c,e), there was a trend of decrease in imaged porosity after 12 W-D cycles, with reductions of about 52% and 53%, respectively. Concerning pore distribution by size (Figure 5b,d,f), no differences ( p > 0.05 ) were detected between W-D cycles across all size classes for all the management practices studied. The largest pores contributed significantly to the imaged porosity for MT (Figure 5b), accounting for 66% after 0 W-D and 57% after 12 W-D cycles. In the CT samples (Figure 5d), the largest differences were noted in the smallest pore sizes ( Φ 1 and Φ 2 ) between the 0 and 12 W-D cycles. However, the largest pores contributed to a significant portion of the imaged porosity, representing 85% (0 W-D) and 53% (12 W-D). For the NT condition (Figure 5f), the largest differences were also observed in the smallest pore sizes ( Φ 1 and Φ 2 ) between the W-D cycles. In the 0 W-D samples, the largest pores accounted for 81% of the imaged porosity, while after 12 W-D cycles, the smallest pores ( Φ 1 ) emerged as the primary contributors to imaged porosity, contrasting the results of the other management practices. Notably, the implementation of 12 W-D cycles completely eliminated the contribution of the largest pores ( Φ 4 ) to the imaged porosity.
The degree of anisotropy showed slight increases for the samples under MT (Figure 6a) and CT (Figure 6c) conditions after 12 W-D. The increase was 9% for MT and 2% for CT, respectively. In the case of NT (Figure 6e), an inverse behavior was observed with a reduction in the degree of anisotropy after 12 W-D cycles. This reduction was equivalent to 23%. However, none of the management practices showed significant differences ( p > 0.05 ) between samples before and after the application of W-D cycles. For the number of pores (Figure 6b,d,f), an upward trend was observed in all management practices after 12 W-D cycles. The differences between 0 and 12 W-D cycles were 31% (MT), 30% (CT) and 13% (NT). However, considering the variability between samples, no significant differences ( p > 0.05 ) were observed between W-D cycles for all the management practices studied.

3.4. Morphometric Properties: Connectivity of Pores, Tortuosity, Volume and Number of Pores by Shape

Pore connectivity (Figure 7a,c,e) showed an upward trend of 19% for the samples under MT (Figure 7a) after 12 W-D. For CT (Figure 7c) and NT (Figure 7e), a reduction trend of 20% and 45% was observed, respectively, after the application of W-D cycles. These results indicate that the W-D cycles caused a worsening in pore connectivity after 12 W-D for CT and NT. However, none of the management practices showed significant differences ( p > 0.05 ) between samples before and after the application of W-D cycles for pore connectivity. Tortuosity showed a slight tendency to increase by 2% for MT (Figure 7b) and decrease by 2% for CT (Figure 7d) after 12 W-D. The greatest variation was observed for NT (Figure 7f) with a tendency to increase by 20% after 12 W-D, but with no significant differences ( p > 0.05 ).
The W-D cycles did not significantly ( p > 0.05 ) affect the contribution of pore shape to the imaged porosity for the different management practices (Figure 8a,c,e). It is worth mentioning that unclassified pores were excluded from the analysis. It was not possible to define a shape for these pores. The greatest contribution to the imaged porosity was due to the triaxial-shaped pores (MT: 54% 0 W-D and 67% 12 W-D; CT: 68% 0 W-D and 58% 12 W-D; NT: 59% 0 W-D and 62% 12 W-D). For MT (Figure 8a), these pores increased by 24% after 12 W-D. For CT (Figure 8c), a reduction of 15% was observed, while for NT (Figure 8e), a slight increase of 5% was observed. The number of pores (Figure 8b,d,f) followed a similar trend to that followed by the pore volume.
The greatest contribution to the number of pores was due to the triaxial-shaped pores, showing a direct relationship between the volume and number of pores. Again, no differences ( p > 0.05 ) were observed between the samples in terms of pore shape after the application of W-D cycles for the number of pores. The contribution of triaxial shaped pores to the number of pores was 45% (0 W-D) and 46% (12 W-D) for MT (Figure 8b), 49% (0 W-D) and 51% (12 W-D) for CT (Figure 8d) and 54% (0 W-D) and 51% (12 W-D) for NT (Figure 8f). Therefore, there was a slight upward trend for MT (4%) and CT (2%) and a decrease for NT (6%) in triaxial-shaped pores after 12 W-D. Prolate-shaped pores made the second largest contribution to the number of pores.

4. Discussion

In this study, we chose to use three different soil management practices to investigate whether the changes caused to soil structure by management show different responses in pore architecture after wetting and drying cycles. The main idea of the study was to see how small soil aggregates are affected by W-D cycles. For this purpose, images with a voxel size of approximately 5 μ m were analyzed. We also decided to investigate changes in the complexity of the soil pore system using multifractal analysis. Lacunarity and 3D Shannon entropy were calculated to complement the multifractal analysis.
The analysis of pore complexity is fundamental for a better understanding of the processes taking place in the soil. Cheik et al. [40] showed the influence of W-D cycles on the complexity of cracks, demonstrating that these cycles alter the distribution, quantity and complexity of cracks. However, these same authors showed that the galleries associated with smaller pores are more resilient to changes with W-D cycles. Liu et al. [41] observed an increase in the complexity of the soil pore network after W-D cycles. The authors mention the fragmentation of the soil structure and the increase in pore space in the samples analyzed as the cause of the increase in pore complexity. Hussein and Adey [42,43] have shown that W-D cycles tend to affect the complexity of the soil structure, also influencing the complexity of the pores found in the soil. Reconstituted soils usually tend to develop a complex crumb-type structure. However, the work of these authors focused on inter-aggregate pores or reconstituted samples, unlike that carried out in our study.
In our study, lacunarity and 3D Shannon entropy curves showed no differences between the W-D cycles (Figure 3). This result was similar for all management practices. The downward trend in lacunarity for CT and NT after 12 W-D indicates a reduction in the degree of dispersion of the pore clusters. In the case of MT, the opposite was observed with an increase in the degree of dispersivity of the pore clusters. de Oliveira et al. [44], working with the same type of soil and larger samples, showed similar results for the NT condition to those found in our study. However, these authors observed no differences for CT. The results found for MT also differ from those observed in our study. In our study we mainly accessed the intra-aggregate pores, in contrast to the the approach taken in the study by de Oliveira et al. [44]. In the case of CT conditions, soil disturbance through plowing and harrowing breaks down the aggregates. Therefore, the application of W-D cycles favors soil aggregation in this management practice [9,45]. This may favor the clustering of pores. It is worth mentioning that the soil analyzed has a more clayey texture, which favors the formation of aggregates [21,46]. Samples were also taken from the surface layer, which is richer in organic material [6]. The higher content of organic material in NT, as well as the action of soil fauna and the presence of roots, can lead to the appearance of pores that are susceptible to changes when the soil undergoes successive W-D cycles [40,47]. The same can happen with MT, which can also be considered a less invasive management practice. The physicochemical forces that exist between soil particles and aggregates and the action of cementing agents are important factors in soil structure changes under W-D cycles [48].
The results of normalized 3D Shannon entropy (Figure 3) are in agreement with the results of de Oliveira et al. [44] for samples of the same soil with images of a voxel size of 35 μ m. These authors also observed no significant differences in the entropy curves after the W-D cycles. Shannon entropy is used in porous systems to quantify the uncertainty or variability in pore size and shape distribution [49]. Therefore, small differences in this property are an indication that there are no major variations in the complexity of the pore architecture, as observed in our study. Generally, higher entropy values are associated with a more varied soil structure [50]. Soils with more connected pores also tend to have lower entropy, due to the way the pores are arranged [44]. The analysis of the capacity dimension ( D 0 —fractal dimension in 3D) (Figure 4) revealed no significant differences between the W-D cycles across various management practices. This finding aligns with Vázquez et al. [50], who also observed no variation in soil pore distribution following rainfall events. Similarly, de Oliveira et al. [44] reported comparable results for samples under CT and MT, noting that soils in these systems exhibited moderate multifractality. In contrast, our study indicates that the pore architecture in our system demonstrates fractal behavior (see Table A1). The D 0 values found in our study, which were approximately 2.78, are consistent with those reported by de Oliveira et al. and Soto-Gómez et al. [44,51], who found D 0 values ranging from 2.34 to 2.85 in areas under organic farming and various management practices.
The imaged porosity showed the tendency to exhibit differences under CT and NT with 12 W-D cycles (Figure 5). However, no significant differences were observed for all the management practices before and after W-D cycles. Authors such as Sartori et al., Zemenu et al., and Pires et al. [52,53,54] observed an increase in porosity as a function of W-D cycles. In the case of the latter authors, the same type of soil was investigated. However, it is worth mentioning that these authors applied the W-D cycles to samples confined in cylinders. Changes in the volume of the sample with wetting and the friction of the soil with the cylinder walls often lead to irreversible changes in the volume (height) of the soil, increasing the number of large pores. It is worth mentioning that our study analyzed aggregates extracted from the inside of the cylinder containing the soil. Nevertheless, other authors have shown that porosity can decrease after the application of W-D cycles [55]. This result is often associated with instabilities in soil structure due the to slaking and dispersing of soil or the coalescence of soil aggregates [56]. Often, the migration of small soil particles due to W-D cycles can reduce the contribution of larger pores to soil porosity and induce the formation of smaller pores [57,58]. Consequently, the larger pores inside the aggregates can be reduced.
This was the result observed in our study, which showed a reduction in larger pores, responsible for the downward trend in the imaged porosity for CT and NT after 12 W-D (Figure 5). In the case of MT, there was an increase in the contribution of smaller pores (<1 mm3) to the imaged porosity, which compensated for the reduction in larger pores (>1 mm3). The same was observed for CT and NT for the Φ 1 and Φ 2 size ranges. Our results differ from those of Pires et al. and An et al. [54,59], but these authors worked with larger samples and probably accessed inter-aggregate pores. In our study, due to the size of the samples, intra-aggregate pores were probably accessed. Leij et al. [8] showed that soil drying can reduce structural porosity due to the coalescence of aggregates, explaining the increase in smaller pores with W-D cycles. However, Ma et al. [9] showed that even small soil aggregates can increase porosity with W-D cycles, contrasting our results.
The degree of anisotropy (Figure 6) showed small differences for MT and CT after 12 W-D cycles. A downward trend was observed only for the NT condition after the W-D cycles. The DA values found show more isotropic structures without the preferential distribution of pores in different regions of the samples. For the NT condition, it can be said that 12 W-D cycles better distributed the pores throughout the volume of the aggregate, but it is important to say that considering the variability between the samples, there were no differences in DA for the different management practices. The DA values are also consistent with those in other studies, showing small variations in this property due to the drying and wetting of the soil [44,46]. Dhaliwal and Kumar [36] recently showed DA values ranging from 0.27 to 0.37 for samples under native pasture and corn-soybean systems, which are consistent with the values in our study. The number of pores (Figure 6) also showed no differences after the W-D cycles for all management practices. However, an upward trend was noted in NP after 12 W-D cycles. This increase in the number of pores may be associated with the fragmentation of larger pores after the successive wetting and drying of the soil [60,61], which could explain the greater contribution of smaller pores to the imaged porosity, especially for MT and CT (Figure 5). The results show that the reduction in imaged porosity (Figure 5) for CT and NT was not accompanied by a reduction in NP, which shows the importance of larger pores for porosity. The number of pores found in our study is also consistent with that found in the study by Dhaliwal and Kumar [36], who found values varying between 31,835 (integrated crop-livestock system) and 42,264 (native pasture).
Considering the variability of the data, pore connectivity (Figure 7) was not significantly affected by the W-D cycles. A slight upward trend was observed for MT, with a downward trend for CT and NT. Wen et al. [57] also observed a reduction in pore connectivity with the application of 3 W-D cycles. These authors associated the reduction in pore connectivity with an increase in the number of isolated pores. This result indicates that the soil pores were displaced or deformed, indicating changes in shape. An et al. [59] showed the opposite result, but these authors worked with granite residual soil. They associated the increase in pore connectivity with the expansion and connection of small pores to other pores after successive W-D [46]. In our study, we showed a reduction in the largest pores (Figure 5), which indicates that on the scale of the aggregates analyzed, this process did not occur. Tortuosity (Figure 7) did not differ between management practices and W-D cycles. The samples under MT and CT showed practically the same tortuosity values. In the case of NT, there was an increase in tortuosity after 12 W-D cycles and consequently a reduction in pore connectivity, as expected. The greater contribution of the smaller pore volumes (Figure 5) to the imaged porosity may explain this result, as it is an indication of smaller and more isolated pores, which increases tortuosity. More aligned pores (lower tortuosity) tend to indicate a more interconnected pore system [22]. The tortuosity values found indicate a slightly tortuous pore system for all management practices, which facilitates fluid flow [36,62].
The shape of the pores (Figure 8) showed a greater contribution from triaxial pores to the imaged porosity. These pores tend to be slightly elongated, influenced by the arrangement of the soil particles. Larger quantities of these pores indicate good soil capacity for conducting solutes and for circulating air in the soil, which is vital for root respiration and plant health [63]. The presence of these pores may also be associated with greater pore connectivity, as observed for MT and CT. Triaxial-shaped pores also made a greater contribution to the number of pores (Figure 8), showing a relationship between VP and NP for the aggregates analyzed. Mady and Shein [64] point out that W-D cycles change the shape and geometry of the soil pore space. According to these authors, these changes are associated with competition between cohesive and adhesive forces in the soil during wetting and drying. The competition between these forces generates tensions that cause changes in pore architecture [65]. Ma et al. [9] showed increases in the proportion of elongated pores with W-D cycles, which is in line with the trend observed in our study for MT and NT. Dhaliwal and Kumar [36] also observed higher triaxial-shaped pore contributions to both porosity and pore number for different management practices and native pasture. Pore shapes have a direct influence on root growth and the transmission of water and air in the soil [66].
Our results showed that for the aggregate size analyzed, there were no significant changes in pore architecture based on their morphological and geometric properties. This result corroborates one of the hypotheses of this study, which may be associated with greater stability of the soil’s intra-aggregate pore system. However, a study with different types of soil and with a greater number of repetitions may provide different results than ours. An increase in the number of repetitions could influence the variability between samples. The second hypothesis concerns multifractal analysis. Our results, based on the generalized values of the fractal dimension, indicate that the analyzed porous space exhibits fractal behavior, suggesting a homogeneous rather than heterogeneous system. However, future studies involving different soil types are necessary to broaden these findings and obtain new insights using the multifractal analysis technique.

5. Conclusions

The main objective of this study was to analyze how the intra-aggregate pore architecture of soil aggregates is influenced by wetting and drying (W-D) cycles. The results of the morphological, geometric, and complexity-based properties of the pore system indicate that there were no significant differences in soil structure after 12 W-D cycles. This finding suggests that, for the soil studied, at the pore scale evaluated, the pore architecture demonstrated resilience to changes, regardless of the management practices applied.
The soil pore system exhibited fractal behavior, indicating a more homogeneous rather than heterogeneous structure. The lacunarity curves showed no significant differences between the wetting-drying (W-D) cycles across all management practices, though a downward trend was observed for conventional tillage (CT) and no tillage (NT) after 12 W-D cycles. Conversely, the opposite trend was observed for minimum tillage (MT). The lacunarity curves followed the pattern of imaged porosity, with the reduction in porosity after 12 W-D cycles attributed exclusively to a decrease in large pores for both CT and NT. In contrast, for MT, the reduction in the proportion of large pores was offset by an increase in the proportion of smaller pores. Additionally, the 3D Shannon entropy remained consistent across W-D cycles for all management practices, indicating no substantial changes in pore size distribution.
The degree of anisotropy indicated that the porous systems remained isotropic, with very similar DA values observed before and after the wetting and drying (W-D) cycles. Following 12 W-D cycles, there was a slight increase in the number of pores across the different management practices, but the difference between the cycles was not statistically significant. Pore connectivity and tortuosity exhibited minimal change after 12 W-D cycles in both MT and CT management practices, while NT showed a slight downward trend in connectivity and an increase in tortuosity, although these changes were not significant. Regarding the shape distribution of pores, the majority contribution to the imaged porosity came from pores with a triaxial shape, which were found in greater abundance within the aggregates across all management practices.
The findings of this study align with existing literature on different pore size scales, indicating that wetting and drying (W-D) cycles did not significantly alter the pore architecture of the tropical soil analyzed at the scale considered. These results are notable given the importance of pore architecture in key soil processes, such as the movement of solutes and air, and root development. However, further studies are needed to determine whether the same behavior occurs in other soil types. Additionally, it is important to analyze other wetting and drying mechanisms to see if the patterns observed in our study are consistent.

Author Contributions

Conceptualization, L.F.P.; methodology, J.A.T.d.O., J.V.G. and A.L.F.L.; software, A.N.D.P. and A.L.F.L.; validation, J.A.T.d.O., A.N.D.P. and A.L.F.L.; formal analysis, J.A.T.d.O. and J.V.G.; investigation, J.A.T.d.O. and J.V.G.; resources, L.F.P. and A.N.D.P.; writing—original draft preparation, L.F.P. and J.A.T.d.O.; writing—review and editing, L.F.P., J.A.T.d.O., A.N.D.P. and A.L.F.L.; project administration, L.F.P.; funding acquisition, L.F.P. and A.N.D.P. All authors have read and agreed to the published version of the manuscript.

Funding

This research was partially funded by “Conselho Nacional de Desenvolvimento Científico e Tecnológico” (CNPQ) (Grants 303950/2023-4 and 404058/2021-3) and “Coordenação de Aperfeiçoamento de Pessoal de Nível Superior” (Capes) (Grant Code 001).

Data Availability Statement

All data are available upon reasonable request to lfpires@uepg.br.

Acknowledgments

The authors would like to thank Sacha J. Mooney of the University of Nottingham for access to the X-ray microtomography equipment.

Conflicts of Interest

The authors declare no conflicts of interest. The invited authors Adolfo N. D. Posadas and André L. F. Lourenço, associates of Agrientech, a private company, have no financial interests. Their commercial work involves multispectral image processing for the detection of plagues and diseases in agricultural fields. Their contribution to this study draws on their previous academic expertise in multifractal image processing techniques.

Abbreviations

The following abbreviations are used in this manuscript:
W-Dwetting–drying
NTno tillage
MTminimum tillage
CTconventional tillage
X- μ CTX-ray micro-computed tomography
IAPARInstituto de Desenvolvimento Rural do Paraná
3Dthree-dimensional
TIFFtag image file format
NASS  non-linear analysis scaling system

Appendix A

Figure A1 shows the procedure for removing the soil aggregate from the inside of the samples collected in the steel cylinder.
Figure A1. Diagram for extracting the soil aggregate sample. (1) Soil sample inside the cylinder; (2) volume of soil carefully extracted from the cylinder; (3) soil aggregate extracted from the center of the sample.
Agriengineering 07 00009 g0a1
Table A1 shows the parameters obtained in the multifractal analysis for the different management practices before (0) and after (12) the application of the wetting and drying cycles.
Table A1. Multifractal parameters and generalized fractal dimensions.
ManagementCyclesParameters
Replicates Δ Af( α min ) α min D 0 D 1 D 2
CT0R10.260.402.772.992.772.752.73
R20.071.512.772.812.772.752.75
R30.061.642.772.812.772.752.74
12R10.051.592.772.802.772.762.75
R20.051.642.772.822.772.752.75
R30.081.212.772.822.772.752.75
MT0R10.051.692.772.802.772.762.75
R20.051.542.772.812.772.752.75
R30.081.642.772.812.772.752.74
12R10.101.342.772.792.772.752.74
R20.051.572.772.802.772.752.75
R30.061.592.772.812.772.752.75
NT0R10.061.382.772.812.772.752.74
R20.250.772.772.962.772.752.74
R30.081.502.772.822.772.752.74
12R10.051.522.772.802.772.762.75
R20.051.552.772.802.772.752.75
R30.051.522.772.802.772.762.75
Λ : degree of multifractality; A: degree of asymmetry; f ( α m a x ) : parameter associated with global system entropy; α m a x : parameter associated with the internal energy of the system; D 0 : capacity dimension or box count dimension; D 1 : correlation dimension; D 2 : information dimension.
Figure A2 shows the multifractal spectra obtained for the samples of the different management practices before (0) and after (12) applications of the wetting and drying cycles.
Figure A2. Multifractal spectra for samples subjected to different (0 and 12) wetting and drying 565 cycles (W-D). MT: minimum tillage; CT: conventional tillage; NT: no tillage; R: replicate.
Agriengineering 07 00009 g0a2

References

  1. Bronick, C.; Lal, R. Soil structure and management: A review. Geoderma 2005, 124, 3–22. [Google Scholar] [CrossRef]
  2. Alaoui, A.; Lipiec, J.; Gerke, H. A review of the changes in the soil pore system due to soil deformation: A hydrodynamic perspective. Soil Tillage Res. 2011, 115–116, 1–15. [Google Scholar] [CrossRef]
  3. Schlüter, S.; Sammartino, S.; Koestel, J. Exploring the relationship between soil structure and soil functions via pore-scale imaging. Geoderma 2020, 370, 114370. [Google Scholar] [CrossRef]
  4. Weidhuner, A.; Hanauer, A.; Krausz, R.; Crittenden, S.J.; Gage, K.; Sadeghpour, A. Tillage impacts on soil aggregation and aggregate-associated carbon and nitrogen after 49 years. Soil Tillage Res. 2021, 208, 104878. [Google Scholar] [CrossRef]
  5. Aziz, I.; Mahmood, T.; Islam, K.R. Effect of long term no-till and conventional tillage practices on soil quality. Soil Tillage Res. 2013, 131, 28–35. [Google Scholar] [CrossRef]
  6. Diel, J.; Vogel, H.J.; Schlüter, S. Impact of wetting and drying cycles on soil structure dynamics. Geoderma 2019, 345, 63–71. [Google Scholar] [CrossRef]
  7. Hochman, D.; Dor, M.; Mishael, Y. Diverse effects of wetting and drying cycles on soil aggregation: Implications on pesticide leaching. Chemosphere 2021, 263, 127910. [Google Scholar] [CrossRef]
  8. Leij, F.J.; Ghezzehei, T.A.; Or, D. Modeling the dynamics of the soil pore-size distribution. Soil Tillage Res. 2002, 64, 61–78. [Google Scholar] [CrossRef]
  9. Ma, R.; Cai, C.; Li, Z.; Wang, J.; Xiao, T.; Peng, G.; Yang, W. Evaluation of soil aggregate microstructure and stability under wetting and drying cycles in two Ultisols using synchrotron-based X-ray micro-computed tomography. Soil Tillage Res. 2015, 149, 1–11. [Google Scholar] [CrossRef]
  10. Yudina, A.; Klyueva, V.; Romanenko, K.; Fomin, D. Micro- within macro: How micro-aggregation shapes the soil pore space and water-stability. Geoderma 2022, 415, 115771. [Google Scholar] [CrossRef]
  11. Wang, W.; Kravchenko, A.N.; Smucker, A.J.M.; Liang, W.; Rivers, M.L. Intra-aggregate Pore Characteristics: X-ray Computed Microtomography Analysis. Soil Sci. Soc. Am. J. 2012, 76, 1159–1171. [Google Scholar] [CrossRef]
  12. Singh, N.; Kumar, S.; Udawatta, R.P.; Anderson, S.H.; de Jonge, L.W.; Katuwal, S. X-ray micro-computed tomography characterized soil pore network as influenced by long-term application of manure and fertilizer. Geoderma 2021, 385, 114872. [Google Scholar] [CrossRef]
  13. Meira Cássaro, F.A.; Posadas Durand, A.N.; Gimenez, D.; Pedro Vaz, C.M. Pore-Size Distributions of Soils Derived using a Geometrical Approach and Multiple Resolution MicroCT Images. Soil Sci. Soc. Am. J. 2017, 81, 468–476. [Google Scholar] [CrossRef]
  14. Ngom, N.F.; Garnier, P.; Monga, O.; Peth, S. Extraction of three-dimensional soil pore space from microtomography images using a geometrical approach. Geoderma 2011, 163, 127–134. [Google Scholar] [CrossRef]
  15. Zhang, Y.; Yang, Z.; Wang, F.; Zhang, X. Comparison of soil tortuosity calculated by different methods. Geoderma 2021, 402, 115358. [Google Scholar] [CrossRef]
  16. Pachepsky, Y.; Crawford, J. Fractal analysis of soils. In Encyclopedia of Soils in the Environment; Academic Press Inc.: Cambridge, MA, USA, 2004; pp. 85–97. [Google Scholar]
  17. Posadas, A.N.D.; Giménez, D.; Quiroz, R.; Protz, R. Multifractal Characterization of Soil Pore Systems. Soil Sci. Soc. Am. J. 2003, 67, 1361–1369. [Google Scholar] [CrossRef]
  18. Chun, H.C.; Giménez, D.; Yoon, S.W. Morphology, lacunarity and entropy of intra-aggregate pores: Aggregate size and soil management effects. Geoderma 2008, 146, 83–93. [Google Scholar] [CrossRef]
  19. Zhao, Y.; Hu, X.; Li, X. Analysis of the intra-aggregate pore structures in three soil types using X-ray computed tomography. Catena 2020, 193, 104622. [Google Scholar] [CrossRef]
  20. Gao, Y.; Liang, A.; Fan, R.; Guo, Y.; Zhang, Y.; McLaughlin, N.; Chen, X.; Zheng, H.; Wu, D. Quantifying influence of tillage practices on soil aggregate microstructure using synchrotron-based micro-computed tomography. Soil Use Manag. 2022, 38, 850–860. [Google Scholar] [CrossRef]
  21. Kravchenko, A.; Wang, A.N.W.; Smucker, A.J.M.; Rivers, M.L. Long-term Differences in Tillage and Land Use Affect Intra-aggregate Pore Heterogeneity. Soil Sci. Soc. Am. J. 2011, 75, 1658–1666. [Google Scholar] [CrossRef]
  22. Peth, S.; Horn, R.; Beckmann, F.; Donath, T.; Fischer, J.; Smucker, A.J.M. Three-Dimensional Quantification of Intra-Aggregate Pore-Space Features using Synchrotron-Radiation-Based Microtomography. Soil Sci. Soc. Am. J. 2008, 72, 897–907. [Google Scholar] [CrossRef]
  23. Menon, M.; Mawodza, T.; Rabbani, A.; Blaud, A.; Lair, G.J.; Babaei, M.; Kercheva, M.; Rousseva, S.; Banwart, S. Pore system characteristics of soil aggregates and their relevance to aggregate stability. Geoderma 2020, 366, 114259. [Google Scholar] [CrossRef]
  24. MINEROPAR. Serviço Geológico do Paraná. 2013. Available online: http://www.mineropar.pr.gov.br/modules/conteudo/conteudo.php?conteudo=154 (accessed on 11 September 2024).
  25. de Moraes Sá, J.C.; Séguy, L.; Tivet, F.; Lal, R.; Bouzinac, S.; Borszowskei, P.R.; Briedis, C.; dos Santos, J.B.; da Cruz Hartman, D.; Bertoloni, C.G.; et al. Carbon Depletion by Plowing and its Restoration by No-Till Cropping Systems in Oxisols of Subtropical and Tropical Agro-Ecoregions in Brazil. Land Degrad. Dev. 2015, 26, 531–543. [Google Scholar] [CrossRef]
  26. Nitsche, P.; Caramori, P.; Ricce, W.; Pinto, L. Atlás Climático do Estado do Paraná; IAPAR: Londrina, Brazil, 2019. [Google Scholar]
  27. The University of Nottingham. Our Facilities: Nanotom microCT Scanner. Available online: https://www.nottingham.ac.uk/microct/facilities/nanotom.aspx (accessed on 16 October 2024).
  28. Schneider, C.A.; Rasband, W.S.; Eliceiri, K.W. NIH Image to ImageJ: 25 years of image analysis. Nat. Methods 2012, 9, 671–675. [Google Scholar] [CrossRef]
  29. Otsu, N. A Threshold Selection Method from Gray-Level Histograms. IEEE Trans. Syst. Man Cybern. 1979, 9, 62–66. [Google Scholar] [CrossRef]
  30. The MathWorks, I. MATLAB, Version R2018a; Mathworks: Natick, MA, USA, 2018; Available online: https://www.mathworks.com (accessed on 16 October 2024).
  31. Dong, P. Lacunarity analysis of raster datasets and 1D, 2D, and 3D point patterns. Comput. Geosci. 2009, 35, 2100–2110. [Google Scholar] [CrossRef]
  32. Monreal, J.C.; Martínez, F.S.J.; Martí, J.I.; Pérez-Gómez, R. Lacunarity of the Spatial Distributions of Soil Types in Europe. Vadose Zone J. 2013, 12, 1–9. [Google Scholar] [CrossRef]
  33. Posadas, A.N.D.; Lourenço, A.L.F. NASS: Non-Linear Analysis Scaling System, Version 2; Software developed with the support of the Department of Environmental Science; Rutgers, The State University of New Jersey: New Brunswick, NJ, USA, 2023. [Google Scholar]
  34. Andraud, C.; Beghdadi, A.; Haslund, E.; Hilfer, R.; Lafait, J.; Virgin, B. Local entropy characterization of correlated random microstructures. Phys. A Stat. Mech. Its Appl. 1997, 235, 307–318. [Google Scholar] [CrossRef]
  35. Bullock, P.; Fedoroff, N.; Jongerius, A.; Stoops, G.; Tursina, T. Handbook for Soil Thin Section Description; Waine Research: Albrighton, UK, 1985; pp. 147–150. [Google Scholar]
  36. Dhaliwal, J.K.; Kumar, S. 3D-visualization and quantification of soil porous structure using X-ray micro-tomography scanning under native pasture and crop-livestock systems. Soil Tillage Res. 2022, 218, 105305. [Google Scholar] [CrossRef]
  37. Odgaard, A.; Gundersen, H. Quantification of connectivity in cancellous bone, with special emphasis on 3-D reconstructions. Bone 1993, 14, 173–182. [Google Scholar] [CrossRef] [PubMed]
  38. Roque, W.L.; Costa, R.R. A plugin for computing the pore/grain network tortuosity of a porous medium from 2D/3D MicroCT image. Appl. Comput. Geosci. 2020, 5, 100019. [Google Scholar] [CrossRef]
  39. Hammer, Ø.; Harper, D.A.; Ryan, P.D. PAST: Paleontological statistics software package for education and data analysis. Palaeontol. Electron. 2001, 4, 9. [Google Scholar]
  40. Cheik, S.; Jouquet, P.; Maeght, J.; Capowiez, Y.; Tran, T.; Bottinelli, N. X-ray tomography analysis of soil biopores structure under wetting and drying cycles. Eur. J. Soil Sci. 2021, 72, 2128–2132. [Google Scholar] [CrossRef]
  41. Liu, Y.; Zhao, Y.; Vanapalli, S.K.; Mehmood, M. Soil-water characteristic curve of expansive soils considering cumulative damage effects of wetting and drying cycles. Eng. Geol. 2024, 339, 107642. [Google Scholar] [CrossRef]
  42. Hussein, J.; Adey, M. Changes of structure and tilth mellowing in a Vertisol due to wet/dry cycles in the liquid and vapour phases. Eur. J. Soil Sci. 1995, 46, 357–368. [Google Scholar] [CrossRef]
  43. Hussein, J.; Adey, M. Changes in microstructure, voids and b-fabric of surface samples of a Vertisol caused by wet/dry cycles. Geoderma 1998, 85, 63–82. [Google Scholar] [CrossRef]
  44. de Oliveira, J.A.T.; Cássaro, F.A.M.; Posadas, A.N.D.; Pires, L.F. Soil Pore Network Complexity Changes Induced by Wetting and Drying Cycles—A Study Using X-ray Microtomography and 3D Multifractal Analyses. Int. J. Environ. Res. Public Health 2022, 19, 10582. [Google Scholar] [CrossRef]
  45. Tang, C.S.; Shi, B. Swelling and shrinkage behaviour of expansive soil during wetting-drying cycles. Chin. J. Geotech. Eng. 2011, 33, 1376–1384. [Google Scholar]
  46. Fomin, D.S.; Yudina, A.V.; Romanenko, K.A.; Abrosimov, K.N.; Karsanina, M.V.; Gerke, K.M. Soil pore structure dynamics under steady-state wetting-drying cycle. Geoderma 2023, 432, 116401. [Google Scholar] [CrossRef]
  47. Kravchenko, S. X-ray Computed Tomography Imaging & Soil Biology. In X-ray Imaging of the Soil Porous Architecture; Jon Mooney, S., Young, I.M., Heck, R.J., Peth, S., Eds.; Springer International Publishing: Cham, Switzerland, 2022; pp. 159–182. [Google Scholar] [CrossRef]
  48. Tang, C.S.; Wang, D.Y.; Shi, B.; Li, J. Effect of wetting–drying cycles on profile mechanical behavior of soils with different initial conditions. Catena 2016, 139, 105–116. [Google Scholar] [CrossRef]
  49. Caniego, F.; Martí, M.; San José, F. Rényi dimensions of soil pore size distribution. Geoderma 2003, 112, 205–216. [Google Scholar] [CrossRef]
  50. Vázquez, E.V.; Ferreiro, J.P.; Miranda, J.G.V.; González, A.P. Multifractal Analysis of Pore Size Distributions as Affected by Simulated Rainfall. Vadose Zone J. 2008, 7, 500–511. [Google Scholar] [CrossRef]
  51. Soto-Gómez, D.; Pérez-Rodríguez, P.; Vázquez Juíz, L.; Paradelo, M.; López-Periago, J.E. 3D multifractal characterization of computed tomography images of soils under different tillage management: Linking multifractal parameters to physical properties. Geoderma 2020, 363, 114129. [Google Scholar] [CrossRef]
  52. Sartori, G.; Ferrari, G.; Pagliai, M. Changes in soil porosity and surface shrinkage in a remolded, saline clay soil treated with compost. Soil Sci. 1985, 139, 523. [Google Scholar] [CrossRef]
  53. Zemenu, G.; Martine, A.; Roger, C. Analyse du comportement d’un sol argileux sous sollicitations hydriques cycliques. Bull. Eng. Geol. Environ. 2009, 68, 421–436. [Google Scholar] [CrossRef]
  54. Pires, L.F.; Auler, A.C.; Roque, W.L.; Mooney, S.J. X-ray microtomography analysis of soil pore structure dynamics under wetting and drying cycles. Geoderma 2020, 362, 114103. [Google Scholar] [CrossRef] [PubMed]
  55. Guo, X.M.; Guo, N.; Liu, L. Effects of Wetting-Drying Cycles on the CT-Measured Macropore Characteristics under Farmland in Northern China. Eurasian Soil Sci. 2023, 56, 747–755. [Google Scholar] [CrossRef]
  56. Bodner, G.; Scholl, P.; Kaul, H.P. Field quantification of wetting–drying cycles to predict temporal changes of soil pore size distribution. Soil Tillage Res. 2013, 133, 1–9. [Google Scholar] [CrossRef]
  57. Wen, T.; Chen, X.; Shao, L. Effect of multiple wetting and drying cycles on the macropore structure of granite residual soil. J. Hydrol. 2022, 614, 128583. [Google Scholar] [CrossRef]
  58. Pires, L.F.; Villanueva, F.C.; Dias, N.M.; Bacchi, O.O.S.; Reichardt, K. Chemical migration during soil water retention curve evaluation. An. Acad. Bras. Ciências 2011, 83, 1097–1108. [Google Scholar] [CrossRef] [PubMed]
  59. An, R.; Kong, L.; Zhang, X.; Li, C. Effects of dry-wet cycles on three-dimensional pore structure and permeability characteristics of granite residual soil using X-ray micro computed tomography. J. Rock Mech. Geotech. Eng. 2022, 14, 851–860. [Google Scholar] [CrossRef]
  60. Tang, C.S.; Cheng, Q.; Gong, X.; Shi, B.; Inyang, H.I. Investigation on microstructure evolution of clayey soils: A review focusing on wetting/drying process. J. Rock Mech. Geotech. Eng. 2023, 15, 269–284. [Google Scholar] [CrossRef]
  61. Ye, W.m.; Qi, Z.y.; Chen, B.; Xie, J.; Huang, Y.; Lu, Y.r.; Cui, Y.J. Mechanism of cultivation soil degradation in rocky desertification areas under dry/wet cycles. Environ. Earth Sci. 2010, 64, 269–276. [Google Scholar] [CrossRef]
  62. Chakraborty, P.; Singh, N.; Bansal, S.; Sekaran, U.; Sexton, P.; Bly, A.; Anderson, S.H.; Kumar, S. Does the duration of no-till implementation influence depth distribution of soil organic carbon, hydro-physical properties, and computed tomography-derived macropore characteristics? Soil Tillage Res. 2022, 222, 105426. [Google Scholar] [CrossRef]
  63. Pagliai, M.; Vignozzi, N.; Pellegrini, S. Soil structure and the effect of management practices. Soil Tillage Res. 2004, 79, 131–143. [Google Scholar] [CrossRef]
  64. Mady, A.Y.; Shein, E.V. Assessment of pore space changes during drying and wetting cycles in hysteresis of soil water retention curve in Russia using X-ray computed tomography. Geoderma Reg. 2020, 21, e00259. [Google Scholar] [CrossRef]
  65. Hillel, D. Introduction to Environmental Soil Physics; Elsevier: Amsterdam, The Netherlands, 2003. [Google Scholar]
  66. Ambus, J.V.; Awe, G.O.; Faccio Carvalho, P.C.d.; Reichert, J.M. Integrated crop-livestock systems in lowlands with rice cultivation improve root environment and maintain soil structure and functioning. Soil Tillage Res. 2023, 227, 105592. [Google Scholar] [CrossRef]
Figure 1. Location of the State of Paraná on the map of Brazil, the municipality of Ponta Grossa on the map of Paraná, and the experimental area where the samples were collected. IAPAR: “Instituto de Desenvolvimento Rural do Paraná”; CT: conventional tillage; NT: no tillage; MT: minimum tillage.
Agriengineering 07 00009 g001
Figure 2. Three-dimensional images of the soil pore system (terracotta color) for the following conditions: (a,b) minimum tillage for 0 and 12 wetting and drying (W-D) cycles; (c,d) conventional tillage for 0 and 12 W-D cycles; (e,f) no tillage for 0 and 12 W-D cycles.
Agriengineering 07 00009 g002
Figure 3. Three-dimensional Shannon entropy ( H * ( ε ) ) and lacunarity ( L n ( Λ )) curves for the following conditions: (a,b) minimum tillage for 0 and 12 wetting and drying (W-D) cycles; (c,d) conventional tillage for 0 and 12 W-D cycles; (e,f) no tillage for 0 and 12 W-D cycles. The error bars represent the standard deviation from the mean.
Agriengineering 07 00009 g003
Figure 4. Variation in the capacity dimension ( D 0 ) as a function of the application of wetting and drying cycles (W-D) for the following conditions: (a) minimum tillage for 0 and 12 W-D cycles; (b) conventional tillage for 0 and 12 W-D cycles; (c) no tillage for 0 and 12 W-D cycles. NS: non-significant differences determined by a t-test ( p < 0.05 ).
Agriengineering 07 00009 g004
Figure 5. Variation in porosity ( Φ ) and pore size distribution ( Φ s i z e ) as a function of the application of wetting and drying cycles (W-D) for the following conditions: (a,b) minimum tillage for 0 and 12 W-D cycles; (c,d) conventional tillage for 0 and 12 W-D cycles; (e,f) no-tillage for 0 and 12 W-D cycles. NS: non-significant differences by t-test ( p < 0.05 ).
Agriengineering 07 00009 g005
Figure 6. Variation in the degree of anisotropy (DA) and number of pores (NP) as a function of the application of wetting and drying cycles (W-D) for the following conditions: (a,b) minimum tillage for 0 and 12 W-D cycles; (c,d) conventional tillage for 0 and 12 W-D cycles; (e,f) no tillage for 0 and 12 W-D cycles. NS: non-significant differences determined by a t-test ( p < 0.05 ).
Agriengineering 07 00009 g006
Figure 7. Variation in pore connectivity (C) and tortuosity ( τ ) as a function of the application of wetting and drying cycles (W-D) for the following conditions: (a,b) minimum tillage for 0 and 12 W-D cycles; (c,d) conventional tillage for 0 and 12 W-D cycles; (e,f) no- tillage for 0 and 12 W-D cycles. NS: non-significant differences determined by a t-test ( p < 0.05 ).
Agriengineering 07 00009 g007
Figure 8. Contribution of the different pore shapes to the volume (VP-S) and number of pores (NP-S) for the following conditions: (a,b) minimum tillage for 0 and 12 wetting and drying (W-D) cycles; (c,d) conventional tillage for 0 and 12 W-D cycles; (e,f) no-tillage for 0 and 12 W-D cycles. Eq.: equant; Pr.: prolate; Ob.: oblate; Tr.: triaxial. NS: non-significant differences by t-test ( p < 0.05 ).
Agriengineering 07 00009 g008
Disclaimer/Publisher’s Note: The statements, opinions and data contained in all publications are solely those of the individual author(s) and contributor(s) and not of MDPI and/or the editor(s). MDPI and/or the editor(s) disclaim responsibility for any injury to people or property resulting from any ideas, methods, instructions or products referred to in the content.

