Abstract
Low ventilation rates used to conserve energy in pig nurseries in winter can worsen air quality, harming piglet health. A recirculating air cleaner consisting of a dust filter and ultraviolet C (UVC) lamps was evaluated in a pig nursery. It had a recirculation rate of 6.4 air changes per hour, residence time of 0.43 s, and UVC volumetric dose of 150 J·m−3. Reduced ventilation led to high particulate matter (PM) concentrations in the nursery. During the first 9 d, the air cleaner increased floor temperature in its vicinity by 1.9 °C vs. a more distant location. The air cleaner had average removal efficiencies of 29 and 27% for PM2.5 (PM with aerodynamic equivalent diameter or AED < 2.5 µm) and PM10 (PM with AED < 10 µm), respectively. It reduced PM2.5 and PM10 concentrations by 38 and 39%, respectively, in its vicinity vs. a more distant location. The air cleaner was mostly inconsistent in inactivating heterotrophic bacteria, but it eliminated fungi. It trapped 56% of the ammonia but did not trap nitrous oxide, methane, or carbon dioxide. The air cleaner demonstrated the potential for reducing butanoic, propanoic, and pentanoic acids. Design improvements using modeling and further testing are required.
1. Introduction
Due to economics, most pigs in the U.S. are raised in confinement vs. outdoors. However, when pigs are raised in confinement, indoor air quality deteriorates, particularly in winter when ventilation is reduced to conserve energy. The poor air quality is due to high concentrations of particulate matter (PM), gases (e.g., ammonia or NH3), and microbes (including pathogens). In addition to manure, skin flakes, and feed, PM in pig houses also comprises microbes, their products (e.g., endotoxins), and noxious compounds, including gases [1]. When inhaled, all three components, PM, bioaerosols, and chemicals, can irritate the respiratory system, decrease immune resistance, and cause cardiopulmonary disease [2,3]. Of all the pig production stages, the nursery stage, where weaned piglets are raised for 6 to 8 weeks prior to transfer to the grow–finish stage, deserves attention because of its lowest winter ventilation rate. Routine mortality in the nursery was ~5.5% in large U.S. swine operations [4], of which ~47% was due to respiratory diseases [5].
Pig nurseries had higher total suspended particulates (TSP), PM4 (PM with aerodynamic equivalent diameters (AED) ≤ 4 µm), and endotoxin concentrations than the other production stages [6]. Pig nurseries had higher fine PM or PM2.5 (AED ≤ 2.5 µm), PM10 (AED ≤ 10 µm), and NH3 concentrations than grow–finish houses [7]. Nurseries tended to have the smallest PM vs. the other stages due to lower ventilation rates [8]. Due to its smaller size, PM2.5 can reach the alveoli, deep inside the lung, and even enter the bloodstream; hence, it is referred to as the ‘high-risk’ respirable fraction [9]. While PM10 is mostly retained in the upper respiratory system, it is mostly responsible for the transport of bacteria and fungi [10]. Bioaerosols also transmit the top three disease pathogens (Streptococcus suis bacteria, porcine reproductive and respiratory syndrome virus, influenza virus) of U.S. pig nurseries [5] as well as the porcine epidemic diarrhea virus [11]. Recirculation of filtered air can reduce PM and bioaerosol levels in pig houses, which could improve pig health and performance [12]. Even partial improvement in air quality could be beneficial since every 10% increase in lung damage is estimated to reduce average daily weight gain (ADWG) by 5% [13].
Ultraviolet germicidal irradiation (UVGI), emitting ultraviolet C (UVC) radiation (200 to 280 nm range), has been shown to be effective in reducing bioaerosol concentrations (i.e., bioburden). Design of a UVGI system requires calculation of the exposure dose or fluence (DE) [14]:
where Iλ is the UVC irradiance (mW·cm−2) received by the microbe’s surface as it travels through the cleaner and Et is the residence time (s). Residence time is the ratio of the system volume to the airflow rate (Q). One log or 90% reduction in airborne bacterial concentration requires a fluence dose (DE90) of 6 J·m−2 [15]. Since Iλ (hence, DE) varies in all three dimensions in the cleaner, a system-averaged DE may require modeling followed by validation. Therefore, Wang et al. [16] proposed a simpler UVC volumetric dose rate (DQ):
where PUVC is the UVC power produced by the lamp. One log or 90% reduction in airborne E. coli concentration required a DQ (or DQ90) of 169 J·m−3 [16] or a median DE90 of 11 J·m−2 [15].
Since UVC effectiveness is reduced when the microbe is attached to PM [17], in livestock houses, it is important to reduce PM concentrations. A recirculating electrostatic precipitator (ESP) supplemented with UVC irradiance moderately reduced TSP and bacteria and modestly reduced PM10 in a layer house [18]. A recirculating air cleaner comprising a polyester pocket filter and germicidal lamps was effective in reducing the bioaerosol and PM concentrations in a small pig room [19]. StuffNix® (Big Dutchman, Vechta, Germany), a proprietary air filter, reduced concentrations of TSP, PM10, and PM2.5 by >55% when used inside a layer house [20]. Though not as efficient as pocket air filters, the StuffNix® PM filter, which was designed to reduce livestock house PM emissions, might require less frequent cleaning.
Germicidal irradiance can also break down volatile organic compounds (VOCs), many of which are odorous and noxious gases. When the interior surfaces exposed to UVC irradiance are coated with a photocatalyst, titania (TiO2) formation of the hydroxyl radical (·OH) increases the destruction of gases [21] as well as microbes [22] vs. untreated surfaces. Hence, a recirculating air cleaner that combines UVC, photocatalysis, and PM filtration will not only improve indoor air quality but may also reduce odor and noxious gas emissions. In winter, when ventilation rates are low, increased air mixing can reduce thermal stratification and increase floor temperatures, which may reduce energy use [23] and improve animal performance. Finally, since the UVC lamps are located inside the air cleaner, the risk of harmful exposure to UVC irradiance is eliminated.
Hence, the objectives of this research were to (i) design and fabricate a proof-of-concept recirculating air cleaner, (ii) assess its impact on floor temperature in a pig nursery, (iii) test its effectiveness in trapping or degrading pig nursery air pollutants passing through it, and (iv) test its impact in reducing PM concentrations in its vicinity.
2. Materials and Methods
The prototype was designed and fabricated at the Biological and Agricultural Engineering Department, North Carolina State University (NCSU). The prototype was tested in a pig nursery room at the College of Veterinary Medicine (CVM), NCSU, during February 2025 when ambient average, maximum, and minimum hourly temperatures were 9, 23.1, and −2.1 °C, respectively. Since this study was not an interventionary study of the piglets, no ethical approval was required.
2.1. Design and Fabrication of the Recirculating Air Cleaner
The prototype is shown in Figure 1. Nursery air was drawn in through the StuffNix® filter (0.36 m × 0.36 m) housed in a galvanized square-to-round transition. After partial filtration, the air entered the treatment section or the aluminum duct (0.97 m × 0.24 m ϕ ID). In the treatment section, the air was irradiated by two low-pressure, self-ballasted CFL25 germicidal lamps (LSE Lighting, Worchester, UK; total output: 25 W; UVC output: 7.5 W; life: 7000 h) in line with the airflow (Figure 1) and located in the center of the duct. Two 12.7 mm thick aluminum honeycomb panels were placed together mid-length of the treatment section (Figure 1). The inner surface of the duct and honeycomb, with a total surface area of ~1.38 m2, was coated with TiO2 at 0.2 g·m−2 by PURETi, LLC (Cinncinnati, OH, USA), a manufacturer of photocatalytic coatings, free of cost. The irradiated air was exhausted by a 0.15 m variable speed DC fan (EBM-Papst, Mulfingen, Germany; model: 6424 H; 0.134 m3·s−1 at 0 Pa). The fan airflow rate was controlled using a voltage regulator. A pressure tap approximately mid-way between the top of the lower lamp and honeycomb was connected to the low-pressure port of a DM-2003-LCD differential pressure transmitter (DPT) (Dwyer Instruments, Michigan City, IN, USA; range: 0–125 Pa; accuracy: ±1% full scale) with an LCD display to measure pressure drop (Δp). The high-pressure port of the DPT was exposed to room air but was sheltered from drafts. As discussed in Section 2.3, the treatment section of the air cleaner was inclined due to the nursery ceiling height.
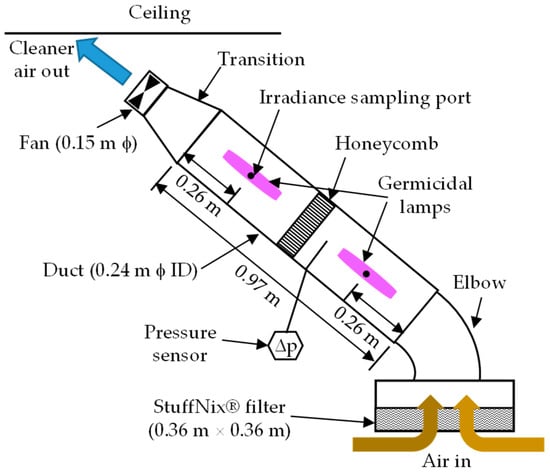
Figure 1.
Schematic of the recirculating air cleaner. Not to scale.
In the empty CVM nursery (Section 2.2), the recirculating air cleaner had a Q of 0.10 m3·s−1 with a 24 VDC power supply. A Testo 420 balometer (Titisee-Neustadt, Germany; accuracy: ±3% of measured value + 0.003 m3·s−1) was used to measure Q at the air intake. The pressure drop measured with DPT at the location shown in Figure 1 was 45 Pa. The total Δp of the system would have been higher since the pressure port only measured upstream Δp. The average surface velocity through the Stuffnix® filter was 0.79 m·s−1, within the range of values (0.7 to 1.25 m·s−1) reported in the literature [20,24]. Based on Q and treatment section dimensions, Et was 0.43 s, lower than Et values (1.0 to 1.55 s) in the nursery reported by Eisenlöffel et al. [19]. Schulz et al. [25] used an Et of 0.58 s for a pig house recirculating air cleaner that combined UVC radiation with wet scrubbing.
Irradiance values at the two ports (Figure 1), which coincided with the mid-heights of the two lamps, were measured with a UVC (254 nm) radiometer (Analytik Jena, Jena, Germany; model: UVX; accuracy: ±5%). The Iλ values were 1.69 and 1.09 mW·cm−2 for an average of 1.39 mW·cm−2; this large difference at the two locations was due to the difference in orientation of the quad tube UVC lamps with respect to the ports and variability between lamps. Hence, an average Iλ of 1.39 mW·cm−2 was assumed to be the maximum Iλ at the duct inner surface. Eisenlöffel et al. [19] reported Iλ values of 1.10 and 1.28 mW·cm−2 in the pig house. Using Equation (1), in this study, DE was 5.98 J·m−2, and using Equation (2), DQ was 150 J·m−3. Based on the TiO2-coated surface area in the treatment section (including the honeycomb) and Q, the specific surface area (SSA) for photocatalysis was 13.8 m2·m−3 of air.
2.2. Nursery Description and Management
Dimensional details of the CVM nursery are shown in Figure 2. The room housed 60 piglets, 12 piglets per pen. The pigs were raised on slatted plastic floors with the waste collecting beneath in shallow pits flushed with fresh water. Ventilation was provided by a 0.60 m exhaust fan, and continuous inlets were located above the fan (Figure 2b). A 17.6 kW forced air heater (Figure 2) was used to heat the room, though electric brooding lamps were provided as needed. The nursery manager operated the ventilation system manually based on the age of the pigs and the weather. Sixty piglets weaned at 3 weeks of age were placed in the nursery on 1 February. Brooder lamps were used during the 9 days. The nursery manager mitigated the high dust levels (presumably due to low ventilation rates) by washing the floor on most days. The pigs were moved out on 29 February 2024.
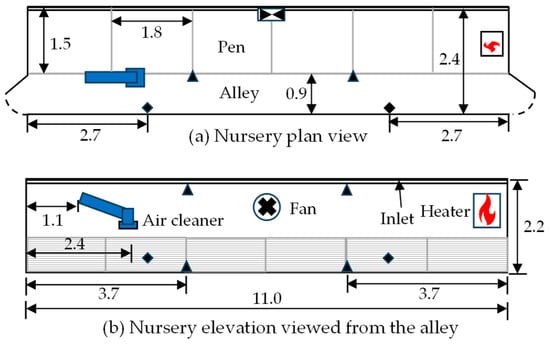
Figure 2.
Nursery layout—(a) plan and (b) elevation. The filled triangles show the locations of the temperature sensors, while the diamonds show the locations where PM and microbial samplings were performed. All dimensions are in meters. Not to scale.
2.3. Recirculating Air Cleaner Testing and Analyses
The air cleaner was installed in the empty nursery on 31 January 2024. To facilitate access for monitoring, it was inclined at ~30° from the horizontal (Figure 2b) instead of installing it horizontally, under the ceiling. The air cleaner was located mostly in the alley (Figure 2a) to allow the alley to be used while minimizing disturbing the pigs. Based on the nursery dimensions (Figure 2) and with an airflow rate of 0.10 m3·s−1, the air cleaner provided an air recirculation rate per minute equal to 10.7% of the nursery volume or 6.4 air changes per hour (ACH). In U.S. broiler houses, an air recirculation rate on a per-minute basis equal to 10% of the brood chamber volume is considered adequate for controlling thermal stratification [23]. Two pairs of temperature loggers (Gemini Data Loggers, Chichester, UK; model: Tinytag Ultra 2; accuracy: ±0.4 °C) were installed 3.7 m from each end of the room or 3.6 m apart. At each location, one logger was installed ~0.15 m above the floor and tied to the pen partition (to protect it from the pigs and water), while the other logger was installed 2.0 m above it, close to the ceiling. Due to greater air mixing near the air cleaner, ceiling-to-floor temperature difference (thermal stratification) near the air cleaner was expected to be lower than stratification farther away. Hence, the logger closer to the floor near the air cleaner was expected to measure higher temperatures than the distant logger. The temperature loggers were programmed to record data every 5 min. As mentioned in Section 2.1, the air cleaner’s Δp was recorded on a Hobo UX120-006M data logger (Onset Computers, Bourne, MA, USA) every 15 min over the study period.
The ability of the air cleaner to reduce the concentrations of several PM fractions (PM1, PM2.5, PM4, PM10, and PM15) was tested during 5–9 February using an optical PM sampler, the DustTrak™ DRX 8534 (TSI, Inc., Shore View, MN, USA), which can simultaneously measure and log concentrations. The DRX 8534 sampler’s size-selective inlet excludes PM larger than PM15 and PM with AED ≤ 15 µm. The PM samplers were flow-calibrated at 3.0 L·min−1 using an accurate mass flow controller (MFC) on 5, 7, and 9 February, prior to starting measurements that day. Both PM samplers were zero-calibrated prior to every measurement. To determine the effectiveness of the air cleaner in trapping PM, PM concentrations were measured for 10 min at a frequency of 1 Hz at the inlet and in front of the outlet of the air cleaner using individual PM samplers. The effectiveness of the air cleaner in reducing PM concentrations in its vicinity was determined by measuring PM concentrations 2.7 m from each end of the room or 5.4 m apart in the alley, as shown in Figure 2, for 10 min at 1 Hz. The PM samplers were ~0.45 m above the floor to be at the same level as the breathing zone of the piglets. During 5–8 February, after taking one set of readings at the air cleaner inlet and outlet, another set of readings was taken at the two locations in the alley. After collecting one set of measurements at the inlet and outlet, measurements were made at the two locations in the alley; then, the process was repeated. These two sets of measurements (taken within 45 min of one another) provided more representative results. On 9 February, only one set of inlet–outlet measurements and one set of measurements at the two locations in the alley were made. The ventilation fan was never operated while PM sampling was being performed.
Removal efficiency (RE, %) of the air cleaner for any PM fraction (or other pollutant) was calculated as follows:
where CIN and COUT are pollutant concentrations at the inlet (IN) and outlet (OUT), respectively. To assess the impact of the air cleaner on PM concentrations in the alley, close (CLO) to and farther away (DIS) from the air cleaner, the IN and OUT concentrations were replaced with DIS and CLO concentrations, respectively, and RE was renamed reduction. During 5–8 February, readings from the two sets of measurements at the location were averaged for the same second. At each of the four sampling locations, the 600 1 s measurements were assumed replicates for statistical comparison between IN vs. OUT or CLO vs. DIS locations. One-tailed paired Student t-test assuming unequal variance (α = 0.05) in Excel was used to test if the IN concentration was significantly higher than the OUT concentration and if the CLO concentration was higher than the DIS concentration for each PM fraction.
The ability of the air cleaner to reduce microbial concentrations was evaluated during 13–19 February using the all-glass AGI-30 impinger (Ace Glass, Inc., Vineland, NJ, USA) deployed at the IN and OUT locations for 10 min. The impinger medium was 20 mL of normal saline medium consisting of 0.85% NaCl, 0.005% antifoam, and 0.01% Tween 80 following Liu et al. [26]. An accurate MFC and needle valve were used to set the sampling train airflow rate to 12.5 L·min−1 in the lab. Five pairs of bioaerosol samples were collected at the inlet and outlet of the air cleaner on 13, 15, 16, and 19 February, with two pairs collected on 13 February (AM and PM). Briefly, the impinger and silicone tubing (connecting the impinger to the vacuum pump) were washed with lab detergent and oven-dried at 105 °C. After loading the sampling medium into the impinger, the impinger inlet and tube outlet were wrapped with aluminum foil and autoclaved. Disposable rubber gloves were worn while handling the impingers. The impingers were transported to the nursery on ice. Upon sampling, the impingers were transported back to the lab on ice. In a laminar fume hood, disposable pipettes were used to transfer the media into labeled sterile plastic cups and determine their volumes. The samples were transported on ice to a commercial lab the same day for total heterotrophic bacteria and total fungi analyses.
Total heterotrophic bacteria were quantified by 100-fold (or 10-fold) serial dilution and spread plating on tryptic soy agar (TSA). Total fungi as quantified by 10-fold serial dilution and spread plating on malt extract agar (MEA). The microbial concentration in colony-forming units (cfu) per milliliter reported by the lab was converted into airborne concentrations (cfu·m−3) by multiplying the liquid concentration (cfu·mL−1) by the liquid volume (mL) and dividing by the product of airflow rate (0.0125 m3·min−1) and duration (10 min). Removal efficiencies of the air cleaner for total bacteria and fungi were calculated for each event using Equation (3). Statistics were not used to compare IN vs. OUT concentrations since monitoring was performed over several days, during which time there were changes in the size of pigs, management, and environmental conditions. Therefore, measurements made at the same location on different days were not replicates. This same reason ruled out the use of statistics for other pollutants that follow.
Acid scrubbers were deployed during 12–22 February 2024 at the IN and OUT locations of the air cleaner to determine its effectiveness in reducing ammonia (NH3) concentrations [20]. At each location, air was pulled in through a 2% (w/v) boric acid scrubber with a vacuum pump. The scrubber was replaced every 48 to 72 h with a fresh scrubber. However, a timer was used to operate both scrubber pumps ON and OFF for 30 min each. A stoppered scrubber flask with acid was also adjacent to the IN scrubber as a field blank. The airflow rate through the sampling train was measured with a flowmeter (Cole-Parmer, Vernon Hills, IL, USA; model: 023-92-GL, accuracy: ±2%) at the beginning and end of the scrubber deployment, and the average value was assigned as the airflow rate for that duration. The spent scrubber solution’s volume was measured, and its liquid phase ammonium-N (NH4+-N) concentration was determined colorimetrically (minimum detection limit (MDL): 0.05 mg-N·L−1).
Time-averaged (~48 or 72 h) NH3 concentration (mg·m−3) was calculated as follows:
where the coefficient 1.214 converted liquid NH4+-N concentration ([NH4+-N]l) into NH3 concentration, V was the scrubber volume (L), 103 converted mg·L−1 to mg·m−3, q was the scrubber airflow rate (L·min−1), and Δt was the net run scrubber runtime. The term ([NH4+-N]l × V) in Equation (4) was the net NH4+-N mass obtained after adjusting for the mass in the field blank. The ammonia RE of the air cleaner was calculated for each event using Equation (3).
The RE of the air cleaner with respect to three greenhouse gases (GHGs) was determined by collecting five pairs of gas samples (8, 9, 12, 15, and 16 February) at the inlet and outlet of the air cleaner. Samples were collected with a 1 L∙min−1 vacuum pump in 10 L Tedlar® bags (SKC, Inc., Eighty Four, PA, USA) and analyzed on a photoacoustic analyzer (LumaSense Technologies, Ballerup, Denmark; model: Innova 1412) for concentrations of nitrous oxide (N2O), methane (CH4), and carbon dioxide (CO2).
The air cleaner’s effectiveness in reducing VOCs was evaluated by collecting gas samples with a 1 L∙min−1 vacuum pump in 1 L Flexfoil® bags (SKC, Inc.) at the IN and OUT locations on 20 February 2024. The sample bags were transported back on ice to NCSU’s Molecular Education, Technology and Research Innovation Center (METRIC), where the samples were analyzed on an Agilent Technologies (Santa Clara, CA, USA) Intuvo 9000 gas chromatograph (GC) coupled to an Agilent 5977C mass spectrometer detector (MSD). The GC used an Agilent J&W DB-5MS Ultra Inert column (30 m × 0.25 mm × 0.25 µm). The oven temperature program of the GC was as follows: 35 °C and hold for 5 min; ramp at 5 °C∙min−1 to 140 °C; ramp at 15 °C∙min−1 to 230 °C and hold for 5 min. The MSD was operated in scan mode with electron ionization, and the scan range was m/z of 28 to 450 at a rate of 5.4 scans∙s−1. Using a gas-tight syringe, 1 mL of the gas was injected into the GC with a He flowrate of 1.5 mL∙min−1. The GC-MSD protocol was similar to the one used by Trabue et al. [27].
On 3 days (22, 23, and 27 February), solid phase microextraction (SPME) fibers were used to test the effectiveness of the air cleaner in reducing VOC concentrations. Since the SPME fiber adsorbed the VOCs, it was expected to produce larger signals than injected gas samples. Individual divinylbenzene/carboxen/polydimethylsiloxane (DVB/CAR/PDMS) SPME fibers (Millipore Sigma, Burlington, MA, USA; product # 57299 U; length: 2 cm) were deployed simultaneously with their holders at the IN and OUT locations of the air cleaner for 15 min. Thereafter, SPME fibers were brought back to METRIC in clean plastic bags and analyzed on the GC-MSD. The oven temperature program of the GC used by Osaka et al. [28] was modified slightly as follows: 40 °C and hold for 3 min; ramp at 7 °C∙min−1 to 220 °C and hold for 5 min. The MSD was operated in scan mode with electron ionization, and the scan range was m/z of 35 to 450 at a rate of 5.4 scans∙s−1. The helium flow rate was 1.2 mL∙min−1. After analysis of the GC-MSD, the SPME was thermally desorbed in the GC following the manufacturer’s protocol in preparation for the next deployment.
Standards were not used for compound matching since manure gases contain numerous compounds (e.g., [28,29]), and the focus of this research was to evaluate changes in concentration between the inlet and outlet rather than quantifying concentration. Each sample’s chromatogram had numerous compounds, some of which had very poor match quality (when compared to the NIST spectral library). Further, the same compound was eluted from the GC column at many different times. Therefore, for each sample, two text files containing residence time, percent area, compound name, and match quality were obtained and input into an ‘R’ program (version 4.3.2) that outputs a text file that excluded match qualities < 50% and composited the areas of a compound eluting at different times (Code S1). The resulting text file was imported into MS Excel 2016 for further analysis and display. In the final analysis, all siloxane compounds were eliminated, even though some of them may have formed due to a reaction with the sample compounds. Siloxane could have leached from the GC column, SPME fiber, or from the Flexfoil® bag septa. Due to damage to the SPME fibers, data for 23 and 27 February were discarded.
Once every week, while downloading the data loggers and partially cleaning the PM filter, the air cleaner was turned off for about 15 min to let the fan and UVC lamps cool down. At the end of the study, despite having considerable deposition on the PM filter (Figure 3), Q had declined by <4% compared to the initial value of 0.10 m3∙s−1. Ozone (O3) concentrations at pig level were undetectable with an Aeroqual 500 monitor with an O3 sensor (Auckland, New Zealand; model: EOZ; range: 0–10 ppm; accuracy: <±10 ppb ± 7.5%; MDL: 10 ppb) twice during the study. This was considered important because, at higher concentrations, O3 can be harmful to pig health even though UVC (254 nm) lamps produce negligible O3. While there is no time-weighted average (TWA) recommended exposure limit (REL) for pigs, the U.S. National Institute for Occupational Safety and Health (NIOSH) has a TWA REL of 100 ppb for 10 h for humans [30]. Hence, the UVC lamps used in this study did not expose the pigs to harmful O3 levels. Since CO2 concentrations can be indicative of ventilation status and ventilation rate was not monitored, CO2 concentrations were measured for 3 days beneath the air cleaner at pig height using a CO2 monitor (Arizona Instruments, Chandler, AZ, USA: model: AZ 77535; range: 0–9999 ppm; accuracy: ±30 ppm ± 5% of reading). Around 9–10 am, on 13, 19, and 23 February, CO2 concentrations were 3000, 3900, and 3300 ppm, respectively. Since CO2 concentrations > 1500 ppm are associated with increased respiratory disease and reduced productivity [31], the nursery needed higher levels of ventilation.
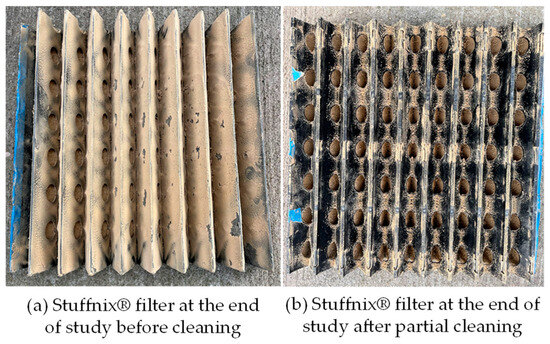
Figure 3.
Views of the Stuffnix® PM filter at the end of study (a) before and (b) after partial cleaning.
3. Results and Discussion
3.1. Floor Temperature
Hourly temperature data of the four sensors inside the nursery during 1–24 February 2024 are presented in Figure 4. Also presented are ambient hourly temperatures measured at the Reedy Creek Field Labs, Raleigh, 3.7 km from the CVM nursery. Temperature data from the logger near the ceiling close to the air cleaner (CLO-CE) were lost during 1–5 February. During 1–9 February, when both the brooder lamps and forced air heater were operating, the average floor temperature close to the air cleaner (CLO-FL) was 25.6 ± 0.7 °C vs. 23.5 ± 1.1 °C for the more distant logger near the floor (DIS-FL) (Figure 4). Floor temperatures near the air cleaner were slightly higher than the more distant floor temperatures later, even when the brooder lamps were turned off. This smaller difference was due to higher ventilation rates because of older pigs and warmer weather during 10–16 February (Figure 4). It was colder during 16–22 February, causing the forced air heater to run longer, and the heater’s blower (~0.12 m3∙s−1) provided good air mixing. With similar ceiling temperatures at the two locations, because floor temperatures closer to the air cleaner were higher, the air cleaner reduced thermal stratification near the air cleaner.
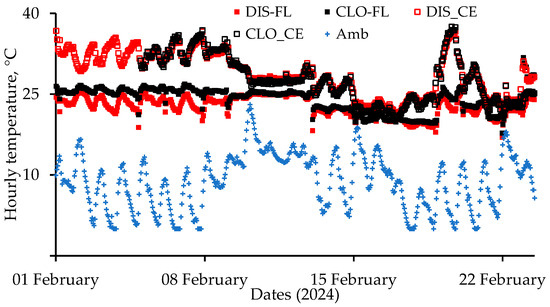
Figure 4.
Hourly temperatures at the Distant—Floor (DIS-FL), Close—Floor (CLO-FL), Distant—Ceiling (DIS-CE), and Close—Ceiling (CL-CE) locations inside the nursery. Hourly temperatures inside the nursery were obtained by averaging 12·5 min values. Data for the CLO-CE sensor were lost for the first 4 d. Hourly ambient temperatures (Amb) measured at the Reedy Creek Field Labs, Raleigh, are also presented.
Air mixing increased floor temperatures and reduced energy use in broiler houses (e.g., [23,32]). However, in this study, low ventilation rates, as indicated by high CO2 concentrations (Section 2.3), combined with a low air recirculation rate corresponding to 6.4 ACH, led to warmer floors only close to air cleaner. A higher ACH might have increased floor temperature in the entire nursery and reduced energy use.
3.2. Particulate Matter Removal and Reduction
Concentrations of the various PM fractions measured at the inlet and outlet of the air cleaner during 5–9 February 2024, as well as their 5 d average values, are presented in Figure 5. Figure 5 also includes the RE (Equation (3)) of the air cleaner for the different PM fractions. The 5 d average RE (Figure 5f) for any PM fraction is based on the average IN and OUT concentrations. Since the DustTrak™ DRX 8534 PM sampler excludes PM > 15 µm, TSP concentrations were likely much higher. Every day and for every PM fraction, the average IN concentration was significantly higher (t-test p < 0.01) than the corresponding OUT fraction, indicating that RE was significantly greater than 0%. As mentioned in Section 2.2, a one-tailed t-test assuming unequal variance was used to assess if the IN concentrations were higher than the OUT concentrations for each of the 5 d. However, a statistical comparison was not made between the 5 d average IN and OUT concentrations (Figure 5f) since the dates are not replicates. The error bar for each location and PM fraction included in Figure 5f is the standard deviation (SD) of the five daily mean values for that PM fraction and location. The error bars were only included to illustrate the variability over the 5 d period.
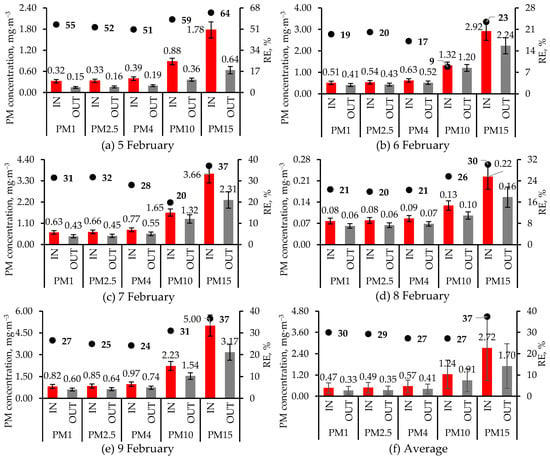
Figure 5.
Concentrations of PM fractions at the air cleaner inlet (IN) and outlet (OUT) and removal efficiency (RE, Equation (3)), bolded, during 5 d in February 2024, as well as their average. Except for 9 February, when one set of 10 min (1 Hz) measurements were made at the IN and OUT locations, on other days, two sets of measurements were made at each location, which were then averaged. For each day, the mean and SD (error bar) for each PM fraction are based on 600 1 s measurements. However, in (f), each value and its error bar are the average and SD of the five daily values. On every date and for every PM fraction, the IN concentrations were significantly higher (t-test p < 0.01) than the OUT concentrations. Statistical significance was not tested for the average PM fractions (f). The figures have different primary and secondary Y-axis scales.
Inlet PM concentrations varied greatly among the 5 d, with the lowest concentrations on 8 February and the highest concentrations on 9 February. Whereas the floor had just been washed prior to PM sampling on 8 February, it was washed after PM sampling on 9 February, resulting in a large difference in PM concentrations (Figure 5). Similarly, RE values varied widely (Figure 5). For all PM fractions, the highest RE values were observed on 5 February when PM concentrations were relatively low. However, on 8 February, when inlet PM concentrations were the lowest, RE values were lower than RE values on 5 February (Figure 5). With the highest PM concentrations on 9 February, RE values were lower than on 5 February but slightly higher than on 8 February when PM concentrations were the lowest. It was unclear why RE for all PM fractions, but especially PM10, was the lowest among all days even though inlet concentrations were neither too high nor too low (Figure 5). Winkel et al. [24] reported that inlet concentrations did not affect the performance of Stuffnix® when used to reduce emissions from layer house. While the fabric filter’s efficiency increases with PM accumulation [33], this was not true of the Stuffnix® since it had been accumulating PM since the system began operating on 1 February before being partially cleaned on 9 February, after PM sampling had been performed.
Typically, with filters and ESP, RE increased with particle size [24]. Averaged over the 5 d, RE was highest for the PM15 fraction and, surprisingly, lowest for the PM10 fraction, though the four PM fractions < 10 μm had similar RE values (Figure 5f). The Stuffnix® filter reduced layer house emissions of PM10 by 40%, but it did not reduce PM2.5 emissions [24]. However, the Stuffnix® filter reduced layer house indoor concentrations of PM2.5, PM10, and TSP by 63, 57, and 55%, respectively [20]. Winkel et al. [24] reported inlet PM10 concentrations of ~2.9 mg∙m−3, much higher than in this study, but their inlet PM2.5 concentrations (<0.2 mg∙m−3) were generally lower, and a much smaller fraction of PM10 (Figure 5) than in this study. Differences in PM properties between swine and layer houses might explain the difference in Stuffnix® performance between this study and published studies [20,24]. No studies on the use of Stuffnix® in pig houses are available.
Temporal changes in air cleaner inlet and outlet PM2.5 and PM10 concentrations on 5 February are shown in Figure 6. The PM concentration at any point in time is the average of the two measurements made at that location. The sharp spikes in inlet concentrations were due to increased pig activity. The air cleaner was generally effective in attenuating these spikes, as is clear from smaller fluctuations in outlet concentrations (Figure 6) as well as generally lower SD values at the outlet (Figure 5).
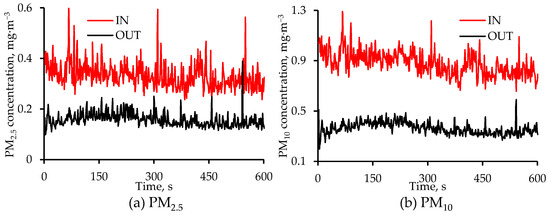
Figure 6.
Diurnal changes in the air cleaner IN and OUT concentrations of (a) PM2.5 and (b) PM10 on 5 February 2024. The measurement frequency was 1 Hz, and each value is the average of two values, one from each set of measurements at that location. The Y-axis in the two figures above have different scales.
Concentrations of the various PM fractions measured during 5–9 February 2024 at two locations in the alley (see Figure 1 for clarification), as well as their 5 d average values, are presented in Figure 7. Also shown in Figure 7 are reductions in concentrations of each PM fraction at CLO vs. the DIS location. Unlike the daily values, the t-test was not used to compare the 5 d average CLO and DIS concentrations for the five PM fractions (Figure 7f) since the dates are not replicates. The error bar for each location and PM fraction included in Figure 7f is the SD of the five daily values for that PM fraction and location. These error bars were only included to illustrate the variability over the 5 d period. Each day and for every PM fraction, PM concentration at the DIS location was significantly higher (t-test p < 0.01) than at the CLO location. Hence, the air cleaner significantly reduced PM concentrations in its vicinity compared to the more distant location by bringing in cleaner air and promoting more mixing. The average reduction in the concentrations of the different PM fractions at the CLO vs. the DIS location varied within a narrow range, with the greatest reduction observed for the PM15 fraction and the smallest for the PM4 fraction (Figure 7f). The total PM concentrations at the two locations were likely much higher than the PM15 concentrations shown in Figure 7 since the PM monitors excluded PM > 15 µm. Since bioaerosol concentration increases with PM concentration, it could be hypothesized that the air cleaner reduced the bioburden in its vicinity vs. the more distant location.
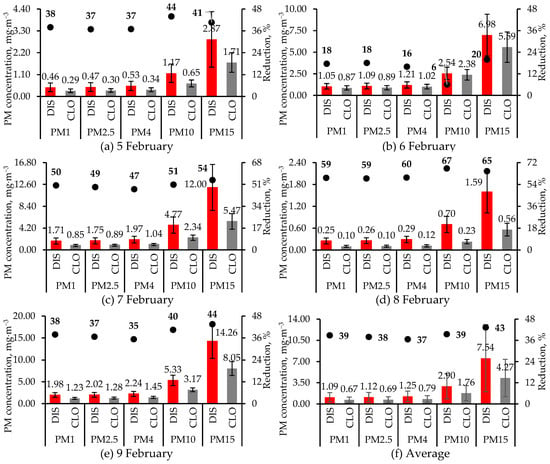
Figure 7.
Concentrations of PM fractions in the alley close to (CLO) and distant from (OUT) the air cleaner on 5 d during February 2024. Reductions in concentrations of PM fractions at the CLO location vs. the DIS location are also shown. Except for 9 February, when one set of 10 min (1 Hz) measurements were made at the CLO and DIS locations, on other days, two sets of measurements were made at each location, which were then averaged. For each day, mean and SD (error bar) for each PM fraction are based on 600 1 s measurements. However, in (f), each value and its error bar are the average and SD of the five daily values. On every date and for every PM fraction, the DIS concentrations were significantly higher (t-test p < 0.01) than the CLO concentrations. Statistical significance was not tested for the average PM fractions (f). The figures have different primary and secondary Y-axis scales.
High variability in PM concentrations over the sampling period may have been due to the time elapsed between the time of sampling and when the floor was washed, which was also discussed earlier. Ventilation might have also contributed, even though the exhaust fan was always off during PM sampling. Concentrations of all PM fractions at the floor locations (Figure 7) were higher than the IN concentration of the same PM fraction (Figure 5) because of dilution due to greater airflow into the air cleaner.
Average PM4 (Figure 7f) exceeded the recommended level of 0.23 mg·m−3 for pigs [34] by more than five times. In fact, even the average concentration of PM1 (Figure 7f), the ultrafine fraction that can travel deeper into the lungs than PM4, greatly exceeded the safe PM4 threshold [34]. However, OSHA [35] has set a personal exposure limit (PEL) of 5 mg·m−3 (TWA) for the respirable fraction (PM4) and 15 mg·m−3 (TWA) for total dust (not measured in this study) for 8 h exposure, but it has not specified PELs for other PM fractions. However, High concentrations of the finer PM fractions were likely due to the low ventilation rates that reduced the aerosolization of the larger PM fractions [8]. The pigs were likely exposed to higher PM concentrations since measurements were made in the alley and not in the pens.
Temporal changes in CLO and DIS PM2.5 and PM10 concentrations on 5 February are shown in Figure 8. The PM concentration at any point in time is the average of the two measurements made at that location. The sharp spikes in PM concentrations at both locations were due to increased pig activity, which increased PM suspension.
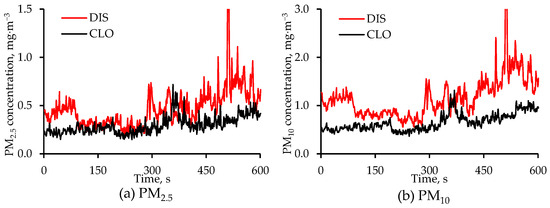
Figure 8.
Diurnal changes in concentrations of (a) PM2.5 and (b) PM10 on 5 February 2024 at the CLO and DIS locations in the alley. The measurement frequency was 1 Hz, and each value is the average of two values, one from each set of measurements at that location. The Y-axis in the two figures above have different scales. Both Y-axis scales are truncated to improve resolution.
3.3. Bioaerosol Removal
Total heterotrophic bacteria and fungi concentrations at the IN and OUT locations and the RE of the air cleaner for each microorganism are shown in Table 1, as is the time of sampling (AM or PM) and the floor washing status. Only one of five pairs of samples was collected during the afternoon over a washed floor, and floor washing might not have affected heterotrophic bacteria concentrations but might have eliminated the aerosolization of fungi (Table 1).

Table 1.
Total airborne heterotrophic bacteria and fungi concentrations measured at the IN and OUT locations in February 2024 and the removal efficiency (RE) of the air cleaner for each microorganism. Comments describe the time of sampling and the floor status.
In three out of five sampling events, OUT bacteria concentrations were inexplicably higher than the IN concentrations, resulting in negative RE values (Table 1). It was also unclear why the RE varied so greatly among the sampling events. For example, with similar bacteria IN concentrations, RE was highest on 15 February and lowest on 13 February (PM) (Table 1). On 19 February, despite the highest bacteria concentration at the inlet, RE was moderately high, while it was negative with the lowest IN bacteria concentrations on 16 February (Table 1).
The air cleaner eliminated fungi in all events when fungi were present in the inlet samples (Table 1). It is unclear if floor washing suppressed fungi aerosolization on 13 February. Total fungal concentrations were much lower than bacteria concentrations (Table 1), as was also reported by Donham [34]. It was unclear if the TiO2 coating contributed to fungi elimination since it reduces bioaerosol concentrations [22]. Whereas bacterial cells are generally more susceptible to UVC irradiance than fungal cells [36], it is unclear why, in this study, the air cleaner was highly effective against fungi but not against bacteria. Schulz et al. [25] also reported high variability in RE between events and between microorganisms.
In a pig nursery during winter, Eisenlöffel et al. [19] reported that their recirculating air cleaner using UVC (DQ = 176 J·m−3) and polyester pocket filter removed > 98% total airborne bacteria and PM15; we calculated the DQ based on reported airflow rate and UVC output equal to 30% of total lamp power [15]. Much lower or no bacteria removal during most events in this study with the air cleaner that had a DQ of 150 J·m−3 might have been due to higher PM concentrations and lower PM15 removal in this study. However, lower PM15 removal does not explain 100% fungi removal in this study; in their study, Eisenlöffel et al. [19] did not measure fungi concentrations. An ESP supplemented with a UVC lamp with a DQ < 20 J·m−3 with similar PM10 removal as this study had an average RE of >50% for bacteria in an egg layer house during winter [18]. A recirculating air cleaner with a wet scrubber and UVC (DQ = 74 J·m−3) had RE values of 66 to 69% for fungi, and 63 to 78% for aerobic bacteria in a finishing barn with its wet scrubber turned off [25].
3.4. Ammonia Removal
Over five events spanning 10 d, the air cleaner reduced NH3 concentrations by an average of 56% (Figure 9). Air cleaner inlet NH3 concentration averaged a low 2.4 mg·m−3 (3.5 ppm at 25 °C), which could be attributed to floor washing that reduced manure accumulation and concomitant release of NH3 in the room. Pig nurseries have low NH3 concentrations (e.g., [19,37]) similar to the values reported here.
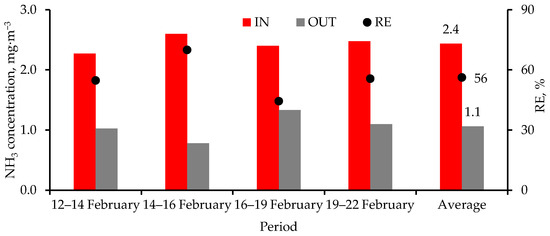
Figure 9.
Time-averaged NH3 concentrations at the air cleaner inlet (IN) and outlet (OUT), and removal efficiency (RE, Equation (3)). The scrubbers were turned on for 30 min and off for 30 min.
Despite a low Et of 0.43 s, NH3 reduction by the air cleaner was much higher than those reported by others using UVC emitting 254 nm (e.g., [19,38]). The NH3 reduction was mostly due to the trapping of NH3-laden PM [39] by the Stuffnix® filter. A sample of PM obtained from the air cleaner at the end of the study had 1.49 and 8.8 g·kg−1 (wet basis) of NH3-N and total Kjeldahl N, respectively, underscoring the importance of filtering PM to reduce airborne NH3. Ultraviolet C lamps emitting both 185 and 254 nm are more effective at breaking down NH3 but require Et in the order of minutes. However, 185 + 254 nm lamps also produce N2O and O3 [38]. As has been reported earlier, O3 was not detected at the pig level. As will be discussed below, it was unlikely that the air cleaner produced N2O from NH3.
3.5. Greenhouse Gas Removal
Concentrations of three GHGs (N2O, CH4, and CO2) at the inlet and outlet of the air cleaner on 5 d, as well as the RE values, are presented in Table 2. Variability in the concentrations of GHGs on a diurnal basis could be due to ventilation and management. Considerable variability in the day-to-day RE, as well as the low average RE values, indicated that air cleaner likely did not destroy these GHGs.

Table 2.
Concentrations of three GHs measured at the IN and OUT locations in February 2024 and the removal efficiency (RE) of the air cleaner for the GHG.
While UVC irradiance of NH3 can lead to N2O formation [38], similar average IN and OUT concentrations of N2O indicated that NH3 degradation resulting in N2O formation due to UVC irradiation was likely very small. At an Et of 4.8 s, CH4 reductions were substantial (63.6%) but not significant, while reductions were even lower at higher DE [40]. Similar average IN and OUT concentrations in this study (Table 2) showed that an Et of 0.43 s was likely inadequate in degrading CH4. While CO2 is formed when organic gases decompose [40], similar average IN and OUT concentrations (Table 2) indicated that CO2 was likely not formed due to the short Et.
3.6. Removal of Volatile Organic Compounds
Volatile organic compounds in the Flexfoil® bag samples obtained from the IN and OUT locations on 20 February 2024 are shown in Table S1. Based on a NIST library match quality of ≥50%, more VOCs were detected in the IN sample (8 vs. 4), but the cumulative area of the gases in the OUT sample was higher. Commonly occurring odorous VOCs, e.g., acetic acid, butanoic acid, ethylbenzene, skatole, and 2-butanone (e.g., [28,29]) were not detected (Table S1). Surprisingly, the VOC with the highest concentration was benzaldehyde, 2-nitro-, diaminomethylidenhydrazone at the outlet; this compound has not been reported in manure gases. Ethylene oxide, a manure gas, had the second highest concentration among all compounds, but only in the outlet sample. The presence of 1H-Indole, 5-methyl-2-phenyl-, an odorous manure gas only in the IN sample [41], might indicate that UVC irradiance broke down some VOCs, creating other VOCs. Based on the 20 February analyses, it was unclear if the air cleaner was effective in reducing VOC concentrations.
Ten and 24 VOCs were identified in the IN and OUT samples, respectively, on 22 February 2024 using SPME fibers (Table S2). The total area of the VOCs in the IN and OUT samples were 3.86 × 10⁸ and 1.45 × 10⁸ units, respectively, showing that the SPME fibers increased the number of gases detected as well as their concentrations vs. the gas samples. Ten compounds with the highest total (IN + OUT) concentrations are compared in Figure 10. High concentrations of some odorous volatile fatty acids (VFAs) present in swine houses [29], namely, butanoic, propanoic, and pentanoic acids in the IN sample, were greatly reduced or absent in the OUT sample (Figure 10). However, only the OUT sample had a high concentration of sec-butylamine, an odorous compound. Surprisingly, the benzaldehyde derivative was the only common compound in the OUT samples collected on 20 and 22 February 2024 (Tables S1 and S2).
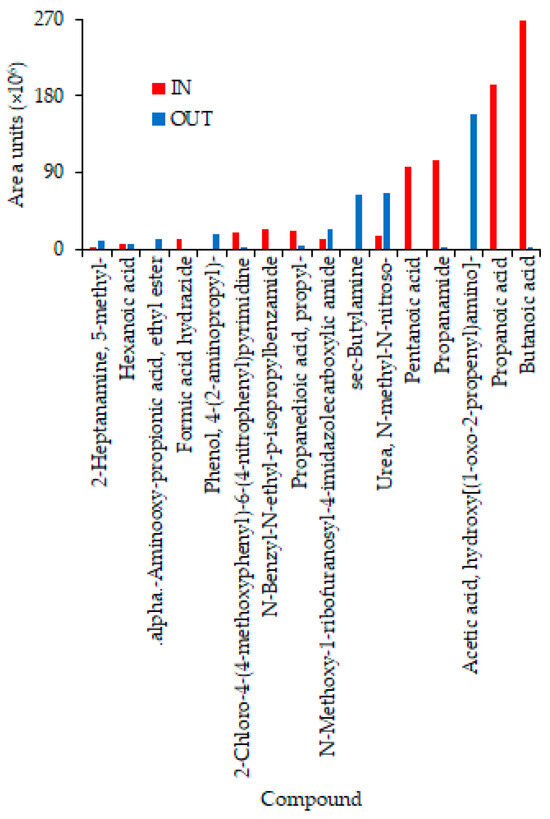
Figure 10.
Comparison of 10 VOCs collected on SPME fibers on 22 February 2024 in the IN and OUT samples.
With replicate samples and Et of 4.8 s, UVC (254 nm) did not significantly reduce concentrations of propanoic, pentanoic, and butanoic acids [40]. While the data in Figure 10 were based on a single pair of samples, the elimination of some odorous VFAs, even with an Et of 0.43 s, warrants further investigation. In the future, the experimental design should allow for the separation of the impact of TiO2 on the air cleaner’s performance for both VOCs and bioaerosols. For greater certainty, standards should be used to develop calibration curves instead of relying on the NIST library.
3.7. Future Considerations
An ACH range of 6 to 12 was recommended for animal labs [42], though higher ACH values may be required for livestock barns. Computational fluid dynamics (CFD) modeling could be used to improve the air cleaner design, specifically, simulating the impact of UVC lamp wattage, shape, orientation (e.g., [43]), and ACH. Such a design could optimize for both performance and cost. Since high PM concentrations reduce the germicidal effectiveness of UVC lamps, other PM filtration methods, e.g., the polyester pocket filters that had PM15 RE > 98% [19], could be considered. However, filters that are more efficient will clog faster, requiring more frequent maintenance than the Stuffnix® filter. Future testing should also include an evaluation of pig health and performance.
4. Conclusions
In this study, a recirculating air cleaner, which used a dust filter and UVC lamps, was evaluated for its ability to reduce thermal stratification and improve air quality in a pig nursery during the winter. Important findings are summarized below.
- During the first 9 d when brooders were used, the air cleaner increased floor temperature in its vicinity by 1.9 °C vs. a distant location;
- The air cleaner was modestly effective in trapping PM with average RE values of 29% (20 to 52%) for PM2.5 and 27% (9 to 59%) for PM10. Inlet PM concentrations varied widely between days and were as high as 0.85 and 2.23 mg·m−3 for the PM2.5 and PM10 fractions, respectively;
- The air cleaner moderately reduced PM concentrations in the alley in its vicinity compared to a distant location, with average RE values of 38% (18 to 59%) for PM2.5 and 39% (6 to 67%) for PM10. There was considerable diurnal variability at both locations, with concentrations of PM2.5 and PM10 at the distant location as high as 1.75 and 5.33 mg·m−3, respectively;
- The air cleaner was moderately effective in trapping NH3, with an average RE of 56% at an average inlet concentration of 2.4 mg·m−3;
- The air cleaner was inconsistent in inactivating heterotrophic bacteria, with RE values ranging from −233% to 98%. However, in four of five events, when inlet fungi concentrations were measurable, the air cleaner eliminated fungi;
- The air cleaner was ineffective in reducing concentrations of N2O, CH4, and CO2;
- Compared to the inlet, concentrations of odorous VFAs, namely, pentanoic, propanoic, and butanoic acids, were greatly reduced or eliminated at the outlet. However, an odorous compound, sec-butylamine, was detected at the outlet.
Whereas the recirculating air cleaner demonstrated the potential to reduce thermal stratification and improve air quality, there is a need for design improvement and additional testing. Doubling the ACH can improve coverage, and using CFD modeling can improve its design.
Supplementary Materials
The following supporting information can be downloaded at https://www.mdpi.com/article/10.3390/agriengineering6040210/s1, Code S1: Code S1. R code for quantifying the areas of those compounds that have a certain threshold match quality; Table S1: Gaseous compounds (with match qualities ≥ 50%) in Flexfoil® bags at the inlet and outlet of the air cleaner and their concentrations in area units on 20 February 2024; Table S2: Gaseous compounds (with match qualities ≥ 50%) on SPME fiber at the inlet and outlet of the air cleaner and their concentrations in area units on 22 February 2024.
Author Contributions
Conceptualization, S.B.S.; fabrication and lab testing, J.O.E., M.L.I., J.P. and S.B.S.; field testing, J.O.E., M.L.I., J.P., H.R.M. and S.B.S.; data analysis and curation, J.O.E., M.L.I., H.R.M. and S.B.S.; writing—original draft preparation, S.B.S.; writing—review and editing, S.B.S., J.O.E., M.L.I., P.K. and L.W.-L.; supervision, S.B.S. and P.K.; project administration, S.B.S.; funding acquisition, S.B.S. and L.W.-L. All authors have read and agreed to the published version of the manuscript.
Funding
This research received was funded by NC State University’s Faculty Research and Professional Development Award and the 2024 Robert W. Bottcher Researcher Award to S.B.S. NC State University’s Department of Chemical and Biomolecular Engineering provided financial support to M.L.I.
Data Availability Statement
Raw data are available upon request from the corresponding author, S.B.S.
Acknowledgments
Funding was provided by NC State University’s (NCSU) Faculty Research and Professional Development Award to S.B.S. NCSU Department of Biological and Agricultural Engineering (BAE) provided endowment funding to S.B.S. in the form of the 2024 Robert W. Bottcher Research Award. Funding support provided by NCSU Department of Chemical and Biomolecular Engineering to M.L.I. is gratefully acknowledged. Access to the swine nursery and support provided by Allison West, Julianna Ferreira, and James Lucas at NC State University’s College of Veterinary Medicine made it possible for the research to be conducted. Leonard Collins at NC State University’s Molecular Education, Technology and Research Innovation Center provided invaluable support in analyzing the GC-MS data. PureTi, through its Brian Haas, coated the air cleaner’s interior with titania free of cost. Big Dutchman’s marketing manager, Beate Ulrich, provided the Stuffnix® free of cost. The air cleaner was mostly fabricated at BAE’s Research Shop.
Conflicts of Interest
The authors declare no conflicts of interest.
References
- Pedersen, S.; Nonnenmann, M.; Rautiainen, R.; Demmers, T.G.M.; Banhazi, T.; Lyngbye, M. Dust in Pig Buildings. J. Agric. Saf. Health 2000, 6, 261–274. [Google Scholar] [CrossRef] [PubMed]
- Wang, K.; Shen, D.; Dai, P.; Li, C. Particulate Matter in Poultry House on Poultry Respiratory Disease: A Systematic Review. Poult. Sci. 2023, 102, 102556. [Google Scholar] [CrossRef] [PubMed]
- Morakinyo, O.M.; Mokgobu, M.I.; Mukhola, M.S.; Hunter, R.P. Health Outcomes of Exposure to Biological and Chemical Components of Inhalable and Respirable Particulate Matter. Int. J. Environ. Res. Public Health 2016, 13, 592. [Google Scholar] [CrossRef] [PubMed]
- USDA. Swine 2021, “Part I: Reference of Management Practices on Large-Enterprise Swine Operations in the United States, 2021”. 2024. Available online: https://www.aphis.usda.gov/swine-2021-part-i-reference-management-practices-large-enterprise-swine-operations-united-states (accessed on 5 June 2024).
- USDA. Swine 2012, Part I: Baseline Reference of Swine Health and Management in the United States, 2012. 2015. Available online: https://www.aphis.usda.gov/sites/default/files/swine2012-dr-parti.pdf (accessed on 2 October 2024).
- Chang, C. Exposure Assessment to Airborne Endotoxin, Dust, Ammonia, Hydrogen Sulfide and Carbon Dioxide in Open Style Swine Houses. Ann. Occup. Hyg. 2001, 45, 457–465. [Google Scholar] [CrossRef] [PubMed]
- Shen, D.; Wu, S.; Li, Z.; Tang, Q.; Dai, P.; Li, Y.; Li, C. Distribution and Physicochemical Properties of Particulate Matter in Swine Confinement Barns. Environ. Pollut. 2019, 250, 746–753. [Google Scholar] [CrossRef]
- Yang, X.; Haleem, N.; Osabutey, A.; Cen, Z.; Albert, K.L.; Autenrieth, D. Particulate Matter in Swine Barns: A Comprehensive Review. Atmosphere 2022, 13, 490. [Google Scholar] [CrossRef]
- Colls, J. Air Pollution, 2nd ed.; Clay’s Library of Health and the Environment; CRC Press: New York, NY, USA, 2002. [Google Scholar]
- Cui, H.; Zhang, C.; Liu, J.; Dong, S.; Zhao, K.; Chen, L.; Chen, Z.; Sun, Y.; Guo, Z. The Distribution Characteristics of Aerosol Bacteria in Different Types of Pig Houses. Animals 2022, 12, 1540. [Google Scholar] [CrossRef]
- Alonso, C.; Goede, D.P.; Morrison, R.B.; Davies, P.R.; Rovira, A.; Marthaler, D.G.; Torremorell, M. Evidence of Infectivity of Airborne Porcine Epidemic Diarrhea Virus and Detection of Airborne Viral RNA at Long Distances from Infected Herds. Vet. Res. 2014, 45, 73. [Google Scholar] [CrossRef] [PubMed]
- Lau, A.K.; Vizcarra, A.T.; Lo, K.V.; Luymes, J. Recirculation of Filtered Air in Pig Barns. Can. Agric. Eng. 1996, 38, 297–304. [Google Scholar]
- Robertson, J. Air Quality, Subclinical Disease and Animal Production Losses. Vet. Rec. 2012, 171, 121–122. [Google Scholar] [CrossRef]
- ASHRAE. Ultraviolet Lamp Systems. In ASHRAE Handbook—HVAC Systems and Equipment; ASHRAE: Atlanta, GA, USA, 2016. [Google Scholar]
- Kowalski, W. Ultraviolet Germicidal Irradiation Handbook: UVGI for Air and Surface Disinfection; Springer: Berlin/Heidelberg, Germany, 2009. [Google Scholar] [CrossRef]
- Wang, C.; Lu, S.; Zhang, Z. Inactivation of Airborne Bacteria Using Different UV Sources: Performance Modeling, Energy Utilization, and Endotoxin Degradation. Sci. Total Environ. 2019, 655, 787–795. [Google Scholar] [CrossRef] [PubMed]
- Buhr, T.L.; Borgers-Klonkowski, E.; Gutting, B.W.; Hammer, E.E.; Hamilton, S.M.; Huhman, B.M.; Jackson, S.L.; Kennihan, N.L.; Lilly, S.D.; Little, J.D.; et al. Ultraviolet Dosage and Decontamination Efficacy Were Widely Variable across 14 UV Devices after Testing a Dried Enveloped Ribonucleic Acid Virus Surrogate for SARS-CoV-2. Front. Bioeng. Biotechnol. 2022, 10, 875817. [Google Scholar] [CrossRef] [PubMed]
- Villa, Y. Design, Modeling, and Monitoring of a Recirculating Electrostatic Precipitator to Improve Indoor Air Quality in a Cage-Free Egg Layer House; NC State University: Raleigh, NC, USA, 2023. [Google Scholar]
- Eisenlöffel, L.; Reutter, T.; Horn, M.; Schlegel, S.; Truyen, U.; Speck, S. Impact of UVC-Sustained Recirculating Air Filtration on Airborne Bacteria and Dust in a Pig Facility. PLoS ONE 2019, 14, e0225047. [Google Scholar] [CrossRef] [PubMed]
- Mostafa, E.; Buescher, W. Indoor Air Quality Improvement from Particle Matters for Laying Hen Poultry Houses. 2011, 109, 22–36. Biosyst. Eng. 2011, 109, 22–36. [Google Scholar] [CrossRef]
- Lee, M.; Koziel, J.A.; Macedo, N.R.; Li, P.; Chen, B.; Jenks, W.S.; Zimmerman, J.; Paris, R.V. Mitigation of Particulate Matter and Airborne Pathogens in Swine Barn Emissions with Filtration and UV-A Photocatalysis. Catalysts 2021, 11, 1302. [Google Scholar] [CrossRef]
- Bogdan, J.; Zarzyńska, J.; Pławińska-Czarnak, J. Comparison of Infectious Agents Susceptibility to Photocatalytic Effects of Nanosized Titanium and Zinc Oxides: A Practical Approach. Nanoscale Res. Lett. 2015, 10, 309. [Google Scholar] [CrossRef]
- Shah, S.B.; Earnest, K.; Oviedo-Rondón, E.O.; Kolar, P.; Singletary, I. Simultaneous Reduction of Thermal Stratification and Ammonia Concentrations in Poultry House during Brooding and in Cool Weather. Appl. Eng. Agric. 2022, 38, 375–386. [Google Scholar] [CrossRef]
- Winkel, A.; Mosquera, J.; Aarnink, A.J.A.; Groot Koerkamp, P.W.G.; Ogink, N.W.M. Evaluation of a Dry Filter and an Electrostatic Precipitator for Exhaust Air Cleaning at Commercial Non-Cage Laying Hen Houses. Biosyst. Eng. 2015, 129, 212–225. [Google Scholar] [CrossRef]
- Schulz, J.; Bao, E.; Clauss, M.; Hartung, J. The Potential of a New Air Cleaner to Reduce Airborne Microorganisms in Pig House Air: Preliminary Results. Berl Munch Tierarztl Wochenschr 2013, 126, 143–148. [Google Scholar]
- Liu, K.; Wen, Z.; Li, N.; Yang, W.; Wang, J.; Hu, L.; Dong, X.; Lu, J.; Li, J. Impact of Relative Humidity and Collection Media on Mycobacteriophage D29 Aerosol. Appl. Environ. Microbiol. 2012, 78, 1466–1472. [Google Scholar] [CrossRef]
- Trabue, S.; Scoggin, K.; Li, H.; Burns, R.; Xin, H.; Hatfield, J. Speciation of Volatile Organic Compounds from Poultry Production. Atmos. Environ. 2010, 44, 3538–3546. [Google Scholar] [CrossRef]
- Osaka, N.; Miyazaki, A.; Tanaka, N. Emissions of Volatile Organic Compounds from a Swine Shed. Asian J. Atmos. Environ. 2018, 12, 178–191. [Google Scholar] [CrossRef]
- Martel, M.C.; Lemay, S.P.; Predicala, B.Z.; Girard, M.; Belzile, M.; Feddes, J.; Hogue, R.; Godbout, S. Detailed Study of Odor from Pig Buildings to Improve Understanding of Biotrickling Filter Performance. Trans. ASABE 2017, 60, 2151–2162. [Google Scholar] [CrossRef]
- OSHA. OZONE. 2024. Available online: https://www.osha.gov/chemicaldata/9 (accessed on 19 June 2024).
- Donham, K.; Aherin, R.; Baker, D.; Hetzel, G. Safety in Swine Production Systems. 2006. Available online: https://porkgateway.org/resource/safety-in-swine-production-systems/ (accessed on 19 June 2024).
- Czarick, M.; Lacy, M.; Reducing Temperature Stratification in Houses with Forced Air Furnaces. Poultry Housing Tips 2000. Available online: https://www.poultryventilation.com/wp-content/uploads/vol12n4.pdf (accessed on 26 July 2024).
- Cooper, C.; Alley, F. Air Pollution Control: A Design Approach, 4th ed.; Waveland Press: Long Grove, IL, USA, 2010. [Google Scholar]
- PARTICULATES NOT OTHERWISE REGULATED, TOTAL AND RESPIRABLE DUST (PNOR)|Occupational Safety and Health Administration. Available online: https://www.osha.gov/chemicaldata/801 (accessed on 26 September 2024).
- Donham, K.J. Association of Environmental Air Contaminants with Disease and Productivity in Swine. Am. J. Vet. Res. 1991, 52, 1723–1730. [Google Scholar] [CrossRef] [PubMed]
- Dai, T.; Vrahas, M.S.; Murray, C.K.; Hamblin, M.R. Ultraviolet C Irradiation: An Alternative Antimicrobial Approach to Localized Infections? Expert Rev. Anti-Infect. Ther. 2012, 10, 185–195. [Google Scholar] [CrossRef]
- Feng, K.; Wang, Y.; Hu, R.; Xiang, R. Continuous Measurement of Ammonia at an Intensive Pig Farm in Wuhan, China. Atmosphere 2022, 13, 442. [Google Scholar] [CrossRef]
- Rockafellow, E.M.; Koziel, J.A.; Jenks, W.S. Laboratory-Scale Investigation of UV Treatment of Ammonia for Livestock and Poultry Barn Exhaust Applications. J. Environ. Qual. 2012, 41, 281–288. [Google Scholar] [CrossRef]
- Takai, H.; Nekomoto, K.; Dahl, P.J.; Okamoto, E.; Morita, S.; Hoshiba, S. Ammonia Contents and Desorption from Dusts Collected in Livestock Buildings. Agric. Eng. Int. CIGR J. Sci. Res. Dev. 2002, IV. Available online: https://cigrjournal.org/index.php/Ejounral/article/view/316/310 (accessed on 29 September 2024).
- Lee, M.; Koziel, J.A.; Murphy, W.; Jenks, W.S.; Chen, B.; Li, P.; Banik, C. Evaluation of TiO2 Based Photocatalytic Treatment of Odor and Gaseous Emissions from Swine Manure with UV-A and UV-C. Animals 2021, 11, 1289. [Google Scholar] [CrossRef]
- Kariuki, M.W.; Hassanali, A.; Ng’ang’a, M.M. Characterisation of Cattle Anal Odour Constituents Associated with the Repellency of Rhipicephalus Appendiculatus. Exp. Appl. Acarol. 2018, 76, 221–227. [Google Scholar] [CrossRef]
- Kowalski, W.J.; Bahnfleth, W.P.; Carey, D.D. Engineering Control of Airborne Disease Transmission in Animal Research Laboratories. Contemp. Top. Lab. Anim. Sci. 2002, 41, 9–17. [Google Scholar] [PubMed]
- Capetillo, A.; Noakes, C.J.; Sleigh, P.A. Computational Fluid Dynamics Analysis to Assess Performance Variability of In-Duct UV-C Systems. Sci. Technol. Built Environ. 2015, 21, 45–53. [Google Scholar] [CrossRef]
Disclaimer/Publisher’s Note: The statements, opinions and data contained in all publications are solely those of the individual author(s) and contributor(s) and not of MDPI and/or the editor(s). MDPI and/or the editor(s) disclaim responsibility for any injury to people or property resulting from any ideas, methods, instructions or products referred to in the content. |
© 2024 by the authors. Licensee MDPI, Basel, Switzerland. This article is an open access article distributed under the terms and conditions of the Creative Commons Attribution (CC BY) license (https://creativecommons.org/licenses/by/4.0/).