Article

Spatial–Temporal Dynamics of Land Use and Cover in Mata da Pimenteira State Park Based on MapBiomas Brasil Data: Perspectives and Social Impacts

by
Júlio Cesar Gomes da Cruz
1,
Alexandre Maniçoba da Rosa Ferraz Jardim
2,*,
Anderson Santos da Silva
3,
Marcos Vinícius da Silva
4,
Jhon Lennon Bezerra da Silva
5,
Rodrigo Ferraz Jardim Marques
6,
Elisiane Alba
1,
Antônio Henrique Cardoso do Nascimento
1,
Araci Farias Silva
1,
Elania Freire da Silva
7 and
Alan Cézar Bezerra
1
1
Academic Unit of Serra Talhada, Federal Rural University of Pernambuco, Serra Talhada 56909-535, Pernambuco, Brazil
2
Department of Biodiversity, Institute of Biosciences, São Paulo State University—UNESP, Rio Claro 13506-900, São Paulo, Brazil
3
Department of Agronomy, Federal University of Agreste of Pernambuco, Garanhuns 55292-278, Pernambuco, Brazil
4
Department of Forest Sciences, Federal University of Campina Grande, Campina Grande 58708-110, Paraíba, Brazil
5
Cerrado Irrigation Graduate Program, Goiano Federal Institute—Campus Ceres, GO-154, km 218—Zona Rural, Ceres 76300-000, Goiás, Brazil
6
State Environmental Agency (CPRH), Serra Talhada 56900-000, Pernambuco, Brazil
7
Department of Agricultural and Forestry Sciences, Federal Rural University of the Semi-Arid, Mossoró 59625-900, Rio Grande do Norte, Brazil
*
Author to whom correspondence should be addressed.
AgriEngineering 2024, 6(3), 3327-3344; https://doi.org/10.3390/agriengineering6030190
Submission received: 9 July 2024 / Revised: 23 August 2024 / Accepted: 6 September 2024 / Published: 13 September 2024

Abstract

:
Caatinga is a typical Brazilian biome facing severe threats despite its ecological and socio-economic importance. Conservation strategies are essential in protecting ecosystems and ensuring natural resource sustainability. Mata da Pimenteira State Park (PEMP), launched in 2012, is an example of such a strategy. The current study aims to use orbital remote sensing techniques to assess human impacts on changes in land use and land cover (LULC) after the establishment of PEMP in the semi-arid region known as Caatinga, in Pernambuco State. The effects of this unit on vegetation preservation were specifically analyzed based on using data from the MapBiomas Brasil project to assess trends in LULC, both in and around PEMP, from 2002 to 2020. Man–Kendall and Pettitt statistical tests were applied to identify significant changes, such as converting forest areas into pastures and agricultural plantations. Trends of the loss and gain of LULC were observed over the years, such as forest areas’ conversion into pasture and vice versa, mainly before and after PEMP implementation. These findings highlight the importance of developing conservation measures and planning to help protecting the Caatinga, which is a vital biome in Brazil.

1. Introduction

Several local, regional and global studies have identified land degradation as one of the most severe global environmental issues in recent decades. This degradation in arid, semi-arid and dry sub-humid regions is called desertification and it results from different factors, mainly from climatic variations and human activities [1,2,3,4,5,6].
Based on orbital remote sensing–monitoring data available in Brazil, natural forests (e.g., forest and savannah formation, as well as floodplain and mangrove forest, and Atlantic Forest areas) covered approximately 58% of the national territory in 2022. Between 1985 and 2022, these natural forests diminished by 87.6 million hectares (Mha), representing a reduction of roughly 15% over the past three decades [7]. Among all Brazilian biomes, Caatinga has experienced significantly negative changes and impacts, such as natural Forest area reduction by approximately 11% over 38 years [8], which harmed local biodiversity and increased environmental degradation. These changes have intensified desertification processes over time due to this biome’s peculiar ability to adapt to specific climatic conditions [9,10]. Rainfall is the primary variable driving and controlling patterns of changes in this ecosystem, which is the one most susceptible to climate variations [11,12,13,14].
The Caatinga biome is formed by a mosaic of thorny shrubs and seasonally dry forests, and it has unique and highly dynamic features, such as its ability to adapt to specific weather conditions. However, despite its ecological importance, the Caatinga is one of the least protected regions in the country [11,12]. Therefore, it is essential to launch conservation units in this biome to guarantee the preservation of its biodiversity and its ecosystem functions.
Conservation units (CUs) are often susceptible to several pressure and threat types that put their goals at risk. Among them, one finds urban sprawl, disorderly occupation, inappropriate land use, vegetation cover loss and fragmentation, as well as the incidence of both man-made and natural fire events [15].
If one takes into consideration the challenges faced by protected areas (PAs), it is essential to adopt advanced technologies to monitor human activities and their environmental impacts [16]. According to the aforementioned study, geoprocessing and remote sensing have emerged as valuable tools to help in monitoring PAs inserted in this context. These technologies enable the gathering of accurate and up-to-date information on land cover, vegetation dynamics, and the incidence of fire events, among other human activities capable of compromising the environmental integrity of these protected areas.
Using geotechnologies to analyze land use and land cover (LULC) enables identifying and distinguishing different spatial uses and tracking changes, overtime. This approach provides information to help in the planning, managing and monitoring of protected areas. Data provided by the MapBiomas Project stand out among the several free-access tools and resources available to carry out studies into the conservation state of Brazilian biomes. This initiative was created in 2015 by SEEG/OC (System of Greenhouse Gases Estimates of the Observatory of Climate) for collaborative and open monitoring purposes. It aims at filling the gap in information available on land cover and use, initially in Brazil and currently in other countries. This project involves several institutions, such as universities, non-governmental organizations and technology companies. It aims at producing annual maps associated with land cover and land use in the country over the past three decades [8].
Its mapping tactics include using the most advanced sets of digital cloud processing, technology and big data techniques available (such as the Landsat satellite time series) in the Google Earth Engine (GEE) library [17]. More specifically, this project uses empirical and statistical techniques, such as Random Forest, to analyze the recent history of pixels and to produce LULC maps [18,19,20,21,22].
In light of the foregoing, the aim of the current study was to assess the effects of the establishment of Mata da Pimenteira State Park (PEMP), which is a Conservation Unit (CU) located in the Caatinga biome, Pernambuco State, Brazil, on the preservation of its vegetation cover. In addition, statistical analyses were carried out to assess trends towards changes in land use and cover, both within and around the investigated park. This was done based on geospatial data covering the time interval from 2002 to 2020, which were provided by the MapBiomas Brasil project.

2. Materials and Methods

2.1. Study Site

The study site comprises Mata da Pimenteira State Park (PEMP), which is located in Saco Farm, in the rural area of Serra Talhada, Pernambuco State (Figure 1). This park was the first Caatinga conservation unit launched in the state. Its total area covers 887.24 ha, and it presents gently rolling terrain and typical hyperxerophilous Caatinga vegetation. The climate in this region is semi-arid, hot and dry (BSh type); its annual rainfall rate reaches 657 mm and its mean annual temperature reaches 25.8 °C [23,24,25]. PEMP is located between parallel 7°56′10″ S and meridian 38°17′55″ W, and its mean local altitude is 613 m a.s.l.
The local government established Mata da Pimenteira State Park (PEMP) in 2012 and turned it into the first protected area (PA) within this biome in Pernambuco State [26]. The herein-conducted analysis focused on two different territorial areas, namely, PEMP, which represents the integral preservation area of this unit (indicated by the red polygon in Figure 1), and the buffer zone (BZ), which is the area between the BZ boundary and the PEMP area (it spans from the blue polygon to the red polygon in Figure 1). This difference helped us to better understanding the unique land use and land cover (LULC) dynamics within these two isolated areas.
The primary goals of creating PEMP lie in maintaining the area’s integrity, as well as in preserving its soil cover and biodiversity. A buffer zone (BZ) was established as a transition space between the preserved and human-occupied areas. This zone’s specific land-use rules and restrictions aim at minimizing negative impacts on the preserved area. However, interactions between natural and artificial conditions still happen in this zone, and it requires constant monitoring and proper management processes [27]. The BZ in PEMP is outlined by physical elements that are both identifiable and known to the local community, such as roads, watercourses (like Boi Morto stream), water divides (like Serra Talhada’s peaks), and the urban area boundary, as provided on the municipal Master Plan [28].
In addition to the BZ, other zones and sectors have also been established in PEMP’s zoning process, in compliance with its management plan. State law n. 13,787, from 8 June 2009, established the State System of Conservation Units (SEUC) and defined the concept of zoning as the delimitation of areas or zones within a given conservation unit, based on specific regulations set for management purposes, in order make the harmonious and effective achievement of all the units’ goals easier. Therefore, zoning involves creating areas and sectors that share physical similarities and purposes to implement specific regulations focused on the occupation and use of both the CU and its natural resources.
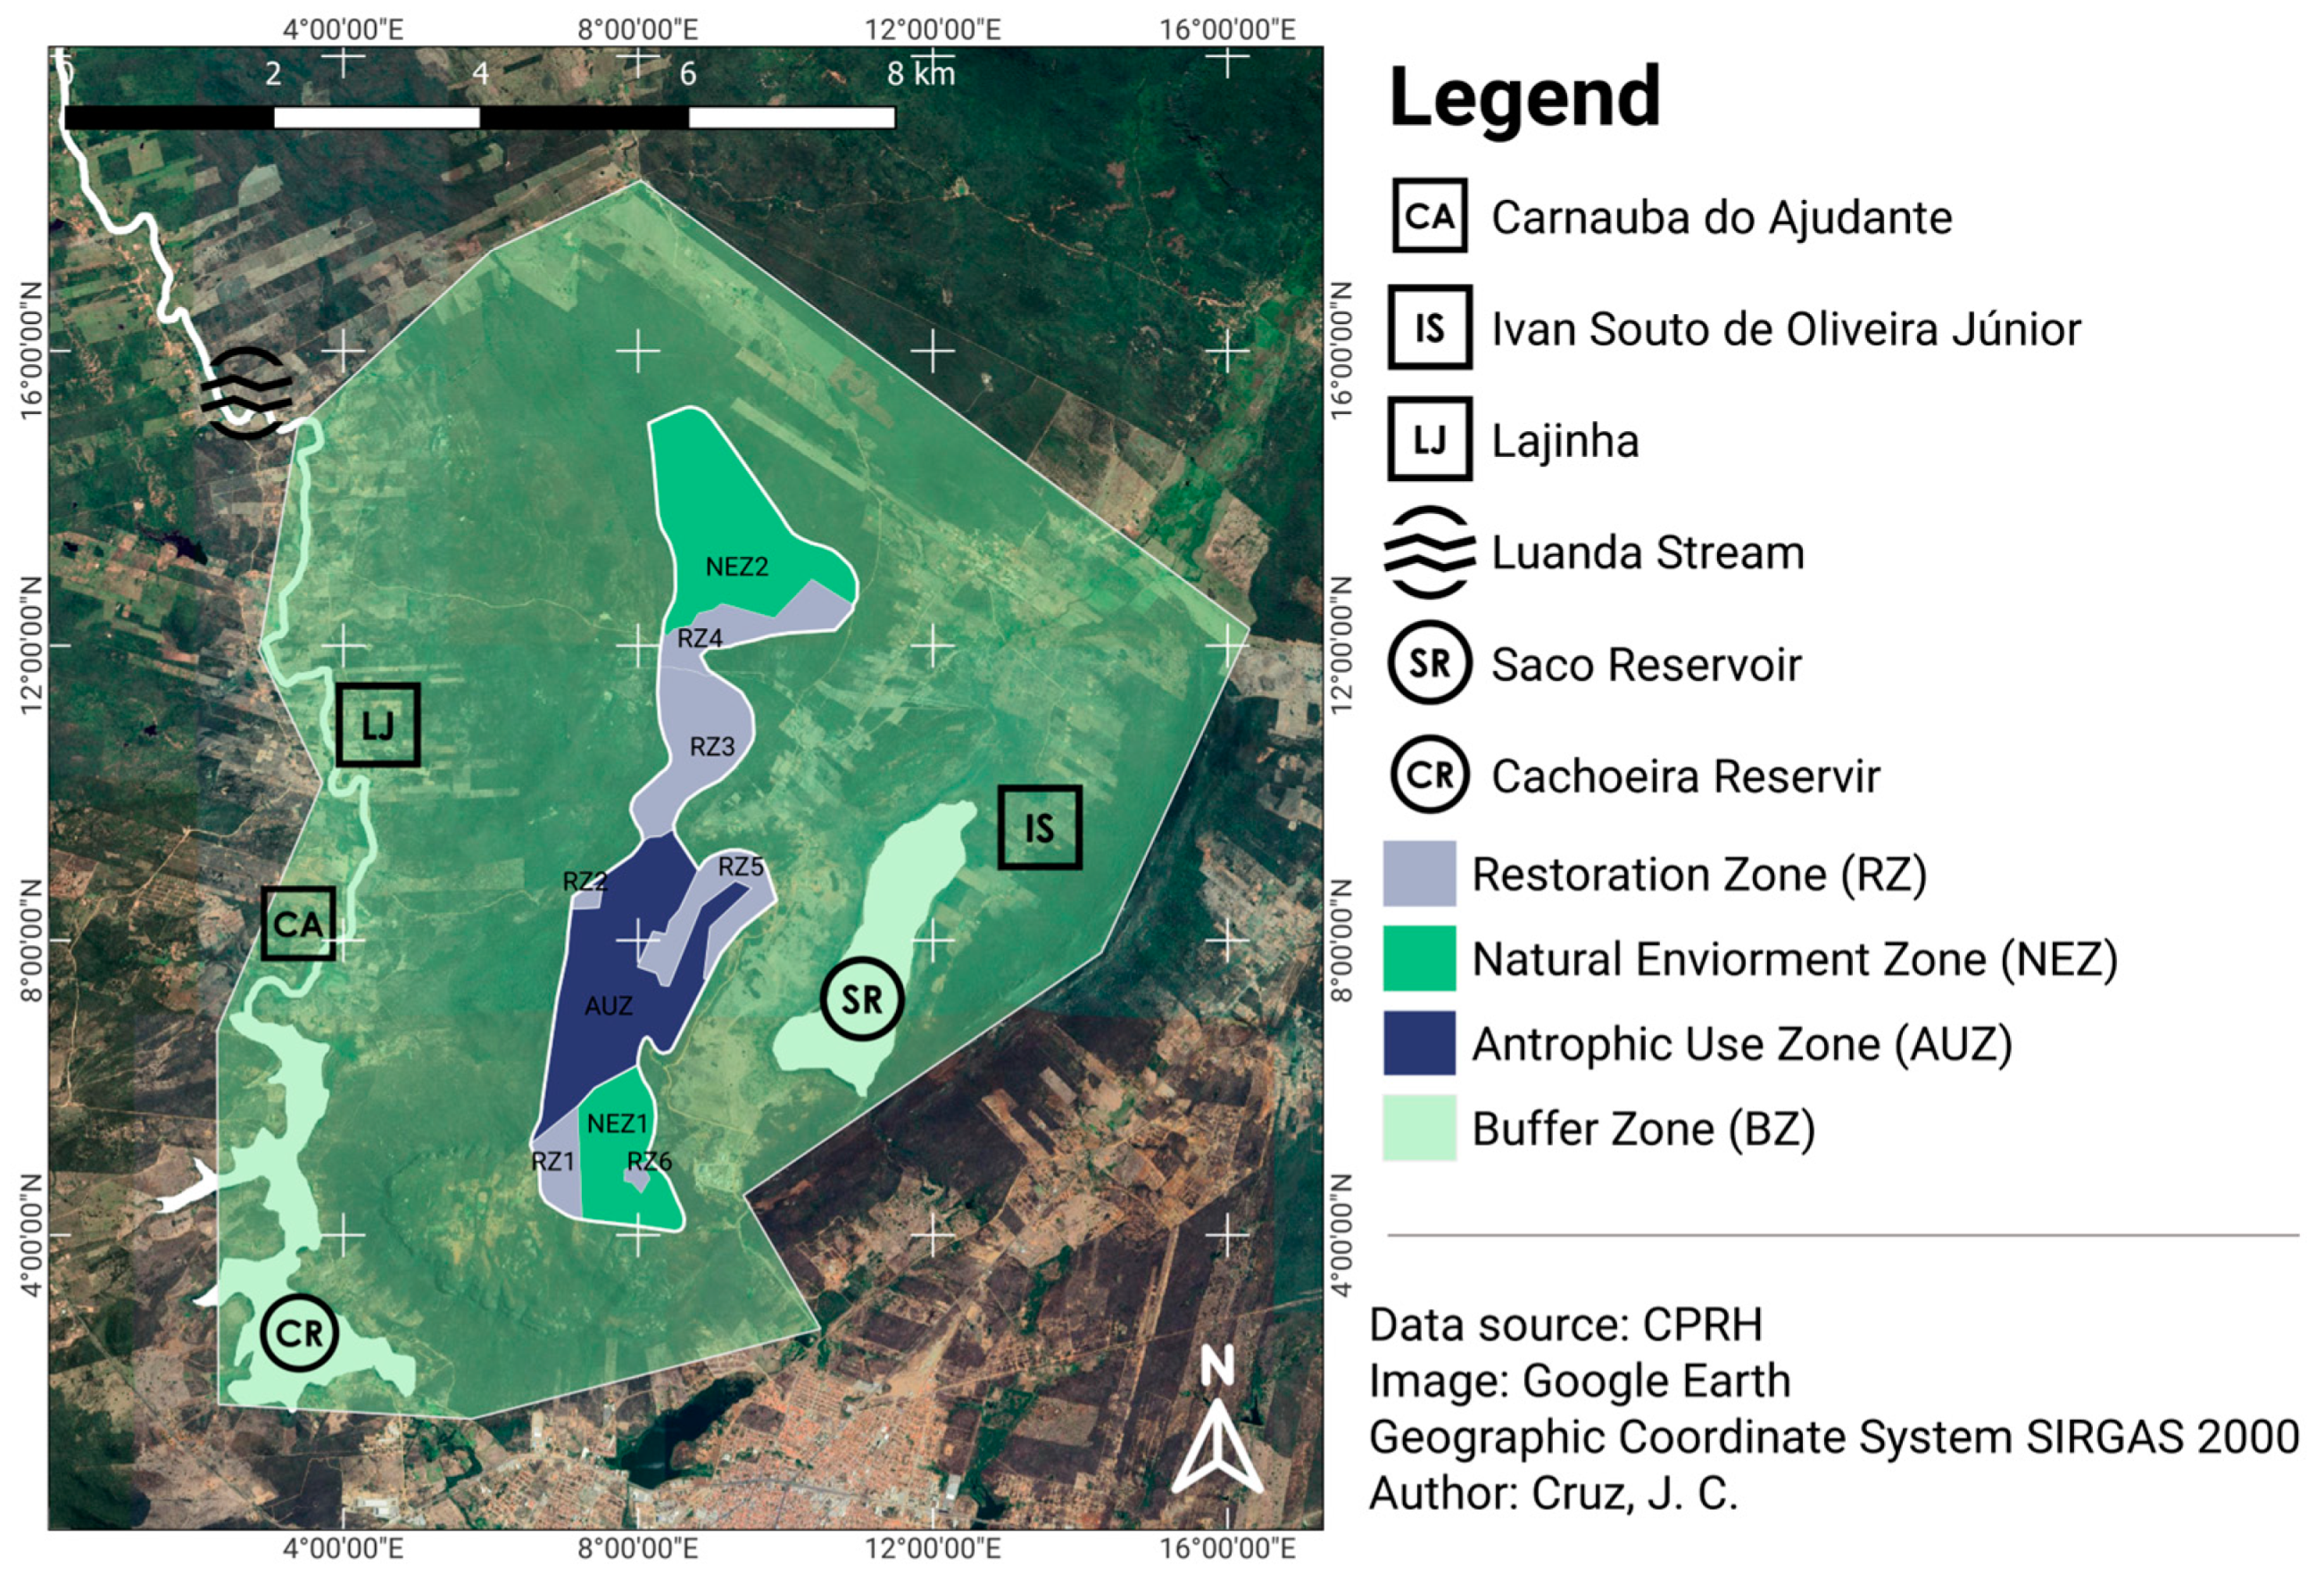
According to the aforementioned law and to PEMP’s management plan, its working territory is split into zones and sectors. Zones are territorial delimitations showing uniformity in terms of physical features and use purposes. They portray the ideal goals set for that area, in compliance with the general goals of the conservation unit. Sectors, on the other hand, are territorial delimitations that are not in compliance with the goals set for the conservation unit at a given time. Thus, it is necessary to develop specific strategies and goals to allow for adjusting and aligning them with these goals. Figure 2 shows the delimitation of the main zones within PEMP.
The PEMP Management Plan delineates four zones with different purposes:
  • Buffer zone (BZ)—This is an area surrounding a conservation unit where human activities are regulated by specific rules and restrictions to minimize negative impacts on the unit. Its purpose is to reduce external influences on the conservation area;
  • Natural environment zone (NEZ)—This zone aims at fully protecting PEMP’s ecosystem, genetic resources and natural features while enabling scientific research activities. Human interference is minimized in it, and only the indirect use of its attributes is allowed. It is a refuge for rare, endemic, weak or endangered species;
  • Anthropic use zone (AUZ)—These zones are designed for both conservation and human use purposes. They allow for people’s visitation and interaction with the natural environment. They accommodate buildings and the infrastructure necessary to manage the conservation unit and to implement activities outlined in the management plan;
  • Restoration zone (RZ)—Publicly owned areas within PEMP that have undergone vegetation or soil changes require natural or induced recovery processes. The goal is to restore degraded ecosystems as closely as possible to their original condition. Once such a sector is restored, it is merged into another zone/sector.
Effective zoning in PAs is essential to help achieving management and preservation goals. Zoning harmonizes human activities with ecosystem protection by designating areas based on their natural features and use goals. This approach enables implementing scientific research and rigorous preservation processes in some areas, whereas others provide opportunities for public use and infrastructure development.

2.2. Database

The herein analyzed data refer to MapBiomas Collection 7, which was launched in August 2022. This collection is based on images derived from the Landsat 5, 7 and 8 satellite series; it maps the land use and land cover (LULC) dynamics in Brazil between 1985 and 2021. Data available in this collection comprise detailed information on vegetation cover and land use countrywide, as well as thematic maps and annual data covering 27 vegetation cover classes, at a spatial resolution of 30 m. Collection 7 features significant progress over previous versions, since it incorporates new image and data processing techniques, such as using images derived from Landsat Collection 2 (Level 1) based on a fully revised and updated sample base for accuracy assessment analysis purposes [8].
The MapBiomas initiative provides a series of Toolkits in the form of pre-defined scripts within the Google Earth Engine (GEE) platform in order to make it easier to get spatial data. These scripts comprise a library with multiple functions for mathematical analysis and computational modeling (of several statistical analyses), which work as fast export repositories, as well as machine learning operations based on specific algorithms adopted for the digital processing of satellite images based on using computational languages, such as Python and JavaScript. They can load all the spectral information and specific parameters to generate data for each corresponding year, and they can also be easily accessed; executed scripts display an interface to select the attributes of interest.
The study by Souza et al. [19] details the methodology used by MapBiomas to integrate remote sensing data from Landsat 5–8 satellites, using the TM, ETM+ and OLI sensors. To ensure the comparability of the data over the years, pre-processing and normalization steps were implemented, converting the digital numbers (DN) to reflectance at the top of the atmosphere (TOA) and orthorectifying the images to correct geometric distortions. Cloud-free annual mosaics were created by applying an algorithm to remove clouds and their shadows. A feature space was generated from the processed annual scenes, incorporating spectral bands and temporal indices. The random forest classifier was used to classify LULC, followed by spatial and temporal filters to eliminate noise. This approach made it possible to harmonize data from different sensors, ensuring a consistent analysis of changes in land use and cover in Brazilian biomes.
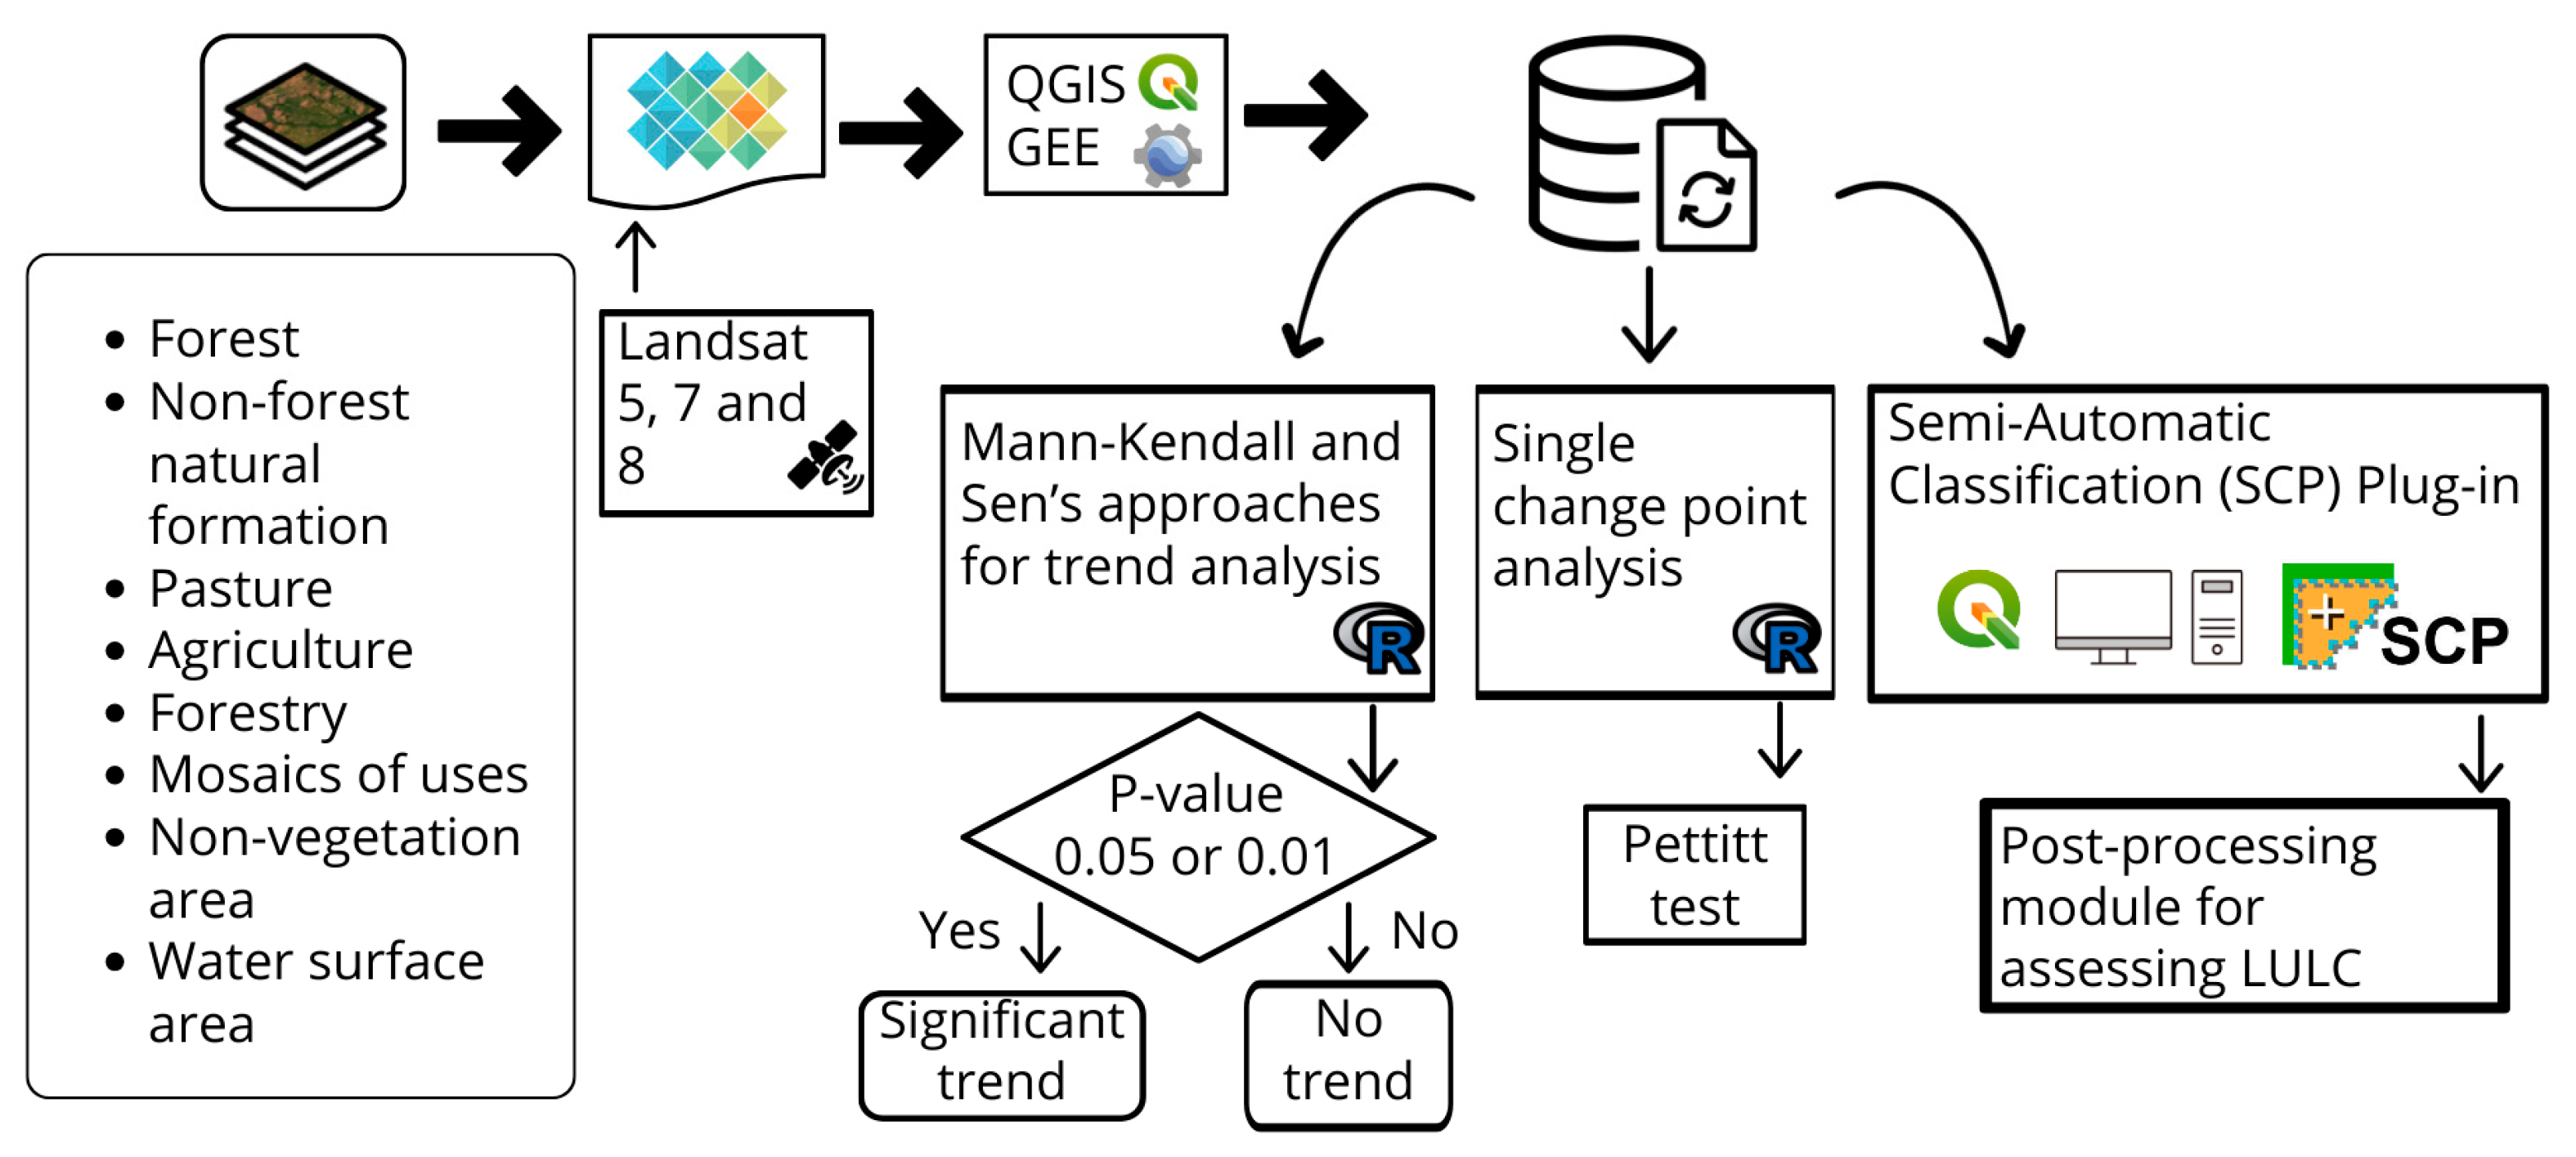
Adopting these Toolkits enabled collecting data of the time series covering the time interval from 2002 to 2020, for two territorial sections, namely, PEMP and BZ areas. Then, QGIS software, version 3.30, was used to process and refine these data to prepare them for statistical analysis. Figure 3 shows a methodological flowchart containing a summary of the steps described in this paper.

2.3. Land Use/Land Cover (LULC) Database

The current study derived annual images referring to 2002, 2008, 2014, and 2020 from clipped and reclassified land cover and used raster mosaics to cover the PEMP and BZ sections. This process resulted in eight images in total. Two thematic maps were plotted based on using these images: one of them encompassed PEMP’s perimeter for the specified years, whereas the other one included the buffer zone. The areas set for each vegetation class were calculated based on using the same images in QGIS software, version 3.30, as well as the Landscape Ecology add-on, according to the material reclassified from the collection of seven databases provided by MapBiomas. This process enabled calculating the difference in vegetation coverage for each class over the investigated years.
The QGIS software and the Semi-Automatic Classification (SCP) plugin developed and maintained by [29] were used for data analysis purposes to help identify changes in LULC classes throughout the historical series (Figure 3). The SCP plugin, which works as supervised image classification software, stands out for offering a complete set of features that range from downloading images to statistical analyses of generated maps [29].
The SCP’s post-processing module for assessing LULC change allows one to compare two classified images and extract LULC gains and losses and the changes that have occurred. To do this, the images classified in different periods were inserted into the SCP, which generates LULC statistics by converting the classified images into NumPy arrays and performing pixel-by-pixel differentiation [30].
The decision was made to analyze the association between the initial (2002) and final (2020) years of the historical series to determine the classes identified at the initial year that were converted into forest formations at the final year, as well as the areas converted into pasture or agricultural crops. MapBiomas Collection 7 comprises maps and data covering 37 years, from 1985 to 2021, and it provided information on 27 different land-cover classes and land use in the Brazilian territory [8].
The raster files for the first (2002) and last (2020) analyzed years were added to the post-processing tab for processing purposes. In addition to this analysis, two other temporal compositions were also used for comparison purposes; one referred to the comparison between 2002 and 2011, before PEMP’s implementation, and the other referred to the comparison between 2011 and 2020, after its implementation. Only the pixels that had changed were identified. According to Gonçalves and Ribeiro [31], this processing results in a new raster, which holds the pixels that changed class in the last year, compared to the first year. The plugin can also generate a “.csv” tabular text file to indicate all class changes, which are essential to helping interpret quantitative changes over time.

2.4. Trend Analysis

2.4.1. Mann–Kendall Test

The Mann–Kendall non-parametric temporal trend test [32,33,34,35,36] was used to analyze land use and land cover trends based on values attributed to class areas. This test is widely used in studies focused on investigating changes in land use and land cover to detect whether a given area shows a significant trend of changes over time. It is used to monitor landscape dynamics, to identify significantly changed areas and to assess human activity’s impacts on land use. However, it is important to emphasize that the Mann–Kendall test is a statistical tool that requires consistent and reliable data time series. In addition, it is necessary to consider other factors capable of influencing changes in land use, such as climate factors and public policies.
The autocorrelation function test was carried out to check whether the variables in each time series were independent from each other. The Mann–Kendall test was not applied to dependent variables [36]. The modified Mann–Kendall test, proposed by Hamed and Rao [37], was applied to variables presenting autocorrelation. This test was based on the null hypothesis (H0) of a lack of a trend with randomly distributed variables and on the alternative hypothesis (H1) of the presence of a trend, while a 5% significance level was adopted in this study. It is worth emphasizing that the analysis applied to long-term data series may require the adoption of a non-parametric approach, since data distribution may not fit a specific theoretical model. The Mann–Kendall test statistic (S) can be described through Equation (1) [34,35].
S = i = 1 n 1 j = i + 1 n sgn x j x i
where S is the total count of (xjxi); xj is the initial value after xi, and n is the number of data points in the time series. Each data pair will be assigned the following values, according to Equation (2):
sgn x j x i = + 1 if x j x i > 0 0 if x j x i = 0 1 if x j x i < 0
When the number of observations (n) is large, the probability distribution S converges to normal distribution with zero mean and variance defined through Equation (3):
Var ( S ) = n n 1 2 n + 5 p = 1 q t p ( t p 1 ) ( 2 t p + 5 ) 18
where tp is the number of data with equal values in a given group; q is the number of groups comprising equal values in the data series within a group p. The Mann–Kendall test statistics are determined from the value observed for the ZMK variable, which is calculated through the following Equation (4):
Z MK = S 0 Var ( S ) , if S   >   0 0 , if S = 0 S + 0 Var ( S ) , if S   <   0
A two-sided test was conducted at the 5% significance level (α); the null hypothesis of no trend was rejected if p-value was lower than the α threshold. Trend analysis was performed based on using the “dgof” and “modifiedmk” packages within the R environment. More specifically, the “modifiedmk” package enables users to define parameters, such as the period and significance level to be set for the test, among others. This package has proven useful, and it is widely applied in time series studies conducted in fields like geosciences and environmental science [38].
Kendall’s τ coefficient was used to check whether the investigated trend was increasing (τ > 0) or decreasing (τ < 0). Furthermore, the Theil–Sen slope β was calculated based on using the Theil–Sen non-parametric test [39,40] to calculate the magnitude of the trend [41].

2.4.2. Pettitt Test

This test can identify changes in the distribution of a sequence of observations over time; it is mainly useful in studies focused on monitoring land use and occupation [42]. This statistical test can detect abrupt changes in time series. According to Hajani and Rahman [43], the direction of the abrupt change detected by this test is established by comparing the subseries before and after the change. Land use and land cover monitoring can be applied to detect significant modifications in the dynamics of changes in LULC in each area.
It is possible to assess whether these changes are associated with specific events, such as changes in environmental legislation, technological advancements, economic changes, or other factors, that may have influenced the dynamics of changes in land use and cover by detecting abrupt changes in these dynamics. Accordingly, more accurate and well-informed decisions can be made to help land use management and planning processes, as well as to contribute to more sustainable and efficient land management.
According to Dos Santos Clemente et al. [44], the Pettitt test uses two samples (A1, At and At+1, AT), which belong to the same population. The Ut,T statistic counts the number of times a given member of the first sample is larger than a given member of the second sample, based on Equation (5).
U t , T = U t 1 , T + j = 1 T sgn A j A i ,   for   t = 2 ,   T
where sgn(AjAi) is assigned according to the following conditions: 1 for (AjAi) > 0; 0 for (AjAi) = 0; and −1 for (AjAi) < 0.
The Ut,T statistic is calculated for values 1 ≤ t < T, and the k(t) statistics of the Pettitt test are given by Equation (6):
k ( t ) = Max 1 t < T U t , T
The Pettitt test identifies the point where a sudden change in the mean value of a time series of LULC maps took place in the time series given for the PEMP area and its BZ, and its significance is given by the following Equation (7):
p     2 exp 6 k ( t ) 2 T 3 + T 2
The moment when the abrupt change takes place is identified by the t-value, which maximizes the k(t) statistic. Critical values observed for variable K (Kcrit) are defined by Equation (8):
K crit = ± ln p 2 T 3 + T 2 6
The Pettitt test was conducted based on using the trend package available in the R software. This package offers functionalities developed to analyze environmental and hydrological data trends, as well as to model and forecast time series. All analyses described above were performed in R software, version 4.2.3 [45].

3. Results and Discussion

3.1. Spatial Variability in Land Use and Land Cover (LULC)

The analyzed region’s landscape presented a mosaic of different land use and land cover (LULC) classes in the current study. Figure 4 shows the thematic maps comprising the majority classes based on the methodology established by MapBiomas [8], providing insight into the ecological and human dynamics featuring the study site.
Class 1 (Forest) presents the most extensive territorial coverage among the assessed LULC categories, followed by classes 3 (pasture), 8 (water surface area) and 6 (mosaic of uses). Formations corresponding to class 4 (agriculture) are sporadically observed within the study site. Notably, sizable areas identified as water surface largely stem from the Saco reservoir in the eastern section of BZ and from the Luanda stream in the southeastern part of it. According to Bilar et al. [46], PEMP’s buffer zone encompasses three settlements: Lajinha and Ivan Souto de Oliveira Júnior, established by the National Institute for Colonization and Agrarian Reform (Incra), and Carnaúba do Ajudante, established by the Land and Agrarian Reform Institute of Pernambuco State (Iterpe).
Based on Figure 4, the forest is the most extensive class, although land portions categorized as pasture, agriculture, and mosaic of uses are also present. These areas existed before the establishment of the PEMP, and they persisted after its formalization as a conservation unit (CU) in 2012. According to PEMP’s management plan, these sections were selected within restoration sectors for future restoration efforts.
These areas were expected to decrease following the official establishment of the CU, yet they have persisted. A comparison of PEMP and BZ (Figure 4) indicates that activities mainly influence the persistence of human-altered areas within the surrounding regions’ protected area (PA).
Overall, there was little variation in LULC types, except for surface water, particularly on the east side. A reduction in water levels was observed in both the eastern and western reservoirs of the study area, mainly between 2014 and 2020, during the region’s most severe drought on record, which began in 2012 and ended partially in 2018 [47]. After the drought, the surface water area increased due to a run of rainy years, especially after the 2018 period [48].
The areas adjacent to these water surfaces mostly comprise pasture, reflecting the significant role livestock farming plays in the investigated region. A substantial part of this category lies between Saco reservoir and the PEMP’s area. Pasture areas’ closeness to the water surface raises concerns, mainly near Saco dam, since the Organic Law of Serra Talhada Municipality, Pernambuco provides for the establishment of specially protected zones around these areas.
Art. 175. Municipal Parks, Pajeú River banks, as well as the Serrinha, Cachoeira II, Saco, and Jazigo dams and their surroundings and the Cachoeira and Borborema reservoirs, are Special Environmental Protection Areas. Their banks, in the segments belonging to this municipality, are specially protected spaces that cannot have construction works done in them or be exploited at the distance of at least thirty meters away from their banks, respecting the existing buildings [49].
Data from the MapBiomas Brasil Project [8] indicate that class 3 (pasture), which is primarily composed of cultivated pastures, also encompasses natural areas mostly classified as grassland formations subjected to grazing practices. On the other hand, class 6 (mosaic of uses) varies in composition depending on the biome; it refers to agricultural use in the Caatinga context. However, there may be alternatives other than distinguishing between pasture and agriculture.
Oliveira [50] highlighted the environmental degradation issue observed in the Dry Hinterlands of Ceará State, attributing it to extensive livestock farming. This activity exerts pressure on natural resources by consuming native vegetation and causing soil compaction due to animal trampling. Thus, it often exceeds the ecosystem’s carrying capacity.
Research conducted in Ceará and Pernambuco states supports the idea of high environmental degradation risk in semi-arid regions. Pinheiro et al. [51] analyzed how deforestation for pasture implementation in the Caatinga contributes to environmental degradation. Silva et al. [52] presented thematic maps depicting the semi-arid region’s vulnerability due to reductions in forested areas and expansions in agricultural zones.

3.2. Spatial Variability of Cover Changes

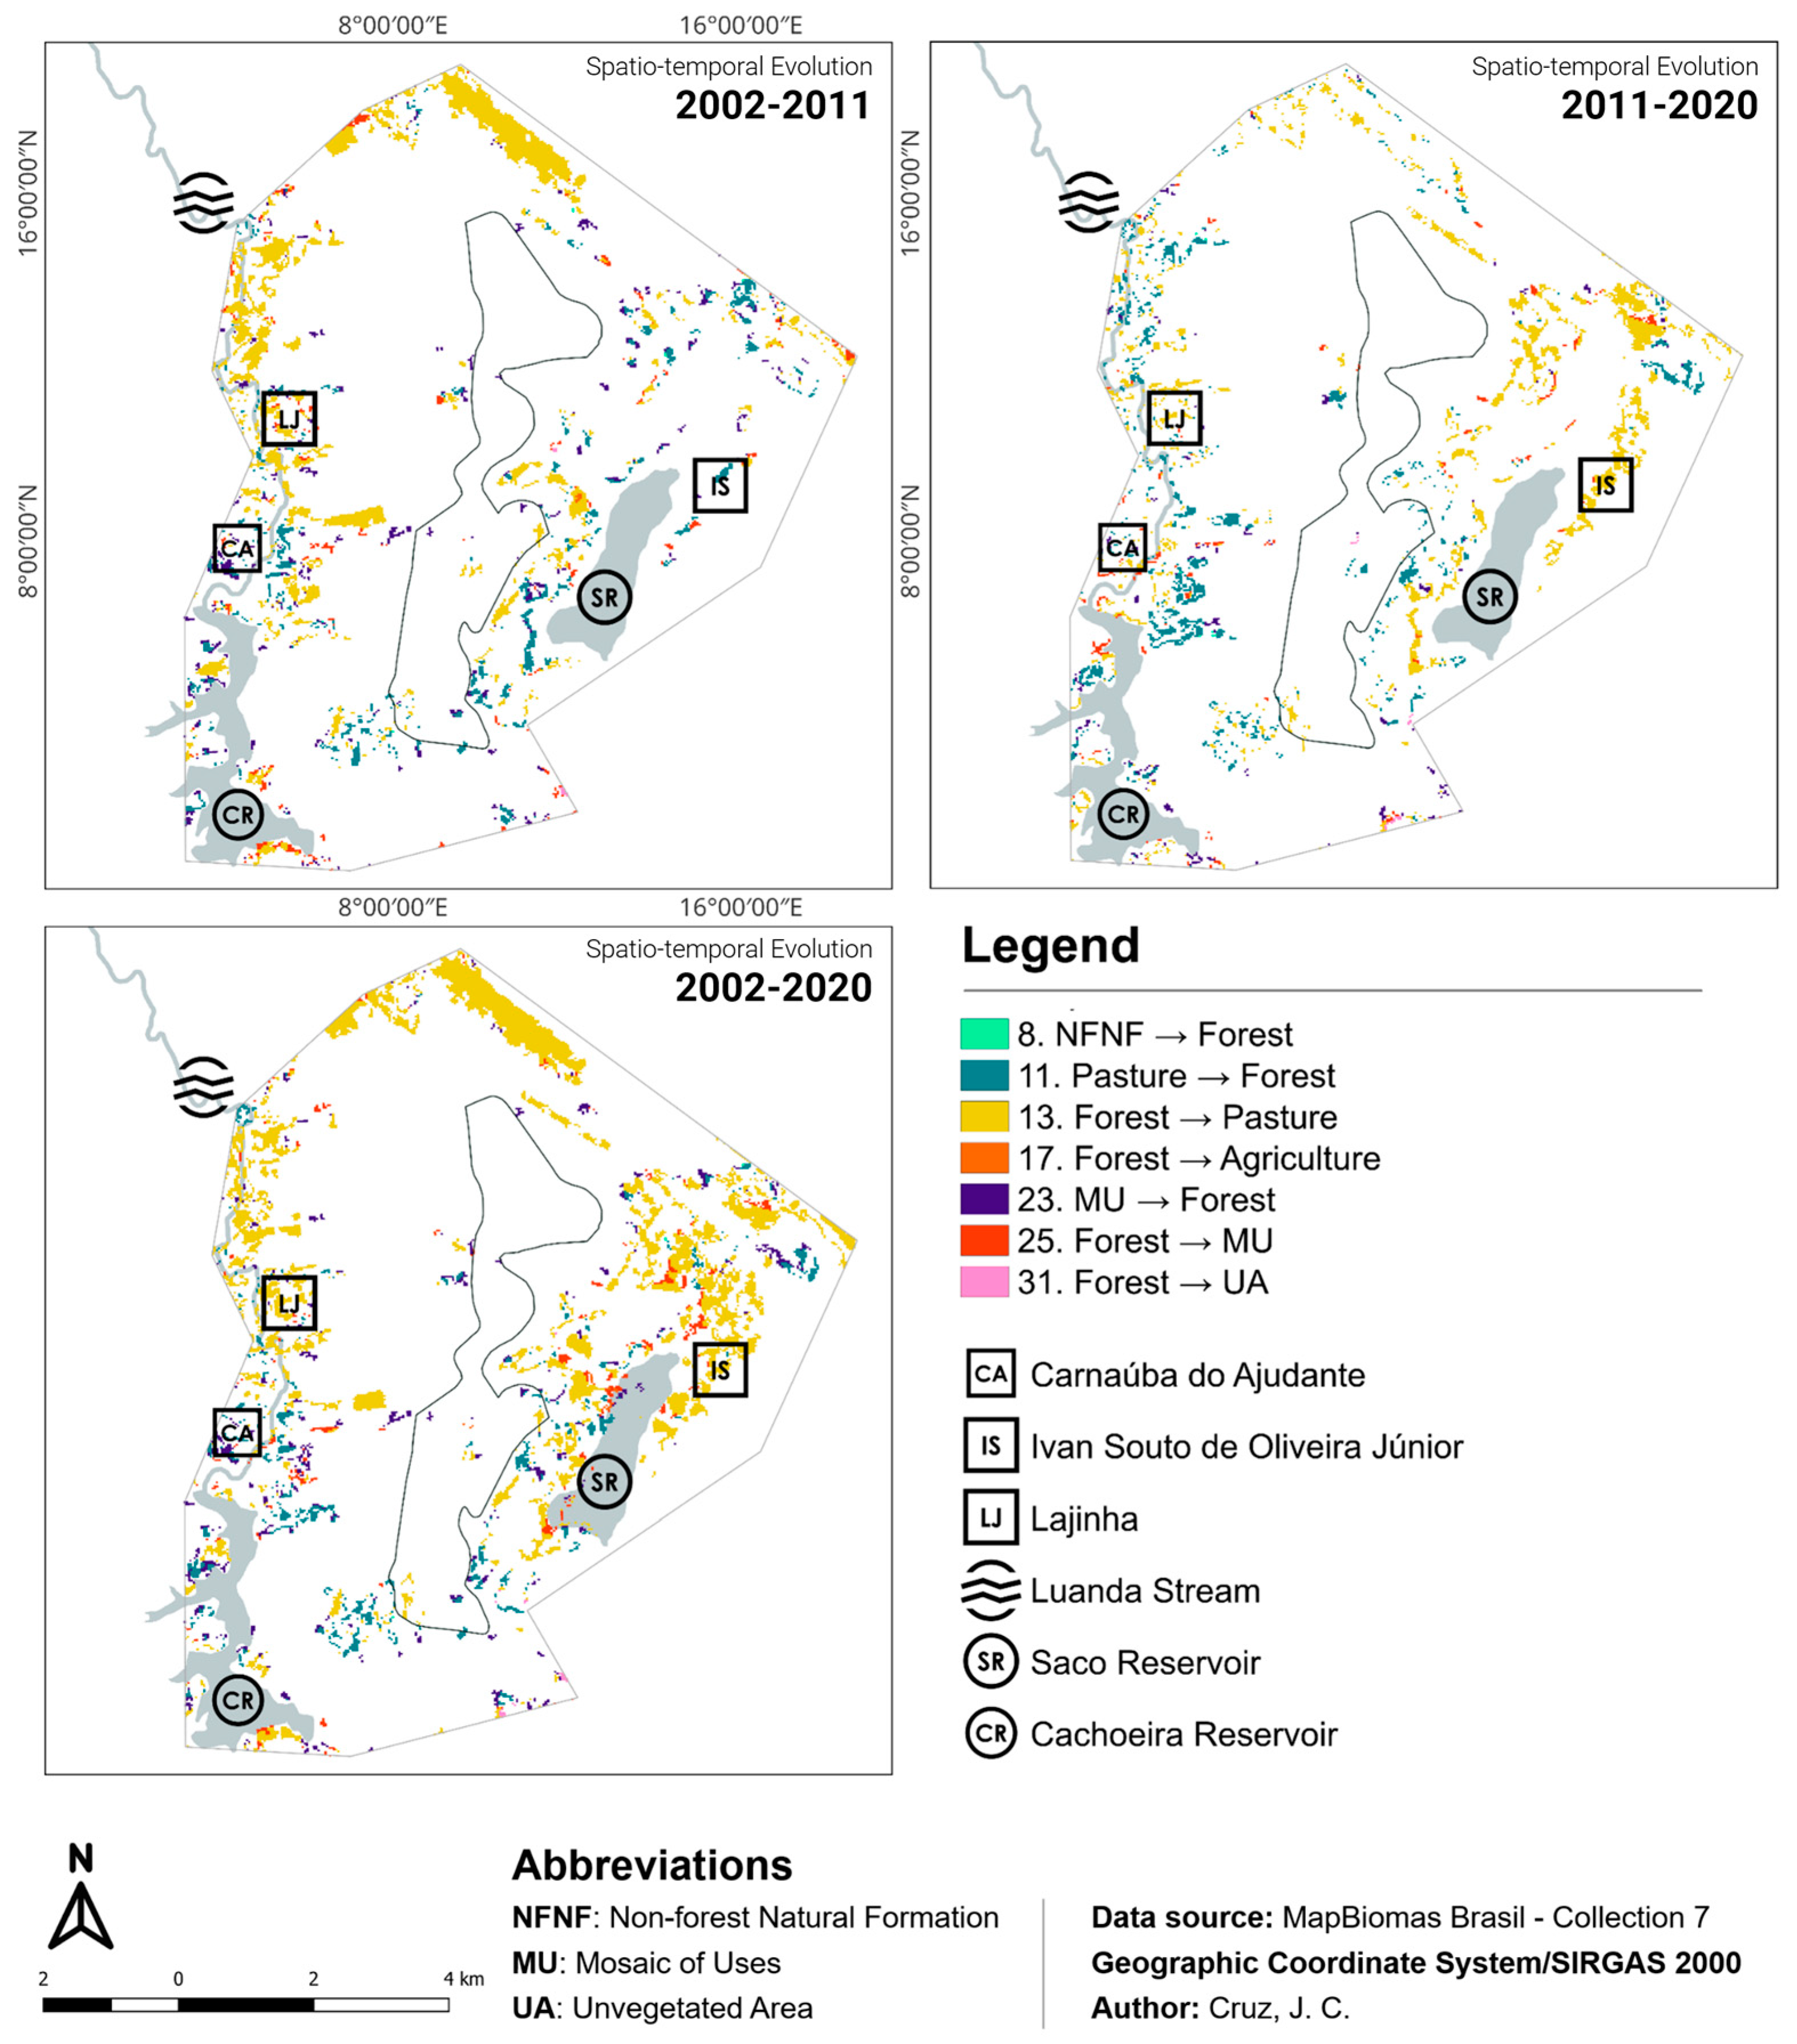
Figure 5 illustrates the class conversions across the time series (2002–2020) and in two sub-time series. The first one considers the years prior to PEMP implementation (2002–2011), and the second one focuses on the period following its implementation (2011–2020).
The analysis revealed that forest conversion into pasture was the most significant change observed in the buffer zone (BZ), and it indicated human presence expansion in this area. This expansion is mainly noticeable in the northern, northwestern, and eastern buffer zone regions, mostly around Lajinha settlement in the first two regions and in Saco reservoir and Ivan Souto de Oliveira settlement in the third region. Table 1 provides a comprehensive view of this progress in each class.
Approximately 601.83 ha of forest areas within BZ were converted into pasture, and 49.59 ha were converted into a mosaic of uses over the assessed years. As previously mentioned, the most significant advance in this process was observed between 2002 and 2011, before PEMP implementation. On the other hand, pasture areas’ conversion into forest was more pronounced between 2011 and 2020, although it was less extensive than the reverse. It is worth emphasizing that PEMP was established in 2012 and that its management plan was published in 2013.
The comparison between the two time series 2002–2011 and 2011–2020 has indicated that forest conversion into pasture was more evident in the first period (2002–2011), mainly around the Lajinha settlement. This conversion was less evident in the second period, with greater emphasis on Ivan Souto de Oliveira settlement. Settlement projects near protected areas (PAs) are a recent phenomenon in the northeastern semi-arid region, according to Bilar et al. [46], and they pose challenges to the process focused on harmonizing Caatinga conservation and sustainable local development.
Francelino et al. [53] observed that farmers tend towards more extractive activities to help fund their livelihoods due to a lack of productive investments in several regions, mainly during prolonged drought periods. The lack of regulation and suitable technology worsens environmental degradation and leads to significant environmental deficits. According to Beduschi Filho and Abramovay [54], integrating settled families into environmental conservation processes can be effective, mainly when conservation units are close to settlements. Moreover, the sustainable use of forest resources in the semi-arid region can enhance setters’ food security [55].
Areas RZ1 and RZ5 (Figure 2) within the park deserve special attention, as they concentrated the main changes to pasture during the evaluation period (Figure 5). It should be noted that the restoration zones were created to recover the degraded ecosystem to a condition as close as possible to the original. Therefore, the government must review the situation of these areas to ensure that the management plan is complied with.

3.3. Time Trend Analysis

Investigating temporal trends using statistical approaches over the 19-year period (from 2002 to 2020) helped us better understand the evolution of environmental conditions in PEMP region. The Mann–Kendall test was applied to two different areas: the first one was limited to the BZ perimeter, and the second one encompassed the entire PEMP perimeter. This statistical approach enabled the identification of significant trends that have shaped the landscape over this period. Table 2 presents the detailed results of this analysis and provides a clear view of the observed temporal trends.
Initially, when considering only the buffer zone (BZ) area, the Mann–Kendall time trend test revealed significant trends for four land use and occupation classes over the analyzed years (p < 0.05). These significant classes were pasture (3), agriculture (4), mosaic of uses (6), and unvegetated area (7).
The Sen slope, used to calculate the magnitude of trends, indicated that only the mosaic of uses class has shown a reduction in its area. On the other hand, other classes, such as pasture, agriculture, and unvegetated areas, recorded increased area. The most significant magnitude of increase was observed in the pasture class. In the Caatinga context, mosaic of uses areas are those areas used for agricultural purposes, where it is impossible to differentiate between pasture and agriculture, likely due to land use alternations over the years. The association between these classes’ behaviors suggests that areas previously used for various purposes eventually became exclusively used for grazing livestock.
Regarding the Mata da Pimenteira State Park (PEMP) area, only the forest (1) and pasture (3) classes showed significant temporal trends at the 5% significance level (Table 2). Analysis of the magnitude of trends indicated a reduction in forest and an increase in pasture. This finding suggests that the observed reduction in the forest area is associated with its conversion into pasture.
Carvalho et al. [5] investigated the spatial–temporal dynamics and physical–hydrological trends in rainfall events, runoff, and land use in a watershed in the Brazilian semi-arid region. Based on their findings, the Caatinga forest plays a key role in regulating runoff. They observed significant changes in it, such as a decrease by approximately 22 mm in rainfall events/year in deforested areas, in comparison to areas covered by native vegetation. On the other hand, the Caatinga forest has significant positive impacts on surface runoff. According to the authors, this finding highlights the important role played by Caatinga vegetation cover in conserving water resources in the semi-arid region, mainly in influencing the hydrological dynamics.

3.4. Analysis of Abrupt Changes

The analysis of abrupt changes in the landscape over the herein-investigated 19 years (from 2002 to 2020) was conducted based on applying [43] tests in two different areas: one comprised BZ’s perimeter and the other one comprised the entire PEMP perimeter. Table 3 shows the detailed results of this analysis, with emphasis on abrupt change events.
The p-value indicates the significance level adopted in in the Pettitt test, used to assess whether or not there was a temporal trend in the indices’ variation. All LULC classes observed for BZ area presented statistically significant abrupt changes throughout the assessed historical series—these were identified through significance tests, at p-value < 0.05. With respect to the PEMP area, all investigated classes, except for class 7 (unvegetated area), presented significant abrupt changes.
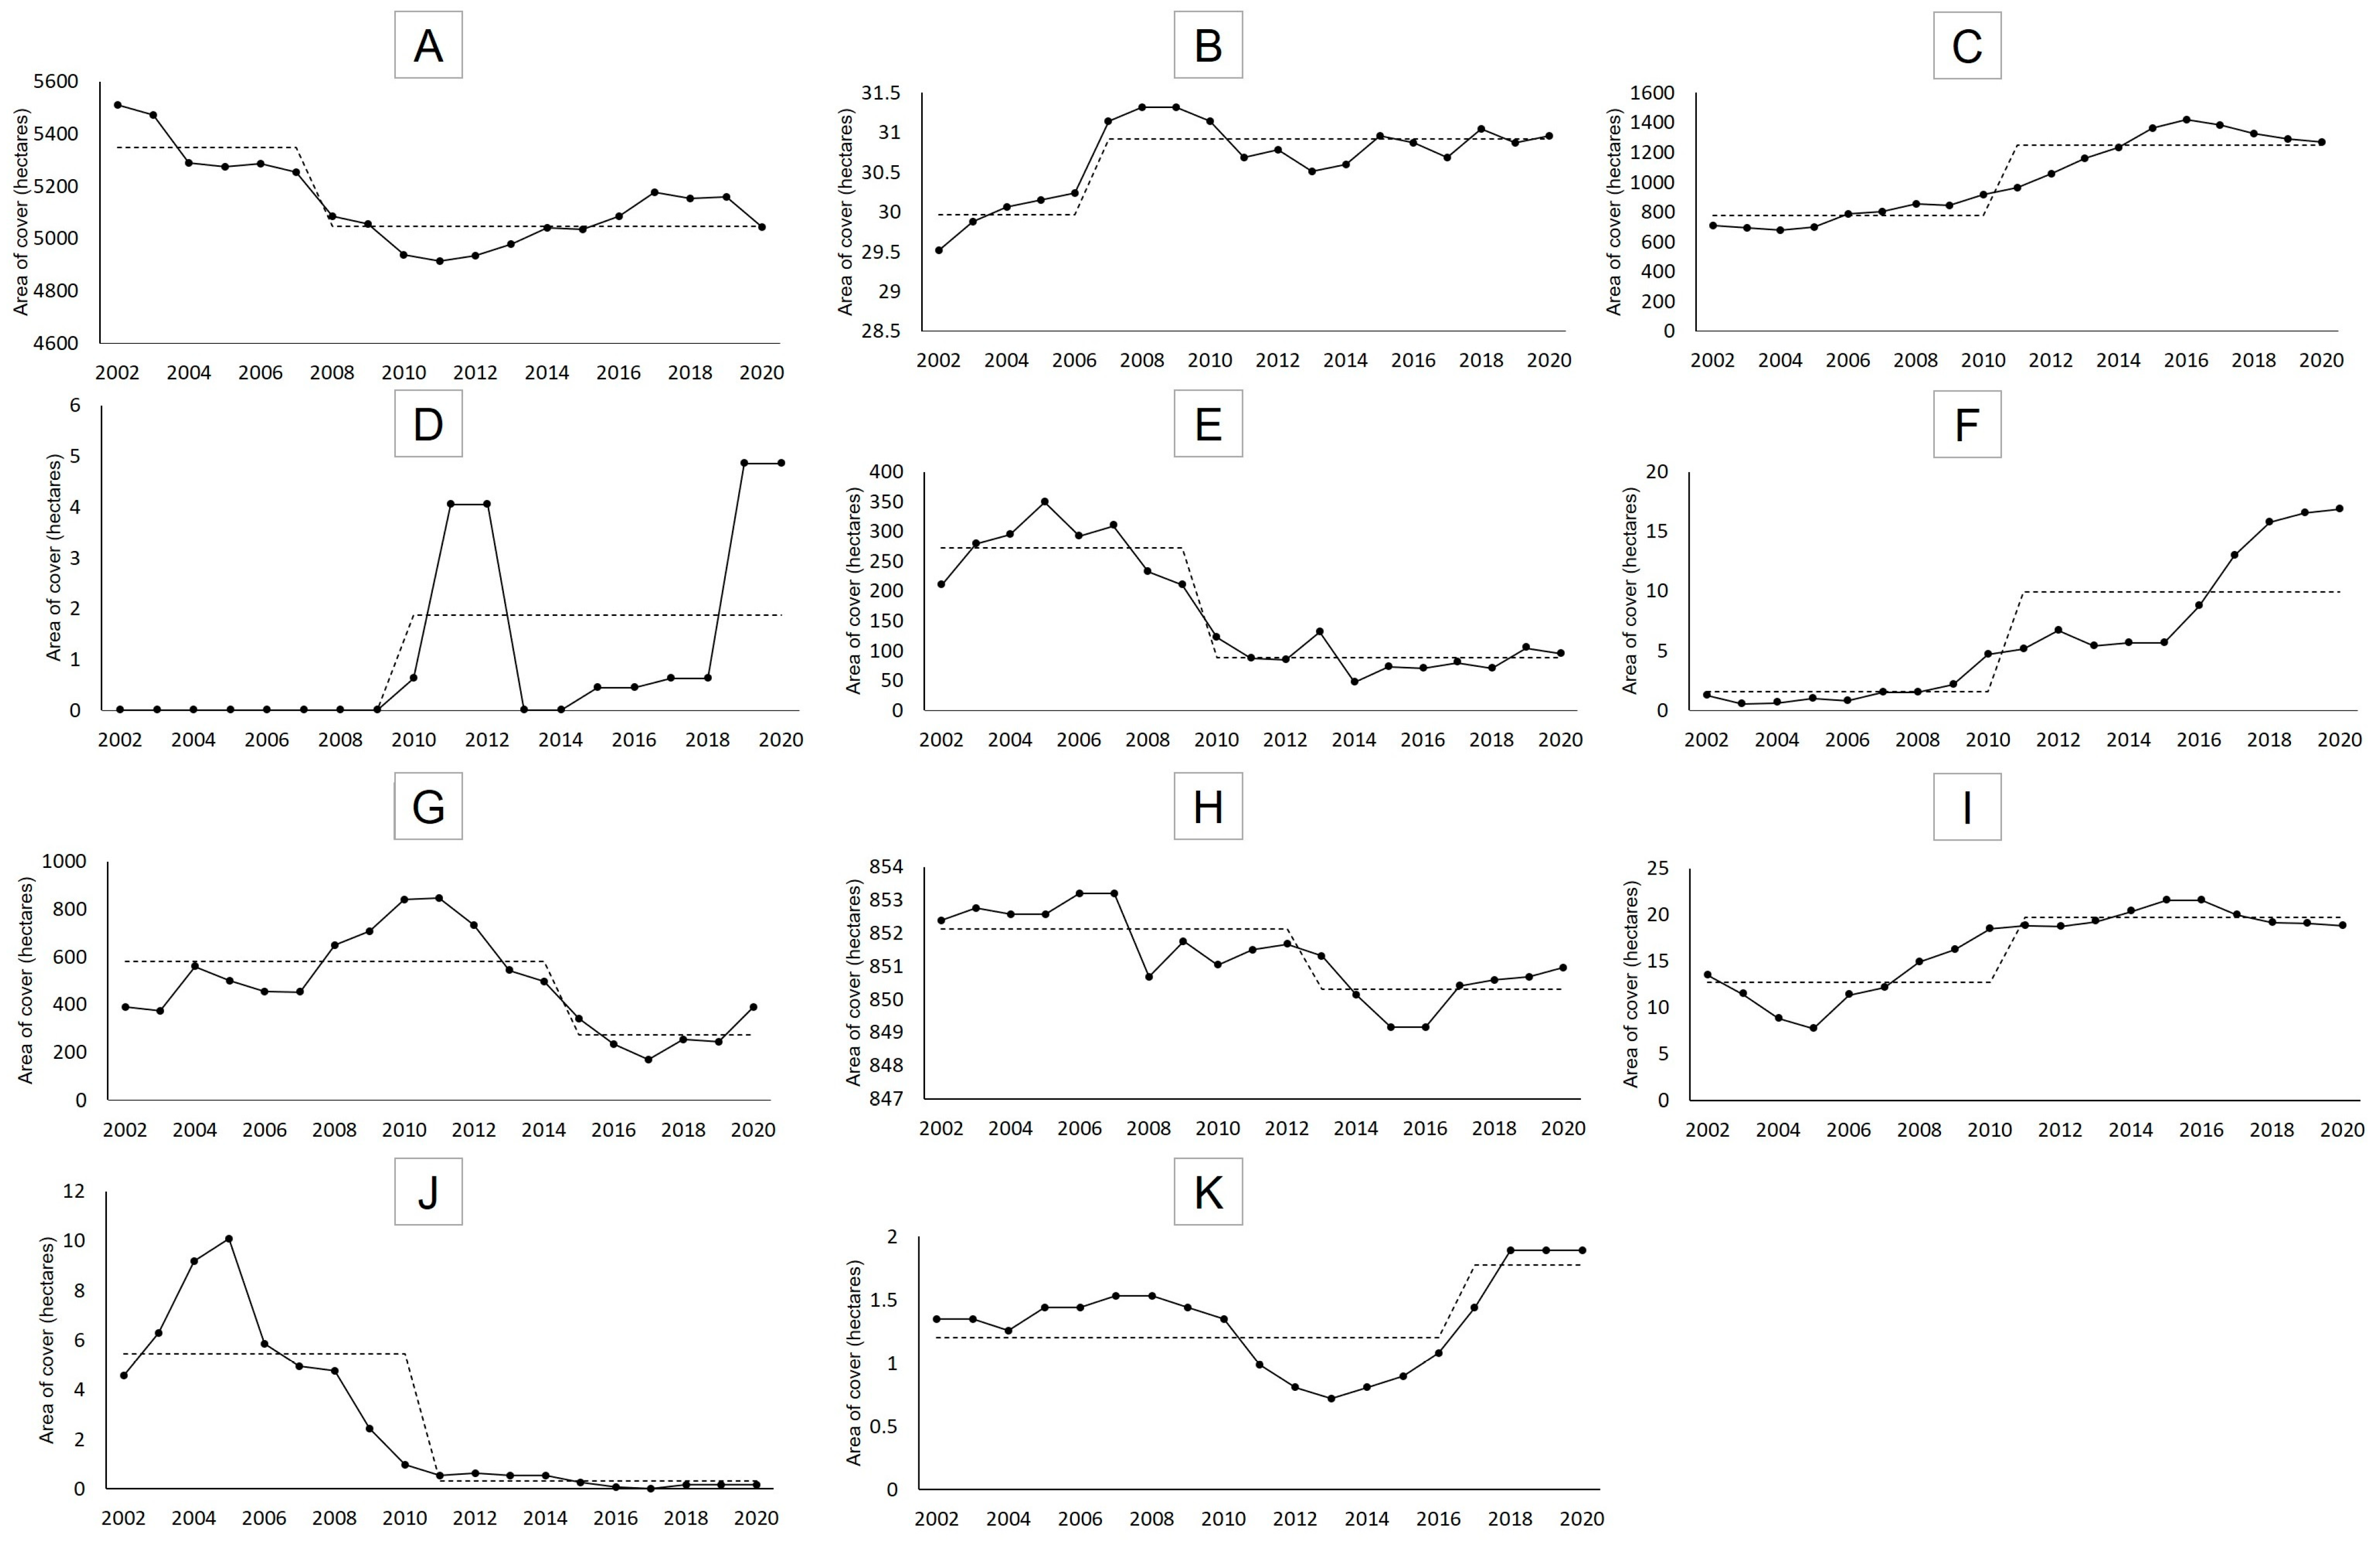
The behaviors of the investigated classes within BZ area followed the results of the Mann–Kendall test. It is important to emphasize that the years when the abrupt changes were observed for all classes, except for class 8 (water surface), were before PEMP’s implementation. Figure 6 summarizes the graphs provided by the Pettitt test to better visualize these classes’ behavior and the magnitude of the abrupt changes.
Based on Figure 6, two of the LULC classes in PEMP’s area—i.e., class 1 (forest) and class 6 (mosaic of uses)—have shown abrupt changes in territorial extension. Class 1 (forest) recorded a significant downward trend from 2012 onwards, whereas class 6 (mosaic of uses) presented abrupt change with a downward trend in 2010. On the other hand, class 3 (pasture) recorded a change with upward trend over the 19-year spatial–temporal analysis. As expected, the changes within the park area were minor. However, it is concerning that some areas designated for restoration, such as zones RZ 1 and 5 (Figure 2), had not achieved their intended outcomes by the time of this assessment (Figure 5).
Three of the LULC classes found in BZ have shown abrupt area reduction: class 1 (forest) recorded a change in 2007; class 6 (mosaic of uses) in 2009; and class 8 (water surface) in 2014. The other classes have shown abrupt points of change related to an increase in their area. Changes identified in LULC classes in the investigated park’s BZ play key roles in conservation and management processes. In addition to the classes showing a downward trend, the other classes recorded an increase in their areas throughout the spatiotemporal analysis. This increase may indicate that expansions in human activities, such as agriculture and urban development, in the PEMP’s surrounding area may exert pressure on the park and increase conflicts. This context highlights the need to carefully plan measures aimed at harmonizing local development and environmental conservation, since BZ plays an essential role in protecting PEMP’s ecosystems.
The massive reduction in natural vegetation and intensification in agricultural land use also affect animal and plant biodiversity and lead to land degradation [56]. Haro-Carrion et al. [57] pointed out the effects of landscape structure and seasonality on wildlife species richness and occupancy in a fragmented dry forest on the coast of Ecuador. According to Haro-Carrion et al. [57], using remote sensing to generate land cover and vegetation maps to analyze occupancy offered spatial and explicitly contextualized findings. His analysis has evidenced that landscape conditions play an essential role in explaining complex associations between forest cover and species’ occupancy.
It is important to note that the increase in agricultural activities can promote vegetation degradation and exacerbate drought conditions. Investigating drought on seasonal and inter-annual scales in this area could facilitate the development of strategies to mitigate the adverse effects of climate variability and increased aridity on vegetation and ecosystem services [58,59].

4. Conclusions

The analysis applied to the spatial dynamics of land use and cover in the Mata da Pimenteira State Park (PEMP) region and in its buffer zone (BZ) has revealed changes over the years. The forest class was the most extensive one, followed by pasture, water surface, and mosaic of uses, with agriculture appearing sporadically. Despite the park’s formal designation as a conservation unit in 2012, anthropized areas have persisted, particularly in the eastern and southwestern sections of the park.
Forest conversion into pastures was the most significant change observed, and it indicated advanced human occupation, mainly in BZ’s northern, northwestern, and eastern regions. This trend was mostly evident between 2002 and 2011, but continued at a lower intensity in the subsequent period. Settlement projects near protected areas present challenges to Caatinga’s conservation efforts, as evidenced by the expansion of agricultural and pastoral activities within these regions.
Mann–Kendall and Pettitt’s tests have confirmed significant temporal trends and abrupt changes in land use classes. The increase in pastureland, the reduction in forested areas, and the mosaic of uses highlight the ongoing environmental degradation, particularly in RZ 1 and 5.
These findings emphasize the need for a well-coordinated approach to balance sustainable local development with environmental conservation. Effective management of the BZ is critical for safeguarding PEMP’s ecosystems by mitigating the adverse effects of neighboring human activities. Restoring and preserving native vegetation is essential for maintaining water resources and biodiversity in the semiarid region.
Moreover, integrating settled communities into environmental conservation and promoting the sustainable use of forest resources can foster a harmonious relationship between human development and Caatinga preservation. The ongoing monitoring and proper management of these areas are essential to ensuring the ecological integrity and long-term sustainability of both PEMP and its buffer zone. Public authorities and policymakers should consider these findings to devise strategies that will protect this vital ecosystem and support the livelihoods of those who depend on it.

Author Contributions

Conceptualization, J.C.G.d.C. and A.C.B.; methodology, J.C.G.d.C., A.S.d.S., M.V.d.S., R.F.J.M., J.L.B.d.S., A.M.d.R.F.J. and A.C.B.; software, J.C.G.d.C.; validation, J.C.G.d.C., R.F.J.M., E.A., A.H.C.d.N., A.F.S. and A.C.B.; formal analysis, J.C.G.d.C., A.M.d.R.F.J. and A.C.B.; investigation, J.C.G.d.C., R.F.J.M., A.M.d.R.F.J., E.A., A.H.C.d.N., A.F.S. and A.C.B.; resources, E.A., A.H.C.d.N., A.F.S. and A.C.B.; data curation, J.C.G.d.C., E.F.d.S., A.M.d.R.F.J. and A.C.B.; writing—original draft preparation, J.C.G.d.C., A.S.d.S., A.M.d.R.F.J., M.V.d.S., R.F.J.M., J.L.B.d.S. and A.C.B.; writing—review and editing, J.C.G.d.C., E.F.d.S., A.M.d.R.F.J. and A.C.B.; visualization, J.C.G.d.C., A.S.d.S., M.V.d.S., R.F.J.M. and J.L.B.d.S.; supervision, R.F.J.M. and A.C.B.; project administration, E.A., A.H.C.d.N., A.F.S. and A.C.B.; funding acquisition, A.C.B. All authors have read and agreed to the published version of the manuscript.

Funding

We thank the Federal Rural University of Pernambuco (UFRPE) for providing the physical infrastructure, computers, and logistics necessary to conduct this research. We also thank UFRPE’s scientific initiation program (PIC/UFRPE) for offering a volunteer position. In addition, A.M.d.R.F.J. thanks the São Paulo Research Foundation—FAPESP (grant number 2023/05323-4) for the research fellowship. Lastly, we are grateful to the state environment agency (Agência Estadual de Meio Ambiente—CPRH) for supplying the vector files of the conservation unit.

Data Availability Statement

Data are contained within the article, and further inquiries can be directed to the corresponding author.

Conflicts of Interest

The authors declare no conflicts of interest.

References

  1. United Nations. United Nations Convention to Combat Desertification in Countries Experiencing Serious Drought and/or Desertification, Particularly in Africa; Technical Report Document; United Nations Convention to Combat Desertification (Secretariat): New York, NY, USA, 1994. [Google Scholar]
  2. Palácio, H.A.Q.; Andrade, E.M.; Santos, J.C.N.; Neto, J.R.A.; Brasil, P.P. Emergy Evaluation of Semi-Arid Watersheds under Different Management Strategies. Trans. ASABE 2013, 56, 1357–1363. [Google Scholar] [CrossRef]
  3. Vorovencii, I. Applying the Change Vector Analysis Technique to Assess the Desertification Risk in the South-West of Romania in the Period 1984–2011. Environ. Monit. Assess. 2017, 189, 524. [Google Scholar] [CrossRef] [PubMed]
  4. Kumar, S.; Kumar, A. Hotspot and Trend Analysis of Forest Fires and Its Relation to Climatic in the Western Himalayas. Nat. Hazards 2022, 114, 3529–3544. [Google Scholar] [CrossRef] [PubMed]
  5. De Carvalho, A.A.; da Silva, M.J.G.; Batista, F.R.d.C.; Araújo, J.S.; Montenegro, A.A.d.A.; da Silva, T.G.F.; Almeida, T.A.B.; da Silva, M.V.; Dias, J.; Cavalcante, I.T.R.; et al. Spatio-Temporal Dynamics and Physico-Hydrological Trends in Rainfall, Runoff and Land Use in Paraíba Watershed. Geographies 2023, 3, 714–727. [Google Scholar] [CrossRef]
  6. Refati, D.C.; da Silva, J.L.B.; Macedo, R.S.; Lima, R.d.C.C.; da Silva, M.V.; Pandorfi, H.; Silva, P.C.; de Oliveira-Júnior, J.F. Influence of Drought and Anthropogenic Pressures on Land Use and Land Cover Change in the Brazilian Semiarid Region. J. South Am. Earth Sci. 2023, 126, 104362. [Google Scholar] [CrossRef]
  7. MapBiomas Project. Collection 8 of the Annual Land Cover and Land Use Maps of Brazil (1985–2022). 2024. Available online: https://brasil.mapbiomas.org/wp-content/uploads/sites/4/2023/10/FACT_MapBiomas_Florestas_23.10.2023_v5.pdf (accessed on 2 August 2024).
  8. Projeto MapBiomas Collection 7 of the Annual Series of Land Use and Land Cover Maps of Brazil. Available online: https://brasil.mapbiomas.org/wp-content/uploads/sites/4/2023/09/Fact_ing_versao-final.pdf (accessed on 9 December 2023).
  9. Bezerra, A.C.; da Silva, J.L.B.; Silva, D.A.D.O.; Batista, P.H.D.; Pinheiro, L.D.C.; Lopes, P.M.O.; Moura, G.B.A. Monitoramento Espaço-Temporal Da Detecção de Mudanças Em Vegetação de Caatinga Por Sensoriamento Remoto No Semiárido Brasileiro. Rev. Bras. De Geogr. Física 2020, 13, 286. [Google Scholar] [CrossRef]
  10. Nascimento, K.R.P.; Alves, E.R.; Alves, M.V.; Galvíncio, J.D. Impacto Da Precipitação e Do Uso e Ocupação Do Solo Na Cobertura Vegetal Na Caatinga. J. Environ. Anal. Prog. 2020, 5, 221–231. [Google Scholar] [CrossRef]
  11. Andrade, E.M.; Guerreiro, M.J.S.; Palácio, H.A.Q.; Campos, D.A. Ecohydrology in a Brazilian Tropical Dry Forest: Thinned Vegetation Impact on Hydrological Functions and Ecosystem Services. J. Hydrol. Reg. Stud. 2020, 27, 100649. [Google Scholar] [CrossRef]
  12. Jardim, A.M.d.R.F.; Júnior, G.D.N.A.; da Silva, M.V.; dos Santos, A.; da Silva, J.L.B.; Pandorfi, H.; de Oliveira-Júnior, J.F.; Teixeira, A.H.d.C.; Teodoro, P.E.; de Lima, J.L.M.P.; et al. Using Remote Sensing to Quantify the Joint Effects of Climate and Land Use/Land Cover Changes on the Caatinga Biome of Northeast Brazilian. Remote Sens. 2022, 14, 1911. [Google Scholar] [CrossRef]
  13. Medeiros, R.; Andrade, J.; Ramos, D.; Moura, M.; Pérez-Marin, A.M.; Dos Santos, C.A.C.; da Silva, B.B.; Cunha, J. Remote Sensing Phenology of the Brazilian Caatinga and Its Environmental Drivers. Remote Sens. 2022, 14, 2637. [Google Scholar] [CrossRef]
  14. Da Silva, J.L.B.; Moura, G.B.d.A.; da Silva, M.V.; de Oliveira-Júnior, J.F.; Jardim, A.M.d.R.F.; Refati, D.C.; Lima, R.d.C.C.; de Carvalho, A.A.; Ferreira, M.B.; de Brito, J.I.B.; et al. Environmental Degradation of Vegetation Cover and Water Bodies in the Semiarid Region of the Brazilian Northeast via Cloud Geoprocessing Techniques Applied to Orbital Data. J. South Am. Earth Sci. 2023, 121, 104164. [Google Scholar] [CrossRef]
  15. De Medeiros, M.B.; Fiedler, N.C. Incêndios florestais no parque nacional da Serra da Canastra: Desafios para a conservação da biodiversidade. Ciência Florest. 2004, 14, 157–168. [Google Scholar] [CrossRef]
  16. Nunes, G.A. Monitoramento Ambiental Por Meio Da Ciência Cidadã Em Cavernas de Unidades de Conservação Do Estado de São Paulo; Universidade de São Paulo: São Carlos, Brazil, 2021. [Google Scholar]
  17. Gorelick, N.; Hancher, M.; Dixon, M.; Ilyushchenko, S.; Thau, D.; Moore, R. Google Earth Engine: Planetary-Scale Geospatial Analysis for Everyone. Remote Sens. Environ. 2017, 202, 18–27. [Google Scholar] [CrossRef]
  18. Alencar, A.; Shimbo, J.Z.; Lenti, F.; Marques, C.B.; Zimbres, B.; Rosa, M.; Arruda, V.; Castro, I.; Ribeiro, J.P.F.M.; Varela, V.; et al. Mapping Three Decades of Changes in the Brazilian Savanna Native Vegetation Using Landsat Data Processed in the Google Earth Engine Platform. Remote Sens. 2020, 12, 924. [Google Scholar] [CrossRef]
  19. Souza, C.M.; Shimbo, J.Z.; Rosa, M.R.; Parente, L.L.; Alencar, A.; Rudorff, B.F.; Hasenack, H.; Matsumoto, M.; Ferreira, L.G.; E Souza-Filho, P.W.; et al. Reconstructing Three Decades of Land Use and Land Cover Changes in Brazilian Biomes with Landsat Archive and Earth Engine. Remote Sens 2020, 12, 2735. [Google Scholar] [CrossRef]
  20. Arruda, V.L.S.; Piontekowski, V.J.; Alencar, A.; Pereira, R.S.; Matricardi, E.A.T. An Alternative Approach for Mapping Burn Scars Using Landsat Imagery, Google Earth Engine, and Deep Learning in the Brazilian Savanna. Remote Sens. Appl.-Soc. Environ. 2021, 22, 2735. [Google Scholar] [CrossRef]
  21. Diniz, C.; Cortinhas, L.; Pinheiro, M.L.; Sadeck, L.; Filho, A.F.; Baumann, L.R.F.; Adami, M.; Souza-Filho, P.W.M. A Large-Scale Deep-Learning Approach for Multi-Temporal Aqua and Salt-Culture Mapping. Remote Sens. 2021, 13, 1415. [Google Scholar] [CrossRef]
  22. Rosa, M.R.; Brancalion, P.H.S.; Crouzeilles, R.; Tambosi, L.R.; Piffer, P.R.; Lenti, F.E.B.; Hirota, M.; Santiami, E.; Metzger, J.P. Hidden Destruction of Older Forests Threatens Brazil’s Atlantic Forest and Challenges Restoration Programs. Sci. Adv. 2021, 7, eabc4547. [Google Scholar] [CrossRef]
  23. Alvares, C.A.; Stape, J.L.; Sentelhas, P.C.; Leonardo, J.; Gonçalves, M.; Sparovek, G. Köppen’s Climate Classification Map for Brazil. Meteorol. Z. 2013, 22, 711–728. [Google Scholar] [CrossRef]
  24. Lins, F.A.C.; Da Silva, J.L.B.; Moura, G.B.D.A.; Ortiz, P.F.S.; Oliveira, J.D.A.; Alves, M.V.C. Quantile Technique to Precipitation, Rainfall Anomaly Index and Biophysical Parameters by Remote Sensing in Serra Talhada, Pernambuco. J. Hyperspectral Remote Sens. 2017, 7, 334–344. [Google Scholar] [CrossRef]
  25. Da Costa, S.A.T.; Bezerra, A.C.; Araújo, A.M.Q.d.A.; Silva, M.F.d.S.; da Neto, J.F.; Alves, R.M.; Souza, L.S.B. de Dinâmica Espaço-Temporal Das Anomalias de Precipitação Em Uma Região Semiárida, Nordeste Do Brasil. Rev. De Gestão De Água Da América Lat. 2021, 18, 1–15. [Google Scholar] [CrossRef]
  26. Fonseca, R.C.; Tavares, J.R., Jr.; Candeias, A.L.B. Programação Python e Índices Físicos Na Detecção de Bordas Na Unidade de Conservação Parque Estadual Mata Da Pimenteira (Pernambuco). Rev. Bras. De Sensoriamento Remoto 2020, 1, 42–57. [Google Scholar]
  27. Sousa, J.S.; Santos, E.M. dos Dinâmica Da Mudança Do Uso e Cobertura Da Terra Em Uma Paisagem Da Caatinga Protegida e Sua Zona de Amortecimento. Rev. Ibero-Am. De Ciências Ambient. 2020, 11, 219–234. [Google Scholar] [CrossRef]
  28. PERNAMBUCO Parque Estadual Mata Da Pimenteira: Plano de Manejo. Secretaria de Meio Ambiente e Sustentabilidade, Agência Estadual de Meio Ambiente 2013. Available online: https://www2.cprh.pe.gov.br/wp-content/uploads/2021/01/PE-Mata-da-Pimenteira-22-11-2013.pdf (accessed on 1 December 2023).
  29. Congedo, L. Semi-Automatic Classification Plugin Documentation; Release 8.1.3.1; GitHub: San Francisco, CA, USA, 2024. [Google Scholar]
  30. Iban, M.C.; Sahin, E. Monitoring Land Use and Land Cover Change near a Nuclear Power Plant Construction Site: Akkuyu Case, Turkey. Environ. Monit. Assess. 2022, 194, 1–19. [Google Scholar] [CrossRef]
  31. Gonçalves, V.; Ribeiro, E.A.W. Obtenção de Série Histórica Da Evolução Da Classe Floresta Plantada a Partir Dos Dados de Uso e Cobertura Do Solo Da Coleção 5 Do Projeto MapBiomas. Metodol. E Aprendizado 2021, 4, 99–105. [Google Scholar] [CrossRef]
  32. Li, T.; Li, M.; Ren, F.; Tian, L. Estimation and Spatio-Temporal Change Analysis of NPP in Subtropical Forests: A Case Study of Shaoguan, Guangdong, China. Remote Sens. 2022, 14, 2541. [Google Scholar] [CrossRef]
  33. Frimpong, B.F.; Koranteng, A.; Molkenthin, F. Analysis of Temperature Variability Utilising Mann–Kendall and Sen’s Slope Estimator Tests in the Accra and Kumasi Metropolises in Ghana. Environ. Syst. Res. 2022, 11, 1–13. [Google Scholar] [CrossRef]
  34. Mann, H.B. Non-Parametric Test against Trend. Econometrica 1945, 13, 245–259. [Google Scholar] [CrossRef]
  35. Kendall, M.G. Rank Correlation Methods; Charles Griffin: London, UK, 1975. [Google Scholar]
  36. Sneyers, R. On the Statistical Analysis of Series of Observations; Organisation Meteorologique Mondial—Note Technique; World Meteorological Organization: Geneva, Switzerland, 1975; 192p. [Google Scholar]
  37. Hamed, K.H.; Rao, A.R. A Modified Mann-Kendall Trend Test for Autocorrelated Data. J. Hydrol. 1998, 204, 182–196. [Google Scholar] [CrossRef]
  38. Randles, J. Introduction to Environmental Data Analysis and Modeling; Springer: New York, NY, USA, 2015. [Google Scholar]
  39. Theil, H.A. A Rank-Invariant Method of Linear and Polynomial Analysis, Part 3. Proc. Koninalijke Ned. Akad. Van Weinenschatpen A 1950, 53, 1397–1412. [Google Scholar]
  40. Sen, P.K. Estimates of the Regression Coefficient Based on Kendall’s Tau. J. Am. Stat. Assoc. 1968, 63, 1379–1389. [Google Scholar] [CrossRef]
  41. Campos, J.D.O.; Marinho, H.; Chaves, L. Tendências e Variabilidades Nas Séries Históricas de Precipitação Mensal e Anual No Bioma Cerrado No Período 1977–2010. Rev. Bras. De Meteorol. 2020, 35, 157–169. [Google Scholar] [CrossRef]
  42. Pettitt, A.N. A Non-Parametric Approach to the Change-Point Problem. J. R. Stat. Soc. Ser. C Appl. Stat. 1979, 28, 126–135. [Google Scholar] [CrossRef]
  43. Hajani, E.; Rahman, A. Characterizing Changes in Rainfall: A Case Study for New South Wales, Australia. Int. J. Climatol. 2018, 38, 1452–1462. [Google Scholar] [CrossRef]
  44. Dos Santos Clemente, S.; De Oliveira Júnior, J.F.; Passos Louzada, M.A. Focos de Calor Na Mata Atlântica Do Estado Do Rio de Janeiro. Rev. Bras. De Meteorol. 2017, 32, 669–677. [Google Scholar] [CrossRef]
  45. R Core Team. R Development Core Team. R: A Language and Environment for Statistical Computing; R Foundation for Statistical Computing: Vienna, Austria, 2023. [Google Scholar]
  46. Bilar, A.B.C.; Pimentel, R.M.d.M.; de Araújo, M.D.S.B. Sustainability of Settlements around Conservation Units: The Case of Parque Estadual Mata Da Pimenteira in Serra Talhada/PE. Sustain. Debate 2016, 7, 195–211. [Google Scholar] [CrossRef]
  47. De Oliveira, M.L.; dos Santos, C.A.; de Oliveira, G.; Silva, M.T.; da Silva, B.B.; Cunha, J.E.d.B.; Ruhoff, A.; Santos, C.A. Remote Sensing-Based Assessment of Land Degradation and Drought Impacts over Terrestrial Ecosystems in Northeastern Brazil. Sci. Total Environ. 2022, 835, 155490. [Google Scholar] [CrossRef]
  48. Bezerra, A.C.; da Costa, S.A.T.; da Silva, J.L.B.; Araújo, A.M.Q.; Moura, G.B.d.A.; Lopes, P.M.O.; Nascimento, C.R. Annual Rainfall in Pernambuco, Brazil: Regionalities, Regimes, and Time Trends. Rev. Bras. De Meteorol. 2021, 36, 403–414. [Google Scholar] [CrossRef]
  49. Serra Talhada Lei Orgânica Do Município de Serra Talhada. Câmara Municipal de Serra Talhada 2008. Available online: https://www.serratalhada.pe.leg.br/leis/lei-organica-municipal/lei-organica-do-municipio-de-serra-talhada-pe/view (accessed on 9 December 2023).
  50. Oliveira, V.P.V. Litoral e Sertão: Natureza e Sociedade No Nordeste Brasileiro—Google Livros. In Litoral e Sertão—Natureza e Sociedade no Nordeste Brasileiro; da Silva, J.B., Dantas, E.W.C., Zanella, M.E., Meireles, A.J.A., Eds.; Expressão Gráfica: Fortaleza, Brazil, 2006; pp. 187–200. [Google Scholar]
  51. Pinheiro, A.G.; Dos Santos, J.C.N.; Palácio, H.A.D.Q.; De Araújo Neto, J.R.; De Andrade, E.M. Eficiência da Cobertura Vegetal Na Redução Das Perdas de Água E Solo No Município de Iguatu. IRRIGA 2018, 23, 133–142. [Google Scholar] [CrossRef]
  52. Silva, J.L.B.; Moura, G.B.A.; Lopes, P.M.O.; Silva, E.F.F.; Ortiz, P.F.S.; Silva, D.A.O.; Silva, M.V.; Guedes, R.V. Spatial-Temporal Monitoring of the Risk of Environmental Degradation and Desertification by Remote Sensing in a Brazilian Semiarid Region. Rev. Bras. De Geogr. Física 2020, 13, 544–563. [Google Scholar] [CrossRef]
  53. Francelino, M.R.; Fernandes Filho, E.I.; Resende, M.; Leite, H.G. Contribuição Da Caatinga Na Sustentabilidade de Projetos de Assentamentos No Sertão Norte-Rio-Grandense. Rev. Árvore 2003, 27, 79–86. [Google Scholar] [CrossRef]
  54. Beduschi Filho, L.C.; Abramovay, R. Sociedade, Natureza e Reforma Agrária: Assentamentos Rurais e Unidades de Conservação Na Região Do Pontal Do Paranapanema; Universidade de São Paulo: São Paulo, Brazil, 2002. [Google Scholar]
  55. Gariglio, M.A.; Sampaio, E.V.d.S.B.; Cestaro, L.A.; Kageyama, P.Y. Uso Sustentável e Conservação Dos Recursos Florestais Da Caatinga 2010; Serviço Florestal Brasileiro: Santarém, Brazil, 2010.
  56. Eckert, S.; Kiteme, B.; Njuguna, E.; Zaehringer, J.G. Agricultural Expansion and Intensification in the Foothills of Mount: A Landscape Perspective. Remote Sens. 2017, 9, 784. [Google Scholar] [CrossRef]
  57. Haro-Carrion, X.; Johnston, J.; Bedoya-Duran, M.J. Landscape Structure and Seasonality: Effects on Wildlife Species and Occupancy in a Fragmented Dry Forest in Coastal Ecuador. Remote Sens. 2021, 13, 3762. [Google Scholar] [CrossRef]
  58. Gebremeskel Haile, G.; Tang, Q.; Leng, G.; Jia, G.; Wang, J.; Cai, D.; Sun, S.; Baniya, B.; Zhang, Q. Long-Term Spatiotemporal Variation of Drought Patterns over the Greater Horn of Africa. Sci. Total Environ. 2020, 704, 135299. [Google Scholar] [CrossRef]
  59. Measho, S.; Chen, B.; Trisurat, Y.; Pellikka, P.; Guo, L.; Arunyawat, S.; Tuankrua, V.; Ogbazghi, W.; Yemane, T. Spatio-Temporal Analysis of Vegetation Dynamics as a Response to Climate Variability and Drought Patterns in the Semiarid Region, Eritrea. Remote Sens. 2019, 11, 724. [Google Scholar] [CrossRef]
Figure 1. The study site’s spatial location highlights Mata da Pimenteira State Park (PEMP) and the buffer zone (BZ) in Serra Talhada, Pernambuco State, Brazil.
Agriengineering 06 00190 g001
Figure 2. Zoning of Mata da Pimenteira State Park (PEMP) and its respective buffer zone (BZ), according to the management plan established in 2013.
Agriengineering 06 00190 g002
Figure 3. Flowchart for methodology adopted. Each step indicates the data processing and analyses applied.
Agriengineering 06 00190 g003
Figure 4. Spatial dynamics of land use and land cover (LULC) in Mata da Pimenteira State Park (PEMP) and in its buffer zone (BZ) in 2002, 2008, 2014, and 2020.
Agriengineering 06 00190 g004
Figure 5. Spatial–temporal evolution of land use and cover in Mata da Pimenteira State Park (PEMP) and in its respective buffer zone (BZ), comparing different temporal compositions from 2002–2011, 2011–2020, and 2002–2020.
Agriengineering 06 00190 g005
Figure 6. Behaviors of the areas of different land-use and -cover classes comprising PEMP’s buffer zone (BZ) and PEMP’s area in the 19-year time series, from 2002 to 2020, with distinct y-axis scales corresponding to a coverage area (ha) for each class to enhance data visualization. The dashed line in the graphs indicates the separation of periods with different averages according to the Pettitt test. Buffer zone: (A) Class 1—forest; (B) Class 2—non-forest natural formation; (C) Class 3—pasture; (D) Class 4—agriculture; (E) Class 6—mosaic of uses; (F) Class 7—unvegetated area; (G) Class 8—water surface. Mata da Pimenteira State Park: (H) Class 1—forest; (I) Class 3—pasture; (J) Class 6—mosaic of uses; (K) Class 7—unvegetated area.
Agriengineering 06 00190 g006
Table 1. Cover change areas in two different sections. The first one comprises BZ’s perimeter and the second one comprises PEMP’s perimeter—based on comparing different time compositions (2002–2011, 2011–2020 and 2002–2020). The colors represent the classes in Figure 5.
Cover Variation|Buffer Zone (BZ)
Classes of Change2002–20112011–20202002–2020
Area (ha)
Afforestation 8. NFNF → Forest0.630.720.45
11. Pasture → Forest116.64136.35108
23. MU → Forest73.8928.0884.06
Deforestation 13. Forest → Pasture375.12261.45601.83
17. Forest → Agriculture0.990.361.98
25. Forest → MU42.8429.5249.59
31. Forest → UA1.261.712.43
Cover Variation|Mata da Pimenteira State Park (PEMP)
Classes of Change2002–20112011–20202002–2020
Area (ha)
Afforestation 8. NFNF → Forest000
11. Pasture → Forest2.343.782.97
23. MU → Forest2.880.093.15
Deforestation 13. Forest → Pasture6.33.787.2
17. Forest → Agriculture000
25. Forest → MU0.090.180.18
31. Forest → UA00.450.27
Table 2. Mann–Kendall’s (1975) time trend analysis applied to two different sections: the BZ’s perimeter and the PEMP’s perimeter over a 19-year time series from 2002 to 2020.
Mann–Kendall Time Trend|Buffer Zone (BZ)
ClassTauSen’ SlopeZ-Valuep-Value
1—Forest−0.357−17.0264−1.6140.110 ns
2—Non-forest Natural Formation0.3510.05631.5390.120 ns
3—Pasture0.78944.79003.2280.001 **
4—Agriculture0.5150.05253.3230.000 **
6—Mosaic of Uses−0.556−14.0593−2.2890.022 *
7—Unvegetated Area0.8950.79203.6220.000 **
8—Water Surface Area−0.239−14.6507−1.1300.258 ns
Mann–Kendall Time Trend|Mata da Pimenteira State Park (PEMP)
ClassTauSen’ SlopeZ-Valuep-Value
1—Forest−0.520−0.144−3.0860.002 **
3—Pasture0.6260.6192.6010.009 **
6—Mosaic of Uses−0.778−0.382−3.3590.000 **
7—Unvegetated Area0.0990.0060.4870.626 ns
Note: ** = significance at 1%; * = significance at 5%; ns = non-significant.
Table 3. Analysis of abrupt changes based on using Pettitt test [43] in two different sections. The first one only comprised BZ’s perimeter and the second one comprised PEMP’s perimeter in a 19-year time series, from 2002 to 2020.
Pettitt’s Abrupt Change (1979)|Buffer Zone (BZ)
Classp-Value (Bilateral)KcritYear of ChangeUt,T
1—Forest0.013 *6200778
2—Non-forest Natural Formation0.034 *5200670
3—Pasture0.002 **9201090
4—Agriculture0.027 **8200972
6—Mosaic of Uses0.003 **8200988
7—Unvegetated Area0.002 **9201090
8—Water Surface Area0.016 *13201476
Pettitt’s Abrupt Change (1979)|Mata da Pimenteira State Park (PEMP)
Classp-Value (Bilateral)KcritYear of ChangeUt,T
1—Forest0.008 *11201281
3—Pasture0.002 **9201090
6—Mosaic of Uses0.002 **9201090
7—Unvegetated Area0.194 ns15201653
Note: ** = significance at 1%; * = significance at 5%; ns = non-significant.
Disclaimer/Publisher’s Note: The statements, opinions and data contained in all publications are solely those of the individual author(s) and contributor(s) and not of MDPI and/or the editor(s). MDPI and/or the editor(s) disclaim responsibility for any injury to people or property resulting from any ideas, methods, instructions or products referred to in the content.