1. Introduction
Agriculture is a sector of significant relevance to the Brazilian economy, accounting for approximately 8% of the 25% contribution to the GDP. According to the report released by the Brazilian Association of Meat Exporting Industries [
1], Brazil has the second-largest cattle herd in the world, with approximately 202 million head, representing 12.18% of the global bovine population. Additionally, Brazil is the largest exporter of beef worldwide and has been integrating advanced technologies to meet the global demand for food [
2,
3].
Centered on the global objective of food production, disease control, traceability, and the updating of health and sanitation records in support of livestock farming, animal identification holds significant socioeconomic importance. Following the guidelines of the WOAH (World Organisation for Animal Health) regarding animal tracking, especially for herds intended for direct food production, coupled with the increasing consumer demands for food safety, underscores the importance of traceability systems [
4].
Computer vision applications involving machine learning have become increasingly common not only in controlled, laboratory environments, but also as strongly integrated elements in dynamic, real-time decision-making processes. Specifically, agriculture and livestock farming have benefited from technological advancements in fields such as few-shot learning (FSL) [
5] since it makes the usage of deep learning techniques with small datasets feasible. For instance, Yang et al. [
6] proposed a methodology based on FSL for plant disease classification, and Qiao et al. [
7] utilized an FSL-based strategy for bovine segmentation in videos.
One of the possible applications of deep learning in a feedlot system is the individual identification of animals, which allows for traceability. In turn, this is useful for tasks such as sanitary control [
8] and insurance fraud prevention [
9]. Animal biometric identification with deep learning is usually conducted on muzzle prints and coat patterns, which can be considered more reliable and less invasive than traditional techniques [
8]. Other characteristics that can be used for identification include iris and retinal vein patterns [
10].
Traceability provided by the association of machine learning and artificial intelligence is also a crucial component in the confinement system, as it enables the individual identification of animals. The information collected from this traceability focuses primarily on sanitary control and disease trajectories. Animal biometrics is generally carried out through the identification of cattle nose patterns, which are comparable to fingerprints, with the added advantage of being a non-invasive method reliant solely on machine learning modeling [
11].
The replacement of traditional identification methods with traceability using cattle nose pattern recognition, as opposed to direct skin marking or ear tagging, is emerging as a factor of quality and animal welfare. This non-invasive technique not only enhances the accuracy of identification, but also significantly reduces stress and discomfort for the animals, promoting a higher standard of well-being [
12]. Considered a frontier milestone in computer vision, biometrics applied to livestock and animal monitoring in general allows for pattern recognition and cognitive science as essential elements for recording, correctly identifying, and verifying animals. In this context, cattle are included as a primary focus. This integration of advanced technologies not only ensures precise identification, but also enhances the overall management and welfare of livestock Uladzislau and Feng [
13].
Deep learning applications for cattle biometric identification have been studied in several recent works, and a comprehensive review on the topic was conducted by Hossain et al. [
8]. For instance, Li et al. [
11] evaluated over 50 convolutional neural network and reported a maximum accuracy of 98.7% in cattle muzzle identification. Some of these works employed few-shot learning techniques. One of them is the work by Qiao et al. [
7], who proposed a model for one-shot segmentation of cattle, which is important for the acquisition of data of individuals. Another example is that by Shojaeipour et al. [
12], who evaluated a ResNet50 in a 5-shot cattle muzzle identification task and reported an accuracy of 99.11%. With those experiments in mind, we propose to not only look at the muzzle, but the entire face of the animal, which has some significant differentiation features using the Siamese network adaptation of the classifiers analyzed in those papers.
In the assessment of each experiment, a crucial step involves the computation of a loss value, a fundamental process within the realm of deep learning, executed via diverse functions tailored to perform distinct calculations [
14]. Remarkably, these functions yield vastly disparate values for identical inputs, emphasizing the paramount significance of selecting an appropriate function, particularly within metric learning frameworks [
15]. While there is a number of acknowledged loss functions for metric learning, such as the contrastive and triplet losses [
16], the strategy of adapting such losses or composing new ones is adopted in works on diverse problems, with the objective of enhancing performance [
17].
For instance, Lu et al. [
18] used a modified contrastive loss function to train a Siamese neural network for signature verification, reporting an increase of 5.9% in accuracy. This strategy is commonly used for human face recognition. SphereFace [
19], CosFace [
20], and ArcFace are but three examples of custom loss functions designed for this purpose. ArcFace has been used for cattle face identification in the work of Xu et al. [
21], where an accuracy of 91.3% was reported.
Building upon these advancements, we devised a novel loss function, emphasizing the distinctions between feature vectors of different classes, to facilitate more efficient convergence of error to zero. In this paper, we investigate the use of a Siamese neural network for few-shot cattle identification in a traditional way and in a 10-shot learning context using the proposed loss function for both, achieving a statistically significant improvement of over 9% in f-score.
The principal contributions of this paper are threefold: (i) the adaptation and evaluation of a Siamese neural network designed to determine whether two facial images belong to the same cow and to classify cow face images within a predefined set of individuals; (ii) the development of a novel loss function tailored to optimize the network in few-shot learning scenarios; and (iii) an exploration of potential real-world applications of these techniques, extending beyond cattle to other domains.
2. Materials and Methods
2.1. Dataset
The dataset for Nelore cattle faces was collected in Campo Grande, Mato Grosso do Sul, Brazil, at the facilities of Embrapa Beef Cattle—CNPGC. The collection process involved capturing images of 47 Nelore breed cattle, comprising 20 males and 27 females. This was achieved using a GoPro5 camera mounted on a tripod positioned alongside the containment chute. The camera was strategically placed to ensure consistent and high-quality image capture of the cattle’s faces.
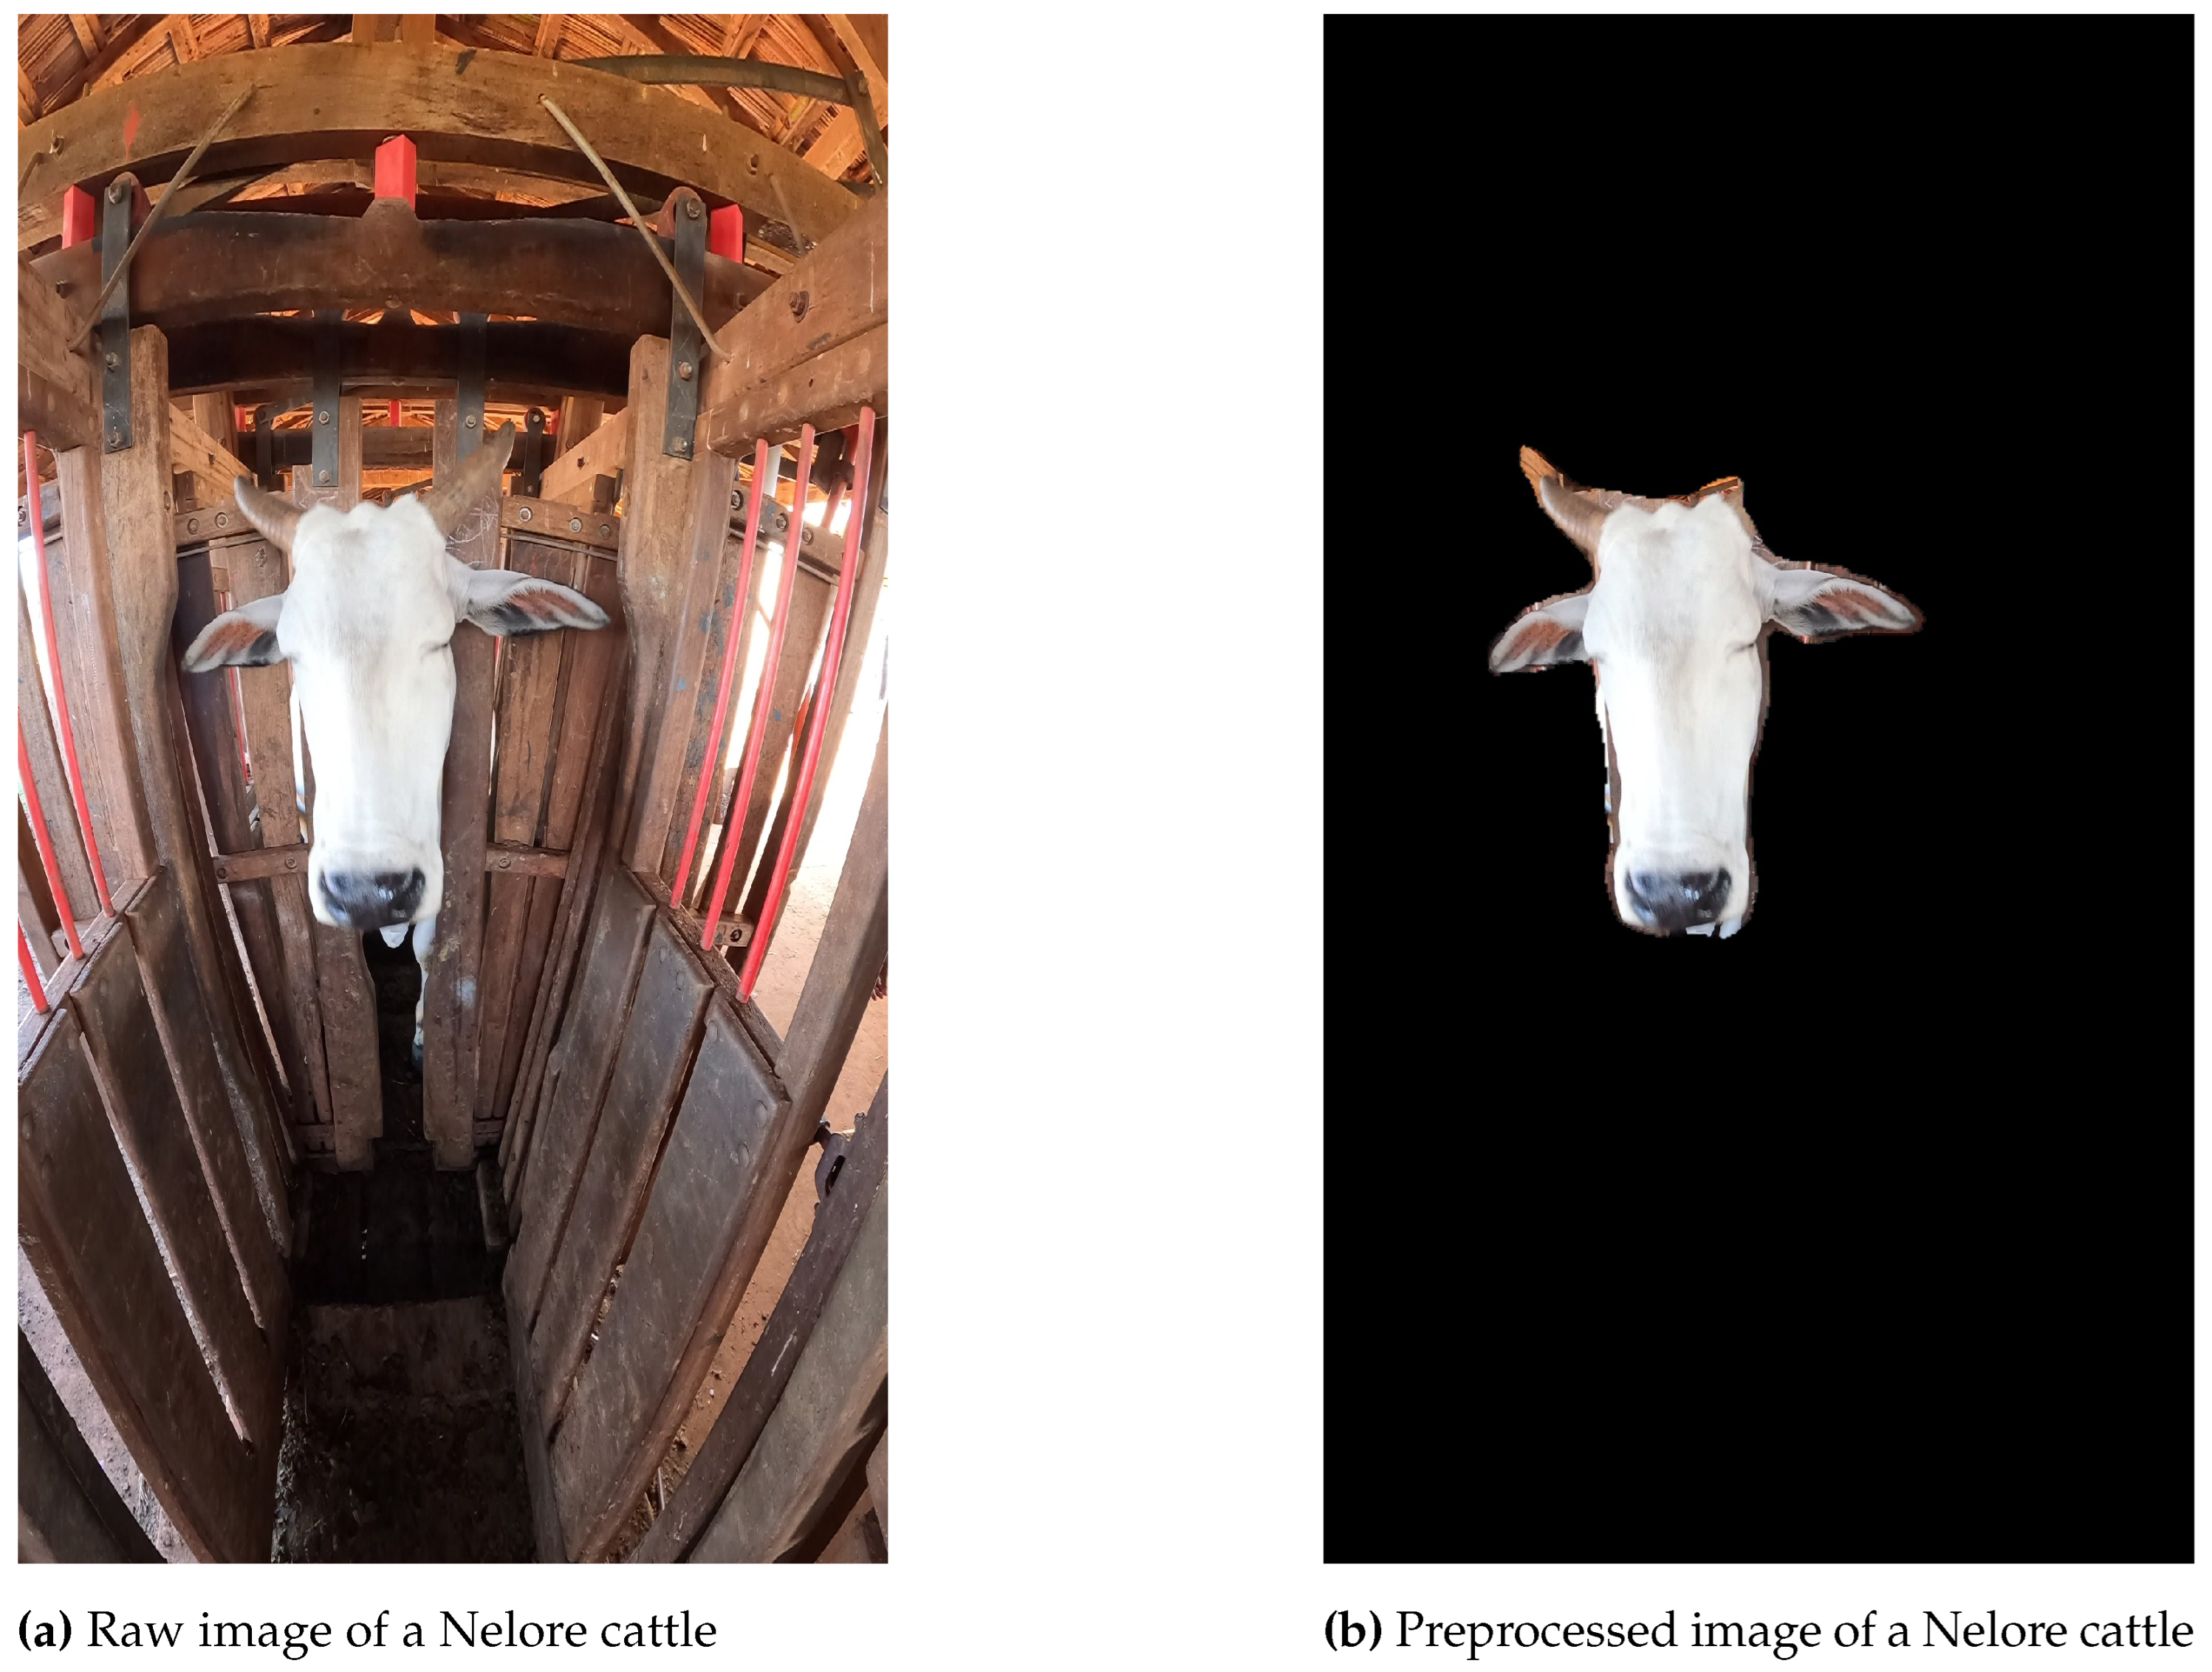
The resulting dataset comprises 2210 video frames, each meticulously separated and labeled according to the individual animal’s electronic cattle tag. To prepare the images for analysis, preprocessing was conducted to ensure only the faces of the cattle were visible, as shown in
Figure 1. A simple blob detection method [
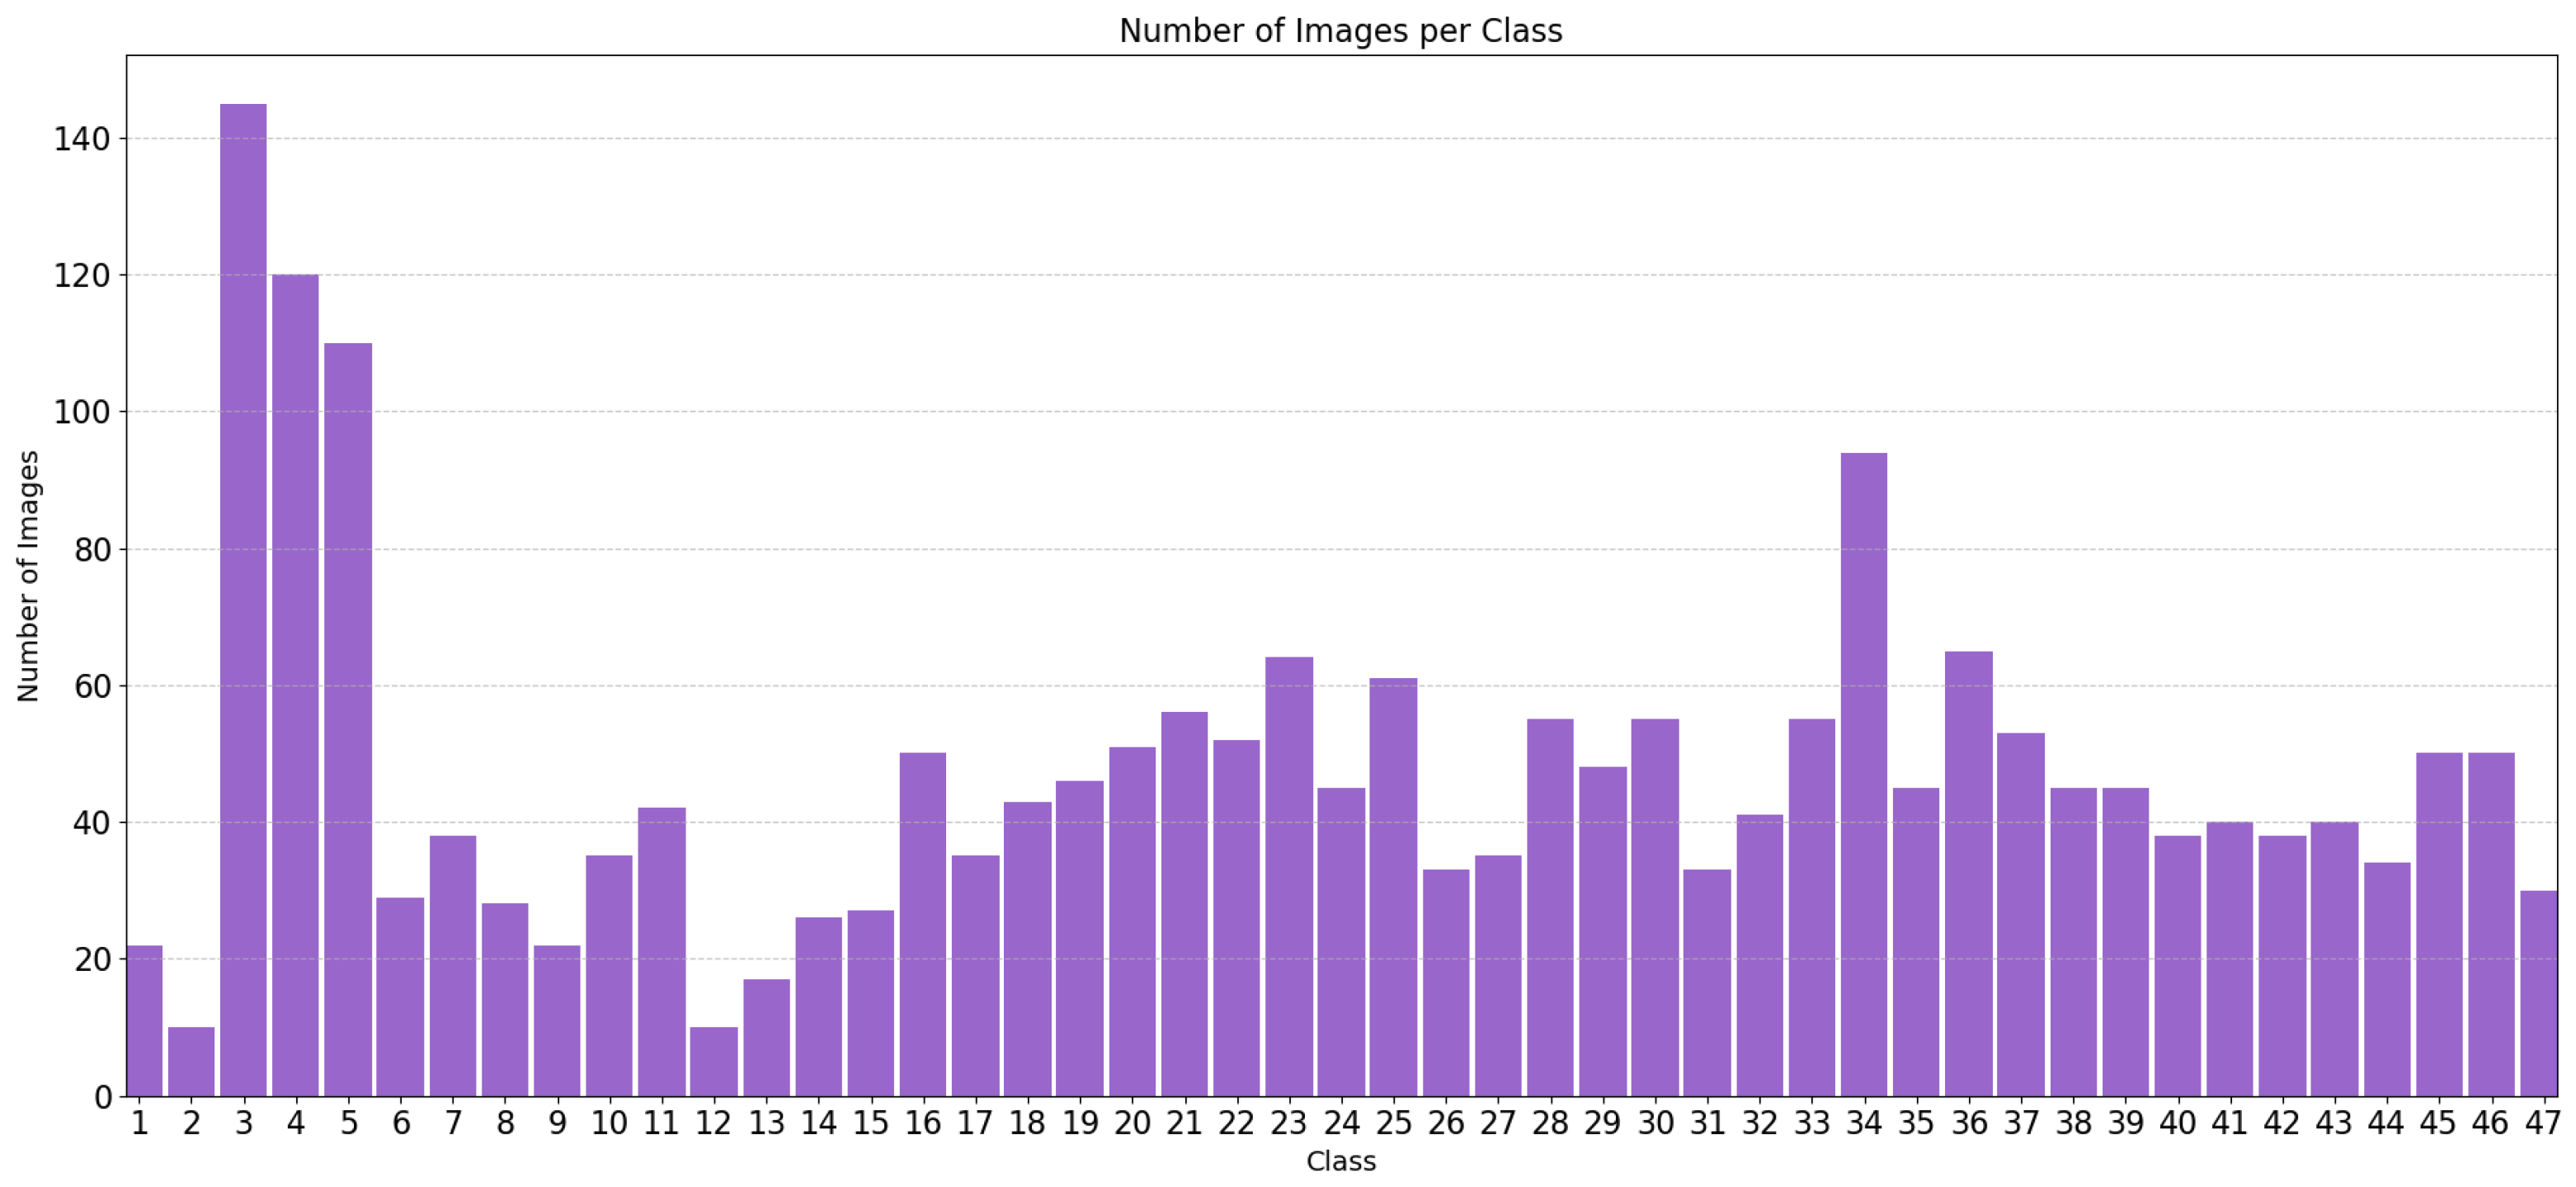
22] was then applied to remove any residual black areas from the initial cropping process. This thorough preprocessing and segmentation ensured the dataset was well-suited for further analysis and modeling, indirectly addressing negative variables such as data imbalance presented in
Figure 2 across different animals.
To ensure accurate analysis, it is essential to remove the background from cattle face images due to significant noise that can introduce unwanted artifacts into the dataset. In some cases, other animals in the background posed a significant problem during the initial iterations of the experiment. This preprocessing step is critical for isolating the primary facial features and the muzzle, which must be clearly visible for effective identification. Variations in the angles of the face can negatively impact the training process, as some facial features, such as horns, might be obscured. This underscores the need for consistent image alignment. Ensuring that every frame captures the animal looking at the camera at the correct angle with its eyes open is challenging. To address these variables, the structure used for capturing the images, depicted in
Figure 1a, was employed to minimize such variations and provide greater uniformity to the dataset construction.
2.2. Proposed Approach
Cao et al. [
23] proposed a two-phase training procedure for a Siamese neural network, which is the basis for the adaptation used in this work. In the first phase, a contrastive loss is applied to optimize the distance between the representations of two input images, which serves primarily for similarity recognition training, as presented in the original idea of the Siamese network by Koch et al. [
24].
In the second phase, a classification head is used and the network is optimized for classification. Within this framework, in our proposed approach, we separated the entire network into blocks according to their function: (i) the block of networks with shared weights, denoted as the backbone; (ii) the recognition layer, whose output is the Euclidean distance between representations, referred to as the recognition head; and finally, (iii) the classification head. The architecture is graphically presented in
Figure 3.
Since there are two distinct phases within each epoch, each phase has its associated loss function, optimizer, and hyperparameters. For the classification process, the loss can be calculated using a standard loss function, such as cross-entropy [
25], comparing the output of the classification head with a one-shot encoded array using the expected label as the index for this encoding. For the recognition training phase, however, a new loss function was created by modifying the standard contrastive loss function.
The standard contrastive loss function can be defined as follows. Let
be the feature extractor up to layer
l;
is an input image and
is an anchor image from the training set
;
is the Euclidean distance between the feature vectors from layer
l for two different images
and
;
is an arbitrary margin value that indicates the minimum distance that two representation vectors of images from different classes must have between themselves; and
, where
is the set of training labels relative to each pair of images (
,
), assuming values of 0 when the two images are of different classes or 1 when they are from the same; finally, let
m be the margin that defines the minimum distance that two vectors must have between them if they are from different classes with a default value of 1.25, as proposed by Cao et al. [
23] in the original implementation. Then, the standard contrastive loss function is defined as:
The custom contrastive loss function proposed in this work is an adaptation of Equation (
1), defined as:
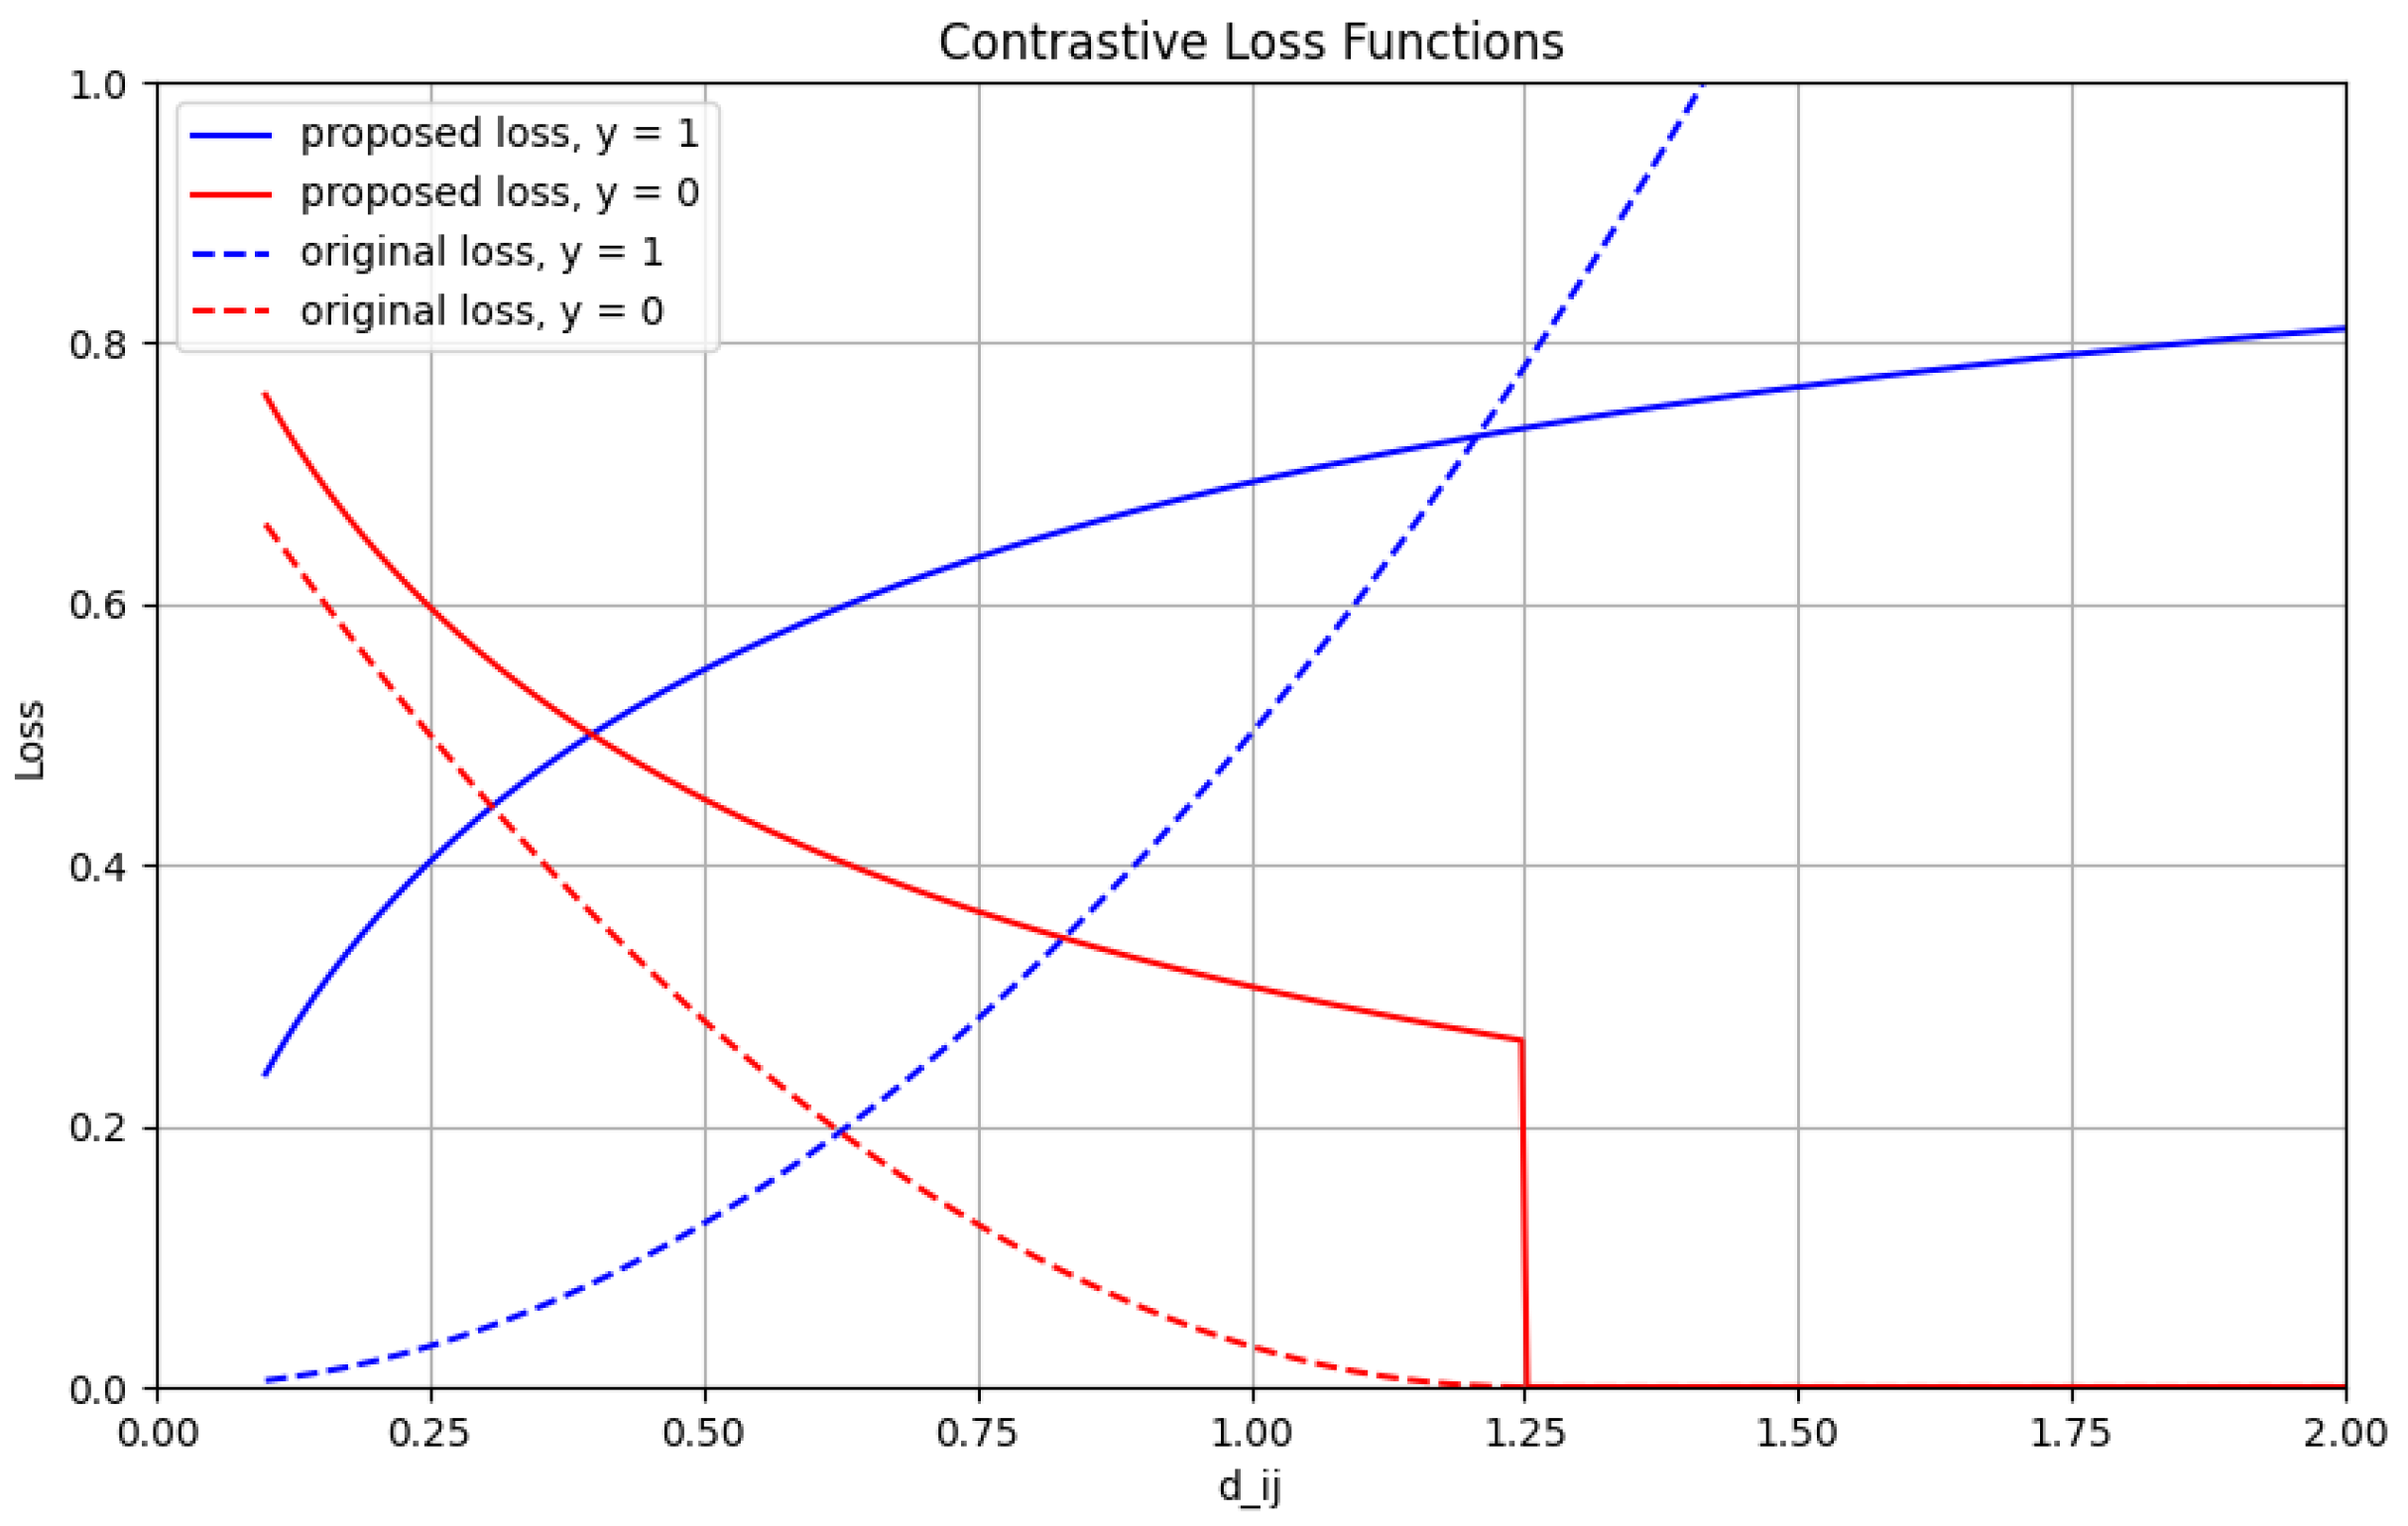
Above all, the modifications were made in order to improve the convergence of the error and to limit the loss values between 0 and 1, while keeping a contrastive behavior: the loss value for images of different classes quickly falls when the distance between representations increase, and the loss for images of the same class increases when the distance between the extracted feature vectors increases. Note that a small value of
indicates high similarity between patches, which is desirable for images of the same class. On the other hand, a large value of
indicates dissimilarity, essential for separating examples from different classes. Therefore, the loss function is designed to minimize the value of
for patches having the same class and maximize
for patches belonging to distinct classes, enabling the model to generalize from a limited number of examples and learn effective discriminative representations.
Figure 4 illustrates the behavior of the proposed loss function with a margin of 1.25. For positive labels, the loss approaches 1 as the distance increases, while for negative labels, the loss decreases towards 0 as the distance between different classes becomes larger, with the margin determining the threshold at which the distance between different classes is considered sufficiently big, resulting in a loss of 0.
2.3. Experimental Setup
Two experimental procedures were conducted: the first aimed to compare the new loss function with the original one within a Siamese architecture, and the second involved comparing the performance of this loss function with that of the backbone outside the Siamese structure, across scenarios with a full set of images and scenarios with limited samples. The experimental procedure employed a 10-fold cross-validation strategy. The ResNet101 [
26] was selected as the base network for the backbone due to its versatility in classification tasks and its capacity to capture residual information through its internal layers. This network has demonstrated exceptional performance in the works of Li et al. [
27], Xu et al. [
28], and Wang et al. [
29], establishing it as a reliable benchmark for comparative analysis in this experiment.
The original image dataset, comprising 2210 samples, was organized in two distinct configurations to assess the few-shot learning capabilities of the framework for the proposed task. Initially, the entire dataset was utilized, referred to as the “full dataset”. Subsequently, a few-shot scenario was created by randomly selecting ten samples per animal, termed the “few-shot dataset”. For both configurations, 10% of the images were designated for testing, while the remaining 90% were allocated for training and validation. The training and validation set was further divided, with 20% of the data used for validation within each fold.
In the first experiment, the effect of the new loss function, as defined in Equation (
2), on network performance was evaluated using the few-shot dataset. This new loss function was compared to the original loss function specified in Equation (
1). At the conclusion of each fold in this experiment, precision, recall, and F1-score metrics were computed to assess performance. Although these metrics are conventionally applied to binary classification problems, we addressed this limitation by employing a Macro-Averaged approach. This approach involves calculating each metric for individual classes separately, using a one-versus-all strategy.
In heavily imbalanced classification problems, such as those illustrated by the complete dataset (
Figure 2), accuracy can be deceptive and may not accurately represent the model’s performance on the minority class. Instead, precision, recall, and F1-score are more informative metrics. Precision measures the proportion of true positive predictions among all predicted positives, recall assesses the model’s ability to identify actual positives, and the F1-score combines these metrics to provide a balanced view of performance. These metrics are crucial in imbalanced scenarios, as they offer a clearer picture of how well the model performs on the minority class, which is often the class of primary interest in practical applications.
Equations (
3)–(
5) detail the calculations for the statistical measurements, where
N represents the total number of classes:
In these equations, denotes the number of true positives, or correctly predicted instances of class i; represents false positives, or instances incorrectly predicted as class i; and signifies false negatives, or instances of class i that were incorrectly predicted as another class.
After completing the initial comparison of loss functions, a subsequent experiment was undertaken to contrast the performance metrics derived from a standard ResNet101 model with those from a Siamese architecture. Specifically, we evaluated these metrics using the loss function that exhibited superior performance in the initial experiment—our proposed loss function. In this subsequent experiment, both datasets were employed to assess the impact of the Siamese framework on network performance for solving the facial recognition problem, with identical test measurements being computed as the first experiment.
Following the standard of the backbone used in this work [
23], all images were resized to 224 × 224 pixels and the ResNet was configured to output a 512-feature vector, serving as the input for both heads of the architecture. The optimizer for both experiments was set to AdamW with two different learning rates, using 0.001 for the classification task and a value of 1:20 proportional to this (0.00005) for the recognition task. To evaluate the loss in the classification process of both experiments, the cross-entropy function was chosen.
The training was performed in batches of 16 images. Neither data normalization nor augmentation techniques were used. In this process, a maximum of 1000 epochs was stipulated, with an early stopping patience of 10 epochs, for which the loss values were monitored in the validation procedure to reduce overfitting. To analyze the metrics gathered, three statistical methods were elected. The first was the analysis of the mean values with each standard deviation, with those values’ tables made: one for the comparison between the two contrastive functions and another comparing the plain ResNet with the Siamese adaptation for both dataset scenarios.
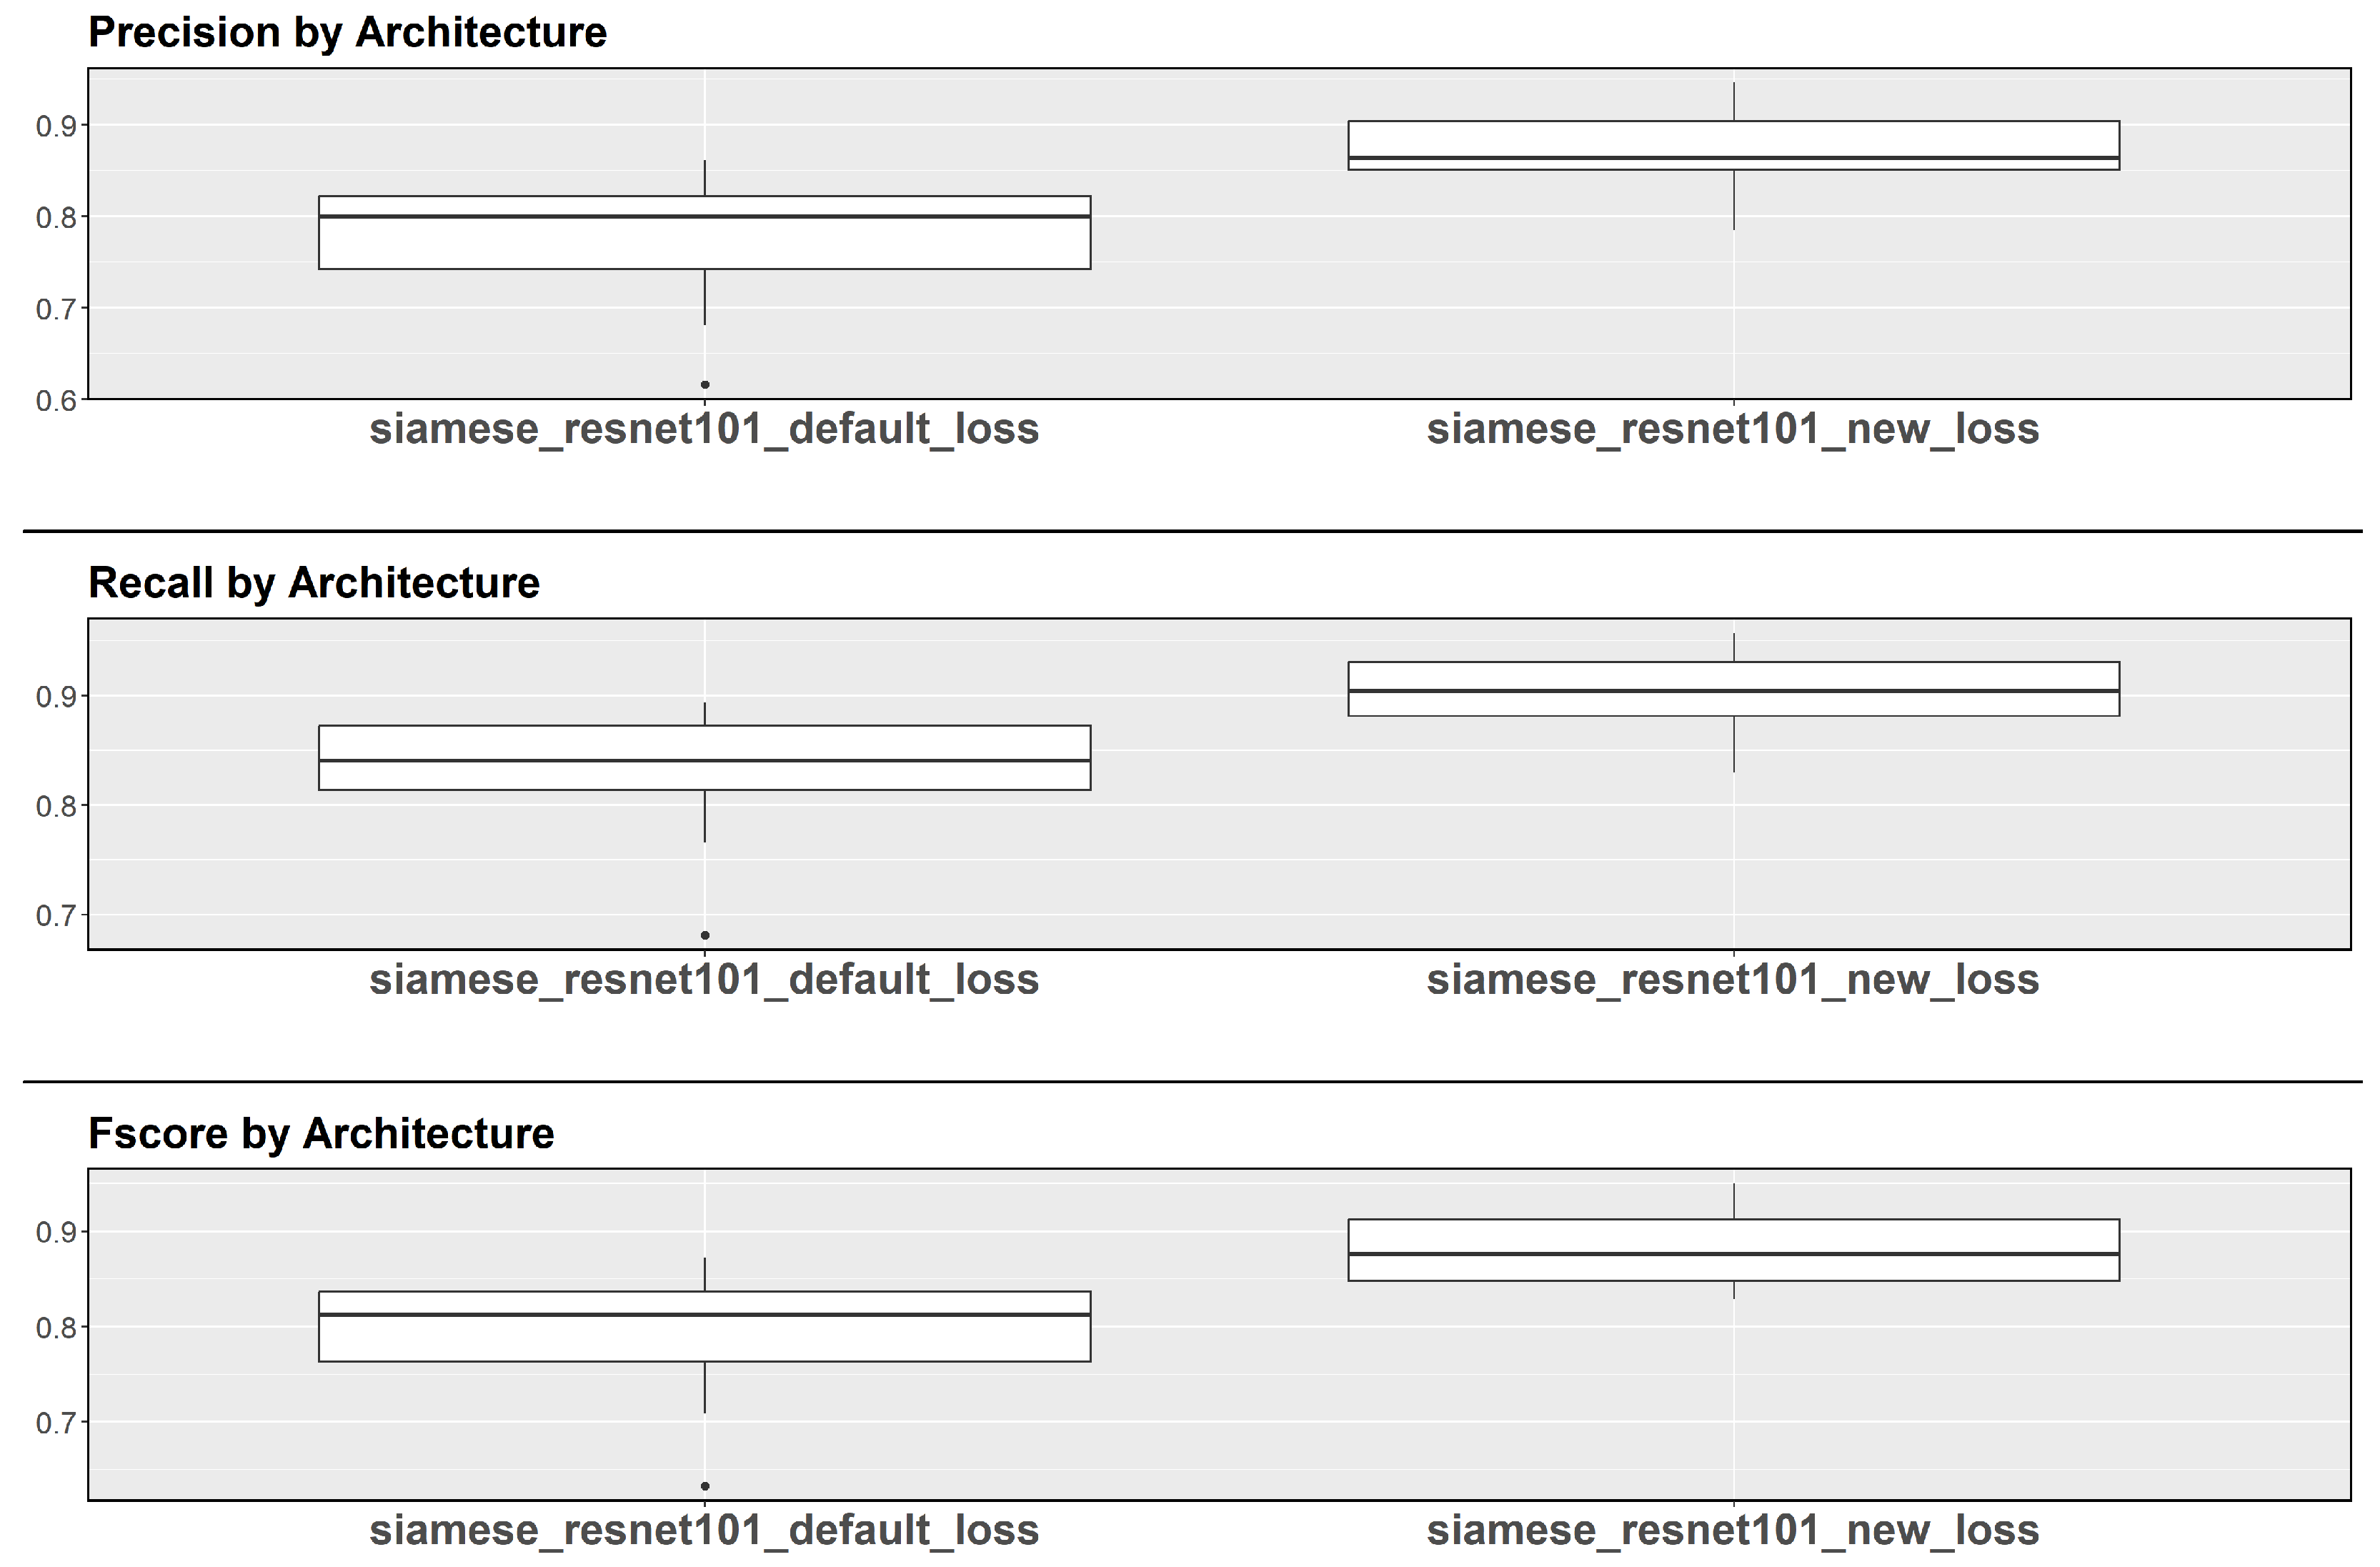
The second statistical analysis method utilized was the boxplot diagram. Each experiment was accompanied by its own boxplot diagram, providing a visual depiction of the distribution of values across each fold for every metric. These diagrams offer insights into the uniformity of the data, showcasing the Interquartile Ranges (IQRs) and the medians, thus enabling a clear understanding of the data’s spread and central tendency. Lastly, the third method involved analyzing variance (ANOVA) complemented by TukeyHSD post-hoc tests, both conducted at a significance threshold of 5%.
3. Results
During the analysis of mean values and standard deviations for each metric in the first experiment, as demonstrated in
Table 1, a notable trend emerges. Comparing the default contrastive loss with the proposed alternative presented in this paper, it becomes evident that the latter consistently yields higher results across all metrics with a numerical increase of 0.096, 0.075, and 0.091 for precision, recall, and F-score, respectively, accompanied by lower deviations. This pattern suggests a promising avenue for enhancing performance through the adoption of the new loss function.
Building upon the trends delineated by the table of mean values,
Figure 5 illustrates the performance enhancement visually. The boxplots for the new loss function not only exhibit higher median values, but also demonstrate narrower interquartile ranges, corroborating the findings of reduced deviations observed earlier. Additionally, the application of an ANOVA test for the different loss functions revealed statistically significant disparities, with values of
,
, and
for precision, recall, and F-score, respectively.
Based on the outcomes of the second experiment,
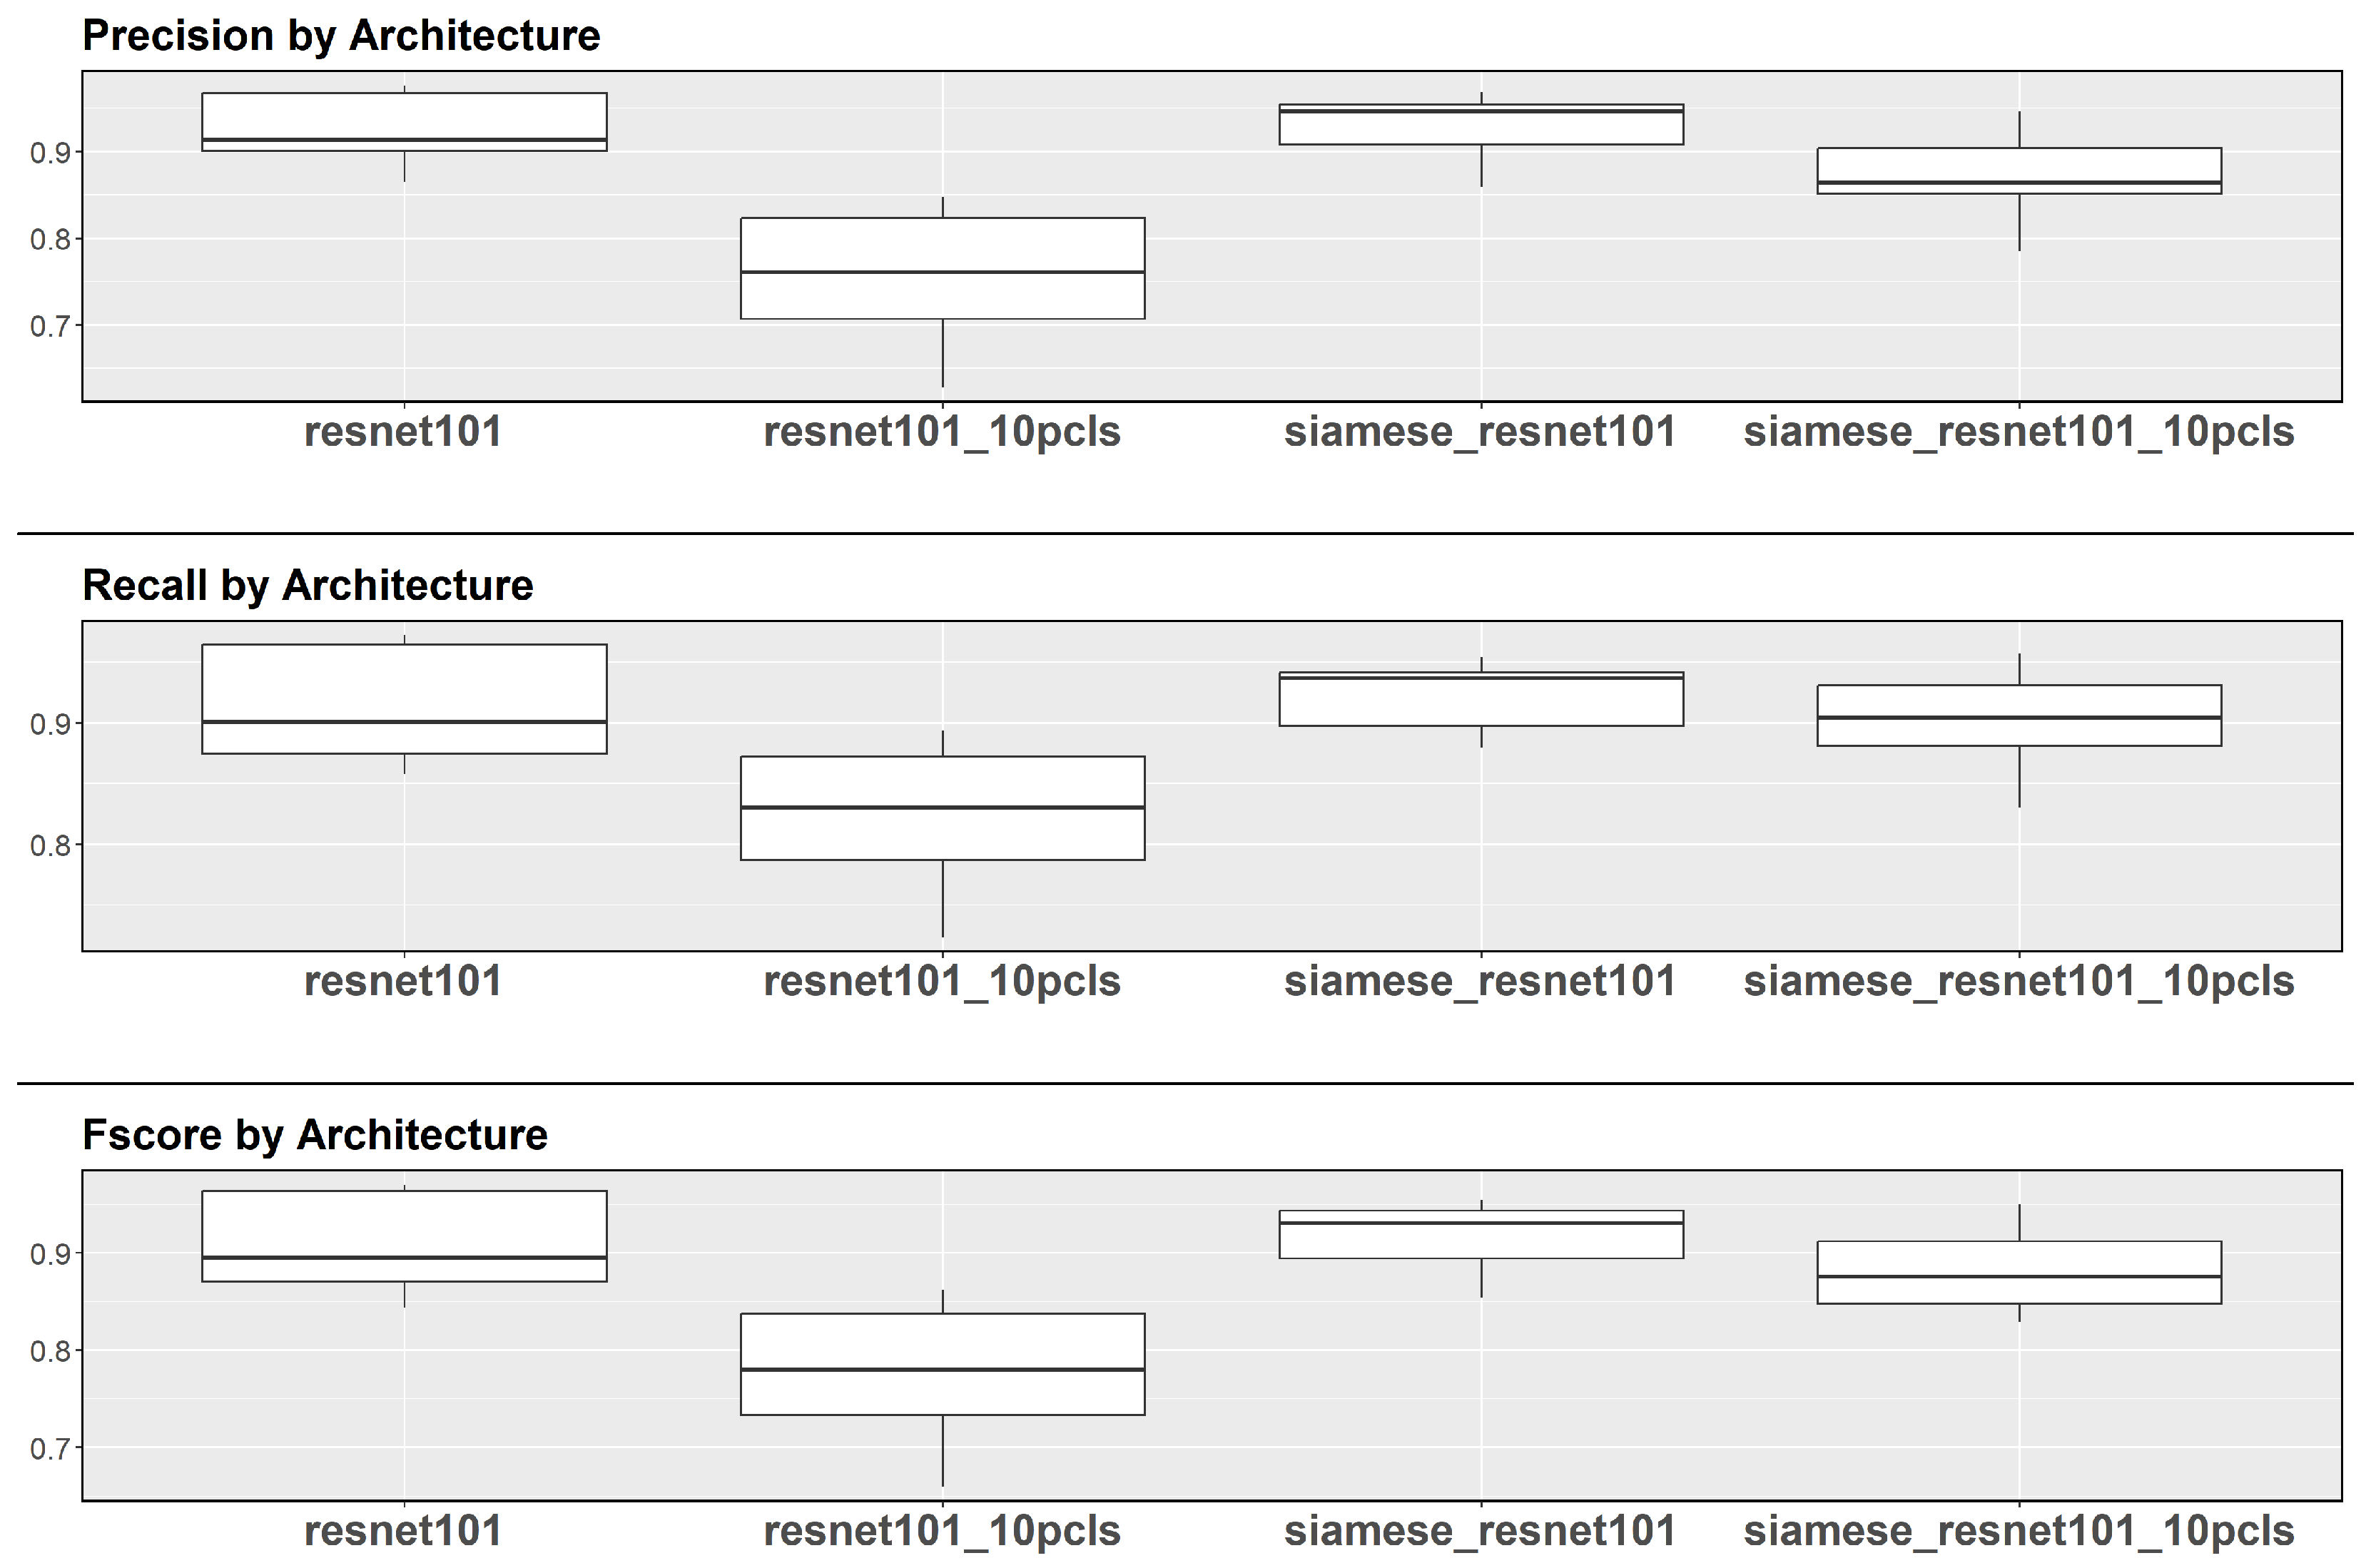
Table 2 delineates the average results across the 10 executed folds alongside their corresponding standard deviations for both datasets. Notably, the Siamese execution showcases average values surpassing those of the original ResNet across all three metrics in both scenarios, with a margin of 0.006 for precision and 0.01 for both recall and F-score for the full dataset one. Furthermore, the Siamese architecture exhibits smaller standard deviations, indicating a more consistent distribution of results around the mean value. The same table shows similar results for the few-shot dataset, which simulates a 10-shot learning context, with a margin of 0.11 for both precision and F-score and 0.08 for recall. One can see that the Siamese architecture consistently showed an increase in average values and a reduction in standard deviation when compared to the plain ResNet101 network, similar to the execution with the complete dataset.
In
Figure 6, the boxplots compare the performance of Siamese ResNet 101 and standard ResNet 101 across all four executions, using datasets labeled “10pcls” to indicate the 10-shot version employed for the few-shot evaluation. Consistent with the trends delineated in
Table 2, it becomes apparent that the adoption of a Siamese architecture confers enhancements, particularly evident when operating with smaller datasets. Whereas the baseline network experiences pronounced susceptibility to the limited training data, the Siamese methodology preserves elevated performance levels with minimal variance, notwithstanding a reduction in absolute metrics, as evidenced by the trends in median values and interval magnitudes.
The ANOVA and TukeyHSD results were similar for all three metrics. There was no evidence of a statistically significant difference between the ResNet101 trained with the full dataset and the Siamese networks, both with the few-shot dataset (, , and for precision, recall, and F-score, respectively) and with the full dataset (, , and for precision, recall and F-score, respectively). Also, there is no evidence that the Siamese networks differed when the dataset was downscaled (, , and for precision, recall, and F-score, respectively). On the other hand, the dataset downscaling did seem to make a difference for the plain ResNet101 (, , and for precision, recall, and F-score, respectively). Finally, the ANOVA and TukeyHSD results were significant for the ResNet101 trained with the few-shot dataset, both regarding the Siamese network trained with the same few-shot dataset (, , and for precision, recall, and F-score, respectively) and regarding the one trained with the full dataset (, , and for precision, recall, and F-score, respectively).
4. Discussion
The ANOVA and TukeyHSD results, as well as the boxplots suggest that the Siamese framework did, in fact, improve the capacity of the neural network in the proposed few-shot learning scenario. An interesting factor to note in this test is that both the execution with the full dataset and the one with the reduced dataset using the Siamese approach did not show any statistical difference. The same occurs when comparing the base backbone with the complete dataset with the two Siamese executions; for all these cases, the p-values were above the significance level of 0.05. From these data, it can be inferred that the variation in the amount of data for training significantly affects the backbone, while the Siamese model does not show the same variation. Furthermore, given the ANOVA results presented, the Siamese network trained in a 10-shot scenario can be considered equal in performance to the plain ResNet101 trained with the full dataset, which indicates the feasibility of using it in the scenario where data are scarce.
The results we achieved in the task of identifying individual cattle align with those found in the literature. While this paper does not focus solely on muzzle recognition like the works of Li et al. [
11] and Shojaeipour et al. [
12], which have achieved accuracy results of around 99%, it follows the line of study presented by Xu et al. [
21]. Our study focuses on the use of whole-face images and achieves a similar result, with an accuracy value of 91.3%.
The presence of the recognition branch in the process is of great importance, as it helps reduce confusion between classes by altering the distances between the feature vectors extracted in the embedding space. This positive point has been found to be highly relevant for problems with few samples in the works of Chen et al. [
30] and Chen et al. [
31], where the idea of separation is reinforced as a differentiating factor when analyzing samples not seen during model training and validation. This allows the formation of pseudo-regions in this space, speeding up the classification process based on the distance between the known data and the new data inserted into the model.
In the same context, Wang et al. [
32] demonstrate in their work how the definition of themes through this contrastive separation aids in the performance of few-shot models for the classification scenario, both with few samples and in the presence of many in various datasets, portraying a scenario similar to the one presented in
Section 3, with the neural network adapted for few-shot learning maintaining a similar behavior in the presence of datasets with varying numbers of samples.
An important point that favors learning from a few samples using this twin network approach is the distribution of data during training, as discussed by Zhang et al. [
33]. Even in the presence of little data, it is still possible to obtain a robust training dataset through the formation of positive and negative pairs, which expands the amount of samples that the network can learn, in terms of similarity and distance between attribute vectors.
Still on the topic of improving learning with reduced datasets, a significant facilitator present in the architecture is the presence of easily modifiable backbones, which allows for the use of transfer learning to initialize their learned weights, reducing the time needed for the network to acquire minimum knowledge and start understanding the most basic parts of the objects of interest. Similarly, Yi et al. [
34] demonstrated this capability in their work by using Faster R-CNN [
35] to solve their surface roughness detection problem.
Finally, it can be observed that the dual learning structure proposed initially by Cao et al. [
23] and adapted for the bovine problem in this article is of great importance for the final result. In their paper, Yu et al. [
36] adopted a similar methodology in the Augmented Feature Adaptation layer of their model, learning to distance the classes from each other according to the features extracted by their Augmented Feature Generation layer and similar ways to measure loss.
Although the results obtained for the three metrics indicate promising future possibilities for using the loss function, especially in few-shot scenarios, its advantages over other loss functions remain debatable. By analyzing the works of Ni et al. [
37] and Wang et al. [
38], which employ the triplet logic introduced by Schroff et al. [
39], it becomes evident that one common method to enhance the performance of the original contrastive loss function is by increasing the number of samples processed simultaneously. This approach, concerning a minimum separation margin similar to the function presented in this paper, can improve statistical metrics. However, it significantly raises the operational cost in terms of memory, as the network needs to perform many more comparisons in each iteration to determine and recalculate inter-class and intra-class distances.
This increase in the number of samples used per iteration is directly proportional to the heightened difficulty of loss convergence, as indicated by Wu et al. [
40]. With this in mind, the proposed loss function aims to achieve the improvements sought by these loss functions without increasing the sample size. This approach maintains the original complexity while promoting the convergence of loss values, as illustrated in
Figure 4 in
Section 2. In summary, this study introduces new possibilities for enhancing the contrastive loss function without directly increasing memory usage during training, while preserving the overall architecture structure with image pair analyses.
5. Conclusions
The results obtained in this study allow us to argue that Siamese networks can become a viable option for improving the performance and increasing the robustness of traditional classification models like ResNet101 in the face of data scarcity, since its performance on 10-shot learning was observed to be on par with that of the ResNet101 trained in the entire dataset. On the other hand, it presents more computational requirements in terms of space and time. Therefore, future research can focus on optimization, with the aim to reduce these requirements while keeping or improving the achieved performance.
In the section on future work, the hypothesis of incorporating age as a variable in the recognition process has been raised. Over time, the facial structure of each animal becomes increasingly distinguishable, with its snout exhibiting morphological features similar to a human fingerprint. Therefore, it can be inferred that future studies utilizing a dataset with age variability among the individuals may yield positive results in the learned weights during training.
Regarding the applicability of the architecture in real-world scenarios, it has proven effective in performing the expected function, thereby reducing the need for manual classification at the experimental sites. Based on the described results, it is plausible to consider developing a product for large-scale use, not only for cattle, but also for other areas of animal husbandry where individuals have distinctive facial features that allow for differentiation using this method. This is an important task due to the large number of animals on each farm and the need for precise, non-intrusive tracking. Such a system would enhance the quality of the classification process and provide valuable information for management.
