Abstract
Rice is cataloged as one of the most widely cultivated crops globally, providing food for a large proportion of the global population. Integrating Geographic Information Systems (GISs), such as unmanned aerial vehicles (UAVs), into agricultural practices offers numerous benefits. UAVs, equipped with imaging sensors and geolocation technology, enable precise crop monitoring and management, enhancing yield and efficiency. However, Peru lacks sufficient experience with the application of these technologies, making them somewhat unfamiliar in the context of modern agriculture. In this study, we conducted experiments involving four distinct rice varieties (n = 24) at various stages of growth to predict yield using vegetation indices (VIs). A total of nine VIs (NDVI, GNDVI, ReCL, CIgreen, MCARI, SAVI, CVI, LCI, and EVI) were assessed across four dates: 88, 103, 116, and 130 days after sowing (DAS). Pearson correlation analysis, principal component analysis (PCA), and multiple linear regression were used to build prediction models. The results showed a general prediction model (including all the varieties) with the best performance at 130 days after sowing (DAS) using NDVI, EVI, and SAVI, with a coefficient of determination (adjusted-R2 = 0.43). The prediction models by variety showed the best performance for Esperanza at 88 DAS (adjusted-R2 = 0.94) using EVI as the vegetation index. The other varieties showed their best performance using different indices at different times: Capirona (LCI and CIgreen, 130 DAS, adjusted-R2 = 0.62); Conquista Certificada (MCARI, 116 DAS, R2 = 0.52); and Conquista Registrada (CVI and LCI, 116 DAS, adjusted-R2 = 0.79). These results provide critical information for optimizing rice crop management and support the use of unmanned aerial vehicles (UAVs) to inform timely decision making and mitigate yield losses in Peruvian agriculture.
Keywords:
multiple regressions; remote sensing; precision agriculture; RPAS; drones; San Martin; Oriza sativa 1. Introduction
Rice cultivation is a major global food resource, providing food for over 3 billion people [1]. Consequently, the accurate prediction of rice grain yield has become an invaluable tool for precision management, decision making, and strategic marketing to meet the ever-increasing market demand [2]. In agriculture, crop yield is influenced by a wide range of factors, broadly classified as abiotic (environmental, climatic, and geological), biotic (interacting with living things), and intrinsic (variety, genetic, and resistance). Traditionally, yield estimation is carried out using destructive techniques, which are labor-intensive, expensive, and highly data-uncertain [3].
In the current agricultural scenario, the integration of remote sensing technologies provides a significant advantage in building predictive models for crop yield estimation. These models allow the monitoring of crucial parameters such as chlorophyll content [4], fresh biomass [5], plant height [6], and other parameters of interest. The compilation and analysis of these parameters allow informed decisions to be made in a timely manner. This is particularly important in crop management to detect pests, diseases, or nutrient deficiencies early on to prevent potential yield losses. The use of advances in remote sensing technologies not only improves our understanding of crop development but also provides practical insights for refining agricultural methods and ensuring global food security [7].
The use of Geographic Information System (GIS) data obtained from technologies such as satellites, unmanned aerial vehicles (UAVs), and other georeferenced information devices [8,9], combined with the use of multispectral imagery, has the potential to increase the monitoring frequency and spatial resolution of image data [10]. The calculation of vegetation indices (VI) from multispectral imagery has become indispensable in the development of effective models for predicting crop yield or monitoring various agricultural parameters. The normalized difference vegetation index (NDVI) is the most commonly used index for the development of crop yield prediction models. However, reliance on NDVI alone has some limitations, as its utility is mainly relevant during the vegetative stage, but often loses sensitivity during the reproductive stage, making accurate prediction models across different crop phenological stages challenging [11,12]. Consequently, the use of other VIs offers distinct advantages for different crop stages, such as the Visible Atmospheric Resistance Index (VARI), which showed a better yield prediction model than NDVI for the flowering stage of rice [2]. Therefore, the combination of different VIs can more efficiently predict yield for different stages [13]. Studies related to rice cultivation have been carried out to develop yield prediction models using different VIs at different phenological stages of rice [14], fertilizer management of the crop [15], or the combination of VIs with other parameters to improve the model performance [16]. In addition, machine learning models have also been studied to predict yield using different VIs, climatological characteristics, and different supervised machine learning algorithms as variables to obtain the best model performance [17,18,19].
On the other hand, precision agriculture is an emerging technology in Peru with the potential to optimize agricultural practices by saving economic and time resources. Rice production in Peru is significant, covering almost 400,000 hectares distributed in the coastal, Andean, and Amazonian regions [20]. In particular, the San Martín region contributes 22% of the national production [20]. In addition, the Ministry of Agriculture and Irrigation is actively investing in the development of appropriate rice crops by creating more resilient varieties adapted to specific environmental conditions in different regions [21].
Assessing the yield of local commercial rice varieties using multispectral imagery provides an opportunity to improve rice production systems. This study aimed to (1) establish correlations between different vegetation indices (VIs) derived from unmanned aerial vehicle (UAV) multispectral imagery; (2) develop yield prediction models to assess the performance of different rice varieties. This technological approach is expected to optimize resource allocation and improve the efficiency of agricultural production, especially in research focused on refining crop management practices.
2. Materials and Methods
2.1. Site Description
This study was conducted at the Estacion Experimental Agraria El Porvenir of the Instituto Nacional de Innovación Agraria (INIA), located in the district of Juan Guerra, province and department of San Martín (6°35′42.42″ °S, 76°19′13.75″ °W, 206 masl) (Figure 1). The rice cultivation period lasted 135 days, planting in the seedbed on 23 March and harvesting on 4 August 2023. Meteorological data were provided by Servicio Nacional de Meteorología e Hidrología del Perú (SENAMHI), indicating a mean maximum and minimum temperature of 31.9 °C and 21.7 °C, respectively; a mean precipitation of 2.9 mm; and a mean humidity relative of 58.39% during the experimental period, more details about the climatological characteristics are shown in Figure S1. The soil characteristics are represented as clay soil, with an electrical conductivity of 39.4 mS/m, pH of 7.6, organic matter of 6.9%, and NPK content of 0.32%, 15.32 mg/kg, and 476.55 mg/kg; respectively. The experimental design employed split plots within a randomized complete block design, incorporating four rice varieties (Capirona, Conquista Certificada, Conquista Registrada, and Esperanza) and subplots featuring two cultivation systems (cordel and traditional). Each experimental plot, replicated six times (n = 24), covered a total area of 30 m2 for each variety. The selection of these varieties was based on their adaptability to the tropical climate, including resistance to pests and diseases, and high productivity. In terms of agronomic management related to fertilization, doses of 120 kg/ha of N, 69 kg/ha of P, and 150 kg/ha of K were applied for all the varieties.
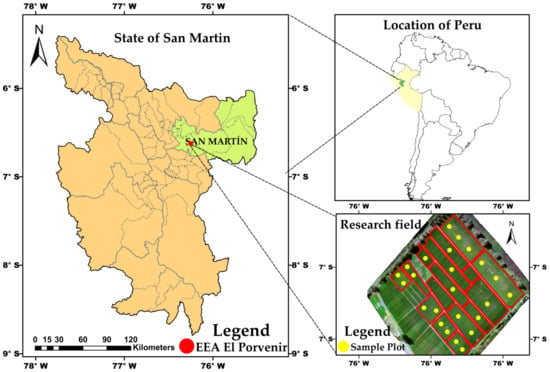
Figure 1.
Location of the experimental area in the El Porvenir Experimental Center in San Martin, Peru.
2.2. Chlorophyll Content Determination
Chlorophyll content measurements were taken using the SPAD equipment (SPAD-502, Minolta Co, Osaka, Japan) on three dates: 88, 103, and 116 days after sowing (DAS). Vigorous and undamaged leaves were selected for the measurements. Fifteen rice plantlets were measured for each experimental plot.
2.3. Yield Determination
The yield was determined by four components: NP: number of panicles, NGP: number of grains per panicle, NGF: percentage of fertile grains, and W: weight of 1000 grains at 14% RH [22]. All the parameters were evaluated per square meter.
Briefly, the number of panicles was measured by counting the total number of panicles found within a square meter. The number of grains per panicle was assayed using Equation (1).
NGP = Total of grains/Total number of panicles
The percentage of fertile grains was determined by placing a hundred grains in water, with floating grains considered non-fertile. They were measured using Equation (2).
NGF = (Number of fertile grains/Number of total grains) × 100
The weight of 1000 grains at 14% RH was measured using an analytical balance. Finally, the yield was calculated using Equation (3).
Yield = (NP × NGP × NGF × W)/1000
2.4. Flight Plan and Indices Vegetation Estimation
Multispectral images were obtained using a UAV, DJI Matrice 300-RTK, equipped with Micasense-RedEdge-P multispectral sensor camera (MicaSense, RedEdge, NC, USA), with spectral bands including blue (475 nm), green (560 nm), red (668 nm), red edge (717 nm), and near-infrared (NIR, 842 nm), each with a 1.6 MP shutter. Images were taken on four dates, two of which correspond to the reproductive stages of 88 DAS (panicle development) and 103 DAS (flowering), and the other two to the maturation stages of 116 DAS (dough stage) and 130 DAS (ripening), all under sunny conditions, between 11 am and 2 pm.
The flight plan was executed using the DJI Pilot 2 application, with 80% frontal and lateral overlap, at a height of 50 m, and a speed of 4.5 m/s. The camera was directed perpendicularly towards the ground, facilitating a resolution of 2.08 cm/pixel for each pixel in the multispectral images. These images were further processed for georeferencing and brightness correction, utilizing calibration and radiometric correction procedures in Pix4Dmapper (V4.5.6, Pix4D SA, Prilly, Switzerland), culminating in the creation of an orthomosaic.
The radiometric calibration process encompassed three steps: (i) the creation of a point cloud, (ii) digital surface model (DSM) mapping, and (iii) orthomosaic creation for calculating vegetation indices (VIs). For the radiometric calibration of the multispectral images, the reflectance calibrator panel and a DLS 2 light sensor with built-in GPS (Automatic Calibration Panel Detection for MicaSense) that adjusts the readings to ambient light were used [23]. The resulting multispectral image was RGB (visible) in the TIFF format with a high resolution of 2.1 cm/pixel. The VIs were estimated within the rice canopy area, which was previously extracted through spatial mask extraction processing in ArcGIS 10.8. Table 1 provides an overview of the VIs evaluated during the study period, while Figure 2 outlines the framework of this study.
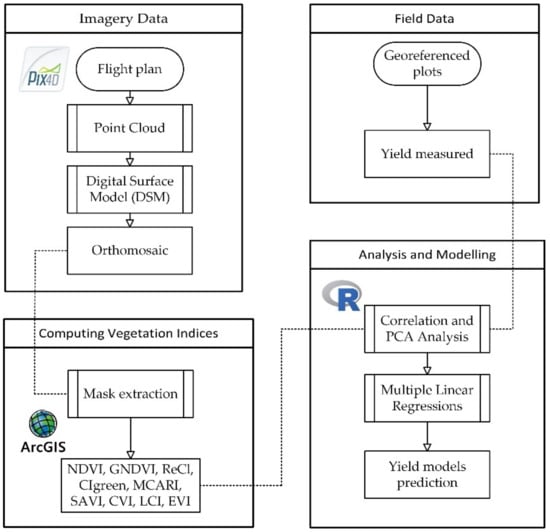
Figure 2.
Flowchart of the methodology framework.
2.5. Data Analysis and Model Development
The measured variables in the study were evaluated for normality and homogeneity using Shapiro–Wilk and Levene’s tests, respectively. Once the assumptions were verified, an analysis of variance (ANOVA) was performed to determine the presence of significant differences among the rice varieties and system culture with respect to yield. When there was a difference, the Tukey test (p < 0.05) was used, and for performing these analyses, the agricolae package was used [24]. With the data over time, box plot graphs were constructed over the four dates for each VI in the experiment to observe the variability. Pearson correlation was performed among the yield and different VIs. Analysis correlation was performed for each evaluated date and for each rice variety using package stats and GGally [25]. We conducted a principal component analysis (PCA) to determine the most significant index for predicting yield and the variations between each VI and rice variety over time using the packages factoMineR [26] and factoextra [27]. For the development of performance prediction models, multiple linear regression was used. All the analyses were running on R project v4.3.1 [28].

Table 1.
Vegetation indices applied for this study.
Table 1.
Vegetation indices applied for this study.
| Indices | Equation | Source |
|---|---|---|
| Normalized Difference Vegetation Index (NDVI) | [29] | |
| Green Normalized Difference Vegetation Index (GNDVI) | [30] | |
| Red Edge Chlorophyll Index (ReCL) | [31] | |
| ChlorophyII Index Green (CIgreen) | [31] | |
| Modified Chlorophyll Absorption in Reflectance Index (MCARI) | [32] | |
| Soil Adjusted Vegetation Index (SAVI) | [33] | |
| ChlorophyII Vegetation Index (CVI) | [34] | |
| Leaf Chlorophyll Index (LCI) | [35] | |
| Enhanced Vegetation Index (EVI) | [36] |
3. Results
3.1. Yield for Different Rice Varieties
ANOVA analysis indicated significant differences among rice varieties in yield (F-value = 3.853, p < 0.05) (Figure 3). The highest value was obtained by the variety Esperanza (8.36 ± 1.08 t/ha), which differs significantly from the variety Conquista Registrada, the same way this variety expresses the lowest values on yield with 6.58 ± 1.30 t/ha. The varieties Capirona (7.15 ± 0.67 t/ha) and Conquista Certificada (8.00 ± 0.88 t/ha) did not show any differences with the other varieties. On the other hand, the cultivation system for rice, traditional and cordel systems, expressed no significant difference in yield (F-value = 0.184, p > 0.05) (Figure S2).

Figure 3.
Comparison of the yield of the different rice cultivars. Different letters indicate significant differences according to the Tukey test (p < 0.05).
3.2. Chlorophyll Content
The chlorophyll values exhibited a declining trend throughout all the evaluated dates for the majority of cultivars, with the exception of the Esperanza variety, where the chlorophyll content demonstrated an increasing trend over the course of the observation period. This behavior is considered typical for this specific variety (Figure 4).
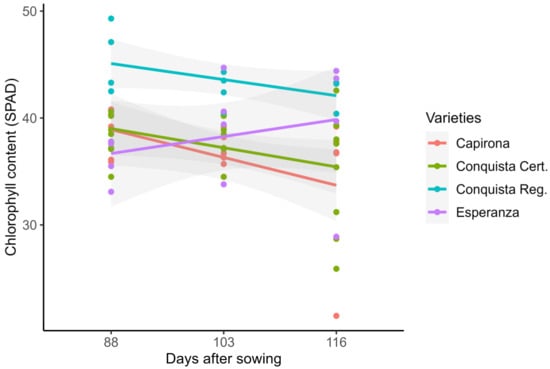
Figure 4.
Evaluation of chlorophyll content for all rice cultivars in different DAS.
3.3. Vegetation Indices Estimation
The vegetation indices exhibited a consistent decreasing trend throughout the evaluated days for all the rice varieties as NDVI (Figure 5), except for LCI (Figure S3). Notably, at 130 DAS, LCI displayed an increasing trend, reaching values higher than those recorded at 103 and 116 DAS (Figure 6). A significant difference was observed among most indices across the evaluated days. However, CVI showed significant differences solely at 130 DAS, and the EVI, MCARI, and SAVI indices exhibited differences at 116 and 130 DAS (Table 2). It is noteworthy that LCI showed a significant difference among 103 and 116 DAS, whereas no significant difference was evident between 88 and 130 DAS. This lack of significant difference at the latter time point may be attributed to the increased chlorophyll content observed in the Esperanza variety during the last evaluated date.
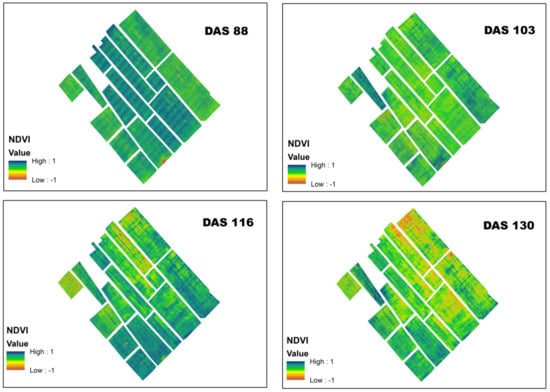
Figure 5.
Normalized difference vegetative index (NDVI) for four dates evaluated in rice crop.
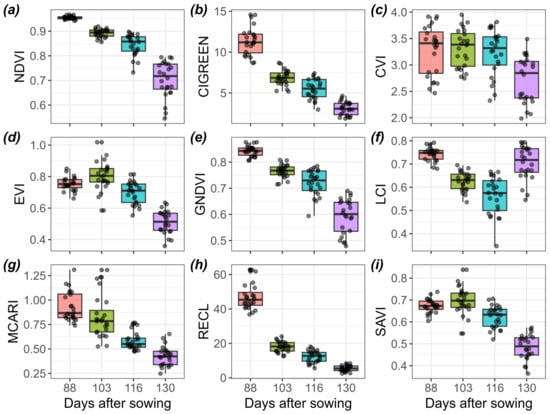
Figure 6.
Vegetation indices at different evaluated days. (a) NDVI, (b) CIGREEN, (c) CVI, (d) EVI, (e) GNDVI, (f) LCI, (g) MCARI, (h) RECL, and (i) SAVI estimated by multispectral images from UAV for all rice cultivars.

Table 2.
Means of vegetation indices in the different evaluated days.
3.4. Prediction Model to Determine Crop Yields
The Pearson correlation results showed a low correlation between rice yield and vegetation indices for all the days evaluated, with no significant values (p < 0.05) (Table 3). When examining the different rice varieties, the Pearson correlation between the yield and vegetation indices showed a significant correlation only for the varieties Conquista Registrada and Esperanza. Conquista Registrada showed a direct correlation with CVI (0.815 *) at 116 DAS, an inverse correlation with MCARI (−0.857 *) at 103 DAS, and another inverse correlation with CVI (−0.873 *) at 130 DAS; this variety showing an inverse correlation for all the indices at 103 DAS. Esperanza only showed a significant correlation with EVI, LCI, and SAVI at 88 DAS with 0.976 ***, 0.820 *, and 0.971 **, respectively. The varieties Capirona and Conquista Certificada showed direct correlations for most of the indices and DAS, but without significant values (Table 4). The Pearson correlations between the yield and VIs at different DAS are shown (Figures S4–S7).

Table 3.
Pearson correlation of vegetation indices with rice yield for each evaluated day.

Table 4.
Pearson correlation of vegetation indices with each rice variety yield for each evaluated day.
The PCA results are shown in Figure 6, including the four evaluation dates and different rice varieties for each date. The PCA results for each day after sowing showed overlapping groups at 88, 103, and 116 DAS, with a single group isolation appearing at 130 DAS. For the vegetation indices, all showed a robust contribution to the 88, 103, and 116 DAS groups (Figure 7a). On the other hand, rice varieties exhibited distinct groupings for each evaluated date, with all the varieties overlapping for all the dates except Capirona. In particular, Capirona formed an isolated group at 116 DAS, with a pronounced contribution related to the MCARI. In contrast, the other indices showed relationships with different cultivars at all the dates evaluated (Figure 7d).
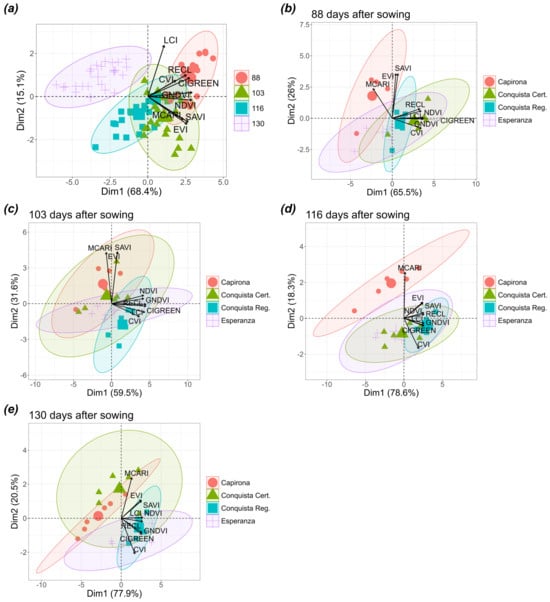
Figure 7.
PCA for VIs during the evaluation days: (a) PCA for all the indices and DAS; (b) PCA for the indices and group of rice cultivars at 88 DAS; (c) PCA for the indices and group of rice cultivars at 103 DAS; (d) PCA for the indices and group of rice cultivars at 116 DAS; (e) PCA for the indices and group of rice cultivars at 130 DAS.
Yield prediction models were constructed using multiple linear regression for each DAS using Pearson’s positive correlation. The results showed a lower performance to build an adequate model for 88, 103, and 116 DAS. However, for the last date evaluated (130 DAS), a regular performance was reported using NDVI, EVI, and SAVI indices with the coefficient of determination (adjusted-R2 = 0.43, p < 0.01). Predictive models for each rice variety for different evaluation dates were built using multiple linear regression based on indices with Pearson correlation r > 0.50. The best models for each variety were for Capirona at 130 DAS (Equation (4), model 1), Esperanza at 88 DAS (Equation (5), model 2), Conquista Certificada at 116 DAS (Equation (6), model 3), and Conquista registrada at 116 DAS (Equation (7), model 4) (Figure 8).
Y = −4.652 + 41.204 × LCI − 6.143 × CIGREEN
Y = −11.88 + 27.97 × EVI
Y = −0.5261 + 15.5234 × MCARI
Y = 33.70 + 20.02 × CVI−151.46 × LCI
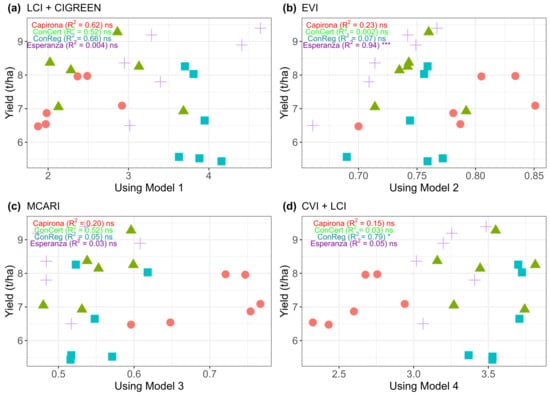
Figure 8.
Yield evaluated in the field and prediction models for the yield of four rice varieties with multiple linear regression, (a) 130 DAS, (b) 88 DAS, and (c,d) 116 DAS. ns. p-value > 0.05, * p-value < 0.05, and *** p-value < 0.001.
4. Discussion
The yield of crops depends on numerous factors throughout their growth cycle, which can lead to significant losses or gains. Predicting this yield requires the adoption of new technologies, such as geo-spatial tools, to develop predictive models for various agricultural parameters. However, in Peru, the widespread exploration and adoption of this technology are still in its early stages [13,37]. Herein, the highest yield is represented by the Esperanza variety with 8.36 t/ha, while the lowest yield was found in the Conquista Registrada variety with 6.58 t/ha. Other studies have reported different yields for rice varieties. For instance, Alam et al. [38] reported the highest yield in Hira-2 and Aloron varieties, with 7.50 t/ha and 7.41 t/ha, respectively. Additionally, other studies have demonstrated the influence of the season on rice yield, where all the varieties assessed presented their highest yield values during the wet season [39]. The chlorophyll content shows an increasing trend for the Esperanza variety, which remains high until harvest. This behavior refers to the stay-green trait of some rice varieties, which means that their chlorophyll levels remain high until harvest, allowing this trait to maintain high photosynthetic levels and improve yield [40,41]. This was demonstrated in this study, where Esperanza had the highest yield compared to the other varieties tested.
Previous studies reaffirm that crop yield depends on genetic variability [42], environmental factors, and agricultural management practices [43,44,45]. Several studies have shown variations in the life cycle of rice. Herein, we found the best performance at 130 DAS (ripening) with vegetation indices (VIs) such as NDVI, EVI, and SAVI (R2 = 0.43). Our findings align with those of Yang et al. [46], who found an R2 of 0.50 during the ripening stage using RGB and multispectral imagery. However, other studies have shown different coefficients of determination for various stages of the crop. For example, at the heading stage, an R2 of 0.60 was reported with NDRE and GNDVI [47]. Additionally, considering the whole growth stage, authors found different coefficients of determination, with the sum of NDVI at the booting and heading stages resulting in an R2 of 0.75 [2], and an R2 of 0.61 with NDVI in the reproductive and ripening stages [45]. Another study showed that the Wide-Dynamic-Range Vegetation Index (WDRVI) was a better index for estimating yield at the booting stage (R2 = 0.63) and for the heading stage SAVI showed the best performance (R2 = 0.60) [14]; other indices as normalized difference red-edge (NDRE) and renormalized difference vegetation index (RDVI) showed the best performance at booting (R2 = 0.75) and heading stage (R2 = 0.68), respectively [48]. These studies also confirmed that the use of NDVI loses sensitivity in the final stage, where employing other indices or a combination of various vegetation indices (VIs) could enhance the performance of prediction models [11,13,49]. The support from other indices to improve the stability of yield prediction models stems from their heightened sensitivity to variations in vegetation cover, biomass, or chlorophyll content. For instance, while NDVI is more sensitive to dense vegetation [11,12], the normalized difference yellowness index (NDYI) exhibits greater sensitivity during flowering [11]. Chlorophyll sensitivity is attributed to indices such as CIgreen, ReCL, MCARI, and LCI in conjunction with the green and red reflectance channels [50]. The accuracy and precision of rice prediction models rely on monitoring specific rice growth stages known to be crucial in determining grain yield, such as the panicle initiation (88 DAS) and flowering (103 DAS) stages [51]. Conversely, rice varieties exhibit different developmental patterns and growth rates, highlighting the importance of defining a specific rice variety.
The efficacy of vegetation indices is commonly assayed through correlation analyses and variable importance plots on a case-by-case basis. This demonstrates that a given index may display a linear correlation in one study but not in another [51]. Incorporating vegetation indices capable of capturing morphological differences among cultivars can enhance the model’s ability to address variability [52]. Grain yield prediction models for various cultivars have sought to mitigate high variance in prediction model research [53].
This initial outcome regarding the prediction model for rice yield in Peru provides valuable insights for initiating crop monitoring and mitigating significant losses in the field. Utilizing unmanned aerial vehicles (UAVs) coupled with multispectral imagery has the potential to become essential tools for modern agricultural management. Precision farming has been shown in other countries to improve the management of resources during cultivation, thereby increasing yields. In addition, there are significant cost savings in terms of labor, time, and environmental impact that can be caused by the indiscriminate use of pesticides [54]. Precision technology using remote sensing such as UAVs is a novelty in Peru. Therefore, the present work provides a first overview of rice cultivation for yield prediction. However, its application to large and small farmers is a major effort, as it is necessary to consider the other aspects of rice production in the San Martin region to ensure the accuracy of the model. Currently, this technology is being developed for different crops in Peru such as maize [37] and beans [13] for yield prediction models. Also, morphometric measurements [55,56], evapotranspiration measures [57,58], and soil property characterization [59] have been studied, all using UAVs. These approaches offer us the opportunity to monitor farmers’ plots, assist in the management of agricultural systems, and support decision-making processes before, during, and after crop implementation.
5. Conclusions
The use of multispectral tools allows the establishment of rice yield prediction models. The results show that the indices have a low correlation with yield with r < 0.5 considering all the varieties, while individually the Esperanza variety has the highest correlation values with the yield at day 88. In the establishment of rice yield prediction models, it was higher than 130 DAS when NDVI, EVI, and SAVI were used. Different rice varieties established different prediction models, with Esperanza showing the most effective model at 88 DAS for early rice yield estimation. In addition, Conquista Registrada showed a significant model at 116 DAS. However, the varieties Capirona and Conquista Certificada did not show significant patterns. Consequently, the development of these models supported by vegetation indices will facilitate important decisions in rice crop monitoring and resource optimization, and help to make timely agricultural decisions in Peru, thus assisting rice farmers.
Supplementary Materials
The following supporting information can be downloaded at: https://www.mdpi.com/article/10.3390/agriengineering6030170/s1, Figure S1: Meteorological data for the period in the study; Figure S2: Comparison of the Tukey test (p < 0.05) for the yield of different system cultures; Figure S3: Leaf Chlorophyll Index (LCI) for four dates evaluated in rice crop; Figure S4: Pearson correlation among rice varieties with VIs at 88 DAS; Figure S5: Pearson correlation among rice varieties with VIs at 103 DAS; Figure S6: Pearson correlation among rice varieties with VIs at 116 DAS; Figure S7: Pearson correlation among rice varieties with VIs at 130 DAS.
Author Contributions
Conceptualization, D.G.-P., M.J.-P., Z.L.O.-A. and R.H.L.-G.; methodology, D.G.-P., Z.L.O.-A. and M.J.-P.; software, S.S.V.-H.; validation, S.S.V.-H., Z.L.O.-A. and A.I.A.-P.; formal analysis, S.S.V.-H.; investigation, D.G.-P., Z.L.O.-A. and M.S.-O.; resources, R.H.L.-G., A.I.A.-P., M.D.S.-G. and J.J.G.-R.; data curation, S.S.V.-H.; writing—original draft preparation, S.S.V.-H. and A.I.A.-P.; writing—review and editing, S.S.V.-H., A.I.A.-P. and D.G.-P.; visualization, S.S.V.-H. and Z.L.O.-A.; supervision, M.D.S.-G. and M.S.-O.; project administration, D.G.-P., M.S.-O., Z.L.O.-A. and R.H.L.-G.; funding acquisition, Z.L.O.-A. and A.I.A.-P. All authors have read and agreed to the published version of the manuscript.
Funding
This research was funded by the project “Creación del servicio de agricultura de precisión en los Departamentos de Lambayeque, Huancavelica, Ucayali y San Martín” of the Instituto Nacional de Innovación Agraria (INIA), which is part of the Ministerio de Desarrollo Agrario y Riego (MIDAGRI) of the Peruvian Government, with grant number CUI 2449640.
Data Availability Statement
All the data generated during this study are included in this published article.
Acknowledgments
We would like to express our sincere gratitude to the members of Programa Nacional de Arroz, Lucas Garcia Bartra of the Programa Nacional de Semillas, and Hector Javier Perez Paredes and to the field team for their assistance in agronomic work and equipment maintenance. Their invaluable assistance and support have been essential in the successful completion of this endeavor.
Conflicts of Interest
The authors declare no conflicts of interest.
References
- Cantrell, R.P.; Reeves, T.G. The Cereal of the World’s Poor Takes Center Stage. Science 2002, 296, 53. [Google Scholar] [CrossRef]
- Zhou, X.; Zheng, H.B.; Xu, X.Q.; He, J.Y.; Ge, X.K.; Yao, X.; Cheng, T.; Zhu, Y.; Cao, W.X.; Tian, Y.C. Predicting Grain Yield in Rice Using Multi-Temporal Vegetation Indices from UAV-Based Multispectral and Digital Imagery. ISPRS J. Photogramm. Remote Sens. 2017, 130, 246–255. [Google Scholar] [CrossRef]
- Dingkuhn, M.; Laza, M.R.C.; Kumar, U.; Mendez, K.S.; Collard, B.; Jagadish, K.; Singh, R.K.; Padolina, T.; Malabayabas, M.; Torres, E.; et al. Improving Yield Potential of Tropical Rice: Achieved Levels and Perspectives through Improved Ideotypes. Field Crops Res. 2015, 182, 43–59. [Google Scholar] [CrossRef]
- Haboudane, D.; Miller, J.R.; Tremblay, N.; Zarco-Tejada, P.J.; Dextraze, L. Integrated Narrow-Band Vegetation Indices for Prediction of Crop Chlorophyll Content for Application to Precision Agriculture. Remote Sens. Environ. 2002, 81, 416–426. [Google Scholar] [CrossRef]
- Fu, Y.; Yang, G.; Wang, J.; Song, X.; Feng, H. Winter Wheat Biomass Estimation Based on Spectral Indices, Band Depth Analysis and Partial Least Squares Regression Using Hyperspectral Measurements. Comput. Electron. Agric. 2014, 100, 51–59. [Google Scholar] [CrossRef]
- Ji, Y.; Chen, Z.; Cheng, Q.; Liu, R.; Li, M.; Yan, X.; Li, G.; Wang, D.; Fu, L.; Ma, Y.; et al. Estimation of Plant Height and Yield Based on UAV Imagery in Faba Bean (Vicia faba L.). Plant Methods 2022, 18, 26. [Google Scholar] [CrossRef]
- Shiu, Y.-S.; Chuang, Y.-C. Yield Estimation of Paddy Rice Based on Satellite Imagery: Comparison of Global and Local Regression Models. Remote Sens. 2019, 11, 111. [Google Scholar] [CrossRef]
- Ahmad, A.; Ordoñez, J.; Cartujo, P.; Martos, V. Remotely Piloted Aircraft (RPA) in Agriculture: A Pursuit of Sustainability. Agronomy 2020, 11, 7. [Google Scholar] [CrossRef]
- Manlove, J.L.; Shew, A.M.; Obembe, O.S. Arkansas Producers Value Upload Speed More than Download Speed for Precision Agriculture Applications. Comput. Electron. Agric. 2021, 190, 106432. [Google Scholar] [CrossRef]
- Wan, L.; Cen, H.; Zhu, J.; Zhang, J.; Zhu, Y.; Sun, D.; Du, X.; Zhai, L.; Weng, H.; Li, Y.; et al. Grain Yield Prediction of Rice Using Multi-Temporal UAV-Based RGB and Multispectral Images and Model Transfer—A Case Study of Small Farmlands in the South of China. Agric. For. Meteorol. 2020, 291, 108096. [Google Scholar] [CrossRef]
- Sulik, J.J.; Long, D.S. Spectral Considerations for Modeling Yield of Canola. Remote Sens. Environ. 2016, 184, 161–174. [Google Scholar] [CrossRef]
- Yue, J.; Yang, G.; Tian, Q.; Feng, H.; Xu, K.; Zhou, C. Estimate of Winter-Wheat above-Ground Biomass Based on UAV Ultrahigh-Ground-Resolution Image Textures and Vegetation Indices. ISPRS J. Photogramm. Remote Sens. 2019, 150, 226–244. [Google Scholar] [CrossRef]
- Saravia, D.; Valqui-Valqui, L.; Salazar, W.; Quille-Mamani, J.; Barboza, E.; Porras-Jorge, R.; Injante, P.; Arbizu, C.I. Yield Prediction of Four Bean (Phaseolus vulgaris) Cultivars Using Vegetation Indices Based on Multispectral Images from UAV in an Arid Zone of Peru. Drones 2023, 7, 325. [Google Scholar] [CrossRef]
- Luo, S.; Jiang, X.; Jiao, W.; Yang, K.; Li, Y.; Fang, S. Remotely Sensed Prediction of Rice Yield at Different Growth Durations Using UAV Multispectral Imagery. Agriculture 2022, 12, 1447. [Google Scholar] [CrossRef]
- Zhang, K.; Ge, X.; Shen, P.; Li, W.; Liu, X.; Cao, Q.; Zhu, Y.; Cao, W.; Tian, Y. Predicting Rice Grain Yield Based on Dynamic Changes in Vegetation Indexes during Early to Mid-Growth Stages. Remote Sens. 2019, 11, 387. [Google Scholar] [CrossRef]
- Son, N.T.; Chen, C.F.; Chen, C.R.; Chang, L.Y.; Duc, H.N.; Nguyen, L.D. Prediction of Rice Crop Yield Using MODIS EVI−LAI Data in the Mekong Delta, Vietnam. Int. J. Remote Sens. 2013, 34, 7275–7292. [Google Scholar] [CrossRef]
- Mia, M.S.; Tanabe, R.; Habibi, L.N.; Hashimoto, N.; Homma, K.; Maki, M.; Matsui, T.; Tanaka, T.S.T. Multimodal Deep Learning for Rice Yield Prediction Using UAV-Based Multispectral Imagery and Weather Data. Remote Sens. 2023, 15, 2511. [Google Scholar] [CrossRef]
- Qiu, Z.; Ma, F.; Li, Z.; Xu, X.; Du, C. Development of Prediction Models for Estimating Key Rice Growth Variables Using Visible and NIR Images from Unmanned Aerial Systems. Remote Sens. 2022, 14, 1384. [Google Scholar] [CrossRef]
- Ge, H.; Ma, F.; Li, Z.; Du, C. Grain Yield Estimation in Rice Breeding Using Phenological Data and Vegetation Indices Derived from UAV Images. Agronomy 2021, 11, 2439. [Google Scholar] [CrossRef]
- Caribou Space, D.T. Regional and National Rice Production Forecasting in Peru (IPP Case Study). Available online: https://www.spacefordevelopment.org/library/regional-and-nationalrice-production-forecasting-in-peru-ipp-case-study/ (accessed on 9 March 2024).
- INIA Programa Nacional de Arroz. Available online: https://www.inia.gob.pe/pn-arroz/ (accessed on 3 October 2023).
- Rosero, M. Sistema de Evaluación Estandar Para Arroz; Centro Internacional de Agricultura Tropical (CIAT): Cali, Colombia, 1983. [Google Scholar]
- Hassan, M.; Yang, M.; Rasheed, A.; Jin, X.; Xia, X.; Xiao, Y.; He, Z. Time-Series Multispectral Indices from Unmanned Aerial Vehicle Imagery Reveal Senescence Rate in Bread Wheat. Remote Sens. 2018, 10, 809. [Google Scholar] [CrossRef]
- de Mendiburu, F. Agricolae: Statistical Procedures for Agricultural Research. Available online: https://cran.r-project.org/web/packages/agricolae/index.html (accessed on 10 March 2024).
- Schloerke, B.; Cook, D.; Larmarange, J.; Briatte, F.; Marbach, M.; Thoen, E.; Elberg, A.; Crowley, J. GGally: Extension to “Ggplot2”. Available online: https://cran.r-project.org/package=GGally (accessed on 3 October 2023).
- Lê, S.; Josse, J.; Husson, F. FactoMineR: An R Package for Multivariate Analysis. J. Stat. Softw. 2008, 25, 1–18. [Google Scholar] [CrossRef]
- Kassambara, A.; Mundt, F. Factoextra: Extract and Visualize the Results of Multivariate Data Analyses. Available online: https://cran.r-project.org/package=factoextra (accessed on 3 November 2023).
- R Core Team. R: A Language and Environment for Statistical Computing; R Foundation for Statistical Computing: Vienna, Austria, 2024; Available online: https://www.R-project.org/ (accessed on 3 November 2023).
- Peñuelas, J.; Gamon, J.A.; Griffin, K.L.; Field, C.B. Assessing Community Type, Plant Biomass, Pigment Composition, and Photosynthetic Efficiency of Aquatic Vegetation from Spectral Reflectance. Remote Sens. Environ. 1993, 46, 110–118. [Google Scholar] [CrossRef]
- Gitelson, A.A.; Kaufman, Y.J.; Merzlyak, M.N. Use of a Green Channel in Remote Sensing of Global Vegetation from EOS-MODIS. Remote Sens. Environ. 1996, 58, 289–298. [Google Scholar] [CrossRef]
- Gitelson, A.A.; Viña, A.; Ciganda, V.; Rundquist, D.C.; Arkebauer, T.J. Remote Estimation of Canopy Chlorophyll Content in Crops. Geophys. Res. Lett. 2005, 32, L08403. [Google Scholar] [CrossRef]
- Guan, L.; Liu, X.N.; Cheng, C.Q. Research on Hyperspectral Information Parameters of Chlorophyll Content of Rice Leaf in Cd-Polluted Soil Environment. Guang Pu Xue Yu Guang Pu Fen Xi/Spectrosc. Spectr. Anal. 2009, 29, 2713–2716. [Google Scholar] [CrossRef]
- Huete, A. A Soil-Adjusted Vegetation Index (SAVI). Remote Sens. Environ. 1988, 25, 295–309. [Google Scholar] [CrossRef]
- Vincini, M.; Frazzi, E.; D’Alessio, P. A Broad-Band Leaf Chlorophyll Vegetation Index at the Canopy Scale. Precis. Agric. 2008, 9, 303–319. [Google Scholar] [CrossRef]
- Datt, B. A New Reflectance Index for Remote Sensing of Chlorophyll Content in Higher Plants: Tests Using Eucalyptus Leaves. J. Plant Physiol. 1999, 154, 30–36. [Google Scholar] [CrossRef]
- Gitelson, A.A.; Gritz, Y.; Merzlyak, M.N. Relationships between Leaf Chlorophyll Content and Spectral Reflectance and Algorithms for Non-Destructive Chlorophyll Assessment in Higher Plant Leaves. J. Plant Physiol. 2003, 160, 271–282. [Google Scholar] [CrossRef]
- Saravia, D.; Salazar, W.; Valqui-Valqui, L.; Quille-Mamani, J.; Porras-Jorge, R.; Corredor, F.-A.; Barboza, E.; Vásquez, H.; Casas Diaz, A.; Arbizu, C. Yield Predictions of Four Hybrids of Maize (Zea Mays) Using Multispectral Images Obtained from UAV in the Coast of Peru. Agronomy 2022, 12, 2630. [Google Scholar] [CrossRef]
- Alam, M.M.; Ali, M.; Ruhul Amin, A.K.; Hasanuzzaman, M. Yields Attributes Yield and Harvest Index of Three Irrigated Rice Varieties Under Different Levels of Phosphorus.Pdf. Adv. Biol. Res. 2009, 3, 132–139. [Google Scholar]
- Laenoi, S.; Rerkasem, B.; Lordkaew, S.; Prom-u-thai, C. Seasonal Variation in Grain Yield and Quality in Different Rice Varieties. Field Crops Res. 2018, 221, 350–357. [Google Scholar] [CrossRef]
- Zang, Y.; Yao, Y.; Xu, Z.; Wang, B.; Mao, Y.; Wang, W.; Zhang, W.; Zhang, H.; Liu, L.; Wang, Z.; et al. The Relationships among “STAY-GREEN” Trait, Post-Anthesis Assimilate Remobilization, and Grain Yield in Rice (Oryza sativa L.). Int. J. Mol. Sci. 2022, 23, 13668. [Google Scholar] [CrossRef]
- Kamal, N.M.; Gorafi, Y.S.A.; Abdelrahman, M.; Abdellatef, E.; Tsujimoto, H. Stay-Green Trait: A Prospective Approach for Yield Potential, and Drought and Heat Stress Adaptation in Globally Important Cereals. Int. J. Mol. Sci. 2019, 20, 5837. [Google Scholar] [CrossRef] [PubMed]
- Hour, A.; Hsieh, W.; Chang, S.; Wu, Y.; Chin, H.; Lin, Y. Genetic Diversity of Landraces and Improved Varieties of Rice (Oryza sativa L.) in Taiwan. Rice 2020, 13, 82. [Google Scholar] [CrossRef]
- Zhu, X.; Zhang, J.; Zhang, Z.; Deng, A.; Zhang, W. Dense Planting with Less Basal Nitrogen Fertilization Might Benefit Rice Cropping for High Yield with Less Environmental Impacts. Eur. J. Agron. 2016, 75, 50–59. [Google Scholar] [CrossRef]
- Tayefeh, M.; Sadeghi, S.M.; Noorhosseini, S.A.; Bacenetti, J.; Damalas, C.A. Environmental Impact of Rice Production Based on Nitrogen Fertilizer Use. Environ. Sci. Pollut. Res. 2018, 25, 15885–15895. [Google Scholar] [CrossRef]
- Guan, S.; Fukami, K.; Matsunaka, H.; Okami, M.; Tanaka, R.; Nakano, H.; Sakai, T.; Nakano, K.; Ohdan, H.; Takahashi, K. Assessing Correlation of High-Resolution NDVI with Fertilizer Application Level and Yield of Rice and Wheat Crops Using Small UAVs. Remote Sens. 2019, 11, 112. [Google Scholar] [CrossRef]
- Yang, Q.; Shi, L.; Han, J.; Zha, Y.; Zhu, P. Deep Convolutional Neural Networks for Rice Grain Yield Estimation at the Ripening Stage Using UAV-Based Remotely Sensed Images. Field Crops Res. 2019, 235, 142–153. [Google Scholar] [CrossRef]
- Duan, B.; Fang, S.; Zhu, R.; Wu, X.; Wang, S.; Gong, Y.; Peng, Y. Remote Estimation of Rice Yield With Unmanned Aerial Vehicle (UAV) Data and Spectral Mixture Analysis. Front. Plant Sci. 2019, 10, 204. [Google Scholar] [CrossRef]
- Su, X.; Wang, J.; Ding, L.; Lu, J.; Zhang, J.; Yao, X.; Cheng, T.; Zhu, Y.; Cao, W.; Tian, Y. Grain Yield Prediction Using Multi-Temporal UAV-Based Multispectral Vegetation Indices and Endmember Abundance in Rice. Field Crops Res. 2023, 299, 108992. [Google Scholar] [CrossRef]
- Hassan, M.A.; Yang, M.; Rasheed, A.; Yang, G.; Reynolds, M.; Xia, X.; Xiao, Y.; He, Z. A Rapid Monitoring of NDVI across the Wheat Growth Cycle for Grain Yield Prediction Using a Multi-Spectral UAV Platform. Plant Sci. 2019, 282, 95–103. [Google Scholar] [CrossRef]
- Stavrakoudis, D.; Katsantonis, D.; Kadoglidou, K.; Kalaitzidis, A.; Gitas, I. Estimating Rice Agronomic Traits Using Drone-Collected Multispectral Imagery. Remote Sens. 2019, 11, 545. [Google Scholar] [CrossRef]
- Bascon, M.V.; Nakata, T.; Shibata, S.; Takata, I.; Kobayashi, N.; Kato, Y.; Inoue, S.; Doi, K.; Murase, J.; Nishiuchi, S. Estimating Yield-Related Traits Using UAV-Derived Multispectral Images to Improve Rice Grain Yield Prediction. Agriculture 2022, 12, 1141. [Google Scholar] [CrossRef]
- Kanke, Y.; Tubaña, B.; Dalen, M.; Harrell, D. Evaluation of Red and Red-Edge Reflectance-Based Vegetation Indices for Rice Biomass and Grain Yield Prediction Models in Paddy Fields. Precis. Agric. 2016, 17, 507–530. [Google Scholar] [CrossRef]
- Perros, N.; Kalivas, D.; Giovos, R. Spatial Analysis of Agronomic Data and UAV Imagery for Rice Yield Estimation. Agriculture 2021, 11, 809. [Google Scholar] [CrossRef]
- Schieffer, J.; Dillon, C. The Economic and Environmental Impacts of Precision Agriculture and Interactions with Agro-Environmental Policy. Precis. Agric. 2015, 16, 46–61. [Google Scholar] [CrossRef]
- Chumbimune, S.Y.; Cardenas, G.P.; Saravia, D.; Valqui, L.; Salazar, W.; Arbizu, C.I. Methodology for avocado (persea americana mill.) Orchard evaluation using different measurement technologies. Chil. J. Agric. Anim. Sci. 2022, 38, 259–273. [Google Scholar] [CrossRef]
- Quille-Mamani, J.; Porras-Jorge, R.; Saravia-Navarro, D.; Valqui-Valqui, L.; Herrera, J.; Chávez-Galarza, J.; Arbizu, C.I. Assessment of Vegetation Índices Derived from UAV Images for Predicting Biometric Variables in Bean during Ripening Stage. Idesia 2022, 40, 39–45. [Google Scholar] [CrossRef]
- Machaca-Pillaca, R.; Pino-Vargas, E.; Ramos-Fernández, L.; Quille-Mamani, J.; Torres-Rua, A. Estimación de La Evapotranspiración Con Fines de Riego En Tiempo Real de Un Olivar a Partir de Imágenes de Un Drone En Zonas Áridas, Caso La Yarada, Tacna, Perú. Idesia 2022, 40, 55–65. [Google Scholar] [CrossRef]
- Quille-Mamani, J.A.; Ramos-Fernández, L.; Ontiveros-Capurata, R.E. Estimación de La Evapotranspiración Del Cultivo de Arroz En Perú Mediante El Algoritmo METRIC e Imágenes VANT. Rev. Teledetección 2021, 23, 13699. [Google Scholar] [CrossRef]
- Pizarro, S.; Pricope, N.G.; Figueroa, D.; Carbajal, C.; Quispe, M.; Vera, J.; Alejandro, L.; Achallma, L.; Gonzalez, I.; Salazar, W.; et al. Implementing Cloud Computing for the Digital Mapping of Agricultural Soil Properties from High Resolution UAV Multispectral Imagery. Remote Sens. 2023, 15, 3203. [Google Scholar] [CrossRef]
Disclaimer/Publisher’s Note: The statements, opinions and data contained in all publications are solely those of the individual author(s) and contributor(s) and not of MDPI and/or the editor(s). MDPI and/or the editor(s) disclaim responsibility for any injury to people or property resulting from any ideas, methods, instructions or products referred to in the content. |
© 2024 by the authors. Licensee MDPI, Basel, Switzerland. This article is an open access article distributed under the terms and conditions of the Creative Commons Attribution (CC BY) license (https://creativecommons.org/licenses/by/4.0/).