
Optimizing Crop Yield Estimation through Geospatial Technology: A Comparative Analysis of a Semi-Physical Model, Crop Simulation, and Machine Learning Algorithms

 ,
, 
 ,
,  ,
,  ,
,
Abstract
1. Introduction
2. Materials and Methods
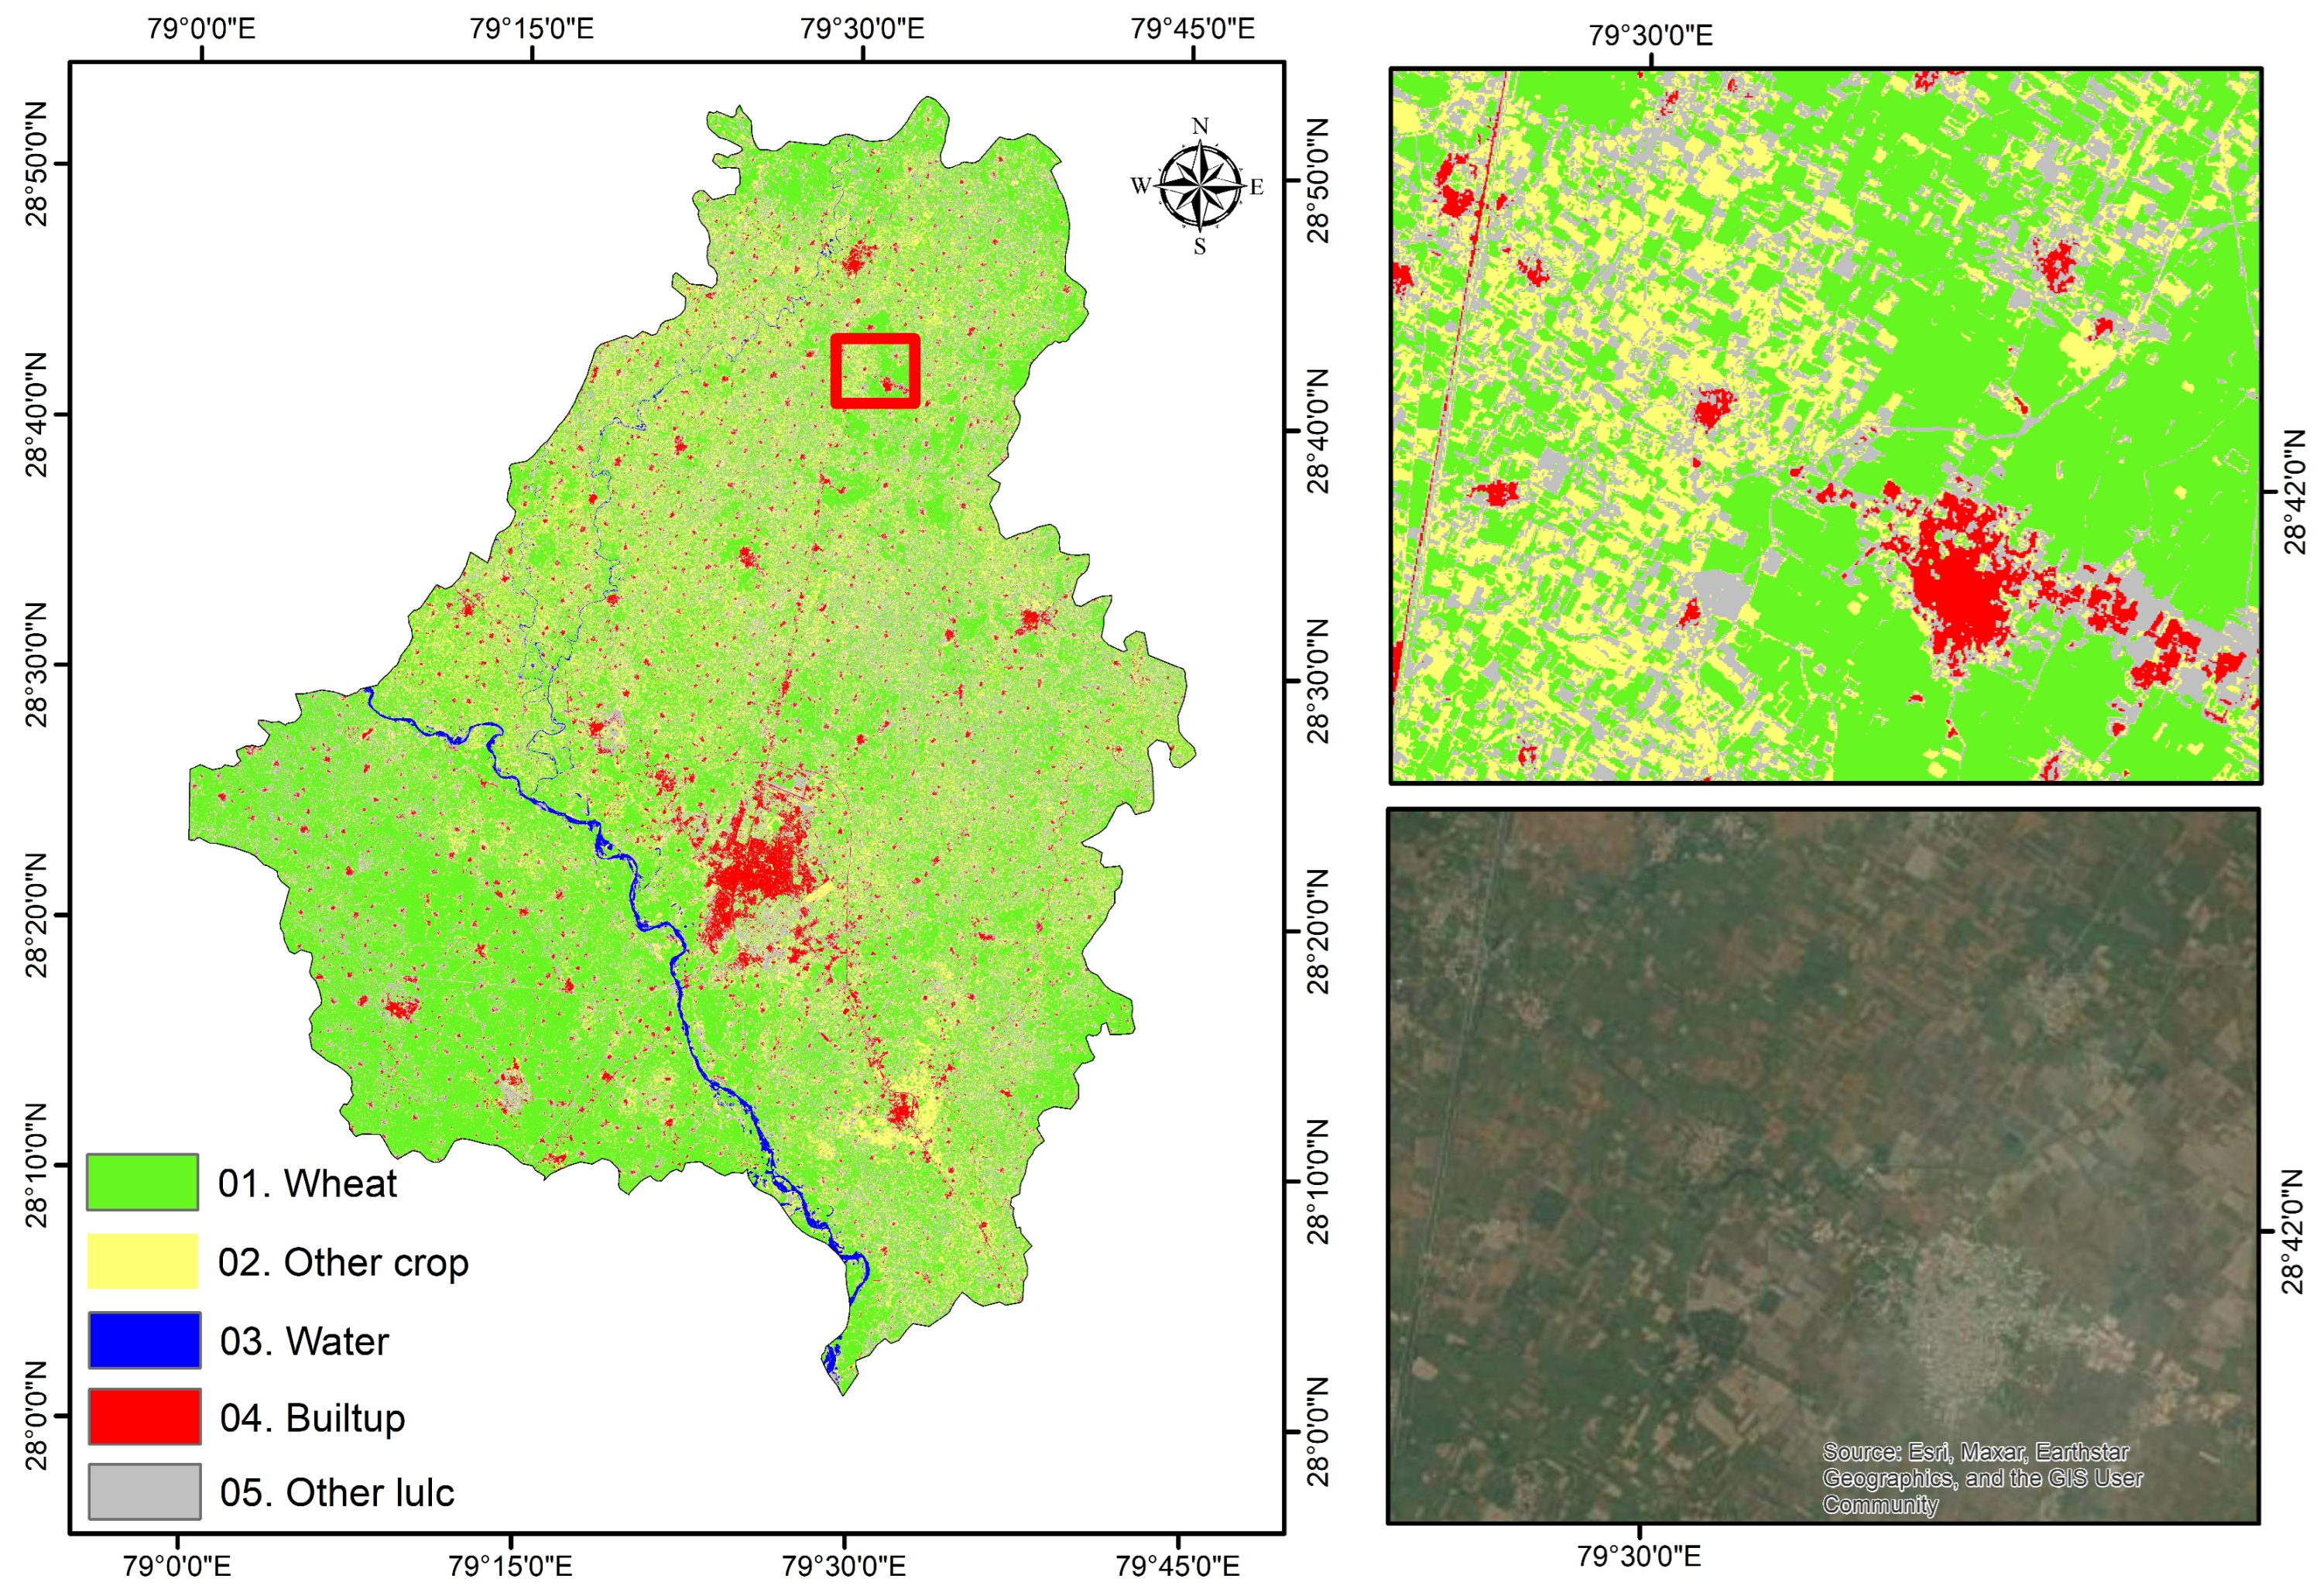
2.1. Study Area
2.2. Methodology
Mapping Wheat-Growing Areas in the Study Area by Integrating Sentinel-2 Imagery and Ground Data
2.3. Crop Yield Estimation Using Different Approaches
- (a)
- Using Machine Learning Algorithms
- (b)
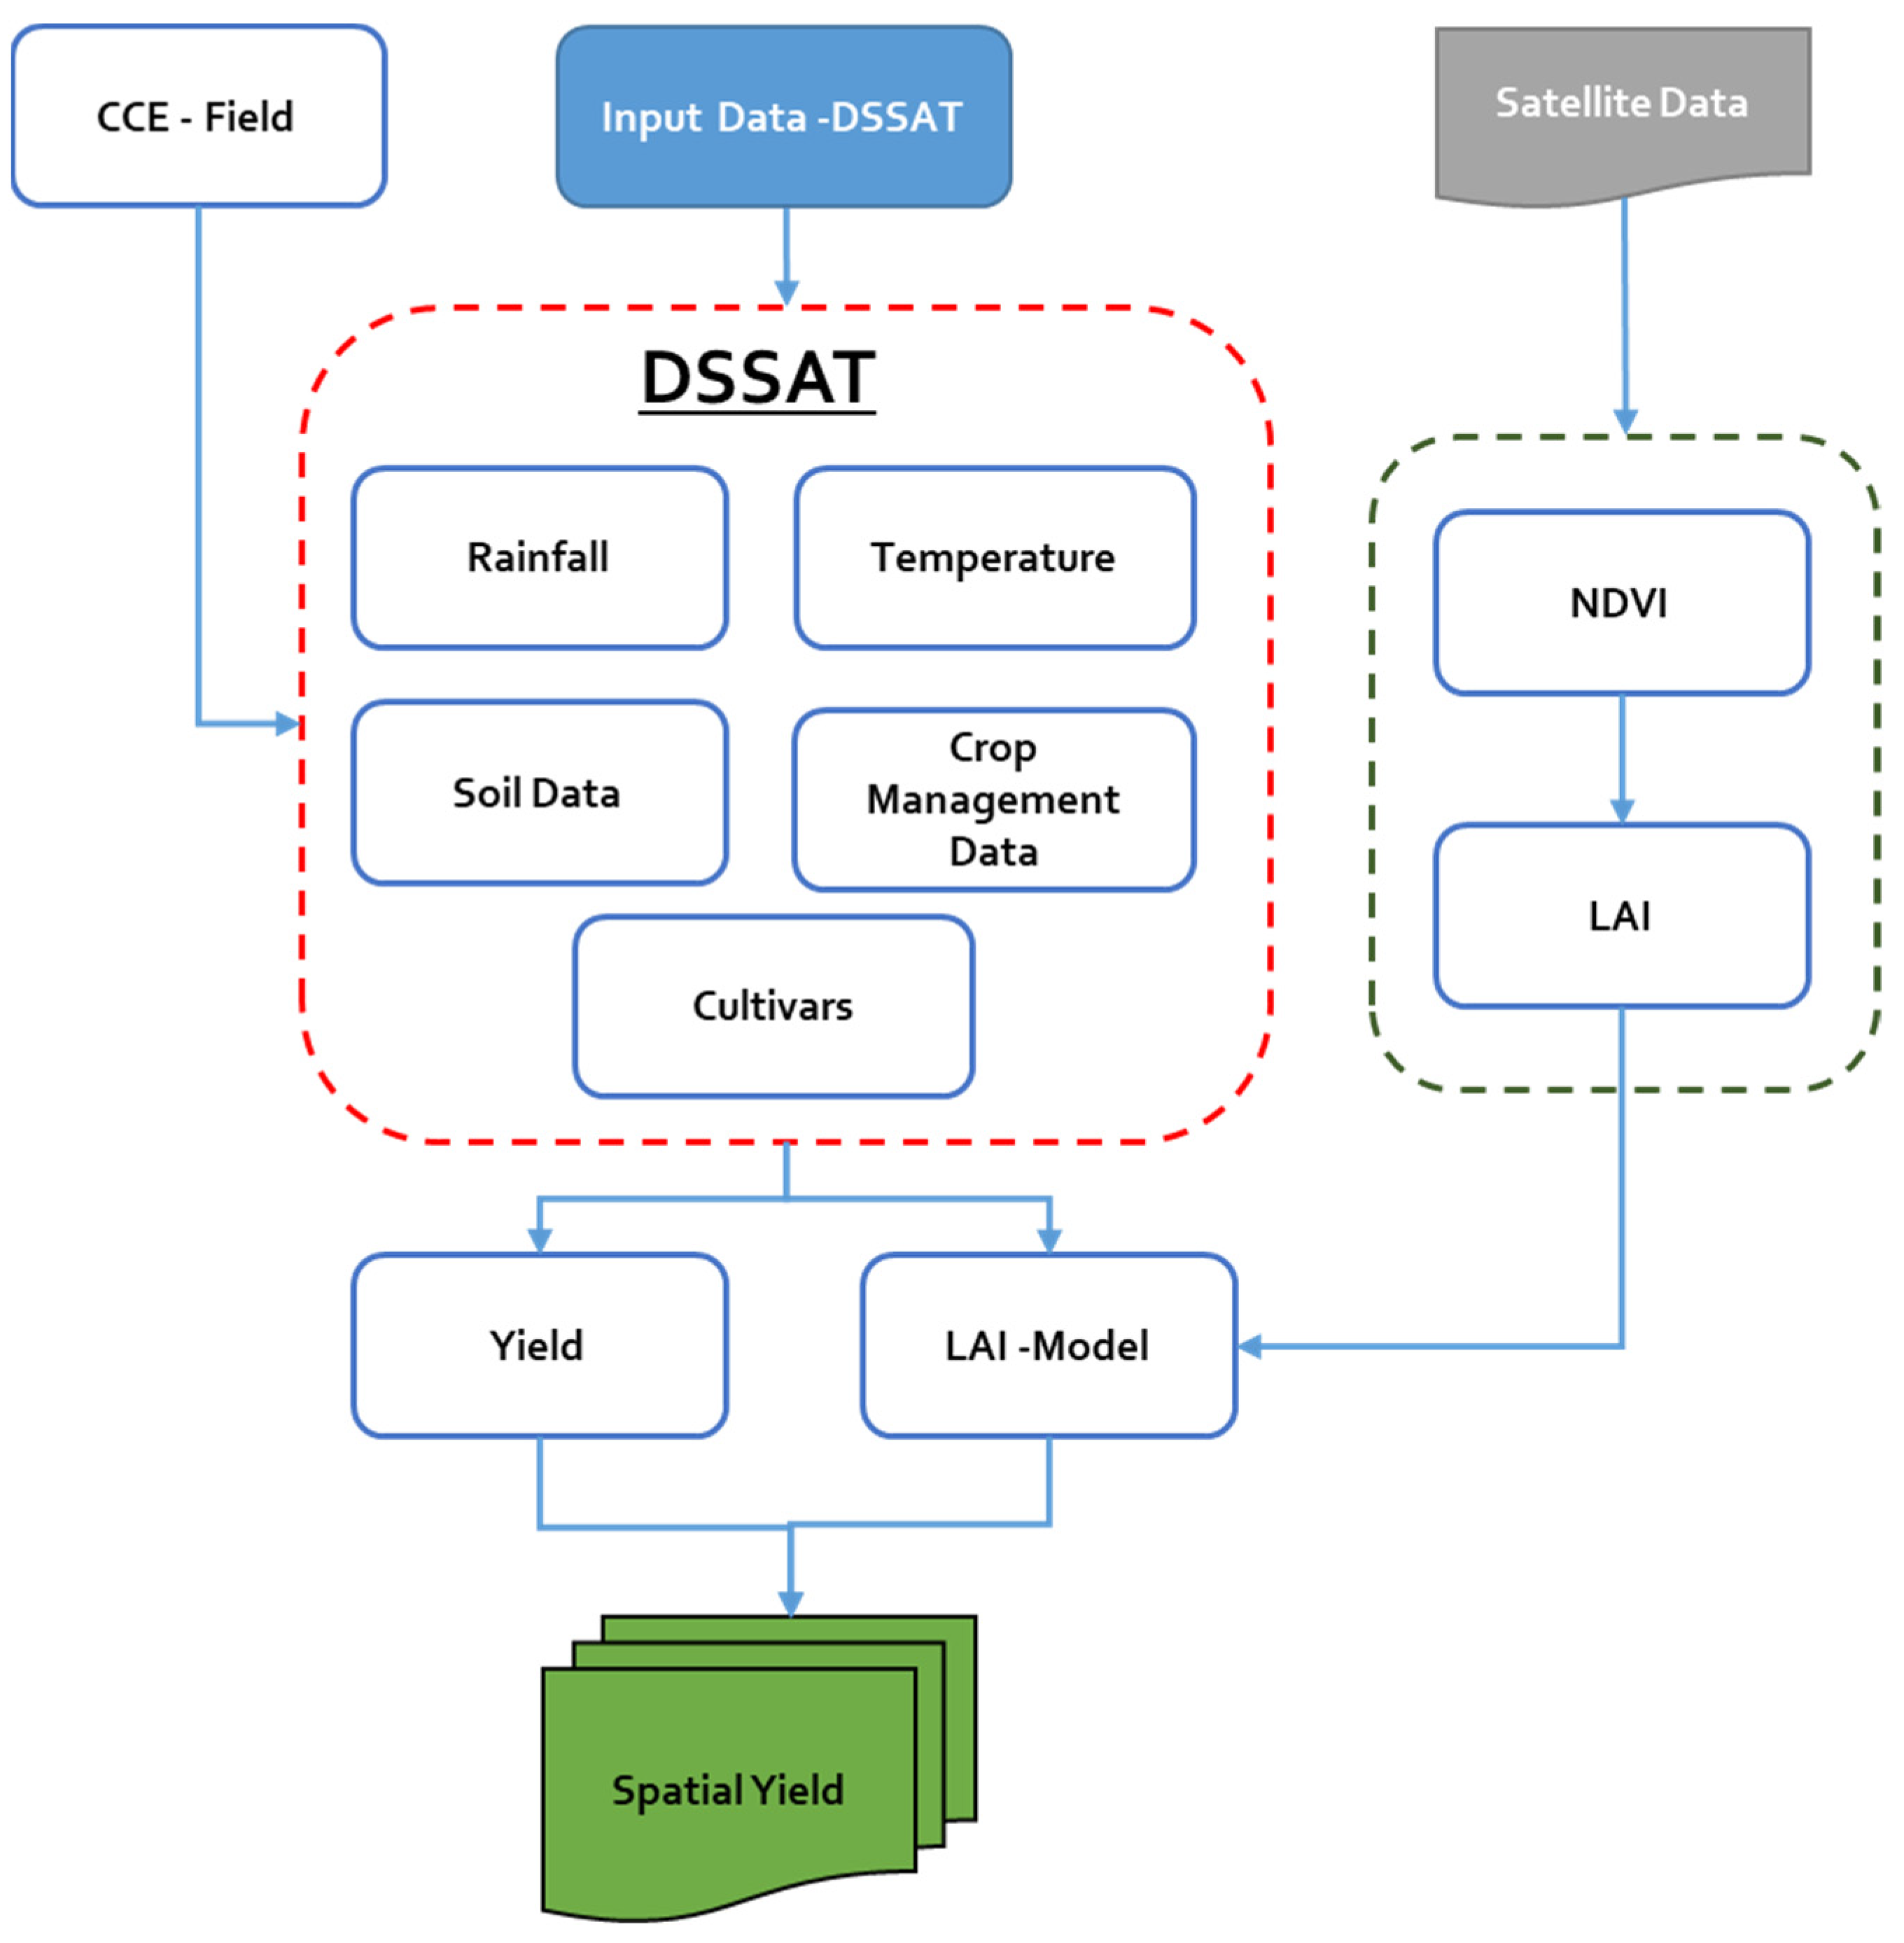
- DSSAT Crop Simulation Model
- (c)
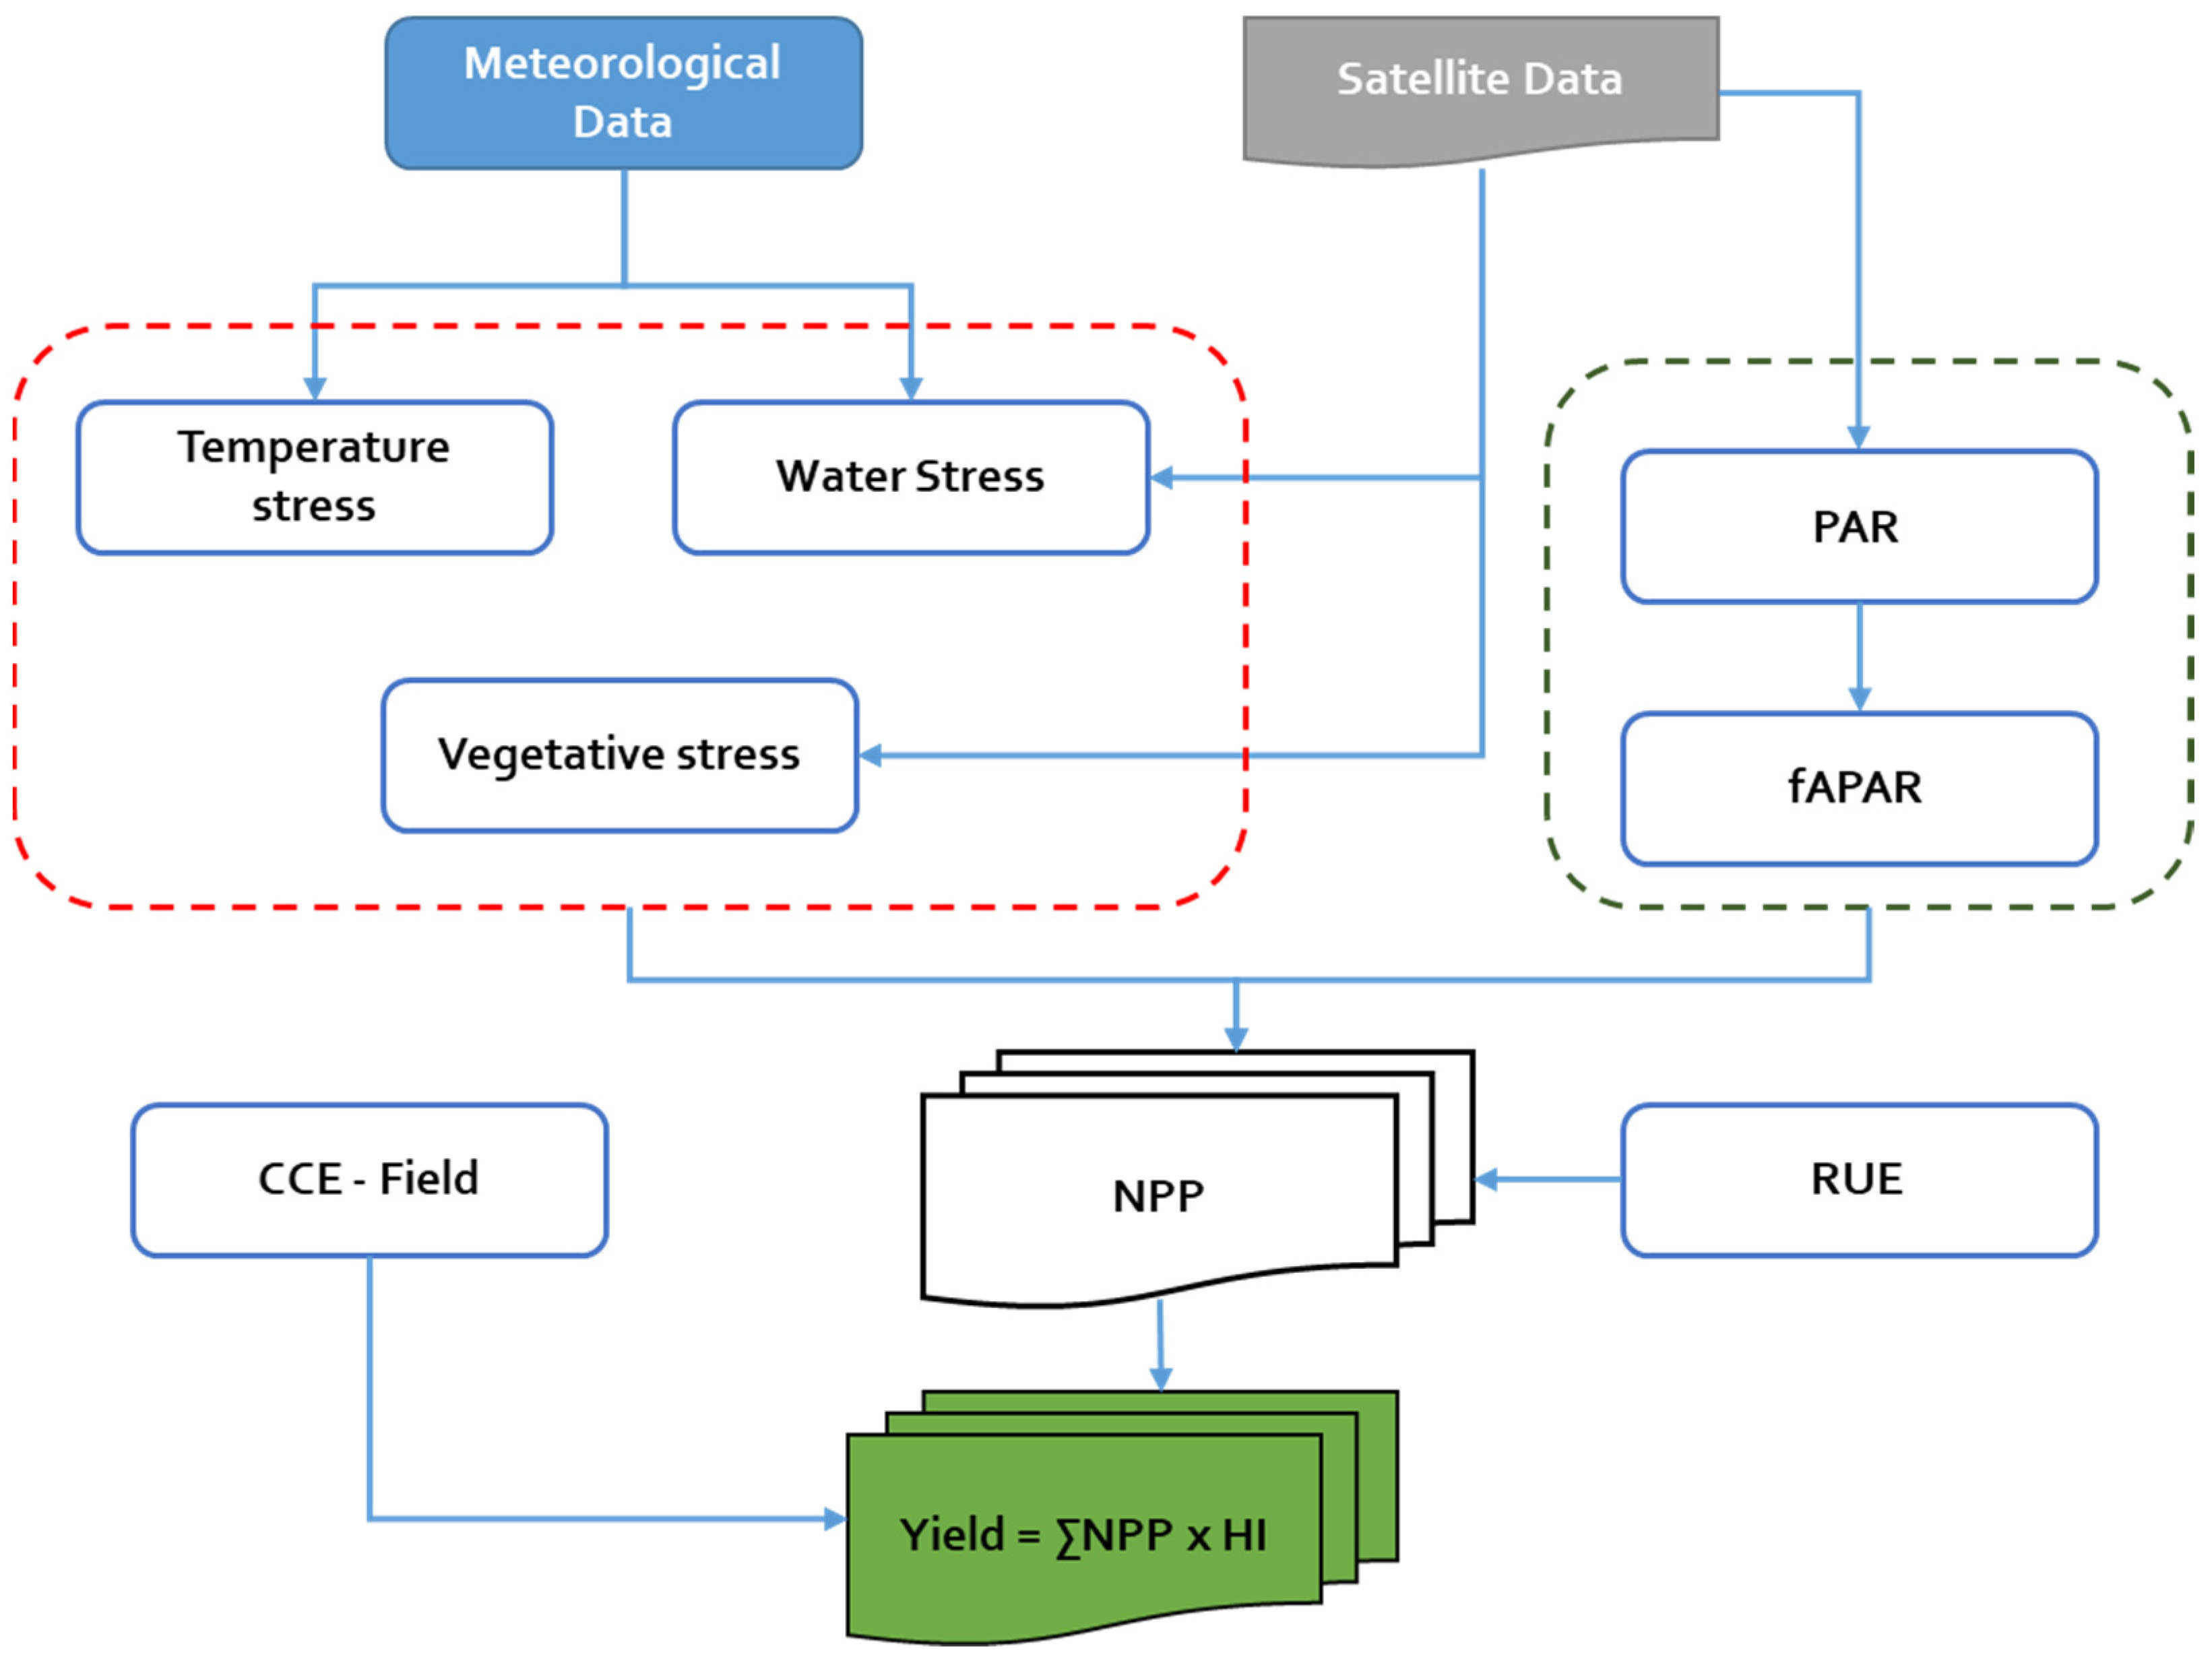
- Semi-Physical Approach
3. Results and Discussion
3.1. Crop Classification
3.2. Yield Estimation Using ML Algorithms
3.3. Yield Estimation Using DSSAT Crop Simulation Model
3.4. Yield Estimation Using Semi-Physical Approach
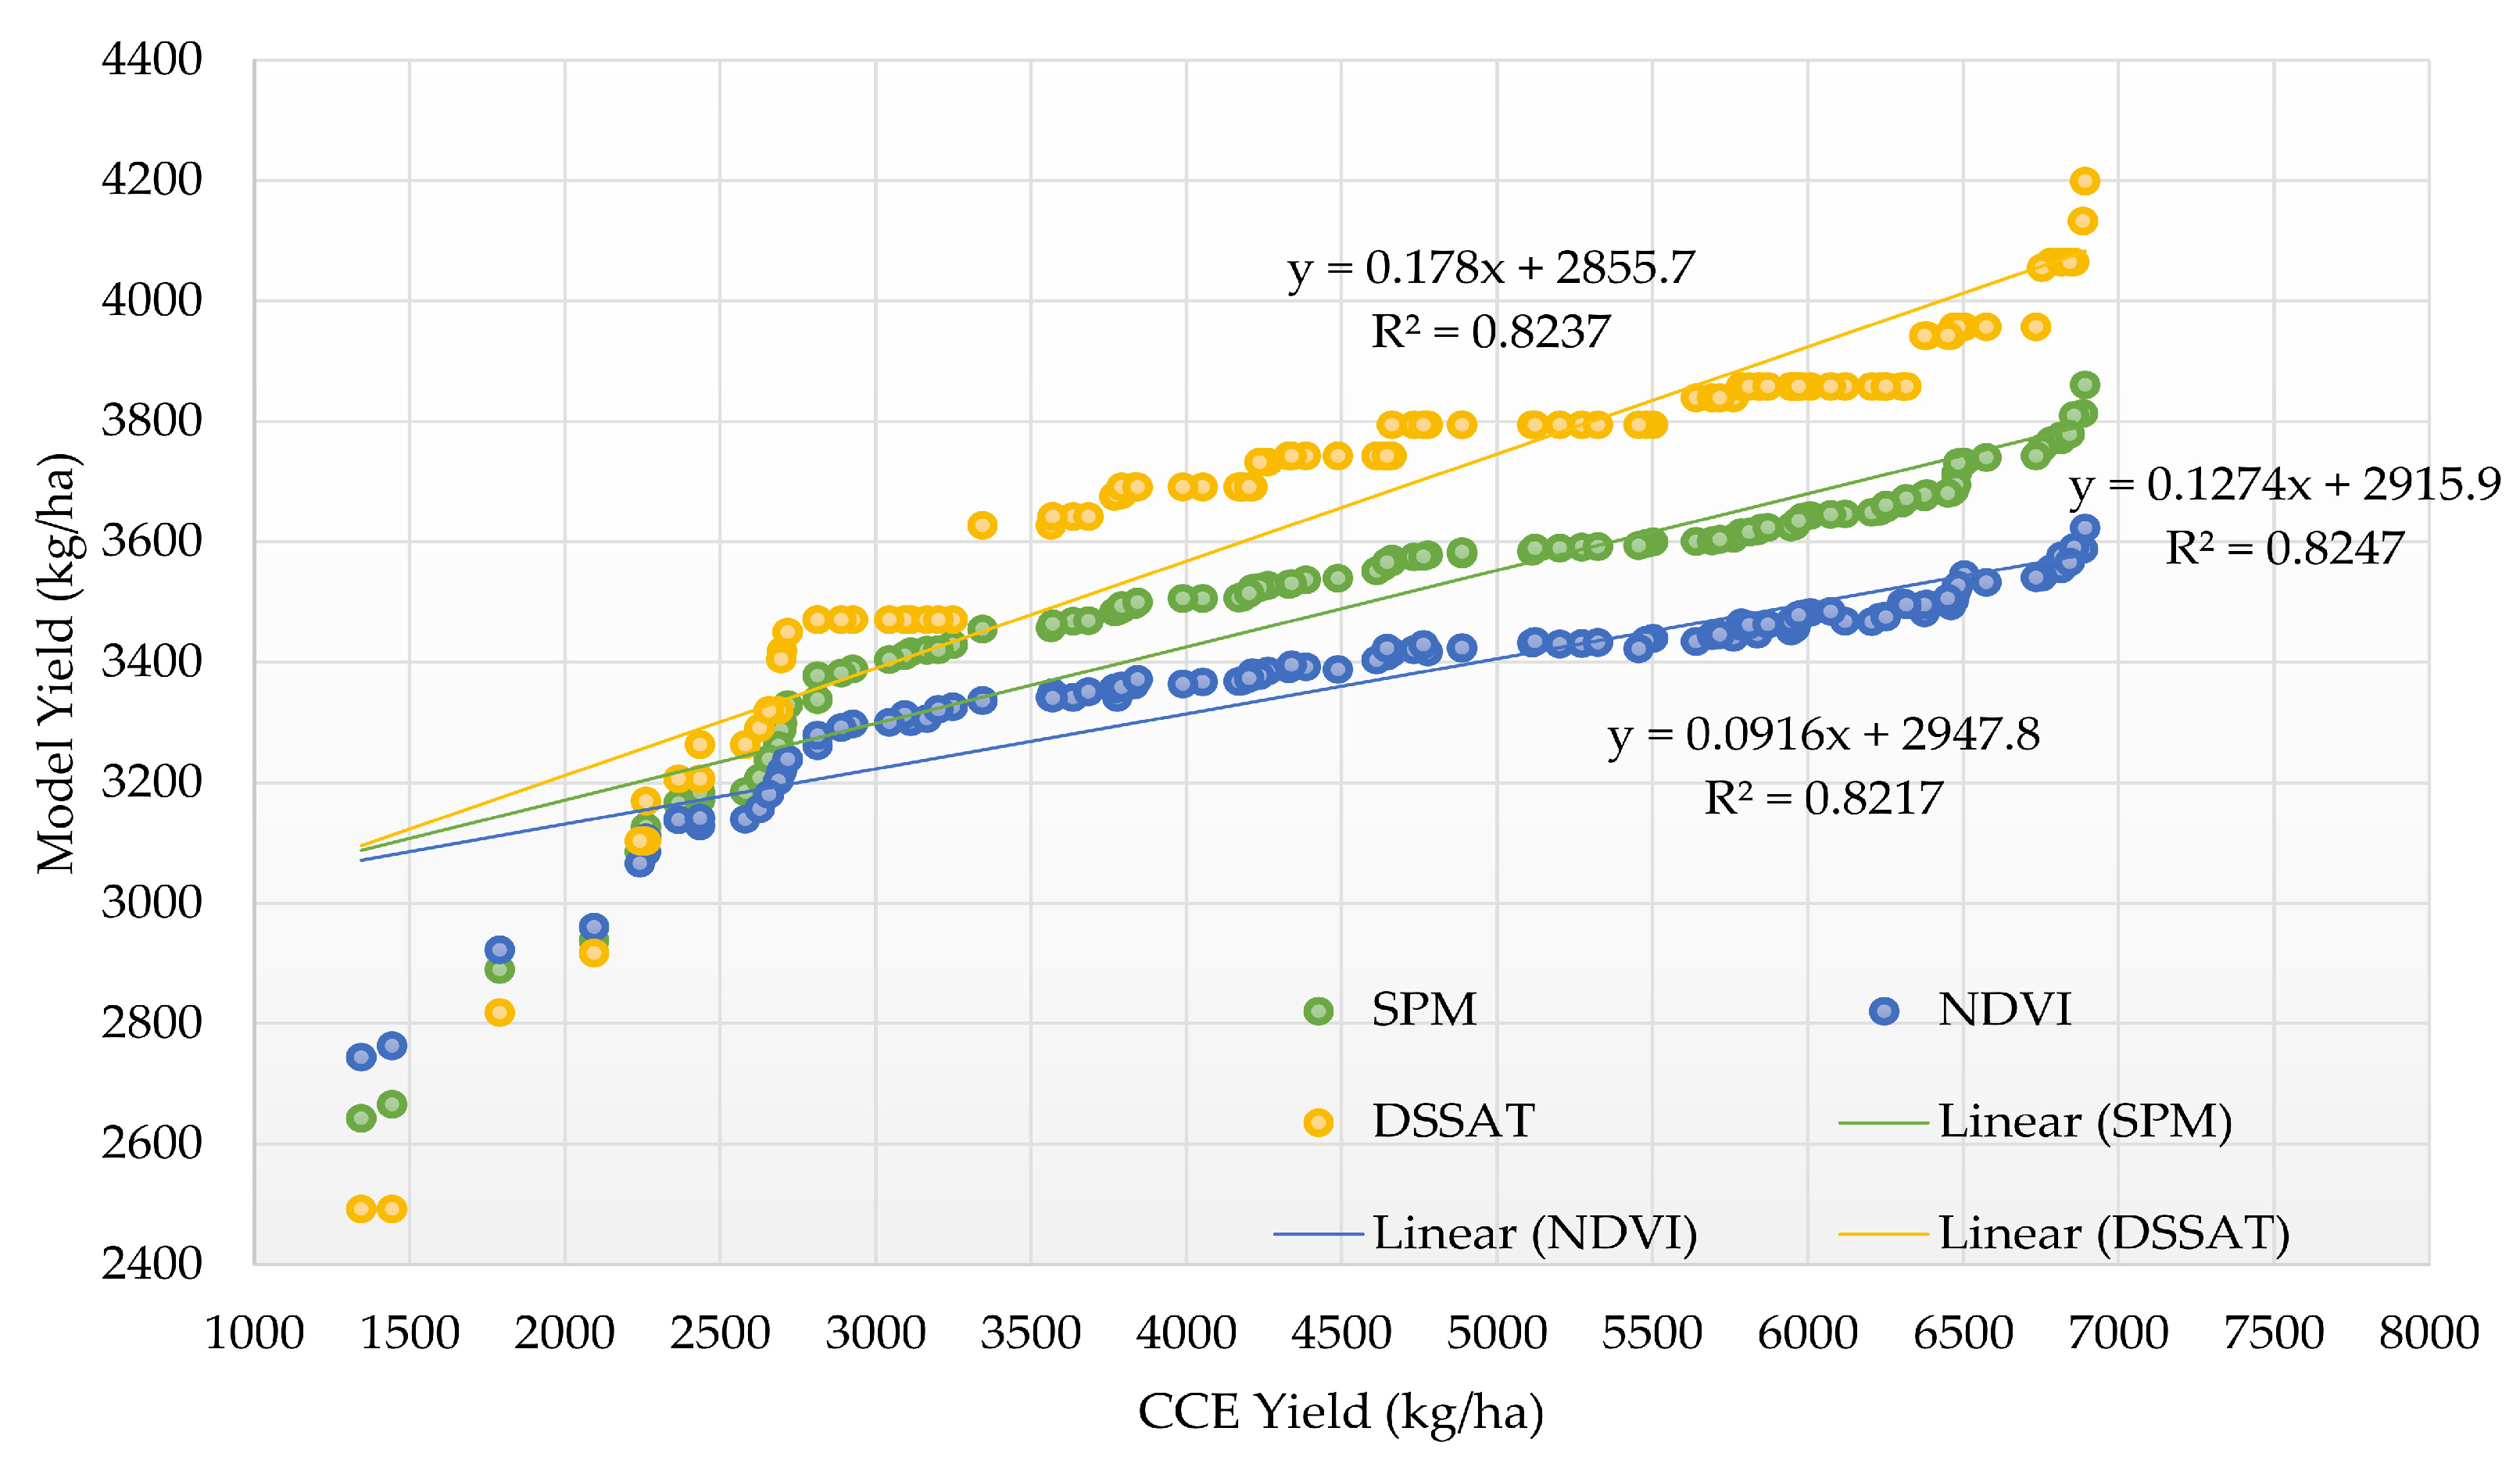
3.5. Comparison between Different Models
4. Conclusions
Author Contributions
Funding
Data Availability Statement
Conflicts of Interest
References
- Benami, E.; Jin, Z.; Carter, M.R.; Ghosh, A.; Hijmans, R.J.; Hobbs, A.; Kenduiywo, B.; Lobell, D.B. Uniting remote sensing, crop modelling and economics for agricultural risk management. Nat. Rev. Earth Environ. 2021, 2, 140–159. [Google Scholar] [CrossRef]
- Ahlawat, A.; Bhat, A.; Gupta, V.; Sharma, M.; Sharma, S.; Rai, S.K.; Singh, S. Market share and promotional approaches of pesticide companies for vegetable crops in jammu district. Int. J. Soc. Sci. 2021, 10, 115–121. [Google Scholar] [CrossRef]
- Ramadas, S.; Kumar, T.K.; Singh, G.P. Wheat production in india: Trends and prospects. In Recent Advances in Grain Crops Research; IntechOpen: London, UK, 2019. [Google Scholar]
- Meraj, G.; Kanga, S.; Ambadkar, A.; Kumar, P.; Singh, S.K.; Farooq, M.; Johnson, B.A.; Rai, A.; Sahu, N. Assessing the yield of wheat using satellite remote sensing-based machine learning algorithms and simulation modeling. Remote Sens. 2022, 14, 3005. [Google Scholar] [CrossRef]
- Vashisth, A.; Krishanan, P.; Joshi, D. Multi stage wheat yield estimation using different model under semi arid region of india. Int. Arch. Photogramm. Remote Sens. Spat. Inf. Sci. 2019, 42, 263–267. [Google Scholar] [CrossRef]
- Gumma, M.K.; Kadiyala, M.; Panjala, P.; Ray, S.S.; Akuraju, V.R.; Dubey, S.; Smith, A.P.; Das, R.; Whitbread, A.M. Assimilation of remote sensing data into crop growth model for yield estimation: A case study from india. J. Indian Soc. Remote Sens. 2022, 50, 257–270. [Google Scholar] [CrossRef]
- Akinseye, F.M.; Birhanu, B.Z.; Ajeigbe, H.A.; Diancoumba, M.; Sanogo, K.; Tabo, R. Impacts of fertilization management strategies on improved sorghums varieties in smallholder farming systems in mali: Productivity and profitability differences. Heliyon 2023, 9, e14497. [Google Scholar] [CrossRef] [PubMed]
- Sarr, A.B.; Sultan, B. Predicting crop yields in senegal using machine learning methods. Int. J. Climatol. 2023, 43, 1817–1838. [Google Scholar] [CrossRef]
- Im, J. Earth observations and geographic information science for sustainable development goals. GIScience Remote Sens. 2020, 57, 591–592. [Google Scholar] [CrossRef]
- Yin, H.; Brandão Jr, A.; Buchner, J.; Helmers, D.; Iuliano, B.G.; Kimambo, N.E.; Lewińska, K.E.; Razenkova, E.; Rizayeva, A.; Rogova, N. Monitoring cropland abandonment with landsat time series. Remote Sens. Environ. 2020, 246, 111873. [Google Scholar] [CrossRef]
- Zhu, L.; Liu, X.; Wu, L.; Tang, Y.; Meng, Y. Long-term monitoring of cropland change near dongting lake, china, using the landtrendr algorithm with landsat imagery. Remote Sens. 2019, 11, 1234. [Google Scholar] [CrossRef]
- Inglada, J.; Arias, M.; Tardy, B.; Hagolle, O.; Valero, S.; Morin, D.; Dedieu, G.; Sepulcre, G.; Bontemps, S.; Defourny, P. Assessment of an operational system for crop type map production using high temporal and spatial resolution satellite optical imagery. Remote Sens. 2015, 7, 12356–12379. [Google Scholar] [CrossRef]
- Tateishi, R.; Hoan, N.T.; Kobayashi, T.; Alsaaideh, B.; Tana, G.; Phong, D.X. Production of global land cover data-glcnmo2008. J. Geogr. Geol. 2014, 6, 99. [Google Scholar] [CrossRef]
- Pittman, K.; Hansen, M.C.; Becker-Reshef, I.; Potapov, P.V.; Justice, C.O. Estimating global cropland extent with multi-year modis data. Remote Sens. 2010, 2, 1844–1863. [Google Scholar] [CrossRef]
- Htitiou, A.; Boudhar, A.; Chehbouni, A.; Benabdelouahab, T. National-scale cropland mapping based on phenological metrics, environmental covariates, and machine learning on google earth engine. Remote Sens. 2021, 13, 4378. [Google Scholar] [CrossRef]
- McCarthy, M.J.; Radabaugh, K.R.; Moyer, R.P.; Muller-Karger, F.E. Enabling efficient, large-scale high-spatial resolution wetland mapping using satellites. Remote Sens. Environ. 2018, 208, 189–201. [Google Scholar] [CrossRef]
- Saini, R.; Ghosh, S. Crop classification on single date sentinel-2 imagery using random forest and suppor vector machine. Int. Arch. Photogramm. Remote Sens. Spat. Inf. Sci. 2018, 42, 683–688. [Google Scholar] [CrossRef]
- Panjala, P.; Gumma, M.K.; Teluguntla, P. Machine learning approaches and sentinel-2 data in crop type mapping. In Data Science in Agriculture and Natural Resource Management; Springer: Singapore, 2022; pp. 161–180. [Google Scholar]
- Gallego, F.J.; Kussul, N.; Skakun, S.; Kravchenko, O.; Shelestov, A.; Kussul, O. Efficiency assessment of using satellite data for crop area estimation in ukraine. Int. J. Appl. Earth Obs. Geoinf. 2014, 29, 22–30. [Google Scholar] [CrossRef]
- Gumma, M.K.; Tummala, K.; Dixit, S.; Collivignarelli, F.; Holecz, F.; Kolli, R.N.; Whitbread, A.M. Crop type identification and spatial mapping using sentinel-2 satellite data with focus on field-level information. Geocarto Int. 2022, 37, 1833–1849. [Google Scholar] [CrossRef]
- Phalke, A.R.; Özdoğan, M. Large area cropland extent mapping with landsat data and a generalized classifier. Remote Sens. Environ. 2018, 219, 180–195. [Google Scholar] [CrossRef]
- Xiong, J.; Thenkabail, P.S.; Tilton, J.C.; Gumma, M.K.; Teluguntla, P.; Oliphant, A.; Congalton, R.G.; Yadav, K.; Gorelick, N. Nominal 30-m cropland extent map of continental africa by integrating pixel-based and object-based algorithms using sentinel-2 and landsat-8 data on google earth engine. Remote Sens. 2017, 9, 1065. [Google Scholar] [CrossRef]
- Gumma, M.K.; Thenkabail, P.S.; Panjala, P.; Teluguntla, P.; Yamano, T.; Mohammed, I. Multiple agricultural cropland products of south asia developed using landsat-8 30 m and modis 250 m data using machine learning on the google earth engine (gee) cloud and spectral matching techniques (SMTs) in support of food and water security. GISci. Remote Sens. 2022, 59, 1048–1077. [Google Scholar] [CrossRef]
- Thenkabail, P.S.; GangadharaRao, P.; Biggs, T.; Krishna, M.; Turral, H. Spectral matching techniques to determine historical land use/land cover (LULC) and irrigated areas using time-series avhrr pathfinder datasets in the krishna river basin, india. Photogramm. Eng. Remote Sens. 2007, 73, 1029–1040. [Google Scholar]
- Lobell, D.B.; Asner, G.P.; Ortiz-Monasterio, J.I.; Benning, T.L. Remote sensing of regional crop production in the yaqui valley, mexico: Estimates and uncertainties. Agric. Ecosyst. Environ. 2003, 94, 205–220. [Google Scholar] [CrossRef]
- Myneni, R.B.; Hoffman, S.; Knyazikhin, Y.; Privette, J.; Glassy, J.; Tian, Y.; Wang, Y.; Song, X.; Zhang, Y.; Smith, G. Global products of vegetation leaf area and fraction absorbed par from year one of modis data. Remote Sens. Environ. 2002, 83, 214–231. [Google Scholar] [CrossRef]
- Thenkabail, P.S.; Nolte, C.; Lyon, J.G. Remote sensing and GIS modeling for selection of a benchmark research area in the inland valley agroecosystems of west and central Africa. Photogramm. Eng. Remote Sens. 2000, 66, 755–768. [Google Scholar]
- Dhillon, A.; Verma, G.K. Convolutional neural network: A review of models, methodologies and applications to object detection. Prog. Artif. Intell. 2020, 9, 85–112. [Google Scholar] [CrossRef]
- Dhillon, M.S.; Dahms, T.; Kuebert-Flock, C.; Rummler, T.; Arnault, J.; Steffan-Dewenter, I.; Ullmann, T. Integrating random forest and crop modeling improves the crop yield prediction of winter wheat and oil seed rape. Front. Remote Sens. 2023, 3, 1010978. [Google Scholar] [CrossRef]
- Kasampalis, D.A.; Alexandridis, T.K.; Deva, C.; Challinor, A.; Moshou, D.; Zalidis, G. Contribution of remote sensing on crop models: A review. J. Imaging 2018, 4, 52. [Google Scholar] [CrossRef]
- Puntel, L.A.; Sawyer, J.E.; Barker, D.W.; Dietzel, R.; Poffenbarger, H.; Castellano, M.J.; Moore, K.J.; Thorburn, P.; Archontoulis, S.V. Modeling long-term corn yield response to nitrogen rate and crop rotation. Front. Plant Sci. 2016, 7, 1630. [Google Scholar] [CrossRef]
- Shahhosseini, M.; Martinez-Feria, R.A.; Hu, G.; Archontoulis, S.V. Maize yield and nitrate loss prediction with machine learning algorithms. Environ. Res. Lett. 2019, 14, 124026. [Google Scholar] [CrossRef]
- Ma, C.; Liu, M.; Ding, F.; Li, C.; Cui, Y.; Chen, W.; Wang, Y. Wheat growth monitoring and yield estimation based on remote sensing data assimilation into the safy crop growth model. Sci. Rep. 2022, 12, 5473. [Google Scholar] [CrossRef]
- Huang, J.; Tian, L.; Liang, S.; Ma, H.; Becker-Reshef, I.; Huang, Y.; Su, W.; Zhang, X.; Zhu, D.; Wu, W. Improving winter wheat yield estimation by assimilation of the leaf area index from landsat tm and modis data into the WOFOST model. Agric. For. Meteorol. 2015, 204, 106–121. [Google Scholar] [CrossRef]
- Huang, J.; Ma, H.; Sedano, F.; Lewis, P.; Liang, S.; Wu, Q.; Su, W.; Zhang, X.; Zhu, D. Evaluation of regional estimates of winter wheat yield by assimilating three remotely sensed reflectance datasets into the coupled WOFOST–prosail model. Eur. J. Agron. 2019, 102, 1–13. [Google Scholar] [CrossRef]
- Nguyen, V.C.; Jeong, S.; Ko, J.; Ng, C.T.; Yeom, J. Mathematical integration of remotely-sensed information into a crop modelling process for mapping crop productivity. Remote Sens. 2019, 11, 2131. [Google Scholar] [CrossRef]
- Zhuo, W.; Fang, S.; Gao, X.; Wang, L.; Wu, D.; Fu, S.; Wu, Q.; Huang, J. Crop yield prediction using modis lai, tigge weather forecasts and WOFOST model: A case study for winter wheat in Hebei, China during 2009–2013. Int. J. Appl. Earth Obs. Geoinf. 2022, 106, 102668. [Google Scholar] [CrossRef]
- Tripathy, R.; Chaudhari, K.N.; Mukherjee, J.; Ray, S.S.; Patel, N.; Panigrahy, S.; Parihar, J.S. Forecasting wheat yield in punjab state of india by combining crop simulation model WOFOST and remotely sensed inputs. Remote Sens. Lett. 2013, 4, 19–28. [Google Scholar] [CrossRef]
- Bannayan, M.; Crout, N.; Hoogenboom, G. Application of the CERES-wheat model for within-season prediction of winter wheat yield in the united kingdom. Agron. J. 2003, 95, 114–125. [Google Scholar]
- Liu, Z.; Xu, Z.; Bi, R.; Wang, C.; He, P.; Jing, Y.; Yang, W. Estimation of winter wheat yield in arid and semiarid regions based on assimilated multi-source sentinel data and the CERES-wheat model. Sensors 2021, 21, 1247. [Google Scholar] [CrossRef] [PubMed]
- Nain, A.; Dadhwal, V.; Singh, T. Use of CERES-wheat model for wheat yield forecast in central indo-gangetic plains of India. J. Agric. Sci. 2004, 142, 59–70. [Google Scholar] [CrossRef]
- Nearing, G.S.; Crow, W.T.; Thorp, K.R.; Moran, M.S.; Reichle, R.H.; Gupta, H.V. Assimilating remote sensing observations of leaf area index and soil moisture for wheat yield estimates: An observing system simulation experiment. Water Resour. Res. 2012, 48, W05525. [Google Scholar] [CrossRef]
- Krishnan, P.; Sharma, R.; Dass, A.; Kukreja, A.; Srivastav, R.; Singhal, R.J.; Bandyopadhyay, K.; Lal, K.; Manjaiah, K.; Chhokar, R. Web-based crop model: Web infocrop–wheat to simulate the growth and yield of wheat. Comput. Electron. Agric. 2016, 127, 324–335. [Google Scholar] [CrossRef]
- Rodriguez, J.; Duchemin, B.; Hadria, R.; Watts, C.; Garatuza, J.; Chehbouni, G.; Khabba, S.; Boulet, G.; Palacios, E.; Lahrouni, A. Wheat yield estimation using remote sensing and the STICS model in the semiarid Yaqui valley, Mexico. Agronomie 2004, 24, 295–304. [Google Scholar] [CrossRef]
- Bouras, E.; Olsson, P.-O.; Thapa, S.; Díaz, J.M.; Albertsson, J.; Eklundh, L. Wheat yield estimation at high spatial resolution through the assimilation of sentinel-2 data into a crop growth model. Remote Sens. 2023, 15, 4425. [Google Scholar] [CrossRef]
- Guo, C.; Zhang, L.; Zhou, X.; Zhu, Y.; Cao, W.; Qiu, X.; Cheng, T.; Tian, Y. Integrating remote sensing information with crop model to monitor wheat growth and yield based on simulation zone partitioning. Precis. Agric. 2018, 19, 55–78. [Google Scholar] [CrossRef]
- Jones, J.; Hoogenboom, G.; Porter, C.; Boote, K.; Batchelor, W.; Hunt, L.; Ritchie, J. The DSSAT cropping system model. Eur. J. Agron. 2003, 18, 235–265. [Google Scholar] [CrossRef]
- Hoogenboom, G.; Jones, J.; Wilkens, P.; Porter, C.; Batchelor, W.; Hunt, L.; Boote, K.; Singh, U.; Uryasev, O.; Bowen, W. Decision Support System for Agrotechnology Transfer Version 4.0; University of Hawaii: Honolulu, HI, USA, 2004. [Google Scholar]
- Timsina, J.; Godwin, D.; Humphreys, E.; Kukal, S.; Smith, D. Evaluation of options for increasing yield and water productivity of wheat in punjab, india using the DSSAT-CSM-CERES-wheat model. Agric. Water Manag. 2008, 95, 1099–1110. [Google Scholar] [CrossRef]
- Thorp, K.R.; Hunsaker, D.J.; French, A.N. Assimilating leaf area index estimates from remote sensing into the simulations of a cropping systems model. Trans. ASABE 2010, 53, 251–262. [Google Scholar] [CrossRef]
- Dettori, M.; Cesaraccio, C.; Motroni, A.; Spano, D.; Duce, P. Using CERES-wheat to simulate durum wheat production and phenology in southern Sardinia, Italy. Field Crops Res. 2011, 120, 179–188. [Google Scholar] [CrossRef]
- Dwivedi, M.; Saxena, S.; Ray, S. Assessment of rice biomass production and yield using semi-physical approach and remotely sensed data. Int. Arch. Photogramm. Remote Sens. Spat. Inf. Sci. 2019, 42, 217–222. [Google Scholar] [CrossRef]
- Pazhanivelan, S.; Geethalakshmi, V.; Tamilmounika, R.; Sudarmanian, N.; Kaliaperumal, R.; Ramalingam, K.; Sivamurugan, A.; Mrunalini, K.; Yadav, M.K.; Quicho, E.D. Spatial rice yield estimation using multiple linear regression analysis, semi-physical approach and assimilating sar satellite derived products with DSSAT crop simulation model. Agronomy 2022, 12, 2008. [Google Scholar] [CrossRef]
- Tripathy, R.; Chaudhary, K.; Nigam, R.; Manjunath, K.; Chauhan, P.; Ray, S.; Parihar, J. Operational semi-physical spectral-spatial wheat yield model development. Int. Arch. Photogramm. Remote Sens. Spat. Inf. Sci. 2014, 40, 977–982. [Google Scholar] [CrossRef]
- Attri, S.; Tyagi, A. Climate Profile of India; Environment Monitoring and Research Center, India Meteorology Department: New Delhi, India, 2010. [Google Scholar]
- Jha, M.N.; Kumar, A.; Dubey, S.; Pandey, A. Yield estimation of rice crop using semi-physical approach and remotely sensed data. In Geospatial Technologies for Resources Planning and Management; Springer: Berlin/Heidelberg, Germany, 2022; pp. 331–349. [Google Scholar]


| S.no | Class | Area (ha) |
|---|---|---|
| 1 | Wheat | 183,930 |
| 2 | Other Crops | 85,939 |
| 3 | Water bodies | 3195 |
| 4 | Built-up | 13,795 |
| 5 | Other LULCs | 91,523 |
Disclaimer/Publisher’s Note: The statements, opinions and data contained in all publications are solely those of the individual author(s) and contributor(s) and not of MDPI and/or the editor(s). MDPI and/or the editor(s) disclaim responsibility for any injury to people or property resulting from any ideas, methods, instructions or products referred to in the content. |
© 2024 by the authors. Licensee MDPI, Basel, Switzerland. This article is an open access article distributed under the terms and conditions of the Creative Commons Attribution (CC BY) license (https://creativecommons.org/licenses/by/4.0/).
Share and Cite
Gumma, M.K.; Nukala, R.M.; Panjala, P.; Bellam, P.K.; Gajjala, S.; Dubey, S.K.; Sehgal, V.K.; Mohammed, I.; Deevi, K.C. Optimizing Crop Yield Estimation through Geospatial Technology: A Comparative Analysis of a Semi-Physical Model, Crop Simulation, and Machine Learning Algorithms. AgriEngineering 2024, 6, 786-802. https://doi.org/10.3390/agriengineering6010045
Gumma MK, Nukala RM, Panjala P, Bellam PK, Gajjala S, Dubey SK, Sehgal VK, Mohammed I, Deevi KC. Optimizing Crop Yield Estimation through Geospatial Technology: A Comparative Analysis of a Semi-Physical Model, Crop Simulation, and Machine Learning Algorithms. AgriEngineering. 2024; 6(1):786-802. https://doi.org/10.3390/agriengineering6010045
Chicago/Turabian StyleGumma, Murali Krishna, Ramavenkata Mahesh Nukala, Pranay Panjala, Pavan Kumar Bellam, Snigdha Gajjala, Sunil Kumar Dubey, Vinay Kumar Sehgal, Ismail Mohammed, and Kumara Charyulu Deevi. 2024. "Optimizing Crop Yield Estimation through Geospatial Technology: A Comparative Analysis of a Semi-Physical Model, Crop Simulation, and Machine Learning Algorithms" AgriEngineering 6, no. 1: 786-802. https://doi.org/10.3390/agriengineering6010045
APA StyleGumma, M. K., Nukala, R. M., Panjala, P., Bellam, P. K., Gajjala, S., Dubey, S. K., Sehgal, V. K., Mohammed, I., & Deevi, K. C. (2024). Optimizing Crop Yield Estimation through Geospatial Technology: A Comparative Analysis of a Semi-Physical Model, Crop Simulation, and Machine Learning Algorithms. AgriEngineering, 6(1), 786-802. https://doi.org/10.3390/agriengineering6010045