Article

Design of an Internet of Things (IoT)-Based Photosynthetically Active Radiation (PAR) Monitoring System

1
Department of Biosystems and Agricultural Engineering, Michigan State University, East Lansing, MI 48824, USA
2
Michigan Department of Transportation, Lansing, MI 48933, USA
*
Author to whom correspondence should be addressed.
AgriEngineering 2024, 6(1), 773-785; https://doi.org/10.3390/agriengineering6010044
Submission received: 10 December 2023 / Revised: 3 March 2024 / Accepted: 6 March 2024 / Published: 8 March 2024

Abstract

:
Photosynthetically Active Radiation (PAR) is an important parameter in the plant photosynthesis process, which can relate to plant growth, crop water use, and leaf gas exchange. Previously, many researchers utilized commercially available sensors to monitor PAR. The high cost of the commercially available PAR sensors has limited researchers, agricultural professionals, and farmers to use and expand PAR monitoring in agricultural lands. Thus, this paper focuses on designing an affordable Internet of Things (IoT)-based PAR sensor monitoring system including 3D-printed enclosures (waterproof) for the sensors, performance evaluation of multiple light sensors, solar powering configuration, cloud setup, and cost analysis. Three sensors, including VTB8440BH photodiode, SI 1145, and LI-190R sensors, were evaluated. The 3D-printed waterproof enclosures were designed for the photodiode and SI 1145. Particle Boron was used for recording and sending the sensor data to the IoT webserver. Both the photodiode and SI 1145 were compared to LI-190R, which is the industry standard. In the calibration process, the R2 values of the photodiode and SI 1145 with LI-190R were 0.609 and 0.961, respectively. Field validation data shows that SI 1145 had a strong correlation with LI-190R. In addition, the performance evaluation data shows the photodiode had a weaker correlation with LI-190R than SI 1145. In conclusion, the study successfully developed and designed affordable and reliable IoT-based PAR sensor monitoring systems, including a 3D-printed housing, hardware, programming, and IoT website. SI 1145 with a glass filter is an alternative sensor to monitor PAR at a low cost and has the advantage of being connected to IoT microcontrollers.

1. Introduction

Photosynthetically Active Radiation (PAR) describes the range of solar radiation that is used by organisms in the photosynthesis process. The wavelength of solar radiation in the PAR range is 400–700 nm. PAR measurement is important, as solar radiation is one of the main components determining plant photosynthesis. When leaf photosynthesis increases, PAR increases [1]. Standard commercially available PAR sensors include LI-190R (LI-COR, Inc., Lincoln, NE, USA) and Apogee SQ-500 (Apogee Instruments, Inc., Logan, UT, USA). In the past, PAR sensors have been used in various research, such as measuring the amount of light above and below the canopy of wheat [2]; monitoring light in vertical farming for strawberry production [3]; measuring and controlling a lighting system for energy efficient crop production [4]; parameterizing evapotranspiration rates across a field of asparagus [5]; assessing the effects of full sun, medium light intensity, and vegetation shade on diverse species of plants [6]; and understanding the effect of PAR on the exchange of CO2, water, and energy between plants and their environment [7]. An example of using a PAR sensor is estimating the growth of soybeans. Soybeans, a known photosensitive crop, have been used to test PAR levels in accordance with simulated surface dimming, a way to decrease photosynthetically active radiation. A study within the Journal of Agrometeorology took three genomes of soybeans and tested their response to altered PAR levels via a custom shading net [8]. The study was done to find the best way to decrease PAR levels, which they tested using a Line quantum sensor (LI-191S, LICOR). Even though it has been stated that climate change will not have a major impact on PAR levels [9], it can be predicted that levels will change. These changes, however, are more impacted by local environmental factors, with its main parameter being water vapor pressure. Excessive gas emissions can also cause PAR levels to lower due to an increase in particulate matter in the atmosphere [9], thus absorbing more PAR prior to reaching the Earth’s surface.
The cost of the standard PAR sensor is between 400–500 USD, and the datalogging system cost ranges from 500–2300 USD. This high cost of the commercial version of the PAR monitoring systems, including a PAR sensor and a datalogger, limits access for researchers, farmers, and agricultural professionals. This motivates the development of a low-cost version of a PAR monitoring system. The presentation of a low-cost, low-profile Photosynthetic Active Radiation sensor that was developed by Purdue University was first introduced at the ISCAS conference in Spain [10]. This sensor’s composition includes a silicon photodiode, a 400 to 700 nm optical filter, an optical diffuser, and a current-to-voltage conversion circuit. The translucent material of the diffuser disperses incoming light, which results in angle dependence. To amend this occurrence, the light diffuser uses a cosine corrector. There are various commercially available PAR quantum sensors, such as the LI-190R. While these sensors are very precise and well-calibrated, they are quite costly. Seated in the USD 300–400 price range, this does not include the corresponding meter required to display the output. Meanwhile, this newly developed low-cost PAR sensor has a total cost of half the amount: 111.83 USD.Light intensity is the factor contributing to the level of error displayed by this sensor. For the highest accuracy, light intensity must be at maximum intensity. Similar to the sensor developed by Purdue University, the GaAsP sensor has a sensor head and body that includes a photodiode and an acrylic diffuser that protects the photodiode. This provides cosine correction, like the sensor developed by Purdue University. Also, this sensor comprises an aluminum tube, a drainage hole, and an acrylic body located below the diffuser bonded via methylene chloride. For quick connection and disconnection for calibration and repair in a field setting, the sensor was designed with 40–50 cm of multi-stranded communication wire. The GaAsP does have some sources of error, including spatial error, temperature dependence error, spectral response error, and signal drift error. Spatial error is the main source of errors, but it can be minimized if both the diffuser and photodiode are level with the outer rim of the sensor. Temperature dependence error occurs when temperatures reach levels above 15 °C, at a 3% margin. Previously, researchers developed an inexpensive datalogging system and connected it to a commercial version of a PAR sensor. For example, Barnard et al. (2014) utilized an Arduino microcontroller (Arduino, Turin, Italy) as a datalogger to read an LI-190 [11]. Harun et al. (2015) used an ATMEGA628 microcontroller (Microchip, Chandler, AZ, USA) to read an LI-190 [12]. An inexpensive data logging system with a commercial version of a PAR sensor still costs around 700 USD [11].
Other studies have developed a low-cost PAR sensor using a photodiode. For instance, the Vishay BPW34 photodiode (Vishay, Malvern, PA, USA) was used to measure PAR [13]. This design used a silicon photodiode, a diffuser, and an optical filter. This study found that the sensor measured PAR well at high light intensities, but had a larger error at lower light intensities. Pontailler (1990) also used a gallium arsenide photodiode to measure PAR [14]. This design did not use a filter, only the photodiode and a diffuser. The results show a good correlation with the LI-190 PAR sensor, but it overestimated by about 23% when measuring monochromatic light, which is in the wavelength range of 570–620 nm, one example of light that produces this wavelength range is sodium lamps. The University of England carried out a case study centered around triticale, where the methodology for measuring the fraction of absorbed photosynthetically active radiation (fAPAR) using both active optical and linear irradiance sensors was described [15]. This measure of PAR is an important aspect of plant biomass production and plant growth modeling. The linear irradiance sensor newly created by Spectrum Technologies was studied and applied to agriculture through the crop triticale. The conclusion of this study emphasized the importance of sensor placement and solar illumination conditions. The linear quantum bar sensor was used to measure soil and canopy PAR (Rs and Rcs) but needed to be positioned at least 40 cm above the intended surface. It was explained that the linear quantum bar could achieve temporally stable readings within an elevation of 5° of solar noon. Also recommended was orienting the linear quantum sensor across rows to reduce measurement variance. There have also been methods to measure PAR using leaf area index measuring tools. Located in West Africa, a study focusing on millet crop and shrub fallow used this method for estimating the Intercepted PAR (IPAR). The Li-Coy LAI-2000 hemispherical radiation sensor is a sensor originally intended to estimate the canopy leaf area index. The LAI provides both canopy structure and angular information, allowing for a more efficient manner to measure these values compared to traditional methods. These methods allowed for a successful simulation of both instantaneous and daily IPAR. Results showed that a reasonable degree of accuracy can be achieved by using the LAI-2000. A noteworthy mention explains that both clear and cloudy days lead to increased errors [16]. Previous research shows an improvement in the design and development of a PAR sensor monitoring system is needed.
As technology has developed, the IoT (Internet of Things) allows for connecting, monitoring, and controlling devices in real-time at a low cost [17]. Examples of many different applications for IoT have been implemented by growers in various countries for increased efficiency. Increased cost efficiency, energy efficiency, and work efficiency are all areas of benefit when utilizing the IoT in agriculture. Data transmission efficiency was studied in a review by Xu et al. (2022) on different methods for data transmission for the IoT in agriculture [18]. Various tradeoffs exist in terms of IoT data-sharing systems. These include Wi-Fi, LoRa, Bluetooth, and WAN wireless; these systems are readily available for implementation depending on the needs of the producer [18]. This exemplifies the customization that IoT has to offer the industry as well as academia to outfit a system to the exact specifications needed. An increase in customization and optimization undoubtedly increases the user experience as well as ensures that each system is only using what is needed for a given project. An example of this was the ZigBee WSN (wireless sensor network) optimized for medium-range usage within a large greenhouse space for humidity and fan monitoring using nodes [19]. This system utilized in the study demonstrates the basics of how an IoT network can store data and, furthermore, allows for it to be transported to the correct location. In addition to ZigBee, LoRa and Wi-Fi are also utilized to transfer the data and signals to drive actuators at a low cost [20]. Emerging communication technologies, including 5G and NB-IoT (narrow-band IoT), have started to be implemented in precision agriculture [21]. By 2026, the IoT market is expected to achieve an evaluation of USD 13 billion [22]. While the costs of the IoT for usage in precision farming may increase growers’ operating costs, the savings generated from time usage efficiency negate upfront costs. For example, in 2022, a system to monitor indoor environment data using IoT and open-source software was able to see a cost reduction from 230,000 USD to 5000 USD for a 9290 m2 building using a traditional BAS (Building Assessment System), establishing a cost-effective, scalable, and portable IoT data infrastructure for indoor environment sensing named BDL (Building Data Lite) [23]. By creating a cost-effective system for IoT data measurement, the design team was able to save thousands of dollars on a monitoring system. The usage of open-source software should be noted also as this is becoming an increasingly popular method to drive down costs and increase system sharing [24]. IoT creations and optimizations are changing the operating landscape in which humans monitor the world. By creating systems that are more cost-effective, saleable, and connect more seamlessly, a natural trend of increasing profits will follow, barring no other unforeseen circumstances. As the cost of the IoT system decreases, the IoT technology has been utilized in many applications in agriculture, including plant disease prediction, frost protection, and irrigation scheduling [25,26]. This led to an increase in crop yields and quality [12,27,28]. The use of IoT technology in agriculture is expected to increase further as other previous studies have demonstrated its benefits in helping stakeholders make timely and informed decisions [29].
Over the years, many open-source photodiodes and light sensors have been developed. However, the evaluation and their potential use for PAR monitoring with a glass-cut filter have not been demonstrated. Moreover, making the PAR data more accessible through the IoT has not been well executed. Thus, the purpose of this paper focuses on the design and development of an affordable IoT-based PAR monitoring system, including 3D-printed enclosures (waterproof) for the sensors, performance evaluation of each sensor, solar powering configuration, cloud setup, and cost. This affordable IoT-based PAR sensor monitoring system will make the PAR measurements more accessible to researchers, farmers, agricultural industries, and environmental scientists.

2. Materials and Methods

2.1. PAR Sensors

Three sensors were evaluated: an Excelitas Technologies VTB8440BH photodiode (Waltham, MA, USA); an Adafruit SI 1145 Digital UV Index, IR, and Visible Light Sensor (New York, NY, USA); and LI-190R PAR sensor (Lincoln, NE, USA). The LI-190R outputs millivolts but can be converted to μmol m−2 s−1 using Equation (1), which was referred to by LI-Cor Biosciences technical document. LI-190R has a spectral range of 400–700 nm.
The VTB8440BH photodiode has a spectral range of 330–720 nm and a viewing angle of 100°. The SI 1145 has an IR and a visible light sensor; the IR sensor has a spectral range of 550–1000 nm, and the visible light sensor has a spectral range of 400–800 nm. In this study, the visible light sensor of SI 1145 was used because it has a spectral range closer to that of PAR (400–700 nm).
P A R = V o u t 240.33
where PAR is the PAR reading in μmol m−2 s−1, and Vout is the output from the LI-190R in mV.

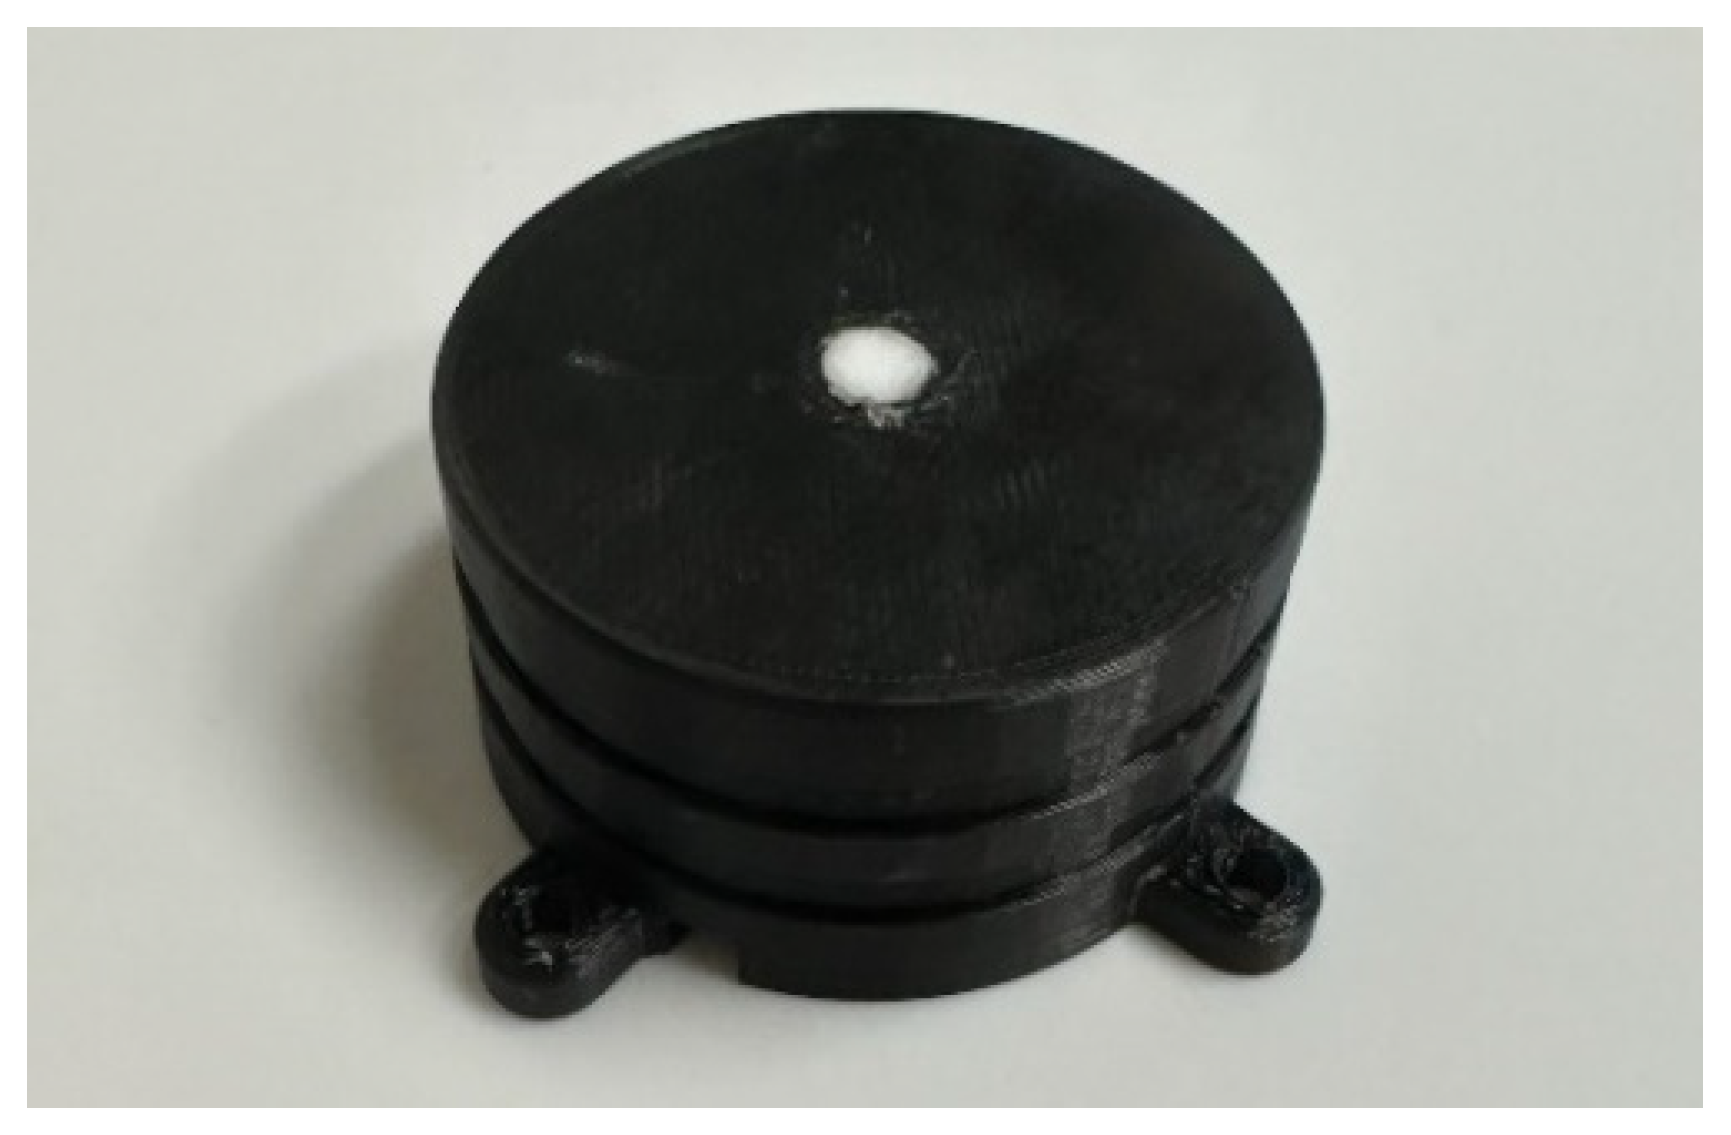
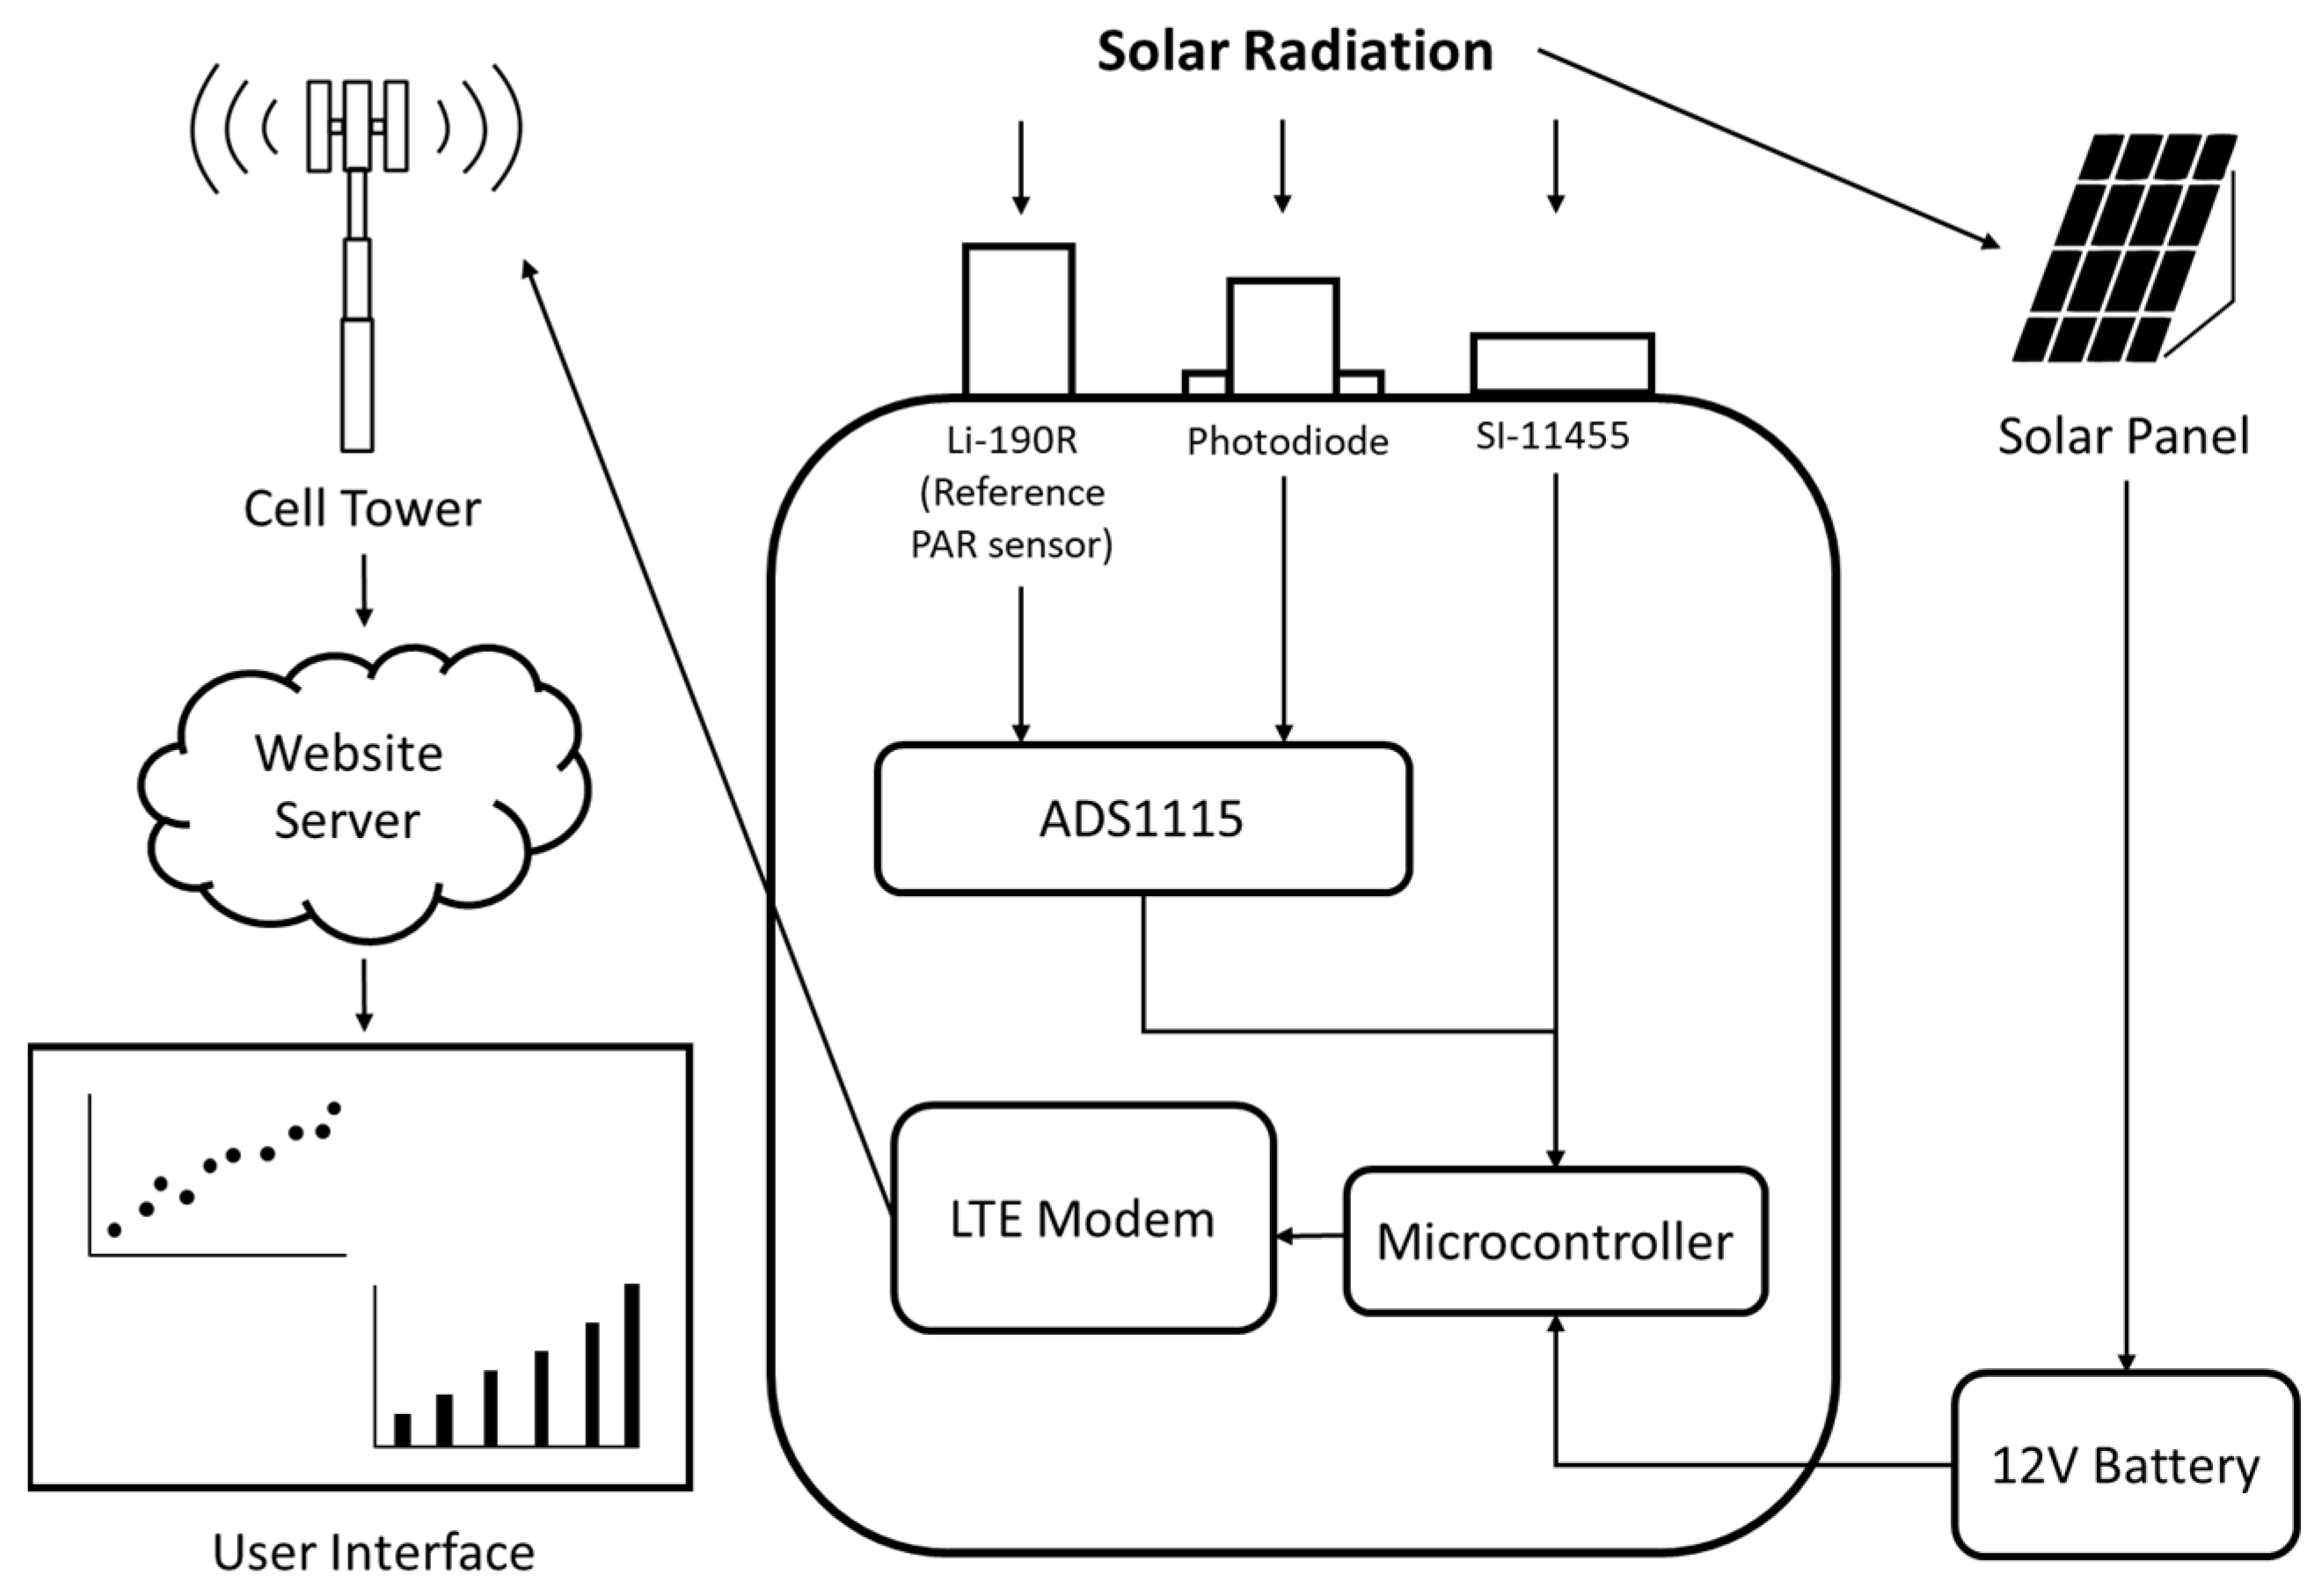
2.2. Hardware Design

For the photodiode and the LI-190R circuit, an Adafruit ADS 1115 analog-to-digital converter (New York, NY, USA) was used to read the sensor values in 16 bits, which allows for higher resolution measurement. A differential reading was used for each measurement, which takes a reading using two pins from each sensor. The circuit was controlled by a Particle Boron (San Francisco, CA, USA) microcontroller [30], and it has an embedded 4G LTE cell modem to send the data to the IoT cloud web server. I2C communication in Boron was utilized to connect it with ADS 1115 and SI 1145. Particle Boron 4G LTE was selected in this study due to the availability of the device, but any other microcontrollers with 4G or 5G technology can also be utilized for data logging. Both the photodiode and the SI 1145 are sensitive to light outside of the PAR spectral range. Thus, an optical UV AR IR glass-cut filter (Gzikai, Guangzhou, China) was used to filter out light outside of PAR spectral range. The optical glass-cut filter allows light between 415 nm and 655 nm to pass through (Figure 1). The filter has a diameter of 6.5 mm and is 1 mm thick. The filters used in this design were 5 USD. A polytetrafluoroethylene (PTFE) sheet (CGjiogujio, Nanjing, China) was used to diffuse the light entering the glass filter and sensor. The sheet is 2 mm thick, and a 7 mm circular section was cut using a cork borer. The PTFE sheet sits directly on top of the glass filter, and there is a 2 mm gap between the glass filter and the light sensor for both the photodiode and the SI 1145. A layout of the sensor, a glass filter, and a PTFE sheet is shown in Figure 2.
An enclosure was designed and 3D-printed for the photodiode and the SI 1145. The design was made using Thinkercad (Autodesk Inc., San Francisco, CA, USA) software and printed with the MakerBot Replicator 2 3D printer (New York, NY, USA). The enclosure consists of two pieces: one piece allows for the glass filter and PTFE sheet to be set in place and has a cut-out for either the photodiode or the SI 1145. The other piece is a plate that attaches four bolts and nuts. The pieces were printed using polylactic acid (PLA). The groove of the enclosure allows the use of a cable tie to mount the enclosure to a pipe or a post. The enclosure was made waterproof by using a clear silicone caulk at each of the openings. The drawing for the enclosure is shown in Figure 3 and printed enclosure is shown in Figure 4.
To use the PAR sensor monitoring system (Particle Boron and PAR sensor) in outdoor conditions, a lead–acid 12 V 7 Ah battery, a solar charge controller, and a 12 V 20 W solar panel were used to power the devices. An IP67 waterproof enclosure (290 × 190 × 140 mm) was used to house Boron, solar charge controller, and a lead–acid 12 V 7 Ah battery. Overall diagram of the affordable PAR sensor monitoring system is shown in Figure 5.

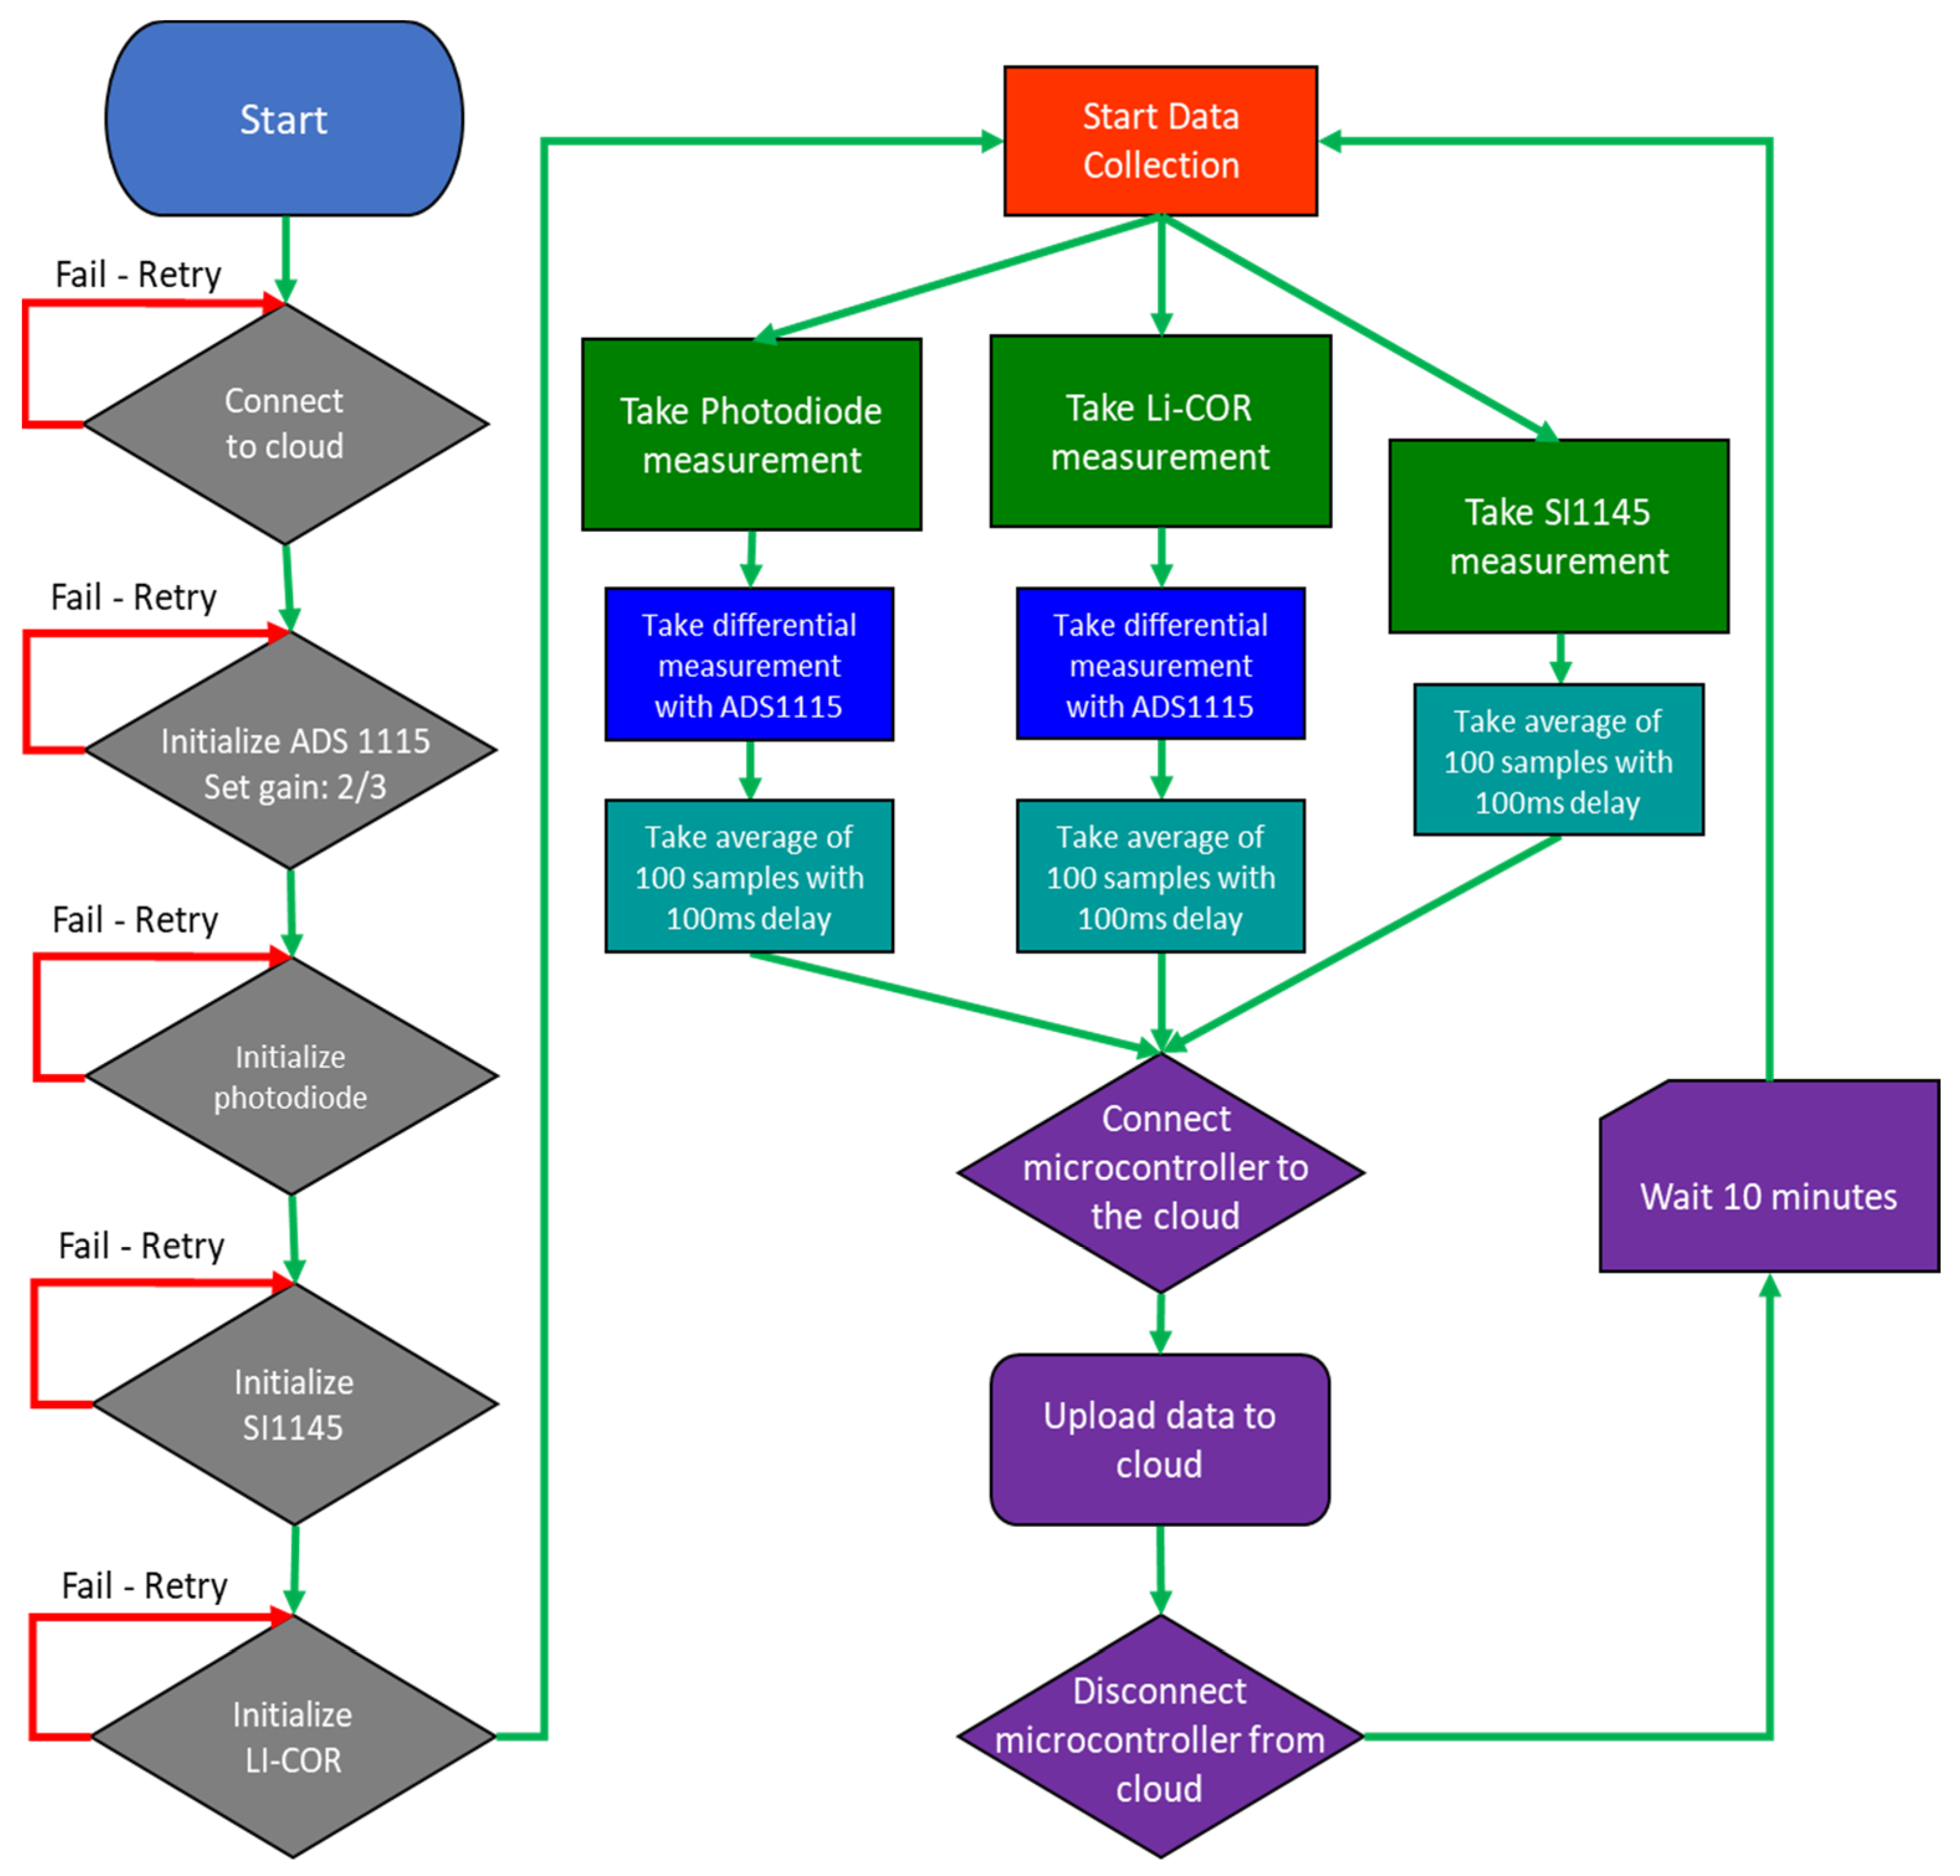
2.3. IoT and Program Design

The three sensors were connected to Particle Boron to measure, record, and send the values to Ubidots IoT webserver [31]. Sensor data is stored on Ubidots as raw variables. Synthetic variable function on Ubidots allows users to enter equations to solve mathematical problems on the cloud. The instructions of functions are provided on Ubidots manual. This synthetic variable function was used to enter each developed calibration equation for photodiode and SI 1145 in Ubidots to calculate the estimated radiation values. Ubidots allow storing the data for up to 2 years. The dashboard on the website allows user to display the data in an easy-to-understand and effective way (Figure 6). The data is updated every 10 min and allows real-time data monitoring. The 10 min time interval was chosen to minimize battery loss. When the sensors were not reading, the 4G modem module was deactivated. The flow of the microcontroller programming is shown in Figure 7. In the program, the Boron only connects with the cell tower when it sends the value to Ubidots. This allows for saving data usage and battery. For each sensor, 100 samples were taken with a 100-millisecond delay from each measurement, and then the average was recorded.

2.4. Sensor Calibration

The sensors were compared using a full-spectrum light-intensity controllable 1000 W LED grow light (Viparspectra, Richmond, CA, USA). This experiment was conducted in a controlled environment. The three sensors were all placed 12.5 cm from the light and were taking readings simultaneously. The intensity of the light was increased at different intervals ranging from off to maximum intensity. The reading from each of the sensors was recorded at each of these intervals and compared.

2.5. Sensor Evaluation in Outdoor Environments

Three sensors, LI-190R, photodiode, and SI 1145, were installed outside at Michigan State University Campus, East Lansing, MI, USA. The sensors were at a height of 203 cm and mounted on a 5.08 cm diameter PVC pipe with a cable tie. There were no obstructions affecting the path from sunlight to each sensor. A 12 V 20 W solar panel and a solar charge controller were used to charge a lead–acid 12 V 7 Ah battery. Particle boron was powered through the micro-USB port. Each sensor data was collected every 10 min and sent to the Ubidots webserver.

2.6. Statistical Analysis

To evaluate the performance of the proposed affordable PAR sensor designs, the measurements were compared against the LI-190R PAR sensor. Statistical analysis was performed using root mean squared error (RMSE), index of agreement (IA), mean bias error (MBE), and coefficient of determination (R2), and used Microsoft Excel for calculation. RMSE measures the difference between the measured and predicted value and is defined in Equation (2), IA is defined in Equation (3), and MBE is defined in Equation (4).
R M S E = 1 N i = 1 N ( M i P i ) 2
I A = 1 i = 1 N ( M i P i ) 2 i = 1 N ( P i M ¯ + M i M ¯ ) 2
M B E = 1 N i = 1 N ( P i M i )
where N is sample size; M is measured value; P is predicted value; and M ¯ is average measured value.

3. Results and Discussion

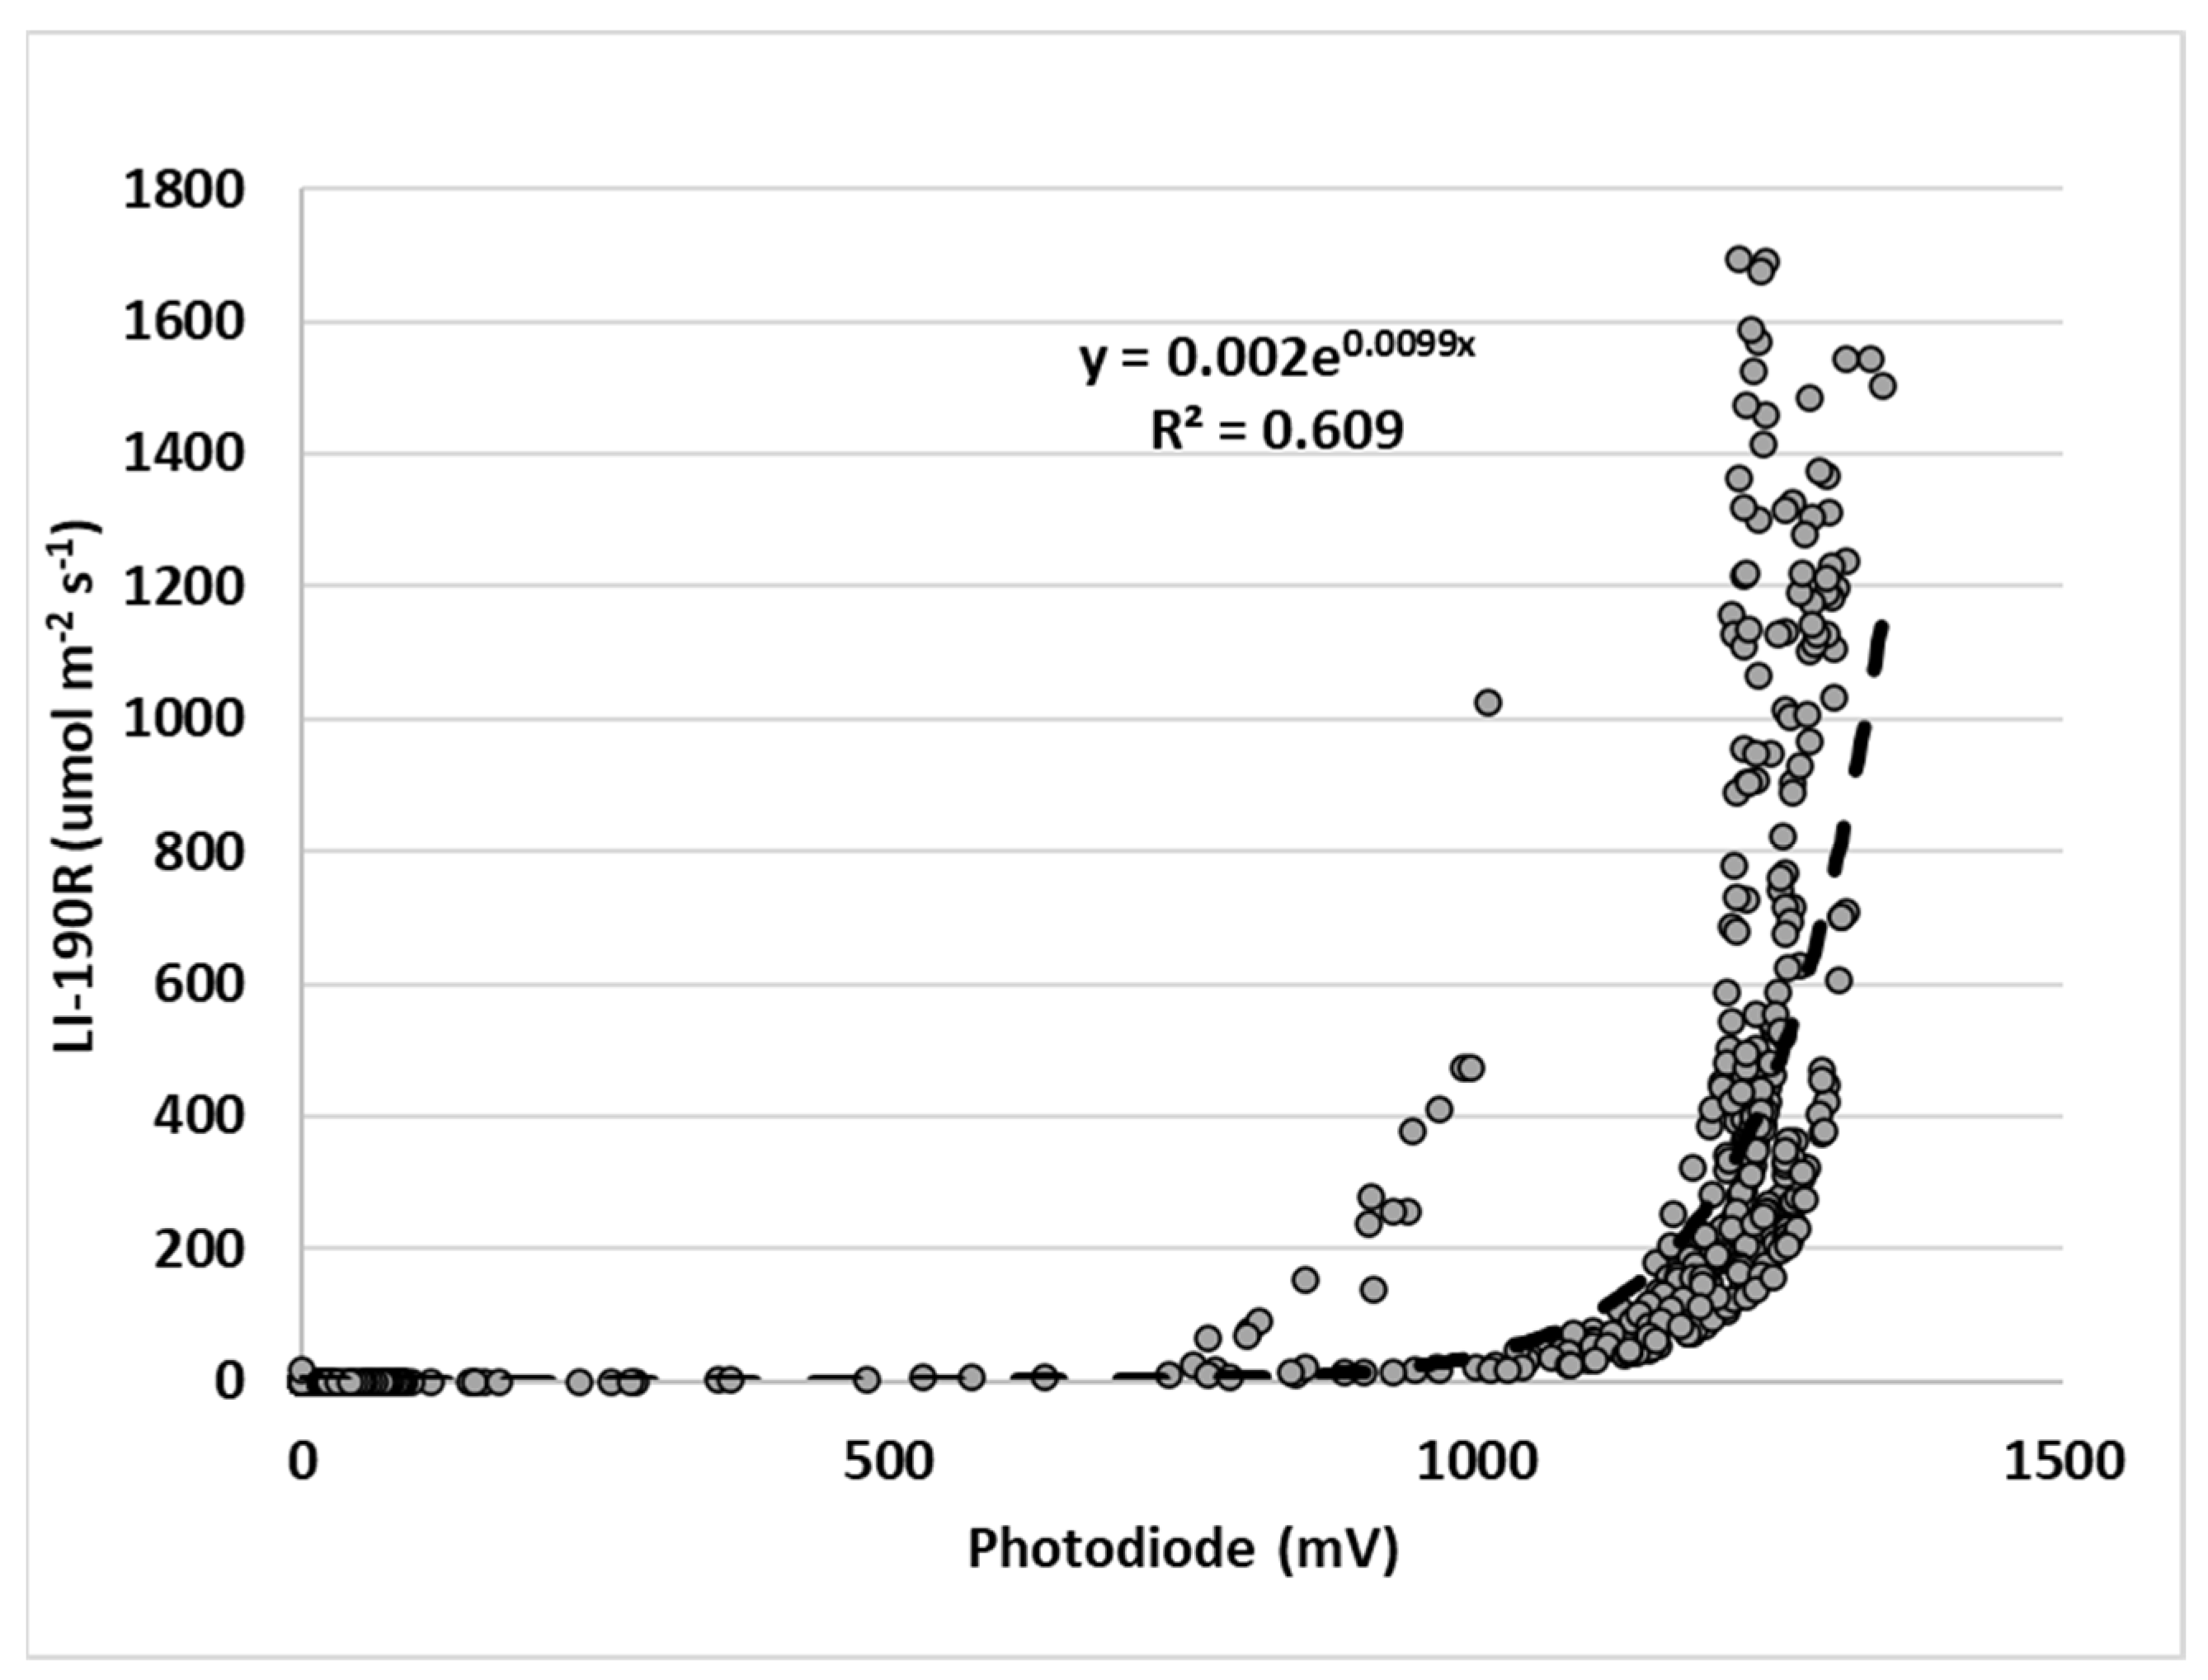
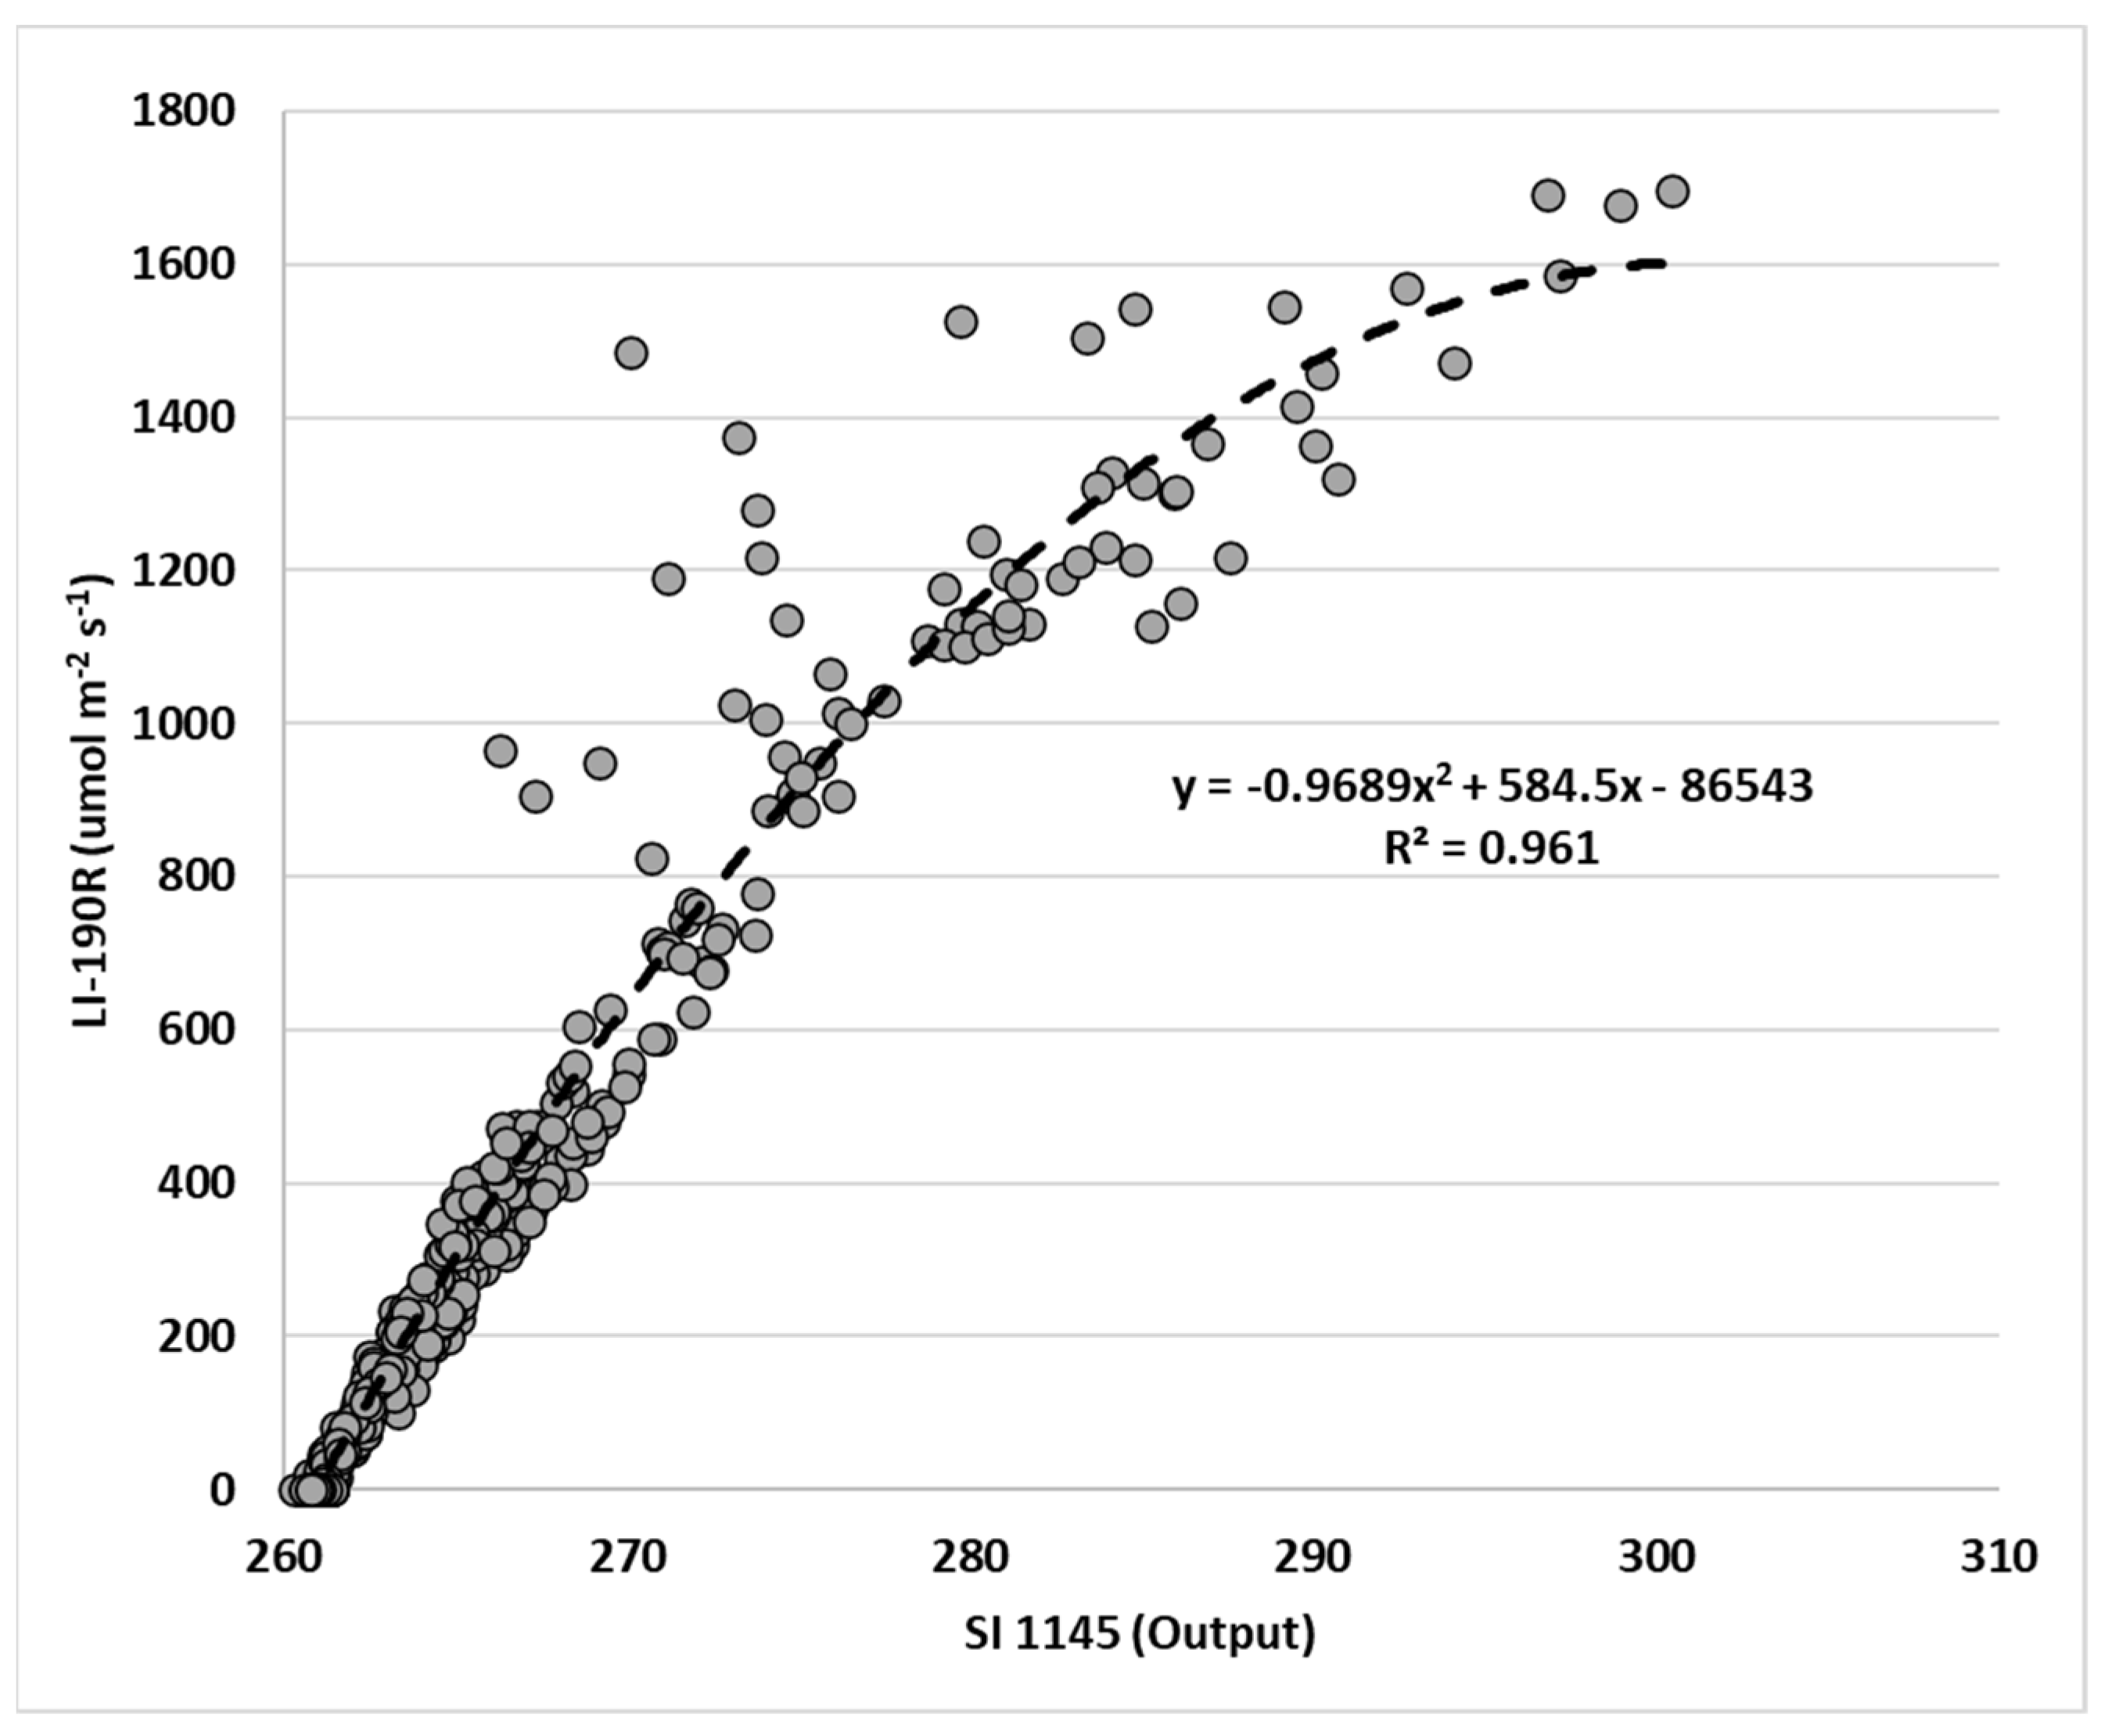
3.1. Sensor Calibration

Figure 8 shows the comparison of the photodiode’s output and LI-190R. The relationship was exponential and the R2 was 0.609. Figure 9 shows the comparison of the SI 1145′s output and LI-190R. The relationship was fitted with 2nd order polynomial, and the R2 was 0.961. This result shows a strong correlation between LI-190R and SI 1145. This correlation for the SI 1145 is comparable to that of Rocha et al. (2021), who obtained R2 values of 0.962 and 0.958 when compared to solar radiation for two prototypes of the PAR sensor using a photodiode [13]. Fielder et al. (2000) achieved an R2 value of 0.999 when comparing their photodiode to a LI-190 quantum sensor [32].

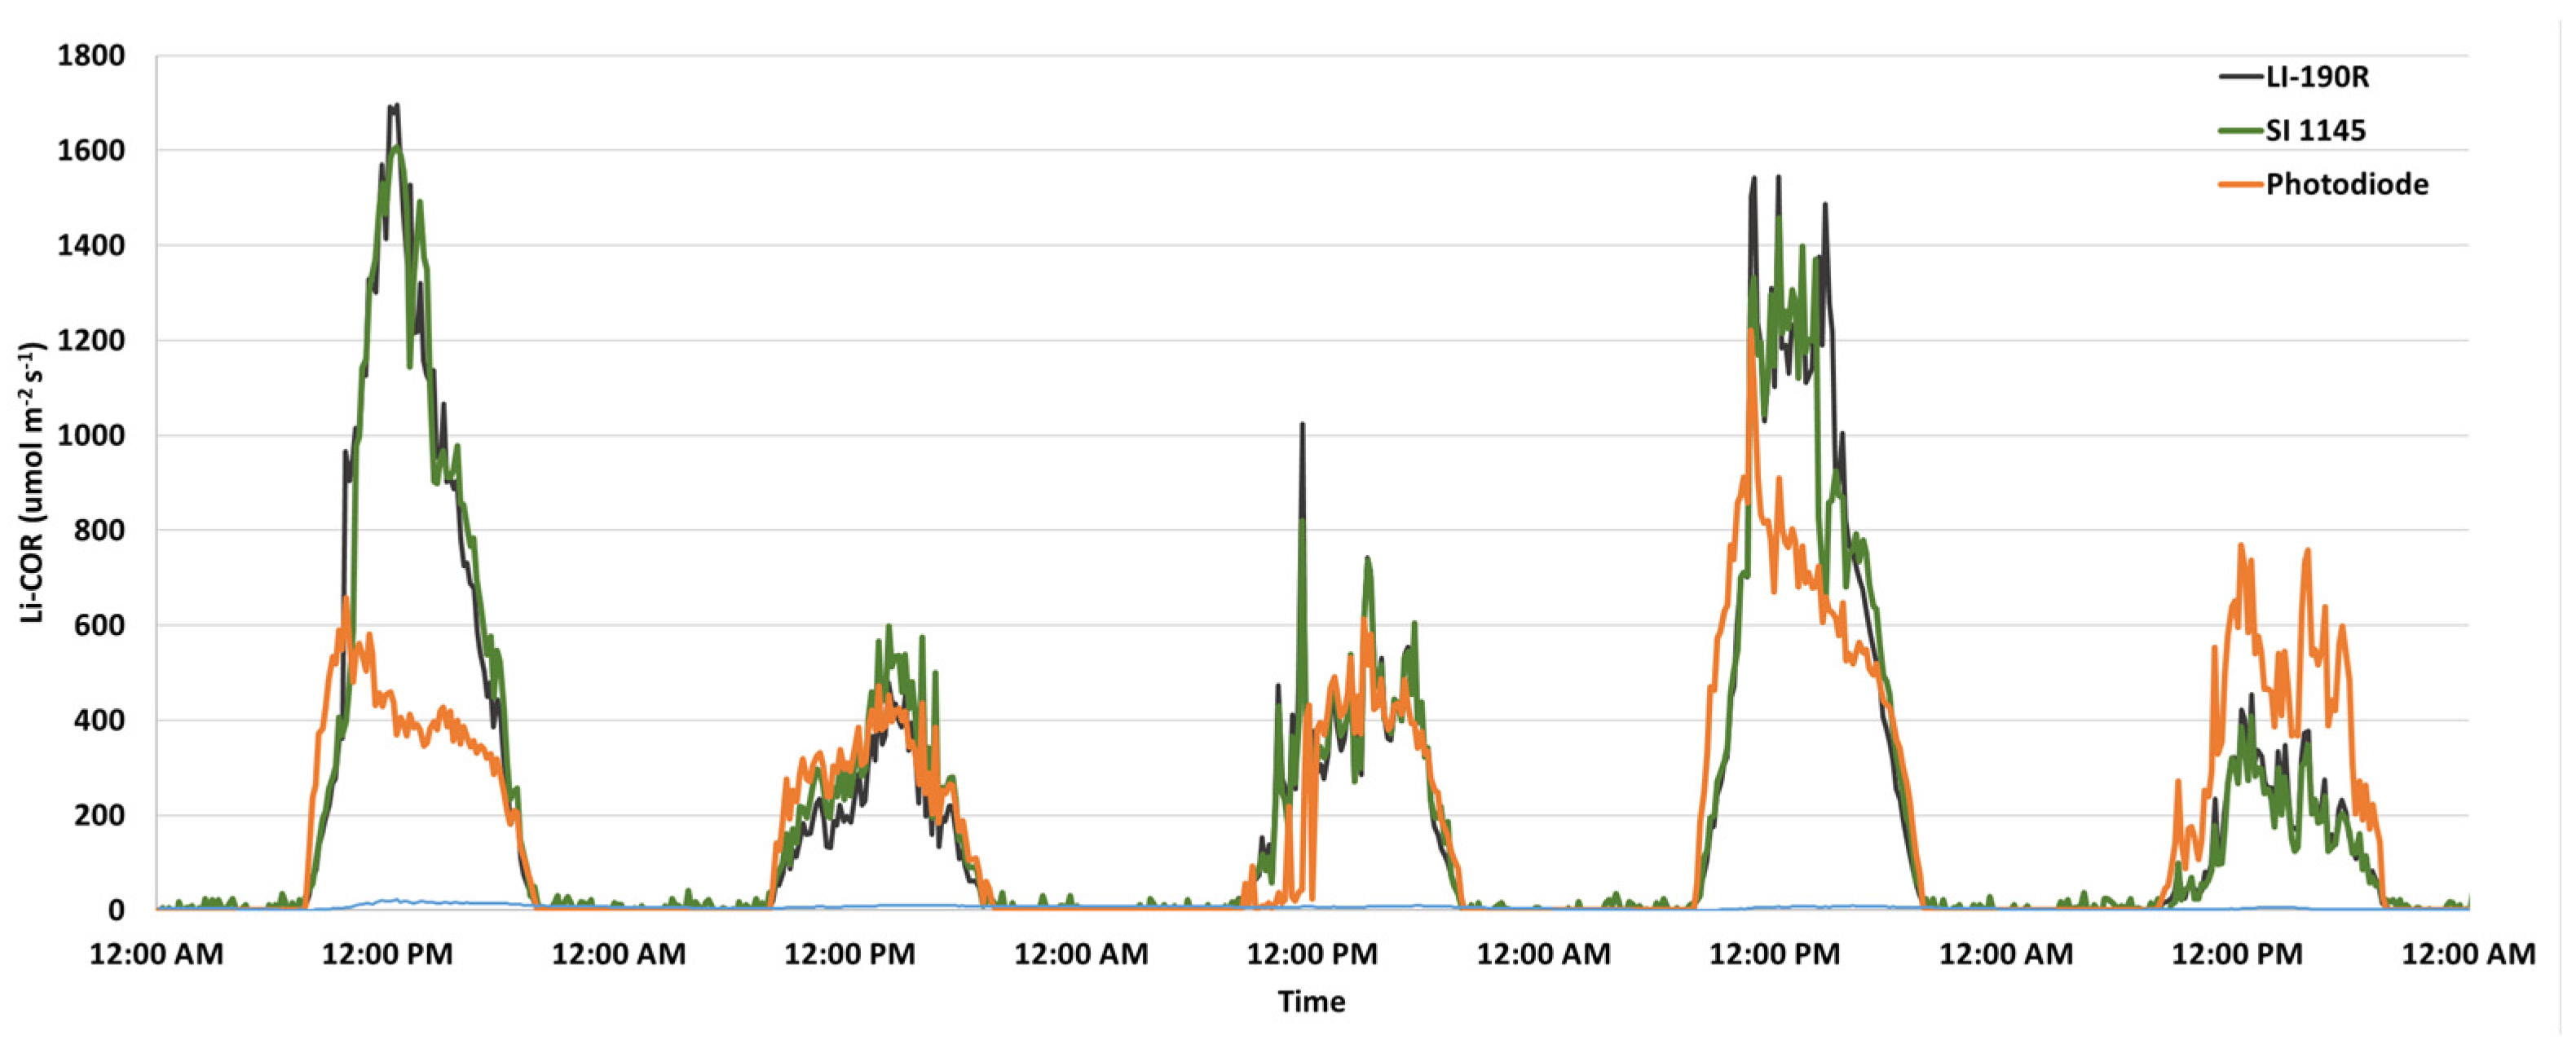
3.2. Sensor Evaluation in Outdoor Environments

Figure 10 shows the comparison of LI-190R, SI 1145, and photodiode data in the outdoor environment. Table 1 shows the results of the statistical analysis for comparing the SI 1145 and the photodiode measurements to the LI-190R values. The statistical analysis indicates that SI 1145 was overestimated by 3.564 μ m o l   m 2   s 1 based on MBE. These errors are relatively small compared to the range measured throughout the day, which can be from zero to up to 1700 μ m o l   m 2   s 1 . The photodiode had an underestimate for MBE of −31.399 μ m o l   m 2   s 1 . The SI 1145 had a much higher IA value (0.989) than the photodiode (0.834). The IA of the SI1145 is comparable to that of a study conducted by Rocha et al. (2021), which obtained an IA of 0.953 and 0.950 for the two prototypes of PAR sensors using photodiodes [13].

3.3. Cost

The goal of this design is to be less expensive than a PAR sensor monitoring system currently available on the market. The components used in the design are low-cost and easily obtainable, making the overall design easy to replicate. Table 2 lists each component necessary to replicate the system for the SI 1145, photodiode, and LI-190R, respectively. The cost to build a PAR sensor monitoring system with SI 1145 and the photodiode is 202 and 207 USD, respectively. This is less expensive than using a microcontroller to read a commercial PAR sensor like the LI-190R. For example, the design outlined by Barnard et al. (2014), using an Arduino microcontroller with an LI-190 sensor, costs 685 USD [11].
The cost is comparable to other studies using a microcontroller and a photodiode to measure PAR. The cost of a system utilizing the ESP8266 microcontroller is estimated at 200 USD [13]. The advantage of the design outlined in this paper is the ability to deploy the sensor anywhere as it uses a 4G LTE cell tower instead of Wi-Fi that ESP8266 uses. A cellular module can be added to the ESP8266 to utilize 3G or 4G technologies, but the total costs, usability, and complexity of the additional module are not justified compared to the proposed system.

4. Conclusions

The study successfully compared both the photodiode (VTB8440BH) and SI 1145 with LI-190R. The performance of SI 1145 had a strong correlation (R2 = 0.961) with LI-190R. However, the photodiode had a weaker correlation with LI-190R (R2 = 0.609). This study successfully designed affordable and reliable IoT-based PAR sensor monitoring systems, including a 3D-printed housing, hardware, programming, and IoT website. The cost of building the SI 1145 was about 20% of the cost of building a monitoring system using the LI-190R sensor. Considering a similar performance between SI 1145 and LI-190R (IA = 0.989, MBE = 3.564), an SI 1145 with an optical UV AR IR glass-cut filter would be the alternative way to monitor PAR. Because of this affordable PAR sensor, researchers, farmers, agricultural industries, foresters, and environmental scientists may use more PAR sensors for plant/tree growth prediction, water uptake estimation, irrigation management, etc. Recent studies show that PAR measurement has been utilized in indoor farming [33] and irrigation scheduling [34]. Soybeans are known as photosensitive crops; the accurate prediction of the growth stages of a soybean will enable precision irrigation scheduling, which will improve crop production and irrigation water use efficiency. Incorporation of PAR data with other field monitoring data, such as soil moisture monitoring [27] and SAP flow [35], for irrigation scheduling is recommended for future study. More applications of the developed affordable IoT-based PAR sensor in other agricultural systems, such as animal production, aquaculture, and high tunnel, should also be explored. Further studies assessing different photodiodes to monitor their capability to measure PAR should be performed and compared to this proposed design.

Author Contributions

Conceptualization, Y.D.; methodology, Y.D. and H.H.; investigation, Y.D. and H.H.; writing—original draft preparation, Y.D. and H.H.; writing—review and editing, Y.D. and H.H.; visualization, Y.D. and H.H.; supervision, Y.D.; funding acquisition, Y.D. All authors have read and agreed to the published version of the manuscript.

Funding

This research was funded by the Michigan Soybean Commission under Project Award No. 2215.

Data Availability Statement

The data presented in this study are available on request from the corresponding author.

Acknowledgments

Authors thank undergraduate students, Kylie Jamrog and Morgan Filhart, from Michigan State University Irrigation Lab.

Conflicts of Interest

The authors declare that they have no known competing financial interests or personal relationships that could have appeared to influence.

References

  1. Mercado, L.M.; Bellouin, N.; Sitch, S.; Boucher, O.; Huntingford, C.; Wild, M.; Cox, P.M. Impact of Changes in Diffuse Radiation on the Global Land Carbon Sink. Nature 2009, 458, 1014–1017. [Google Scholar] [CrossRef]
  2. Salter, W.T.; Gilbert, M.E.; Buckley, T.N. Time-Dependent Bias in Instantaneous Ceptometry Caused by Row Orientation. Plant Phenome J. 2018, 1, 1–10. [Google Scholar] [CrossRef]
  3. Hofkens, M.; Melis, P.; Laurijssen, S.; Baets, D.; Van Delm, T. Four Layer Strawberry Cultivation. Acta Hortic. 2021, 663–670. [Google Scholar] [CrossRef]
  4. Jiang, J.; Moallem, M.; Zheng, Y. An Intelligent Iot-Enabled Lighting System for Energy-Efficient Crop Production. J. Daylighting 2021, 8, 86–99. [Google Scholar] [CrossRef]
  5. Graefea, J.; Sradnick, A. Monitoring and Modelling of Water and Heat Fluxes from Asparagus Fields. Acta Hortic. 2018, 1223, 117–126. [Google Scholar] [CrossRef]
  6. Zhen, S.; van Iersel, M.W.; Bugbee, B. Photosynthesis in Sun and Shade: The Surprising Importance of Far-Red Photons. New Phytol. 2022, 236, 538–546. [Google Scholar] [CrossRef]
  7. Cruse, M.J.; Kucharik, C.J.; Norman, J.M. Using a Simple Apparatus to Measure Direct and Diffuse Photosynthe.Tically Active Radiation at Remote Locations. PLoS ONE 2015, 10, e0115633. [Google Scholar] [CrossRef]
  8. Bhagat, K.P.; Bal, S.K.; Singh, Y.; Potekar, S.; Saha, S.; Ratnakumar, P.; Wakchaure, G.C.; Minhas, P.S. Effect of Reduced PAR on Growth and Photosynthetic Efficiency of Soybean Genotypes. J. Agrometeorol. 2017, 19, 1–9. [Google Scholar] [CrossRef]
  9. Chukwujindu Nwokolo, S.; Ogbulezie, J.C.; Umunnakwe Obiwulu, A. Impacts of Climate Change and Meteo-Solar Parameters on Photosynthetically Active Radiation Prediction Using Hybrid Machine Learning with Physics-Based Models. Adv. Space Res. 2022, 70, 3614–3637. [Google Scholar] [CrossRef]
  10. Rajendran, J.; Leon-Salas, W.D.; Fan, X.; Zhang, Y.; Vizcardo, M.A.; Postigo, M. On the Development of a Low-Cost Photosynthetically Active Radiation (PAR) Sensor. In Proceedings of the 2020 IEEE International Symposium on Circuits and Systems (ISCAS 2020), Virtual Conference, 10–21 October 2020; Curran Associates, Inc.: Red Hook, NY, USA, 2020. [Google Scholar]
  11. Barnard, H.R.; Findley, M.C.; Csavina, J. PARduino: A Simple and Inexpensive Device for Logging Photosynthetically Active Radiation. Tree Physiol. 2014, 34, 640–645. [Google Scholar] [CrossRef]
  12. Harun, A.N.; Ahmad, R.; Mohamed, N. Plant Growth Optimization Using Variable Intensity and Far Red LED Treatment in Indoor Farming. In Proceedings of the 2015 International Conference on Smart Sensors and Application, ICSSA 2015, Kuala Lumpur, Malaysia, 26–28 May 2015. [Google Scholar]
  13. Da Rocha, Á.B.; Fernandes, E.d.M.; Dos Santos, C.A.C.; Diniz, J.M.T.; Junior, W.F.A. Development of a Real-Time Surface Solar Radiation Measurement System Based on the Internet of Things (Iot). Sensors 2021, 21, 3836. [Google Scholar] [CrossRef]
  14. Pontailler, J.-Y. A Cheap Quantum Sensor Using a Gallium Arsenide Photodiode. Funct. Ecol. 1990, 4, 591. [Google Scholar] [CrossRef]
  15. Rahman, M.M.; Stanley, J.N.; Lamb, D.W.; Trotter, M.G. Methodology for Measuring FAPAR in Crops Using a Combination of Active Optical and Linear Irradiance Sensors: A Case Study in Triticale (X Triticosecale Wittmack). Precis. Agric. 2014, 15, 532–542. [Google Scholar] [CrossRef]
  16. Hanan, N.P.; Bégué, A. A Method to Estimate Instantaneous and Daily Intercepted Photosynthetically Active Radiation Using a Hemispherical Sensor. Agric. For. Meteorol. 1995, 74, 155–168. [Google Scholar] [CrossRef]
  17. Lova Raju, K.; Vijayaraghavan, V. IoT Technologies in Agricultural Environment: A Survey. Wirel. Pers. Commun. 2020, 113, 2415–2446. [Google Scholar] [CrossRef]
  18. Xu, J.; Gu, B.; Tian, G. Review of Agricultural IoT Technology. Artif. Intell. Agric. 2022, 6, 10–22. [Google Scholar] [CrossRef]
  19. Yang, M.T.; Chen, C.C.; Kuo, Y.L. Implementation of Intelligent Air Conditioner for Fine Agriculture. Energy Build. 2013, 60, 364–371. [Google Scholar] [CrossRef]
  20. Loukatos, D.; Arvanitis, K.G. Multi-Modal Sensor Nodes in Experimental Scalable Agricultural IoT Application Scenarios. In Lecture Notes on Data Engineering and Communications Technologies; Springer: Berlin/Heidelberg, Germany, 2021; Volume 67, pp. 101–128. [Google Scholar]
  21. Tao, W.; Zhao, L.; Wang, G.; Liang, R. Review of the Internet of Things Communication Technologies in Smart Agriculture and Challenges. Comput. Electron. Agric. 2021, 189, 106352. [Google Scholar] [CrossRef]
  22. Vailshery, L. Application of IoT in Agriculture by Segment 2020–2026. Statista 2022. Available online: https://www.statista.com/statistics/1343764/iot-agriculture-market-by-segment/#:~:text=Over%20the%20past%20few%20years,%2C%20checking%20crops%2C%20and%20others (accessed on 5 March 2024).
  23. Anik, S.M.H.; Gao, X.; Meng, N.; Agee, P.R.; McCoy, A.P. A Cost-Effective, Scalable, and Portable IoT Data Infrastructure for Indoor Environment Sensing. J. Build. Eng. 2022, 49, 104027. [Google Scholar] [CrossRef]
  24. Wright, N.L.; Nagle, F.; Greenstein, S. Open Source Software and Global Entrepreneurship. Res. Policy 2023, 52, 104846. [Google Scholar] [CrossRef]
  25. Dos Santos, U.J.L.; Pessin, G.; da Costa, C.A.; da Rosa Righi, R. AgriPrediction: A Proactive Internet of Things Model to Anticipate Problems and Improve Production in Agricultural Crops. Comput. Electron. Agric. 2018, 161, 202–213. [Google Scholar] [CrossRef]
  26. Kelley, B.; Chilvers, M.; Kelley, L.; Miller, S.; Dong, Y. Implementation of a Sensor Monitoring System to Improve Irrigation Management through On-Farm Demonstration. In Proceedings of the 2023 ASABE Annual International Meeting, Omaha, NE, USA, 9–12 July 2023; American Society of Agricultural and Biological Engineers: Omaha, NE, USA, 2023; p. 2300137. [Google Scholar]
  27. Dong, Y.; Werling, B.; Cao, Z.; Li, G. Implementation of an In-Field IoT System for Precision Irrigation Management. Front. Water 2024, 6, 1353597. [Google Scholar] [CrossRef]
  28. Dong, Y.; Check, J.; Willbur, J.; Chilvers, M. Improving Irrigation and Disease Management in Irrigated Potato Fields Using IoT-Based Sensor Technology; American Society of Agricultural and Biological Engineers: Omaha, NE, USA, 2023. [Google Scholar]
  29. Harun, A.N.; Mohamed, N.; Ahmad, R.; Rahim, A.R.A.; Ani, N.N. Improved Internet of Things (IoT) Monitoring System for Growth Optimization of Brassica Chinensis. Comput. Electron. Agric. 2019, 164, 104836. [Google Scholar] [CrossRef]
  30. Particle. Boron Datasheet. 2024. Available online: https://docs.particle.io/reference/datasheets/b-series/boron-datasheet (accessed on 5 March 2024).
  31. Ubidots. Industrial IoT Platform. 2024. Available online: https://ubidots.com/ (accessed on 5 March 2024).
  32. Fielder, P.; Comeau, P. Construction and Testing of an Inexpensive PAR Sensor; Ministry of Forests Research Program: Victoria, BC, Canada, 2000. [Google Scholar]
  33. Schwend, T.; Beck, M.; Prucker, D.; Peisl, S.; Mempel, H. Test of a PAR Sensor-Based, Dynamic Regulation of LED Lighting in Greenhouse Cultivation of Helianthus Annuus. Eur. J. Hortic. Sci. 2016, 81, 152–156. [Google Scholar] [CrossRef]
  34. Li, L.; Han, F.; Li, J.; Shunwei, A.; Kaili, S.; Shirui, Z.; Zhangzhong, L. The Development of Variable System-Based Internet of Things for the Solar Greenhouse and Its Application in Lettuce. Front. Plant Sci. 2024, 15, 1292719. [Google Scholar] [CrossRef]
  35. Dong, Y.; Hansen, H. Comparison of Methods for Estimating Crop Water Use: Sap Flow, FAO-56 Penman-Monteith, and Weather Parameters. Agric. Sci. 2023, 14, 617–628. [Google Scholar] [CrossRef]
Figure 1. Light penetration of the UV AR IR glass-cut filter.
Agriengineering 06 00044 g001
Figure 2. Diagram of the layout of the PTFE sheet and glass filter for the photodiode and SI1145.
Agriengineering 06 00044 g002
Figure 3. Enclosure design. (A): Outside of the enclosure. (B): Bottom plate of the enclosure. (C): Inside of the enclosure for the photodiode. (D): Inside of the enclosure for SI 1145. (E): Cross-section of enclosure for the photodiode. (F): Cross-section of enclosure for the SI 1145.
Agriengineering 06 00044 g003
Figure 4. 3D-printed housing for SI 1145 and photodiode.
Agriengineering 06 00044 g004
Figure 5. System diagram of the IoT-based PAR sensor monitoring system.
Agriengineering 06 00044 g005
Figure 6. Screenshot of the IoT web server that displays data and shares with users.
Agriengineering 06 00044 g006
Figure 7. Flow of the microcontroller program.
Agriengineering 06 00044 g007
Figure 8. Comparison of photodiode with LI-190R from the calibration process.
Agriengineering 06 00044 g008
Figure 9. Comparison of SI 1145 with LI-190R from the calibration process.
Agriengineering 06 00044 g009
Figure 10. Comparison of LI-190R, SI 1145, and photodiode in outdoor environment conditions.
Agriengineering 06 00044 g010
Table 1. Statistical analysis results.
SensorsRMSEIAMBE
SI 114572.20.9893.564
Photodiode234.30.834−31.399
Table 2. Material Cost for Power, LI-190R, SI 1145, and Photodiode System.
Setup ComponentItemQuantityPrice (USD)
Power system25 W Solar Panel132.00
Solar Charge Controller115.00
12 V 7.2 Ah Battery110.00
Enclosure135.00
Total92.00
LI-190R systemLI-190R1470.00
ADS 1115114.95
Particle Boron 165.31
Total550.26
SI 1145 systemSI 114519.95
Particle Boron 165.31
UV AR IR Cut Glass Filter15.00
2 × 250 × 250 mm PTFE Sheet127.00
ABS 3D-Printing Cost13.00
Total110.26
Photodiode systemPhotodiode (VTB8440BH)13.07
ADS 1115114.95
Particle Boron 165.31
UV AR IR Cut Glass Filter15.00
2 × 250 ×250 mm PTFE Sheet127.00
ABS 3D-Printing Cost13.00
Total115.26
Disclaimer/Publisher’s Note: The statements, opinions and data contained in all publications are solely those of the individual author(s) and contributor(s) and not of MDPI and/or the editor(s). MDPI and/or the editor(s) disclaim responsibility for any injury to people or property resulting from any ideas, methods, instructions or products referred to in the content.

