
Soqia: A Responsive Web Geographic Information System Solution for Dynamic Spatio-Temporal Monitoring of Soil Water Status in Arboriculture


Abstract
1. Introduction

| Application Name | Services | Input Data | Crop Types |
|---|---|---|---|
| AquaEdge [12] |
|
|
|
| Irrismart [13] |
|
|
|
| Bluleaf [14] |
|
| The application has been tested on durum wheat in Lebanon’s Bekaa Valley, a strategic Mediterranean crop. |
| AgSat [15] |
|
| Vegetables: carrots, cabbage, aubergines. Fruits: bananas, citrus fruits (such as oranges and lemons), grapes, kiwi, strawberries. Grains: corn, beans. Others: alfalfa (forage plant), almonds (dried fruit). |
| Smart irrigation apps [16] |
|
| Fruits: avocado, blueberry, citrus, peach, pecan, strawberry. Cereals: corn, soybeans. Others: cotton, turf. |
| PISys [17] |
|
| Olivier |
- Mobile GIS Application: A Mobile GIS application is specifically designed for use on mobile devices such as smartphones or tablets. It is optimized for a user experience on small touchscreen displays [15]. Mobile GIS applications are typically downloaded and installed on mobile devices from application stores (such as Apple’s App Store or Google Play Store for Android) [16]. They may have features specific to mobility, such as field data collection, real-time GPS navigation, geolocation. Mobile GIS applications often operate in offline mode, but they can also function in both modes simultaneously, referred to as hybrid Mobile GIS applications.
- Web GIS Application: A Web GIS app (or web-based GIS application) is a web application accessible via a web browser on any Internet-connected device, whether it be a desktop computer, laptop, tablet, or smartphone. It is designed to be used on screens of various sizes, usually being responsive and automatically adapting to the screen resolution of the device in use [18]. Unlike Mobile GIS applications, Web GIS apps generally do not require installation on the device. Users access them by entering a URL into a web browser. They provide the flexibility to access geospatial data from anywhere with an Internet connection.
2. Material and Methods
2.1. Description of the Application Architecture
- Monitoring the soil and crop hydric status during the whole crop cycle. Real-time monitoring allows for an appropriate estimate of the crop water need and thus an optimal timing for water supply.
- Adjusting water supply to phenological stages.
- Collecting daily weather conditions (temperature, humidity, wind speed, radiation) from the closest metrological station in order to estimate daily evapotranspiration on a daily and weekly basis.
- Using a meteorological database to obtain forecasts using APIs for short-term agricultural activity planning. A three- to seven-day forecast has proven to be the ideal situation farmers are looking for to prevent adverse effects of water stress on crops.
- The estimation of daily crop evapotranspiration. This information is crucial for ensuring adequate irrigation.
- Estimating weekly crop evapotranspiration: Users also require an estimate of weekly crop evapotranspiration to have visibility of irrigation requirements.
- Real-time soil temperature;
- Real-time soil humidity;
- Satellite imagery to extract vegetation index data (NDVI, SAVI, EVI, NDMI, and NDWI);
- Geospatial data of the orchard, i.e., the geometries of the orchard components;
- Daily meteorological data (air temperature, air humidity, precipitation, wind speed);
- Weekly weather forecasts for the orchard area;
- Measured evapotranspiration if available;
- Specific crop parameters for estimating water needs (e.g., crop cultural coefficient Kc).
- The visualization of vegetation index maps;
- The visualization of index evolution charts;
- The visualization of soil parameters;
- Access to current weather data;
- The visualization of weather forecasts;
- The estimation of daily evapotranspiration;
- The visualization of evapotranspiration forecasts;
- The estimation and visualization of tree water requirements.
2.2. Implementation of the Solution Prototype
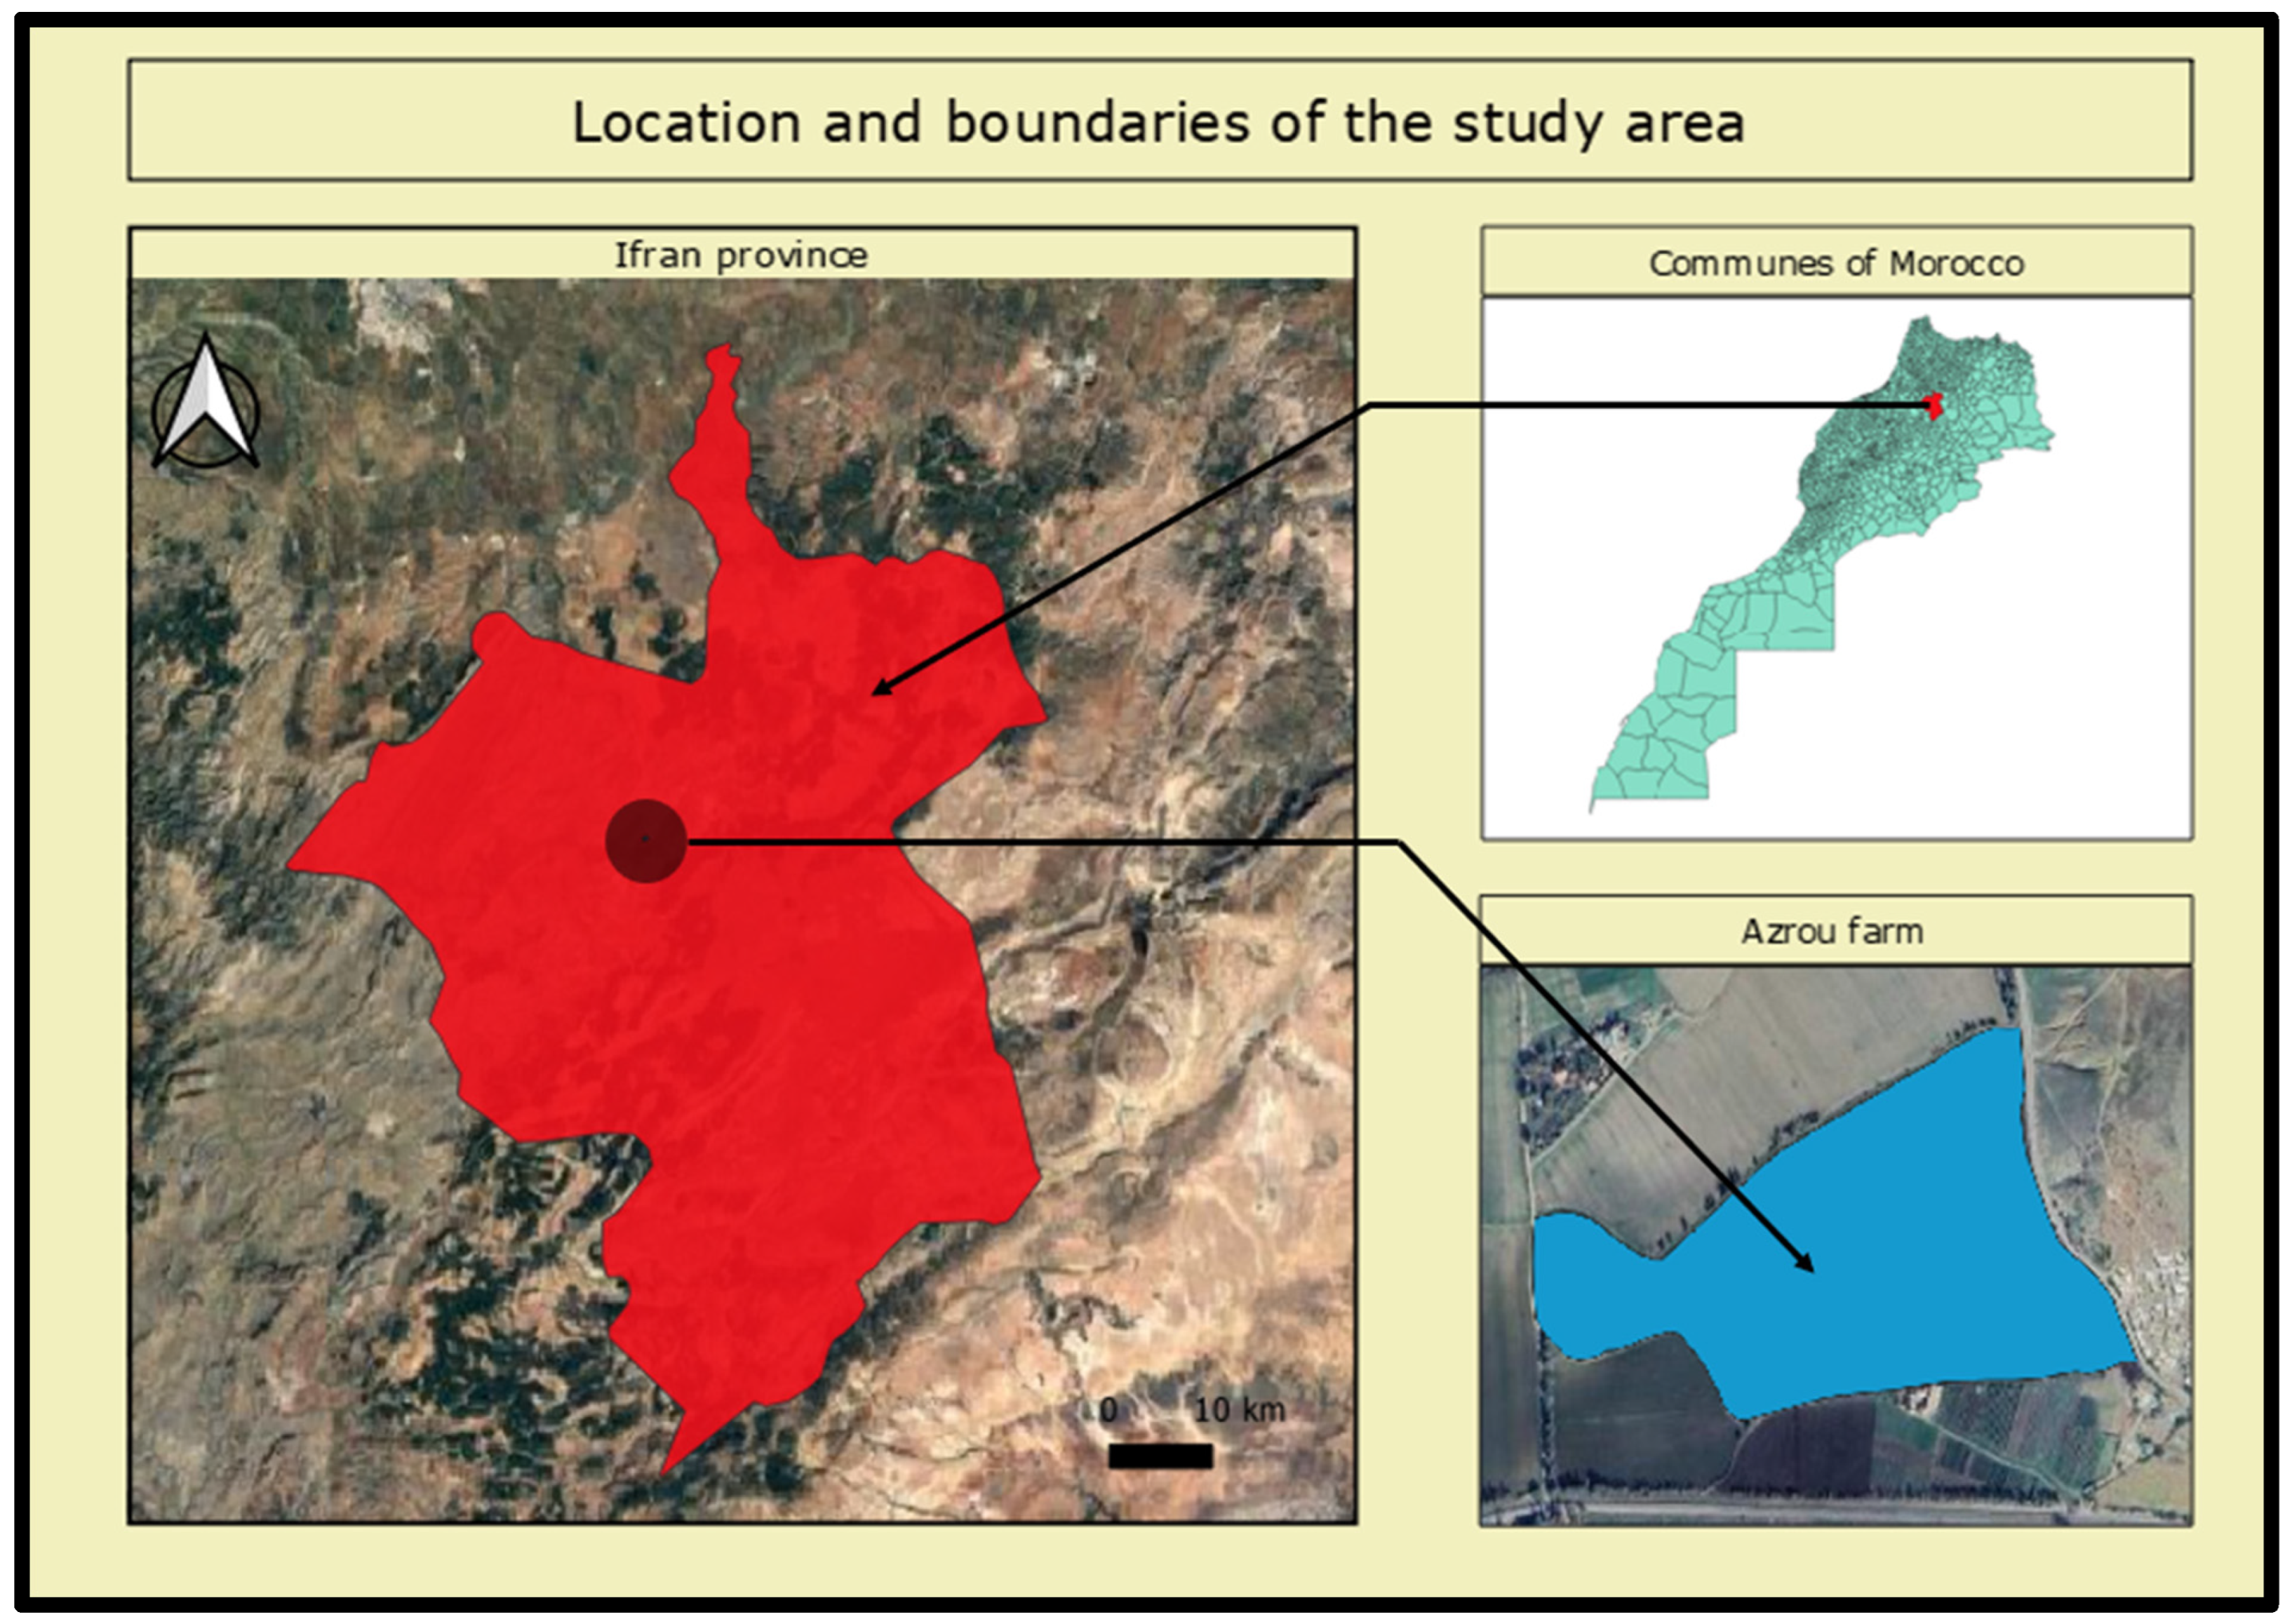
2.2.1. Presentation of the Study Area
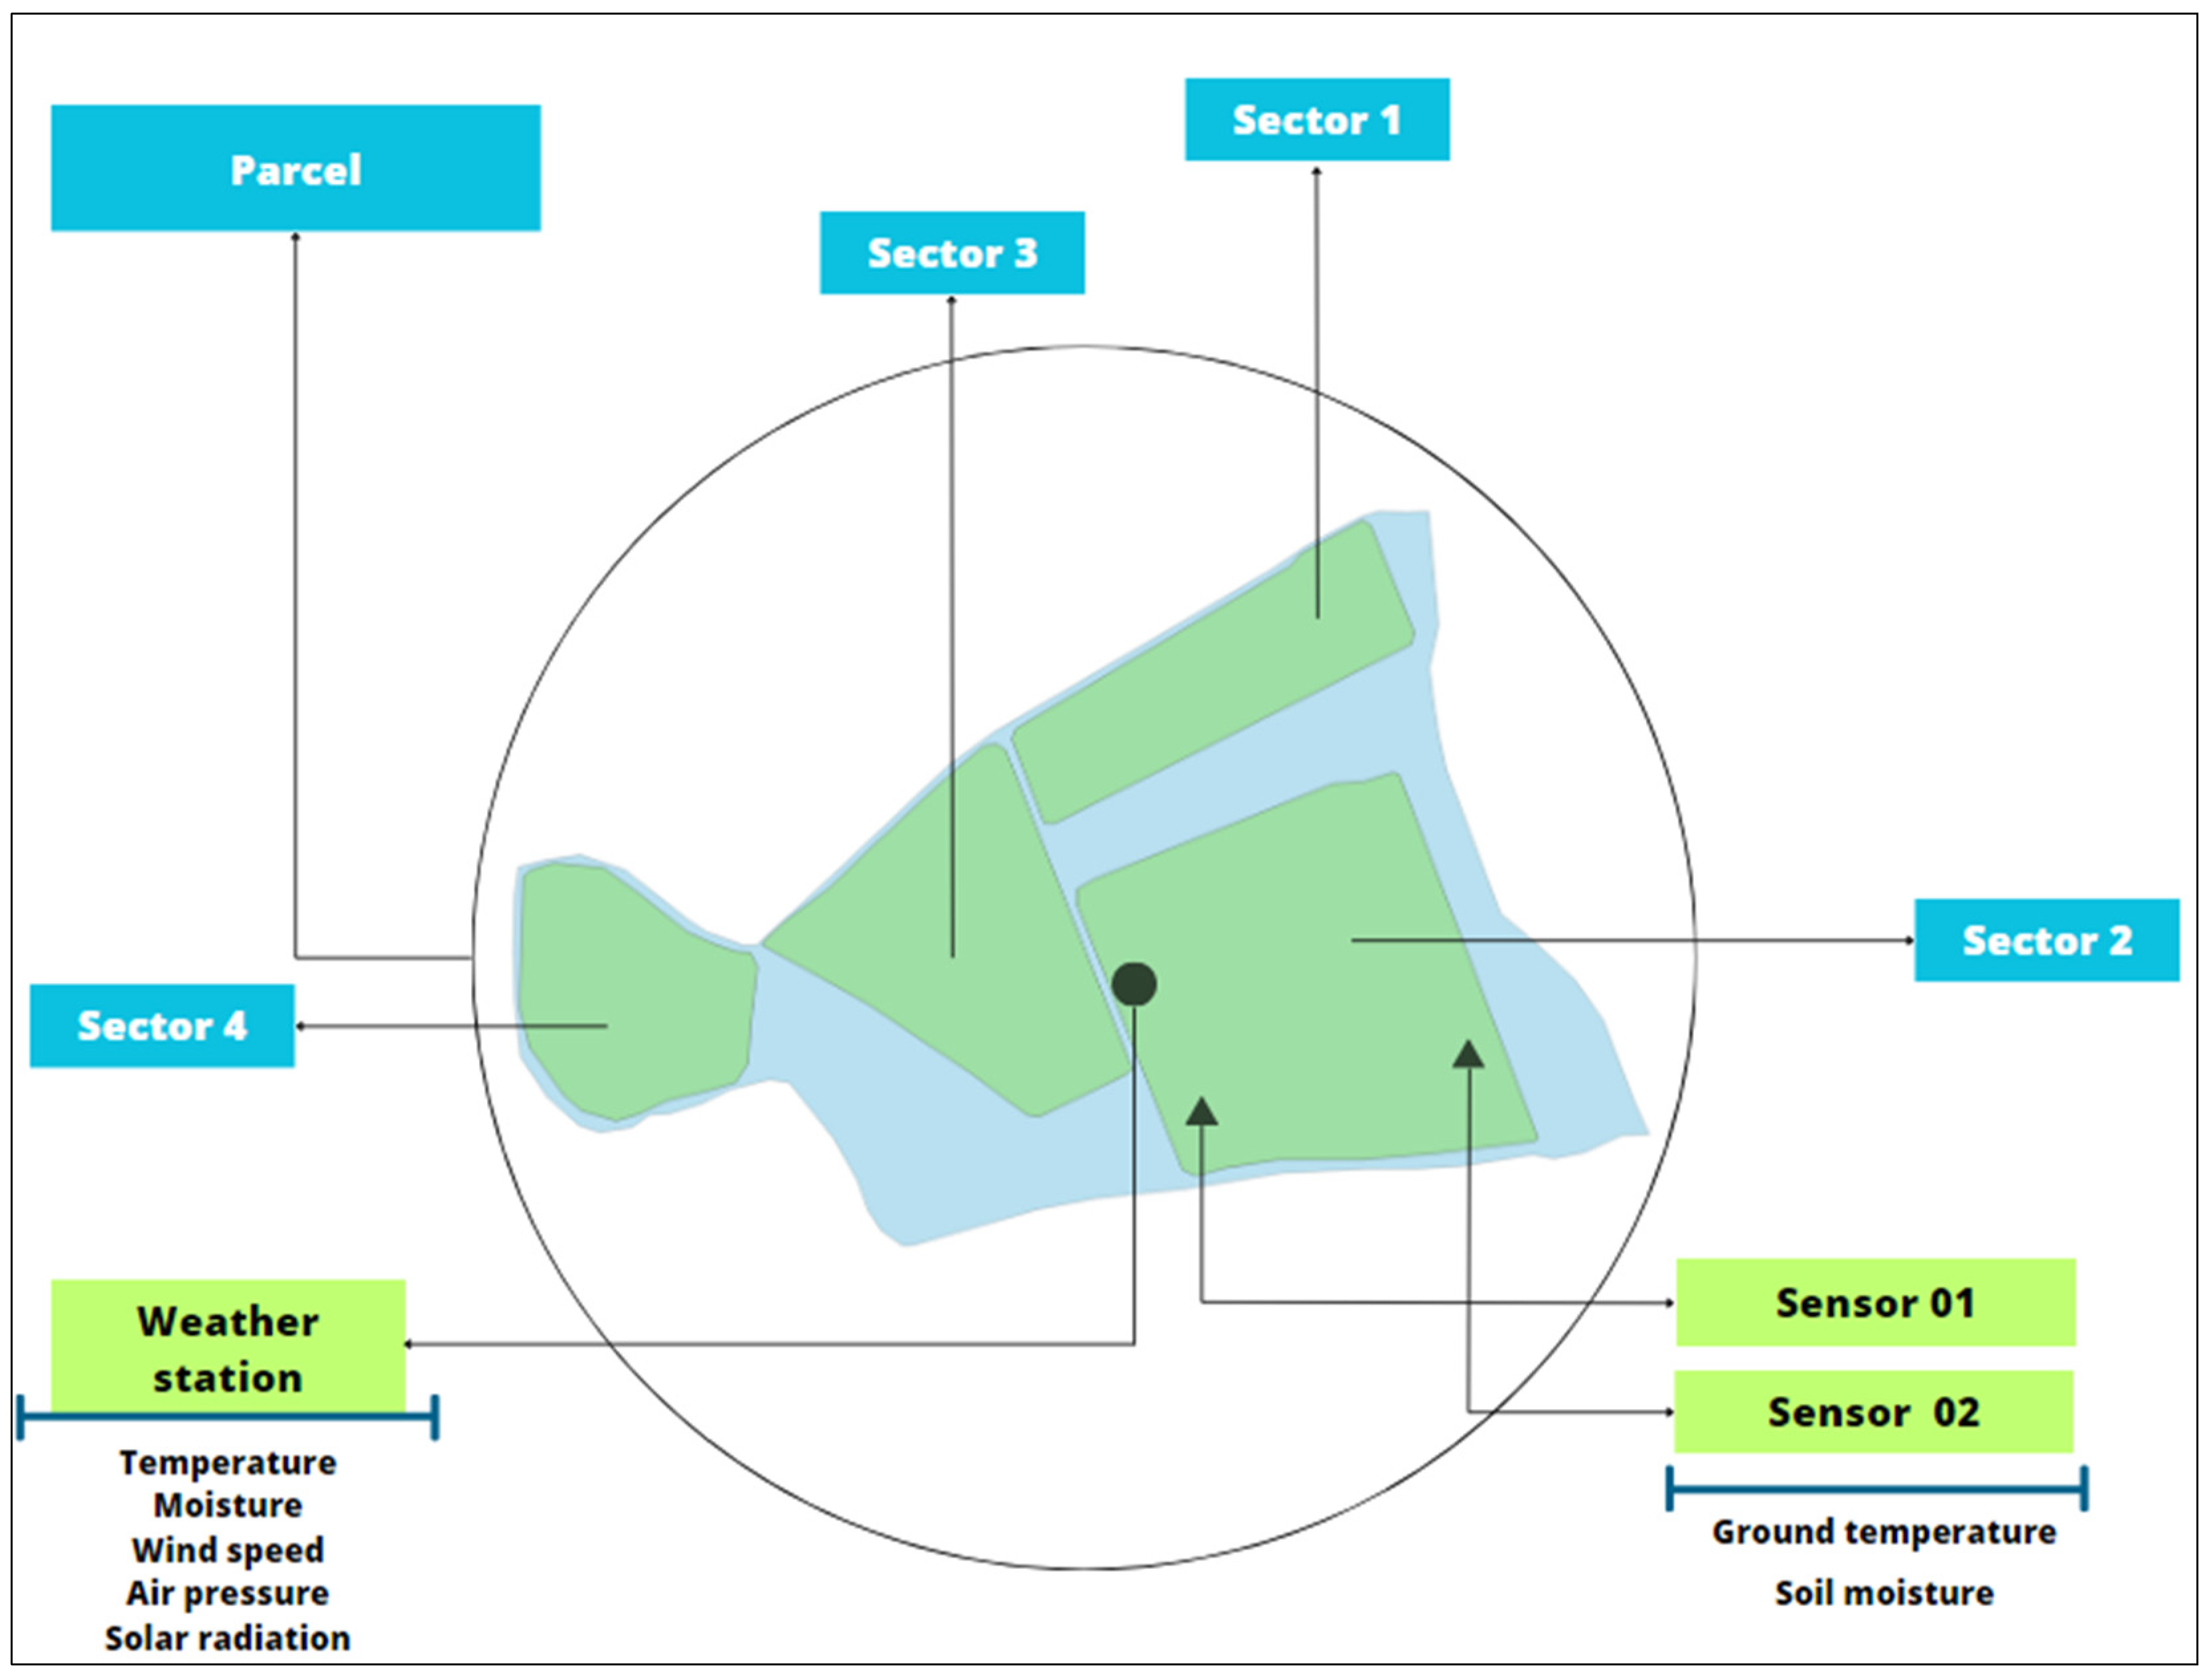
- One sensor is in the Jéromine variety block of the apple orchard;
- Another sensor is placed in the Gala variety block of the apple orchard;
- The weather station is installed at the head station;
- The following diagram (Figure 4) illustrates the devices installed on the farm and the measurements they collect:
2.2.2. Data, Databases, Languages, and Platforms Used
Available Data
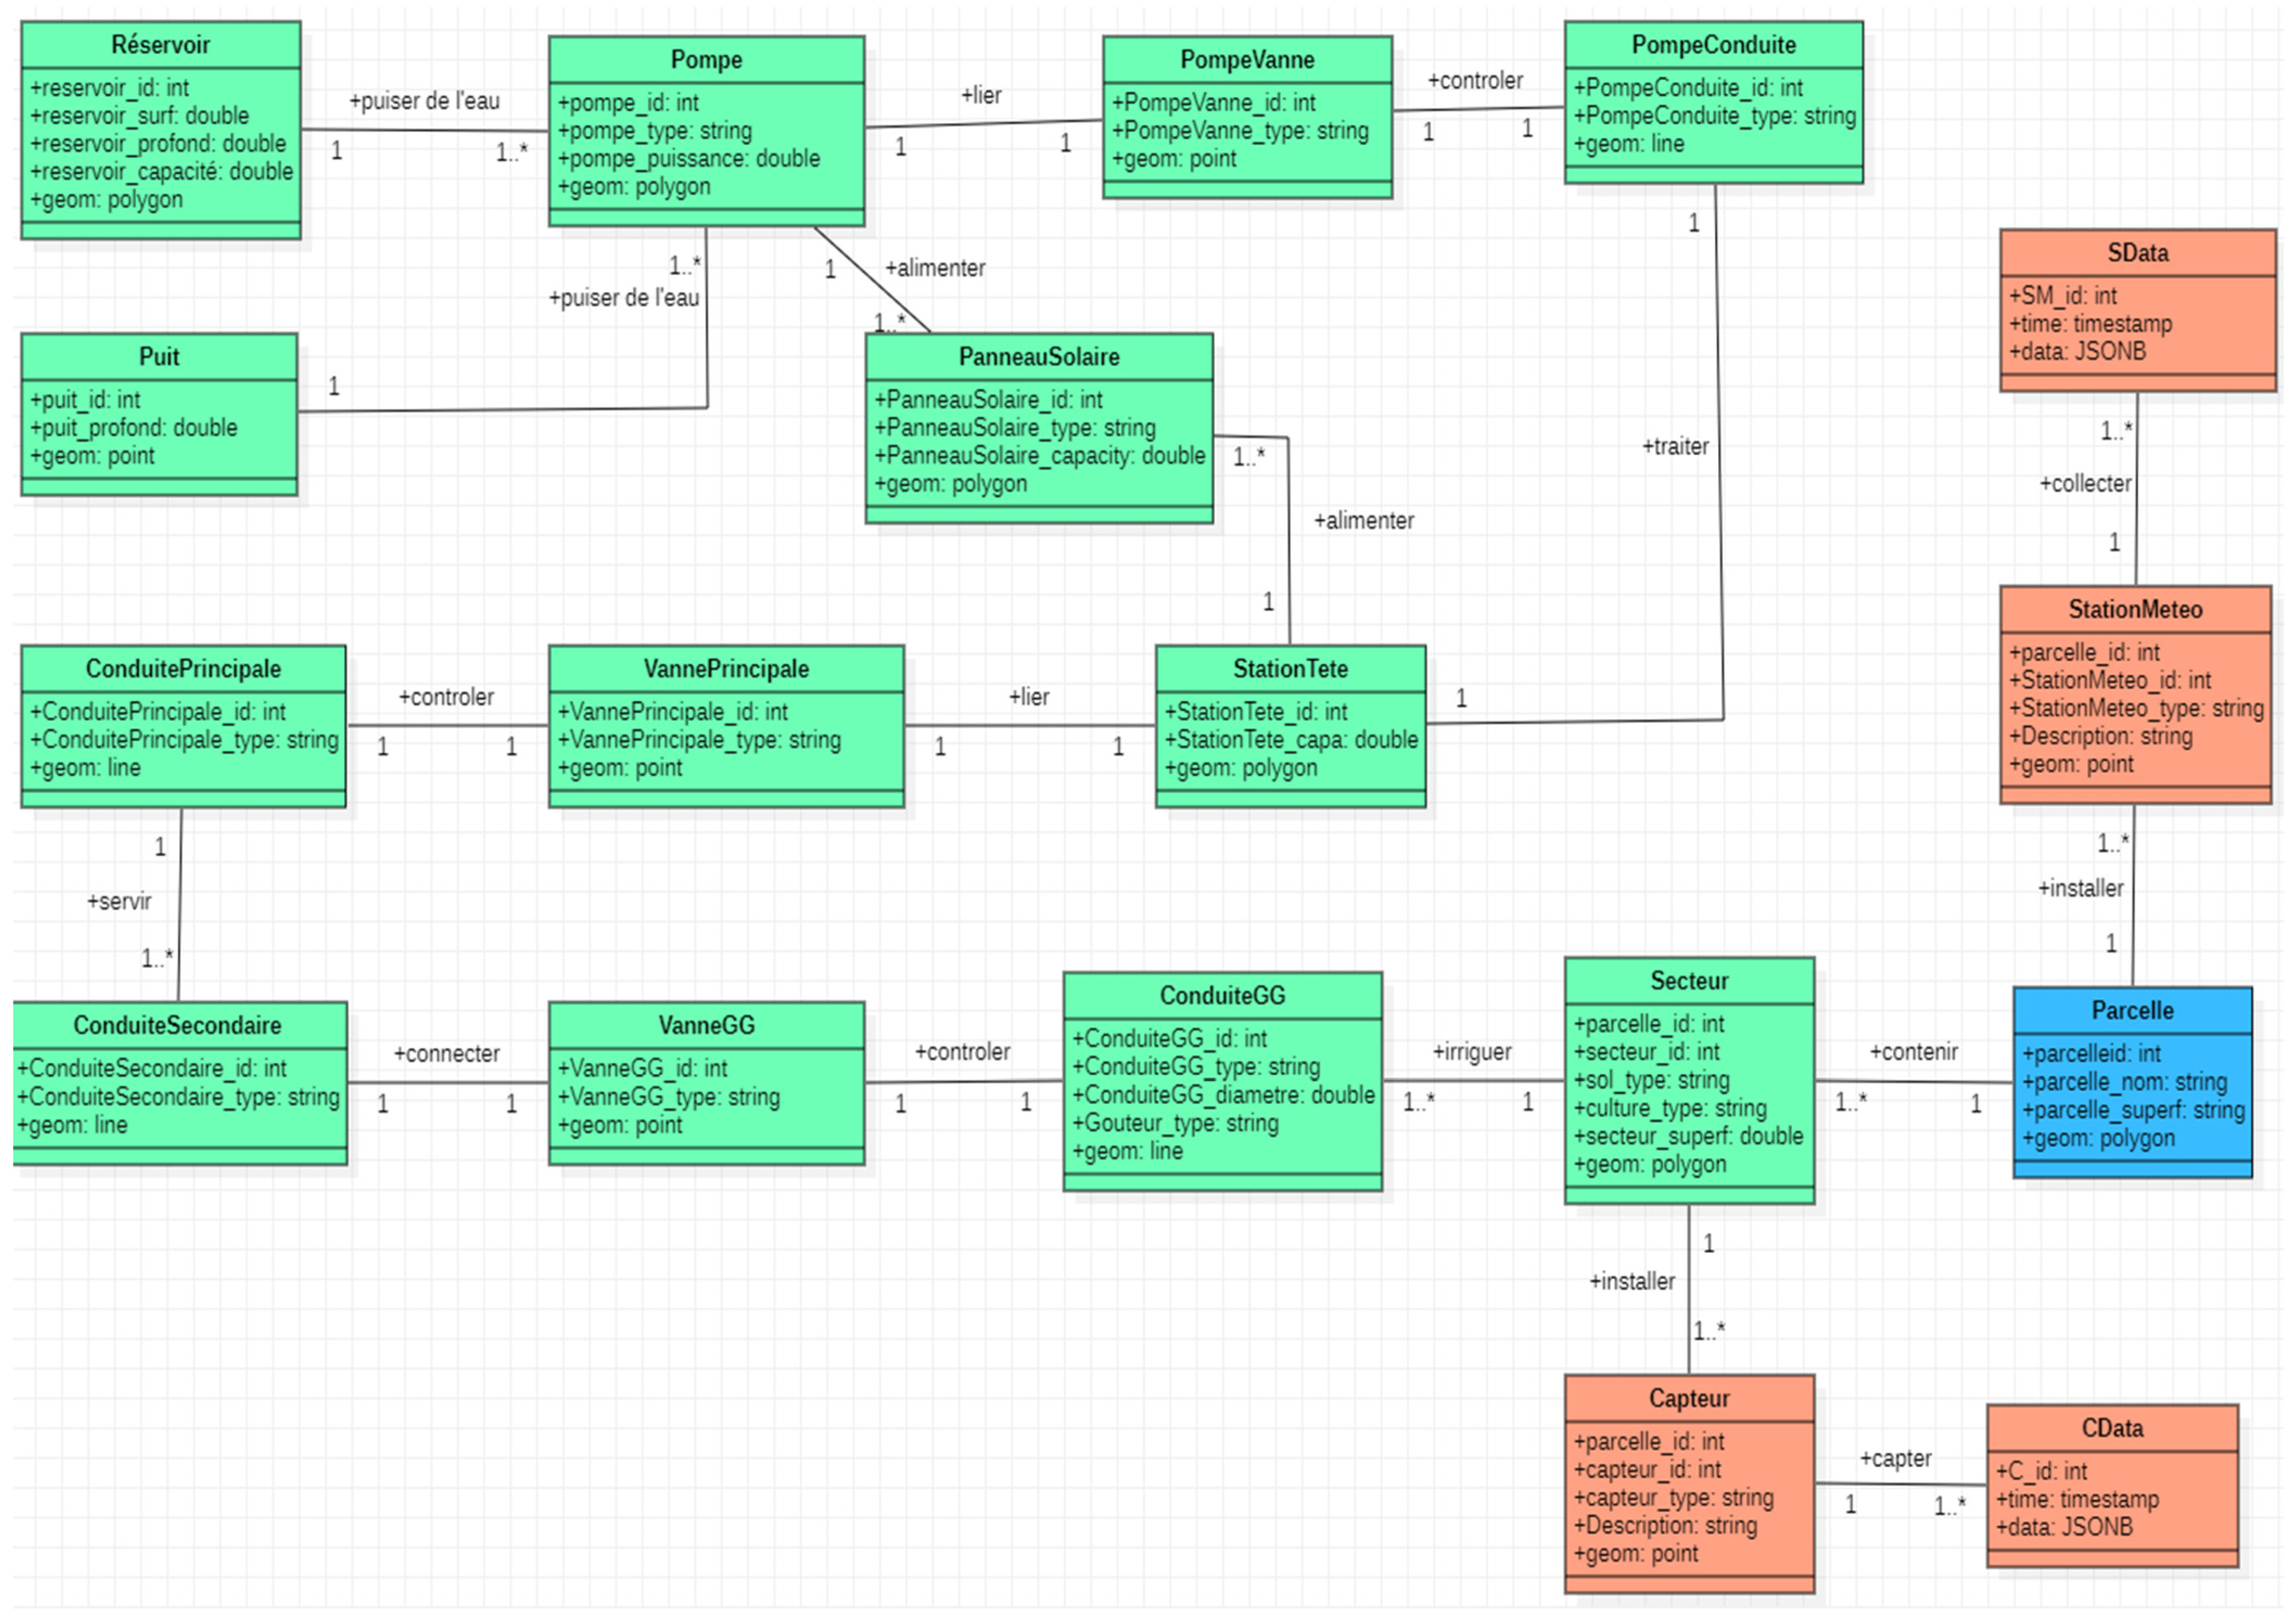
Database Design
Platforms and Development Languages Used
2.2.3. Key Steps
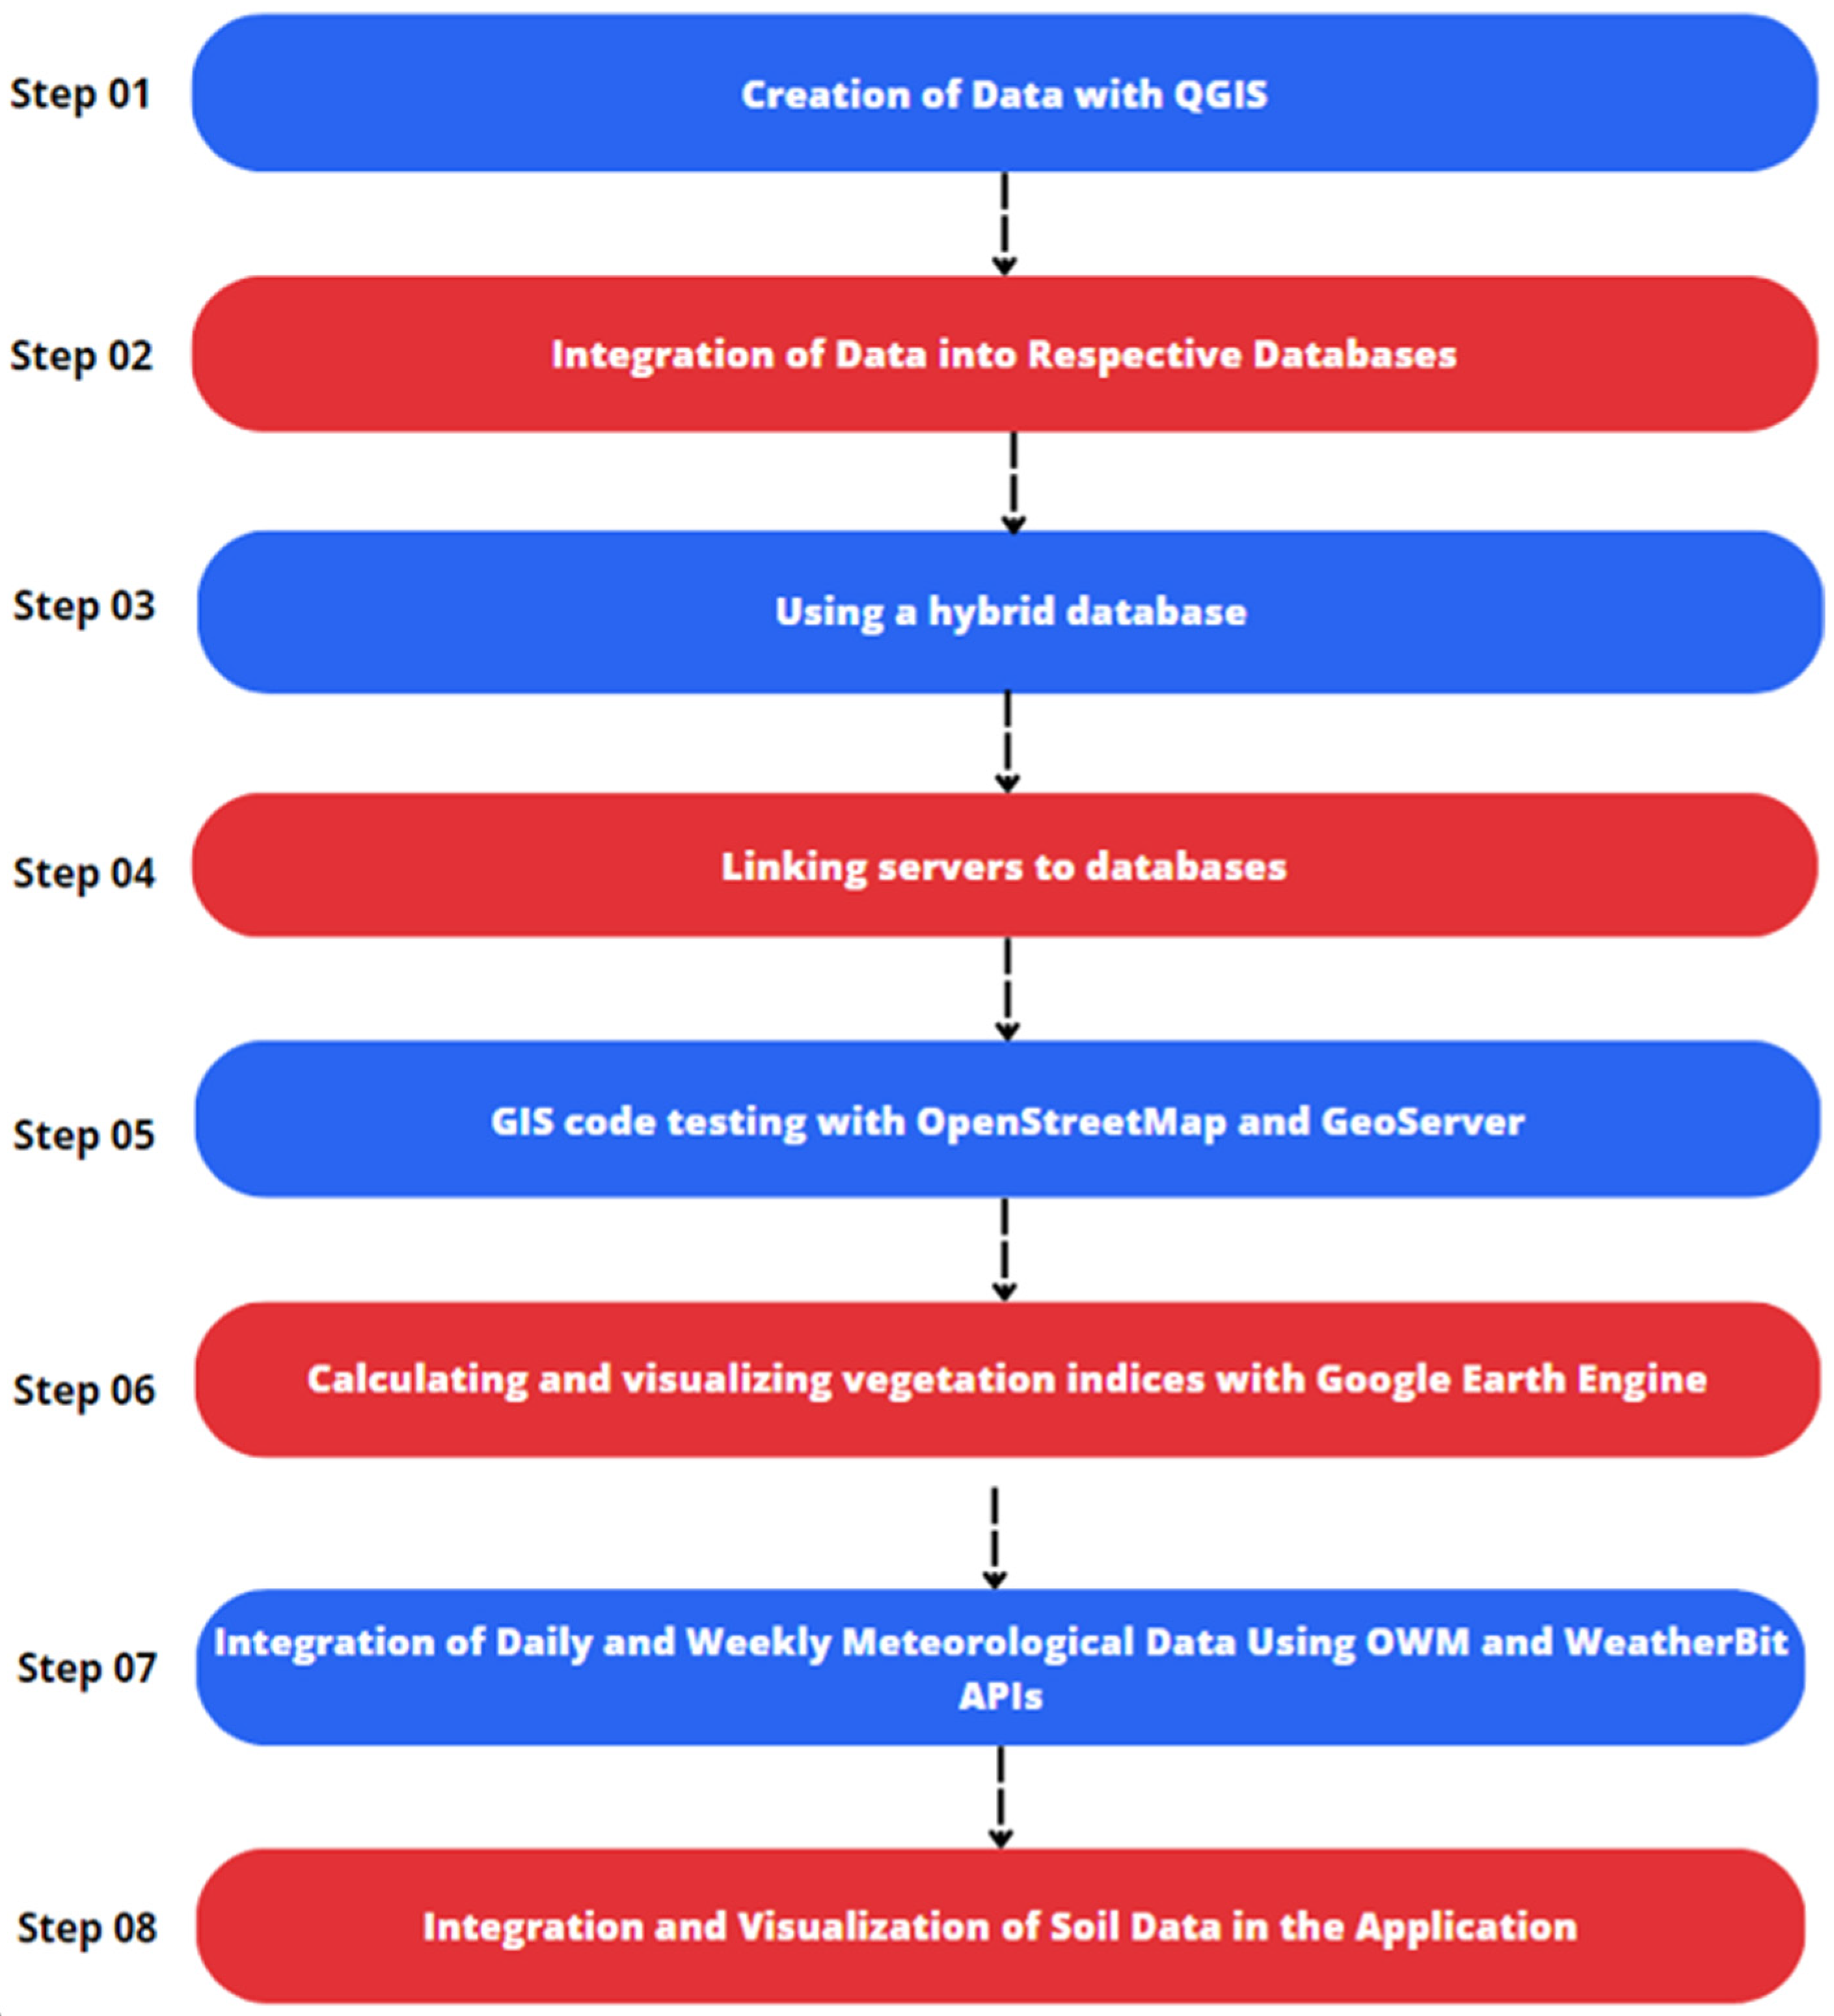
- Creation of Data with QGIS: The process began with the manual creation of provisional data using QGIS, representing spatial entities such as plots, sectors, and pumps. These data served as a foundation for testing our solution and defining the spatial entities to be visualized later on in the map;
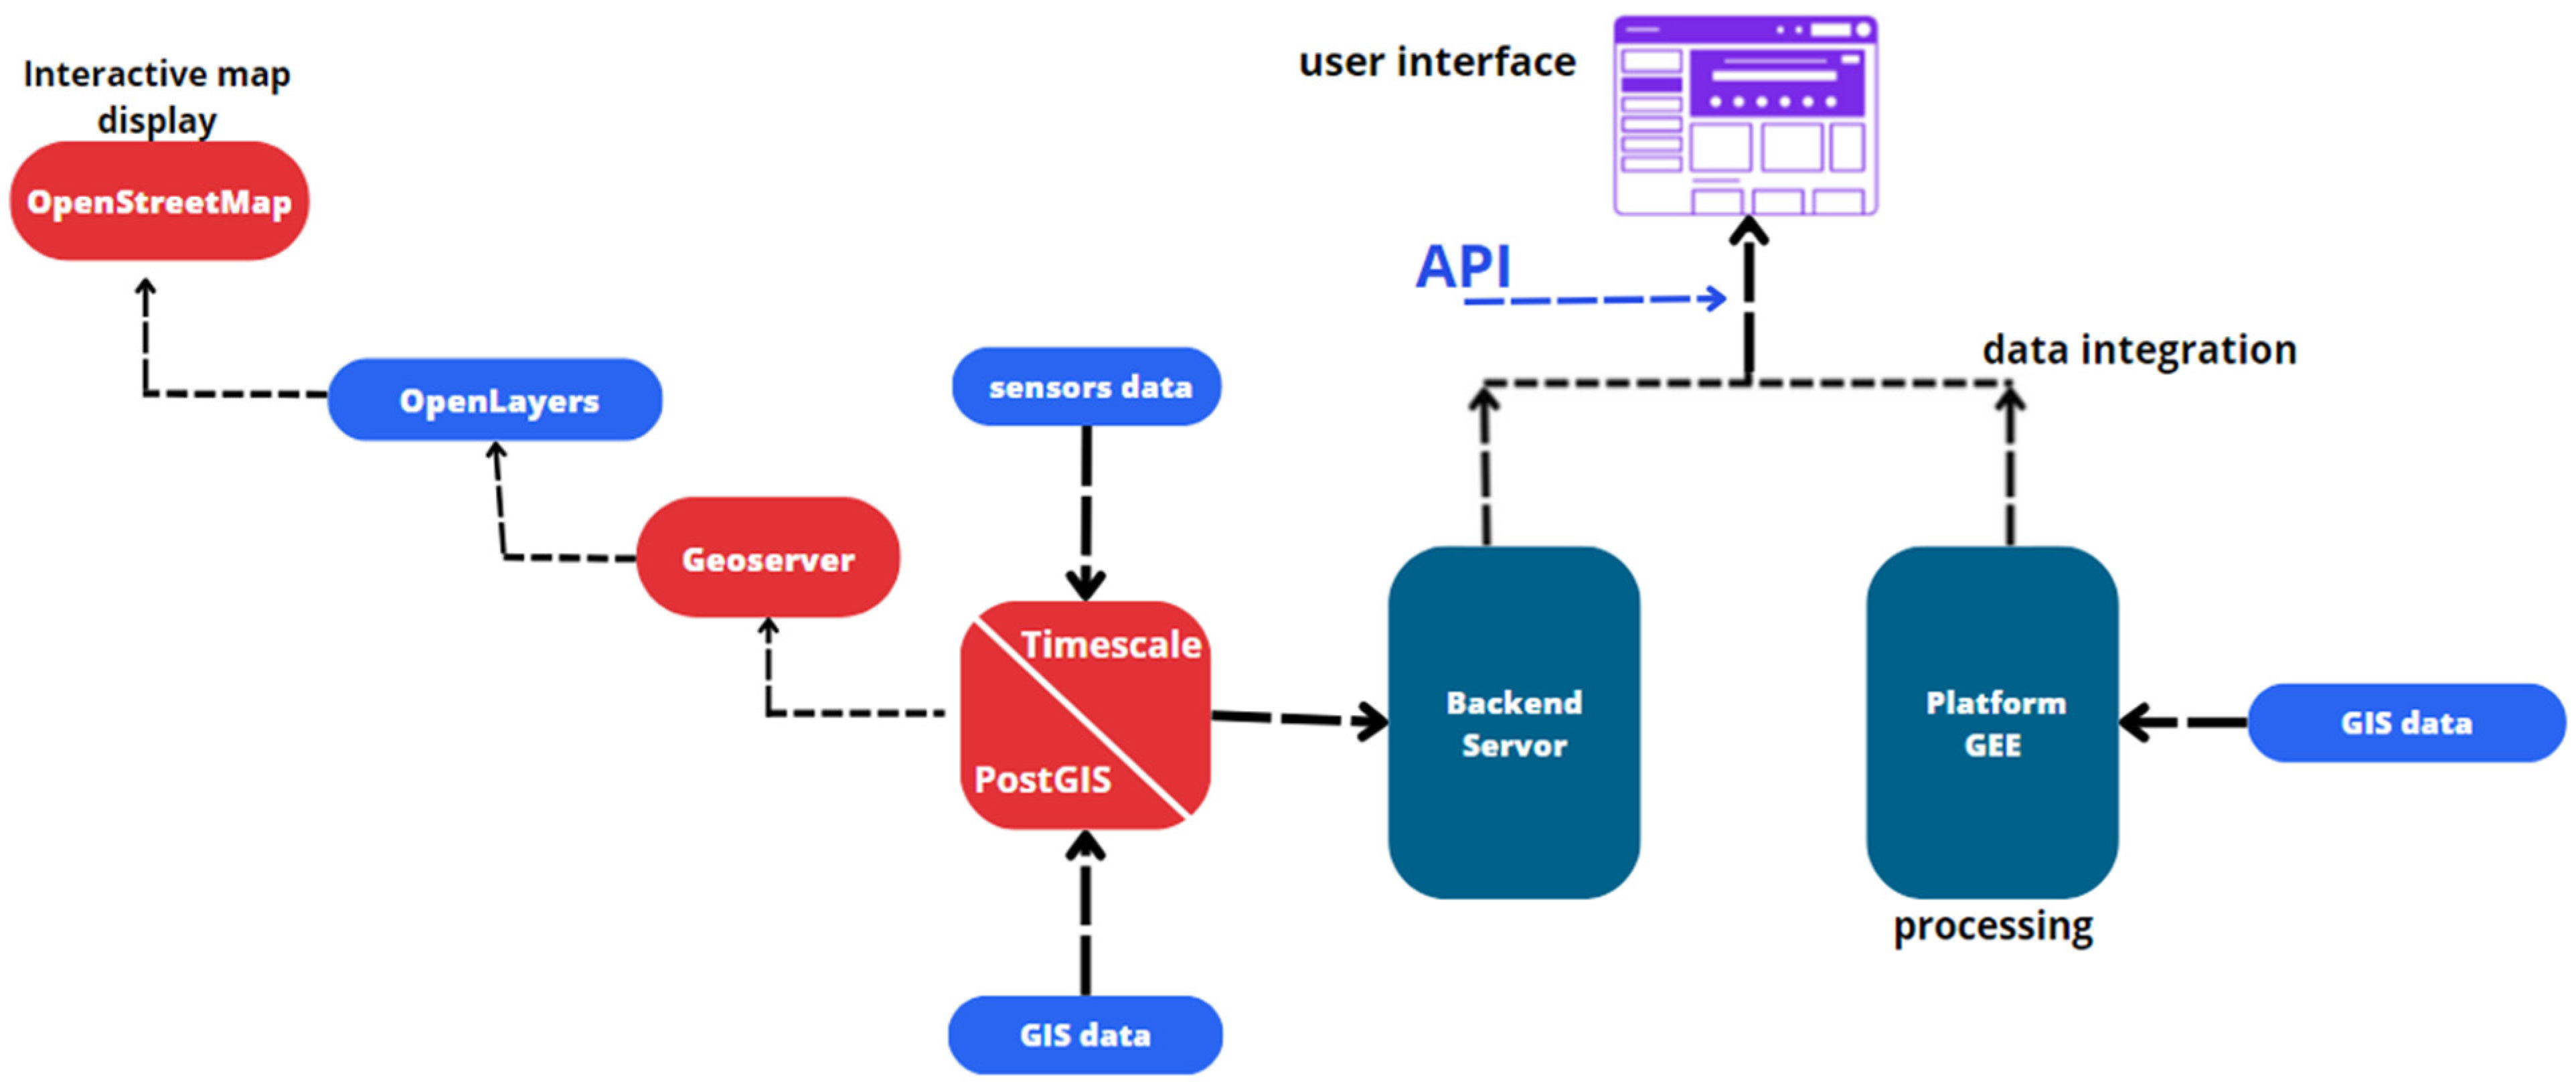
- Integration of Data into Respective Databases: The generated data were integrated into the appropriate databases. Data from soil temperature and humidity sensors were stored in TimescaleDB, while spatial entities with geometric attributes were stored in PostGIS, providing management and querying capabilities for spatial data;
- Use of a Hybrid Database: We adopted a hybrid approach using TimescaleDB as an extension of PostgreSQL to manage sensor data. This combination offered the flexibility of JSONB storage for unstructured data while maintaining the power of SQL for structured data management;
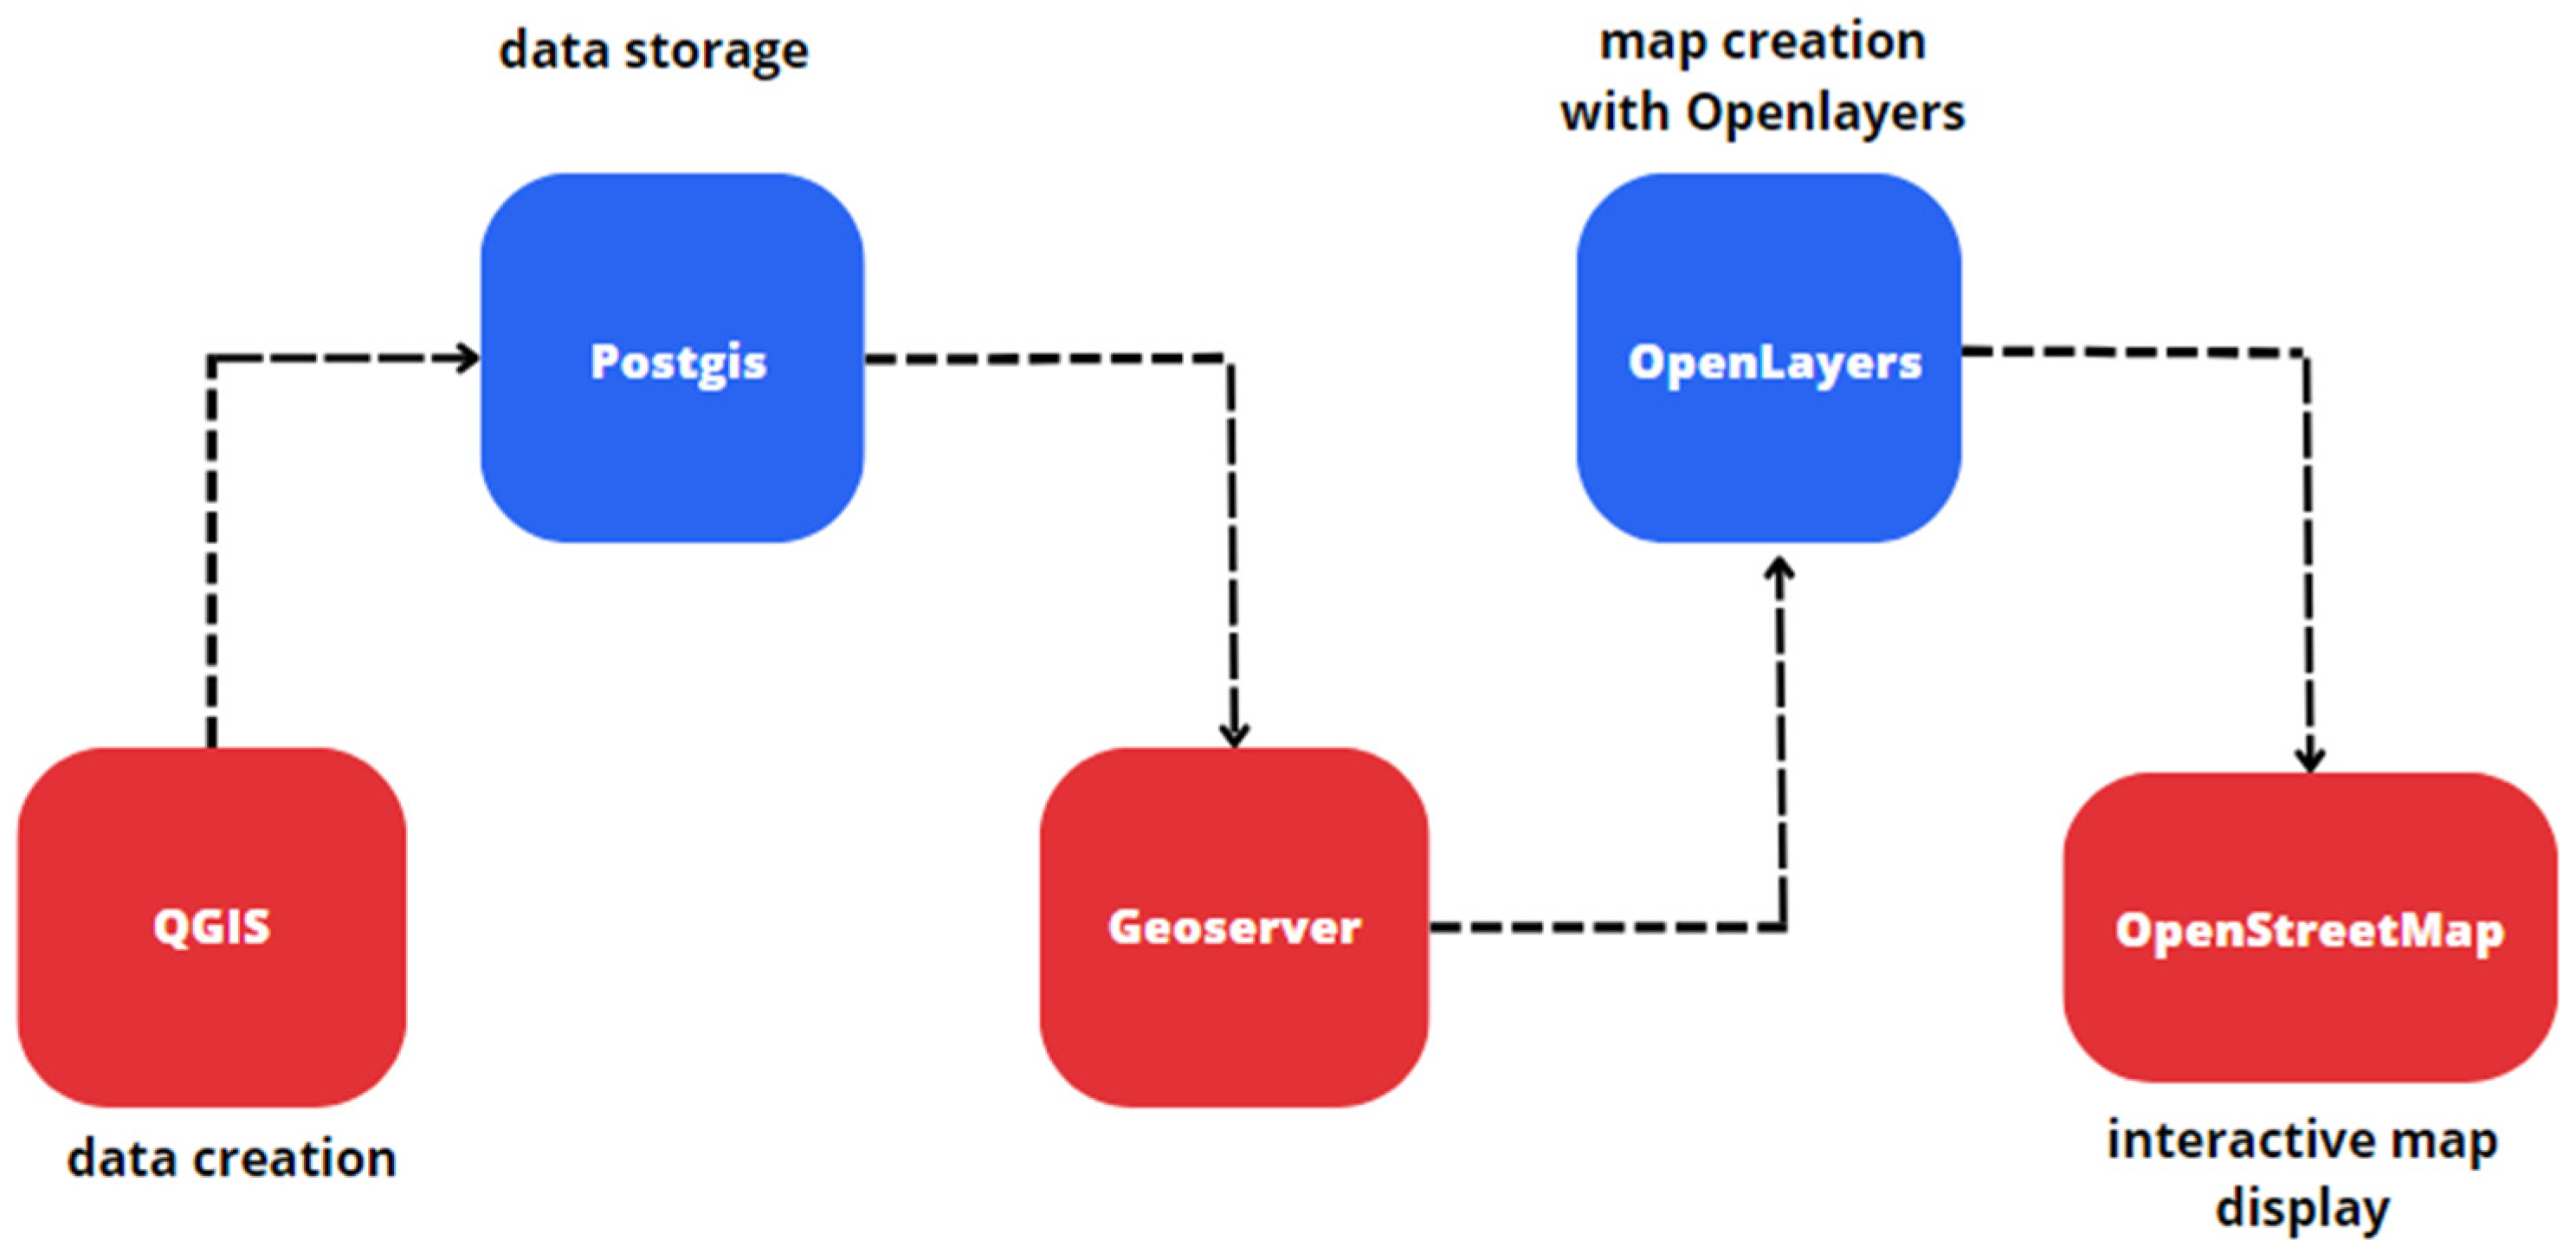
- Server Connection to Databases: A robust connection between servers and databases was established to ensure real-time data retrieval. GeoServer was paired with PostGIS to broadcast spatial entities on the map, while Node.js was used to connect to TimescaleDB and manage environmental data;
- Testing of GIS-related Code with OpenStreetMap and GeoServer: We evaluated the Geographic Information System (GIS) part using OpenStreetMap as the map base and integrating spatial entities stored in GeoServer. This approach resulted in an interactive map displaying selected elements;
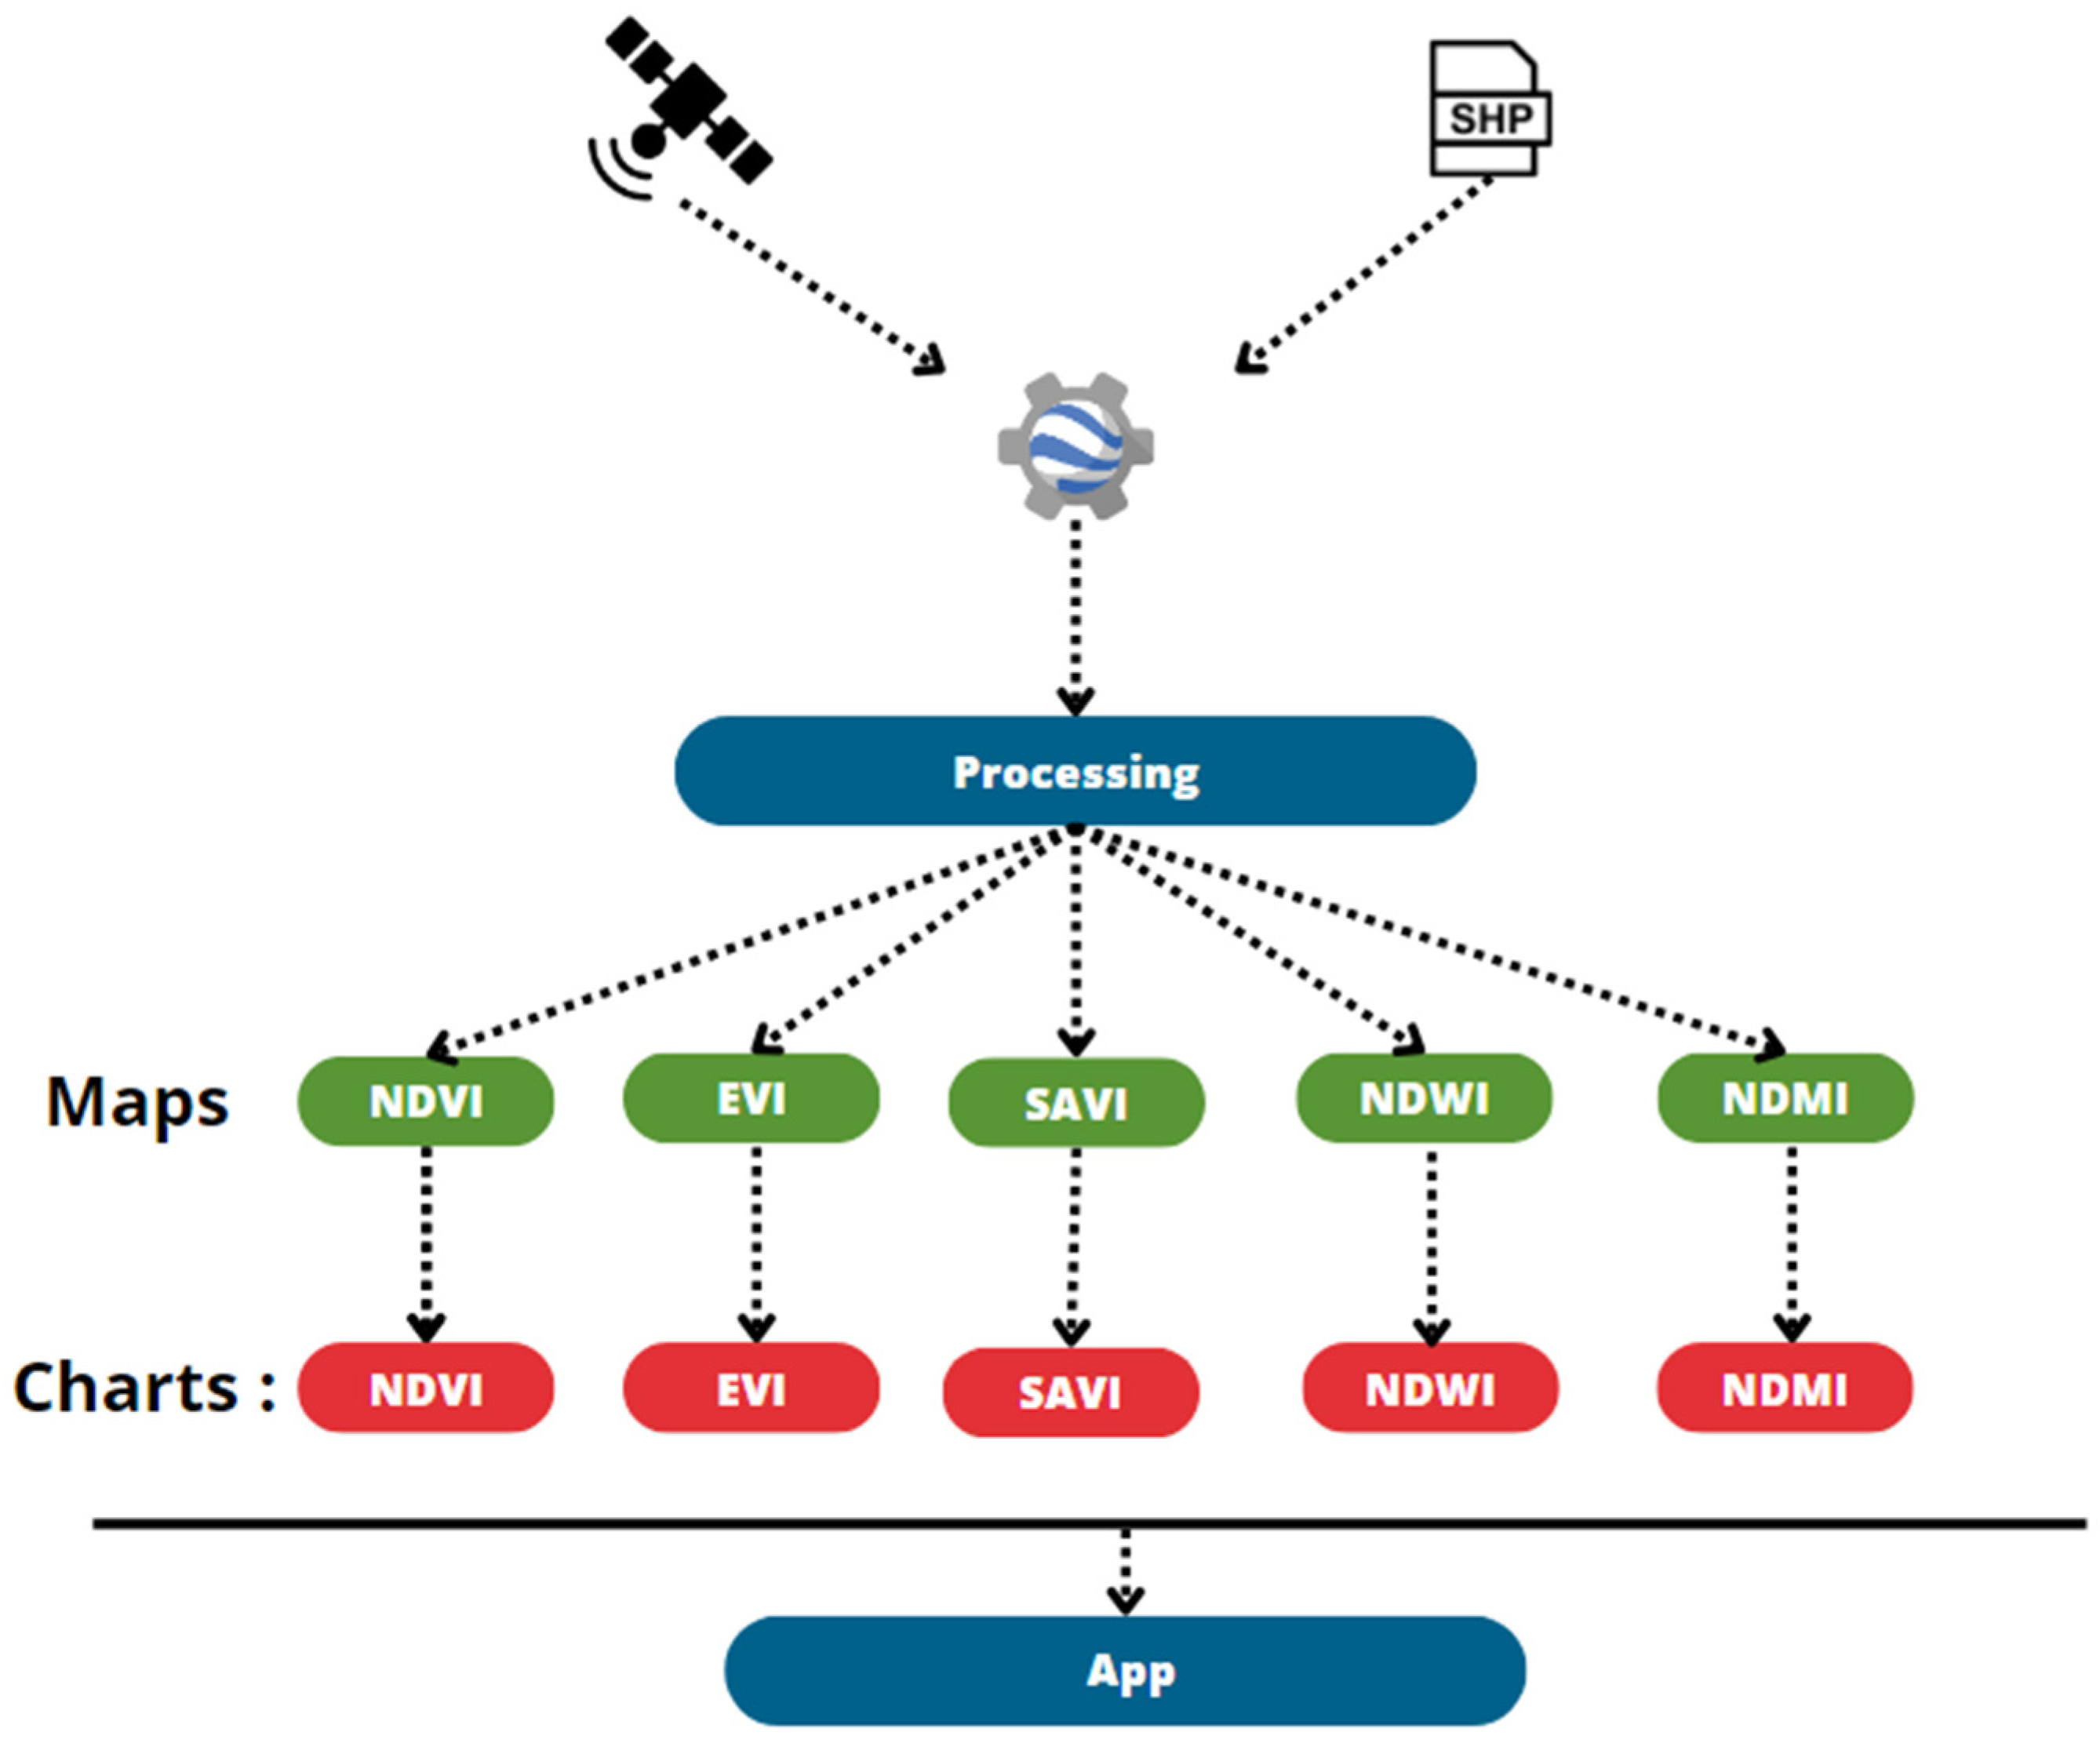
- Calculation and Visualization of Vegetation Indices with Google Earth Engine: We used Google Earth Engine, a cloud-based platform for a planetary-scale environmental data analysis and geospatial processing [30], to generate classification maps and charts representing orchard health by calculating various vegetation indices. This included importing data, processing satellite images, calculating indices, and visualizing them on maps. Here is a diagram (Figure 8) illustrating the main steps, all performed in the Earth Engine Code Editor platform:
- Integration of Daily and Weekly Meteorological Data Using OWM and WeatherBit APIs: Meteorological data were extracted from the OpenWeatherMap and WeatherBit platforms using their respective APIs. The APIs define how software components should interact, facilitating communication and integration between systems [36]. They were integrated into the front-end of the application, customizing how meteorological data are displayed. APIs provide us with information about weather conditions and other parameters, from which we calculate evapotranspiration, which is influenced by weather conditions, like solar radiation, air temperature, humidity, and wind speed, and varies with the crop type, variety, and development stage, even under similar environmental conditions due to specific characteristics [37];
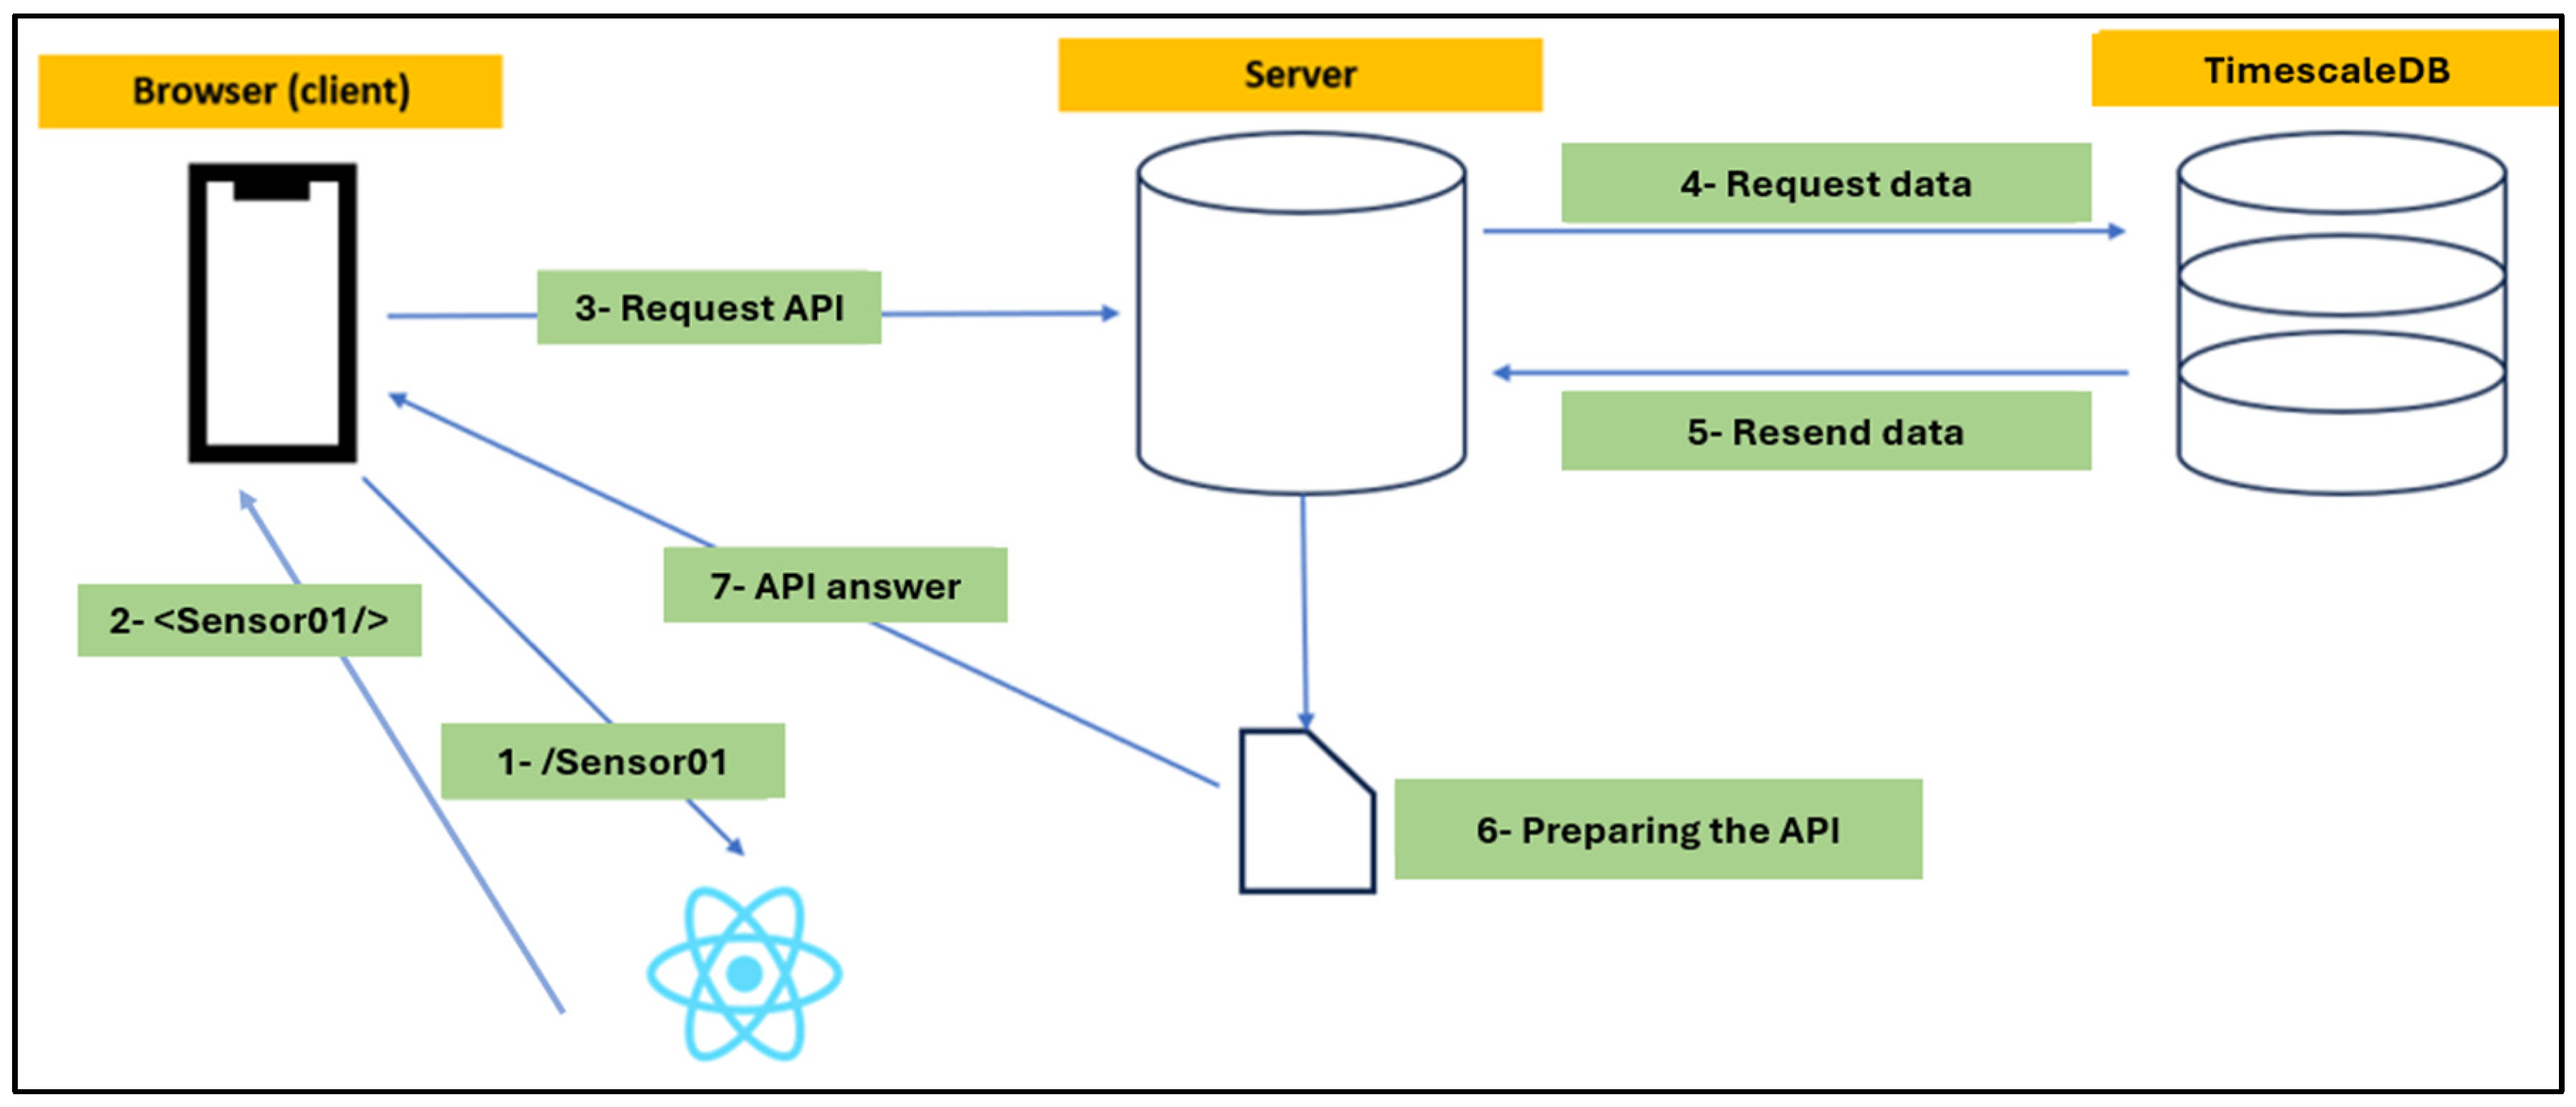
- Integration and Visualization of Soil Data in the Application: The data stored in TimescaleDB were accessible via a REST API, enabling communication between the front-end (built in React) and the backend (built in Node.js). The Single-Page Application (SPA), a web app that loads a single HTML page and updates dynamically for a seamless experience [38], was utilized to display and visualize data on the user interface, providing an interactive and smooth user experience;
- The following diagram (Figure 9) outlines the steps of Client-Side Rendering, a web development approach where the browser processes and renders content, reducing server involvement [39], (CSR: React in our case) to communicate with the server and visualize data (taking the example of the URL ‘localhost/Sensor01’, corresponding to the visualization of soil data from sensor n° 01):
3. Results and Validation
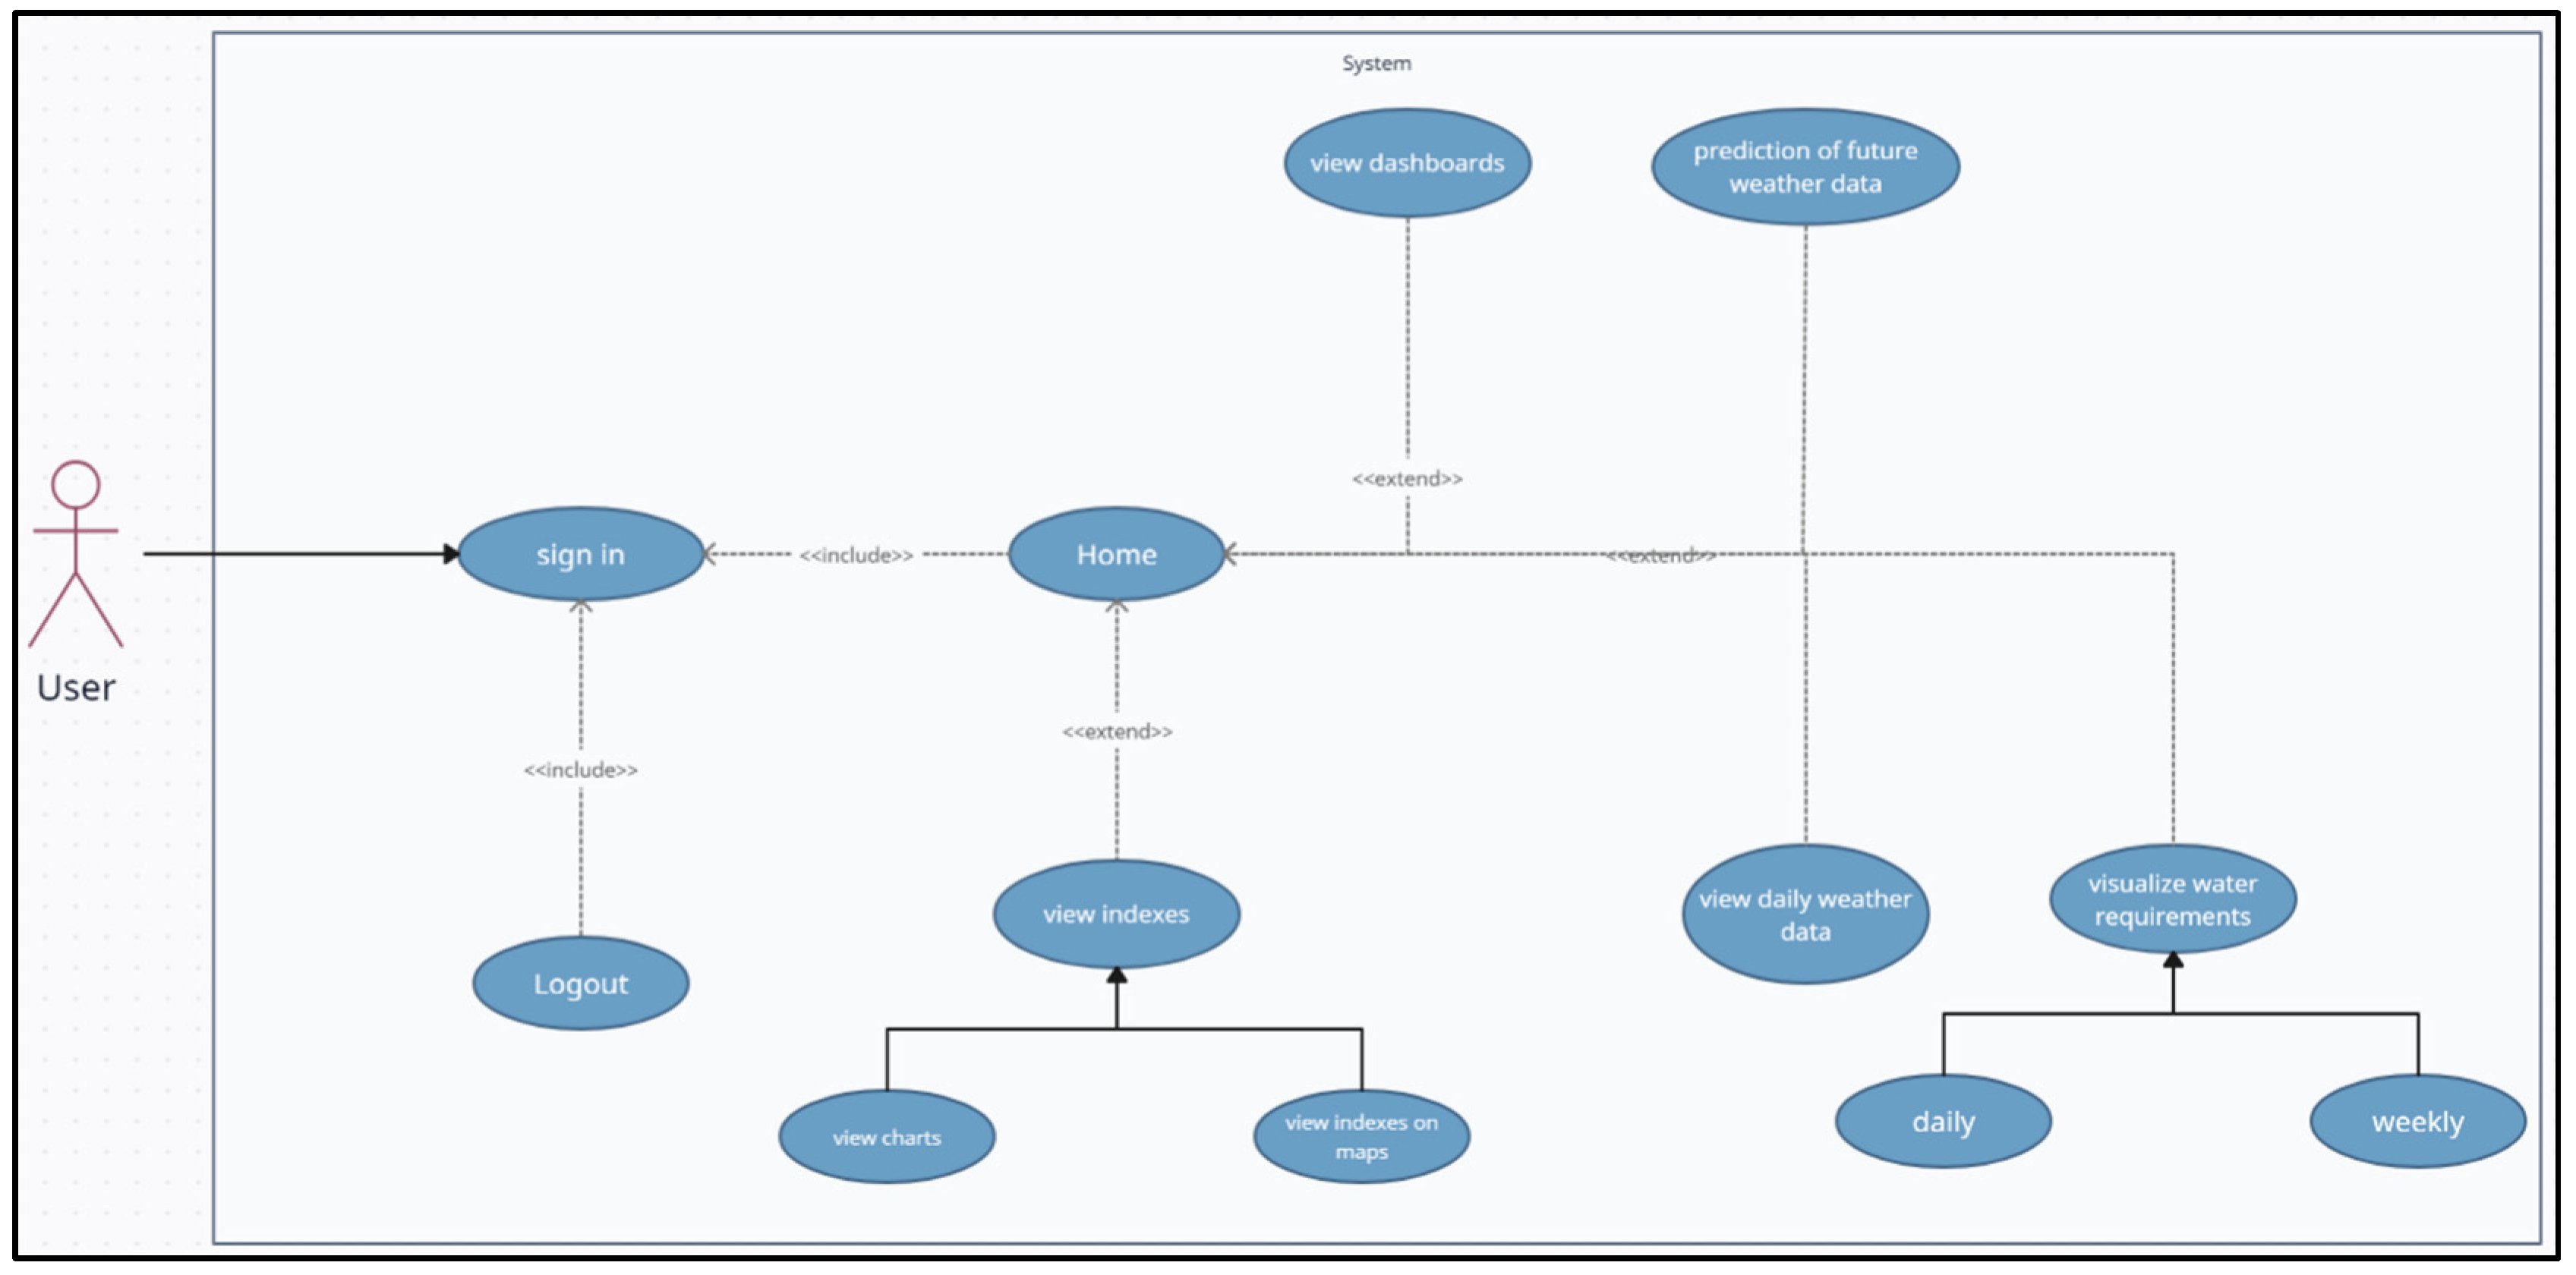
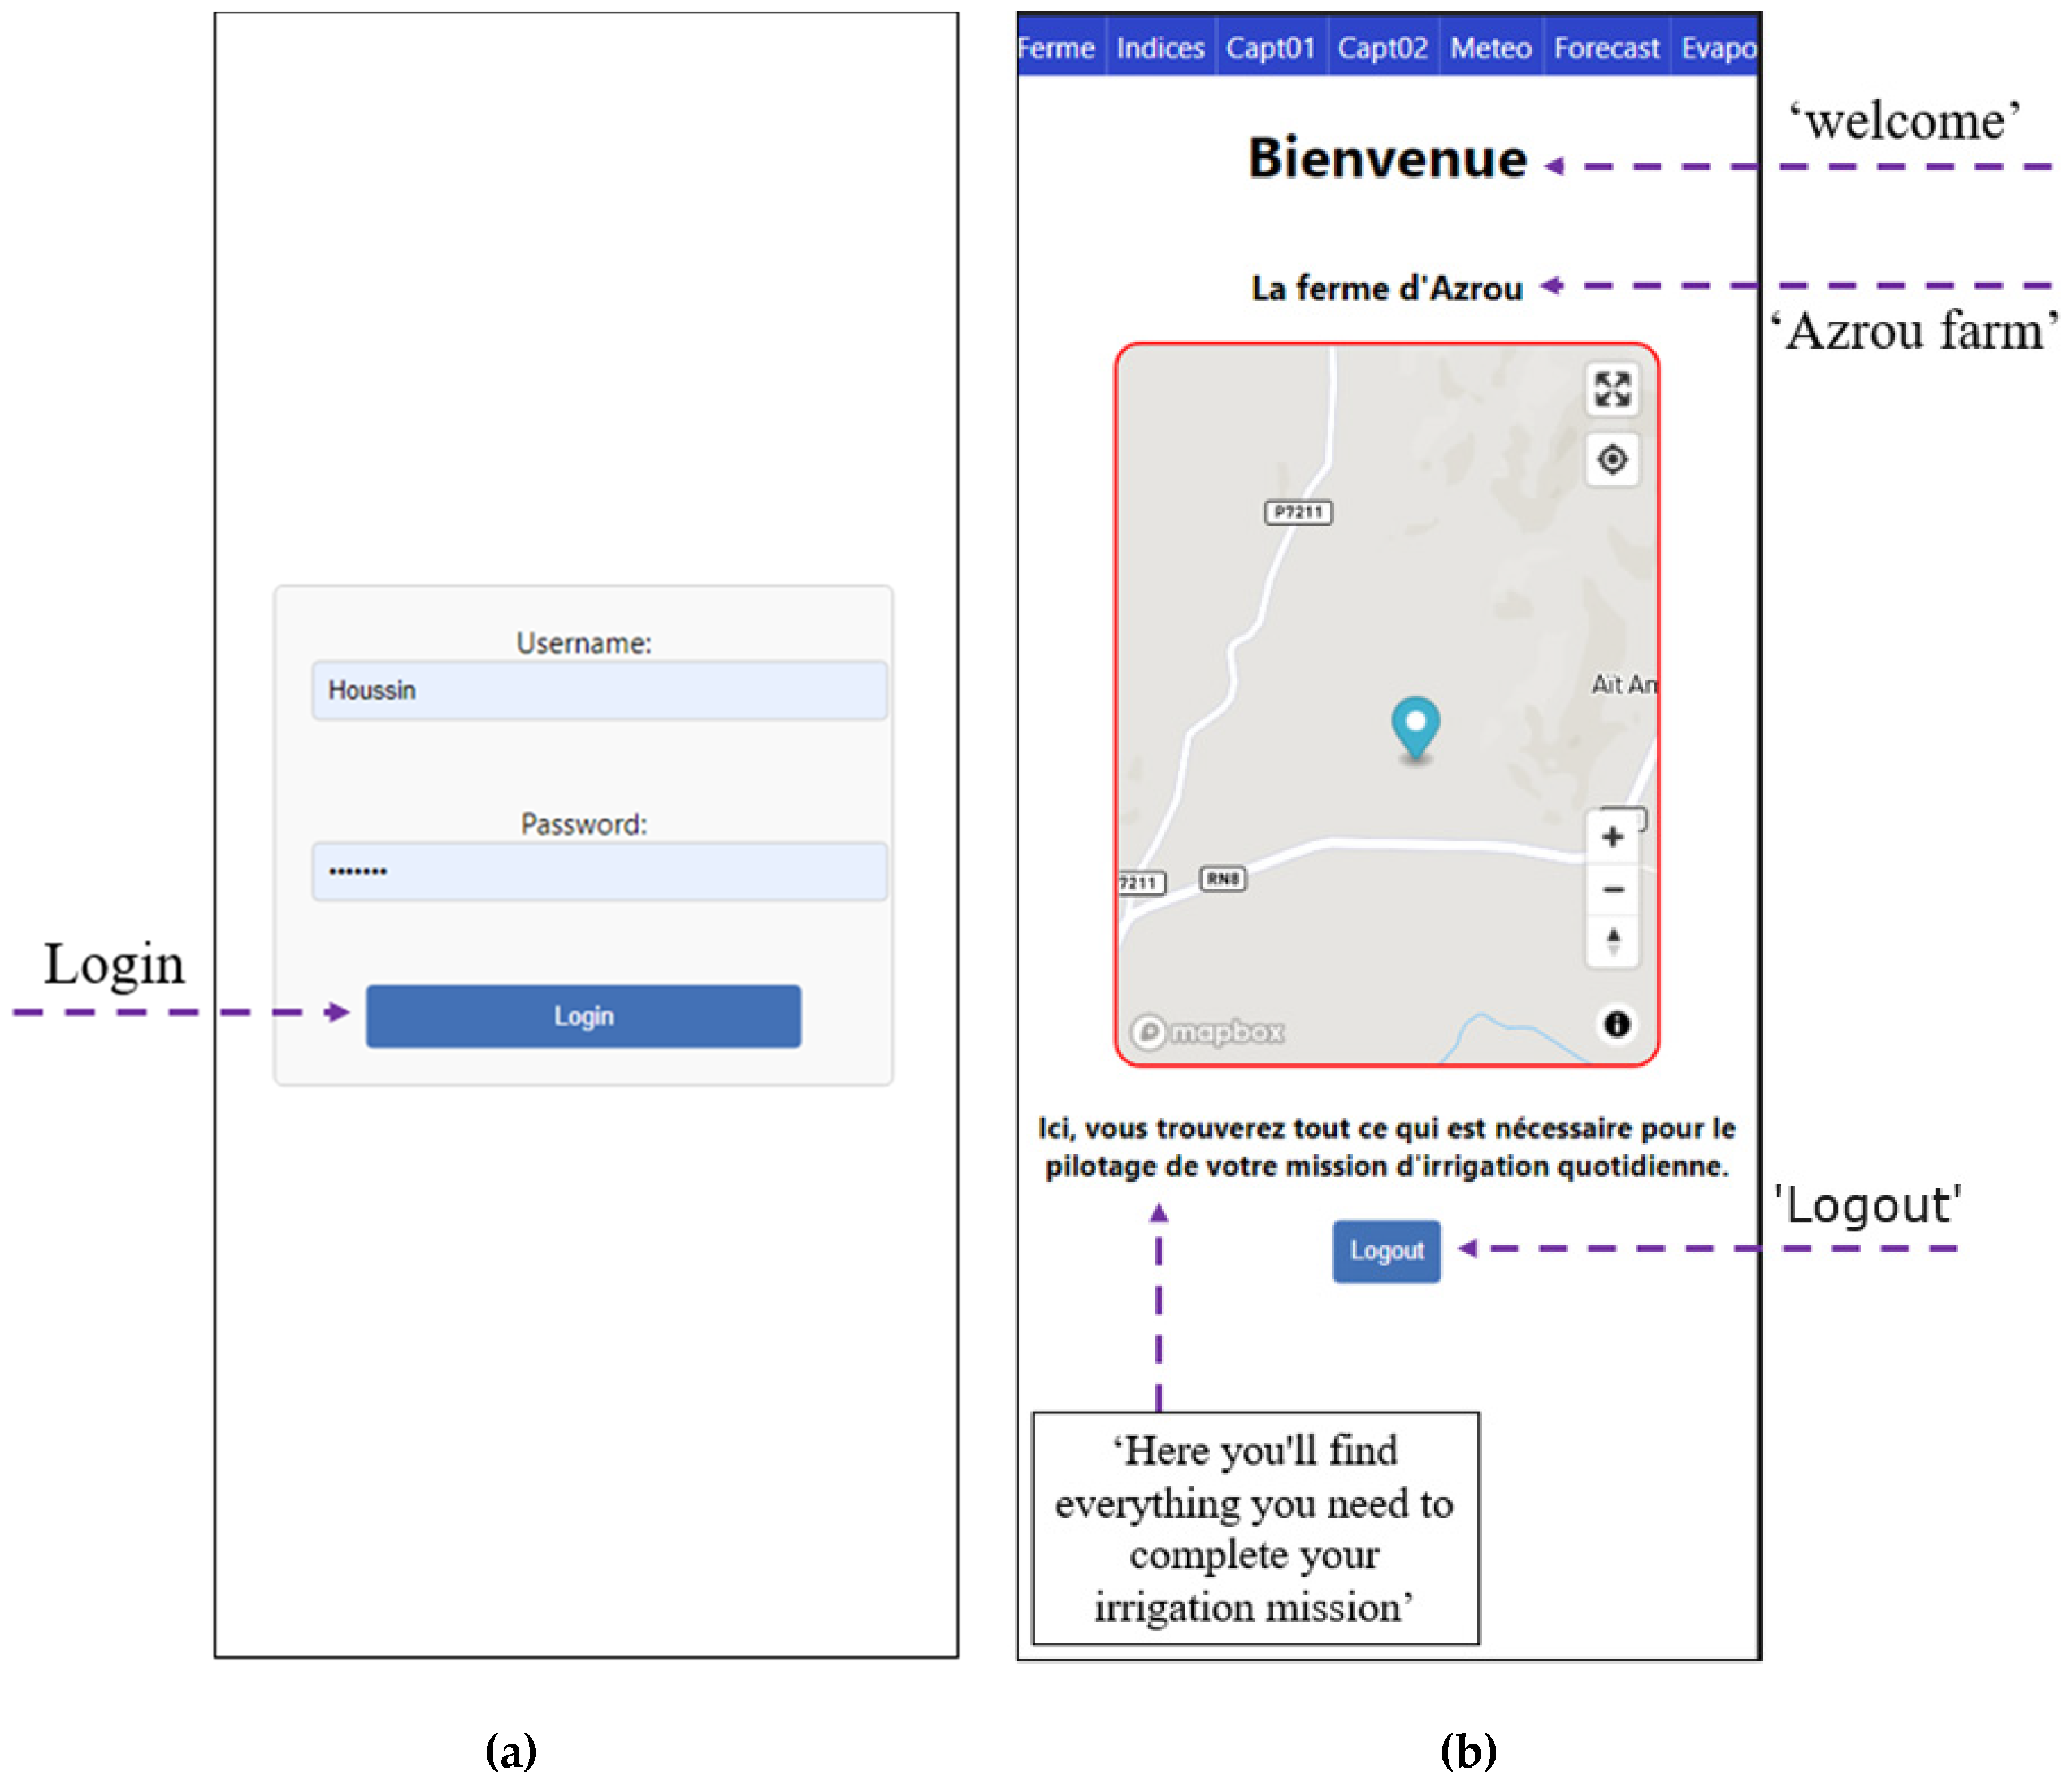
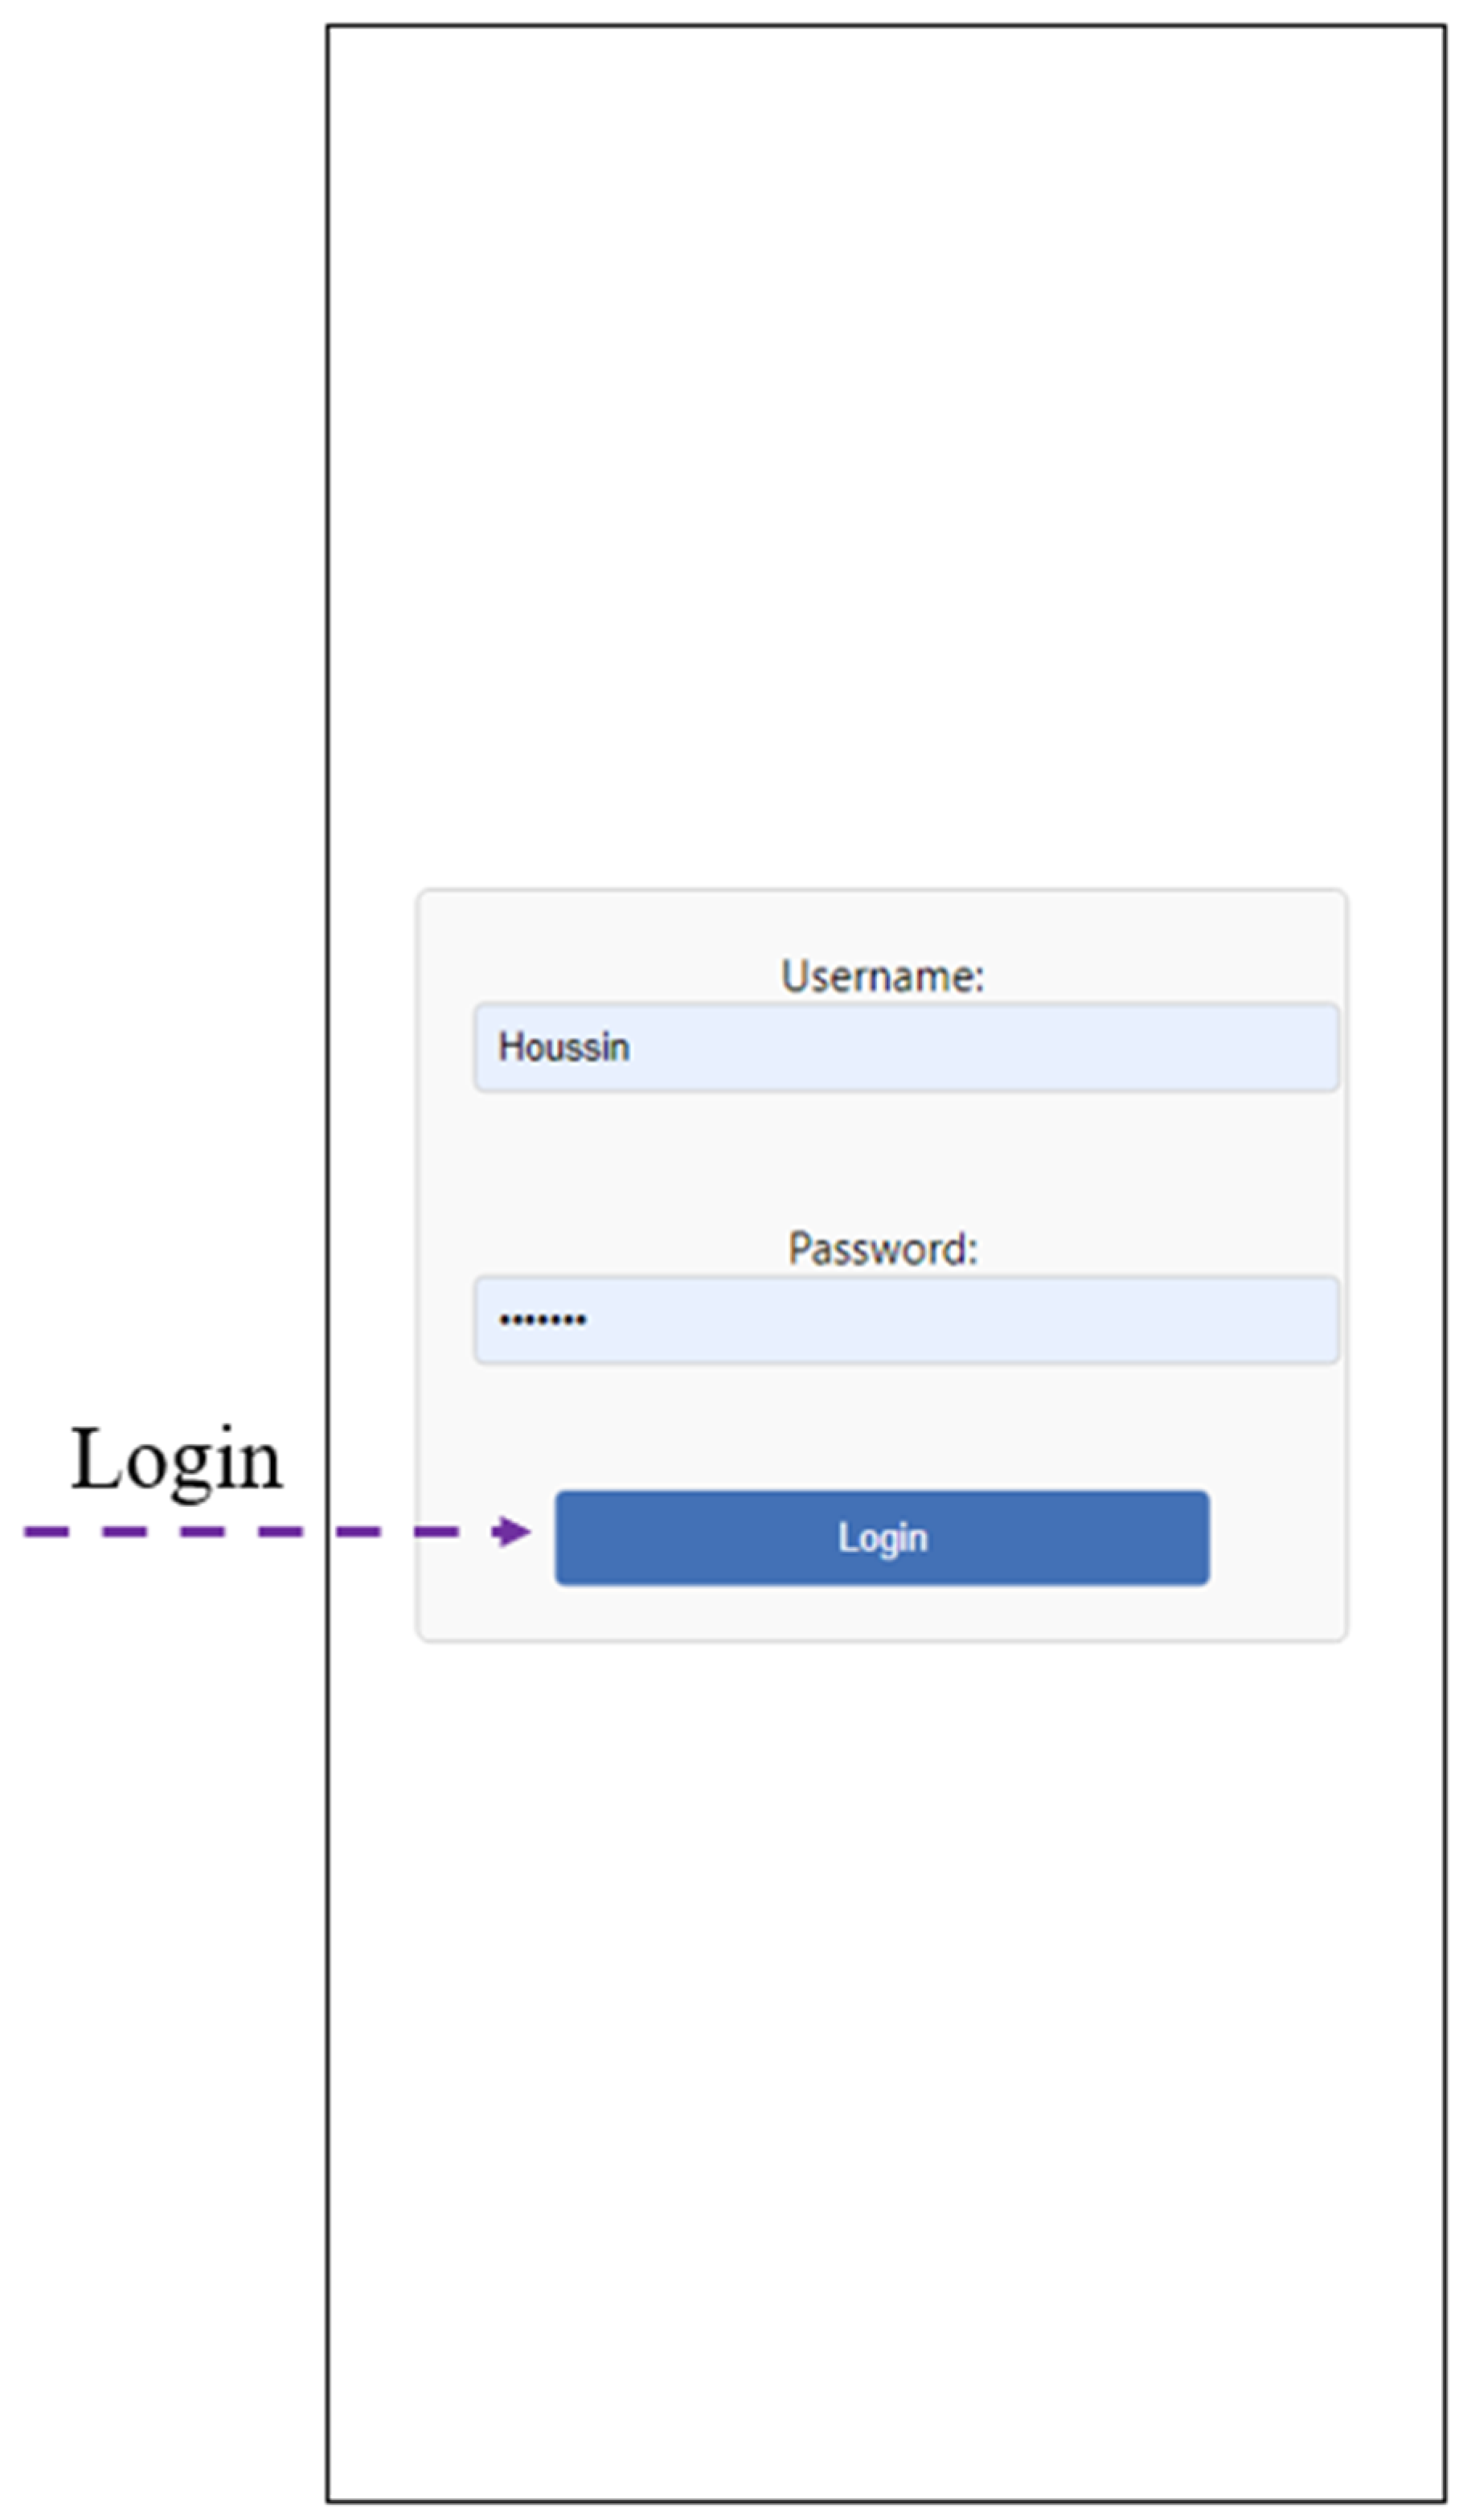
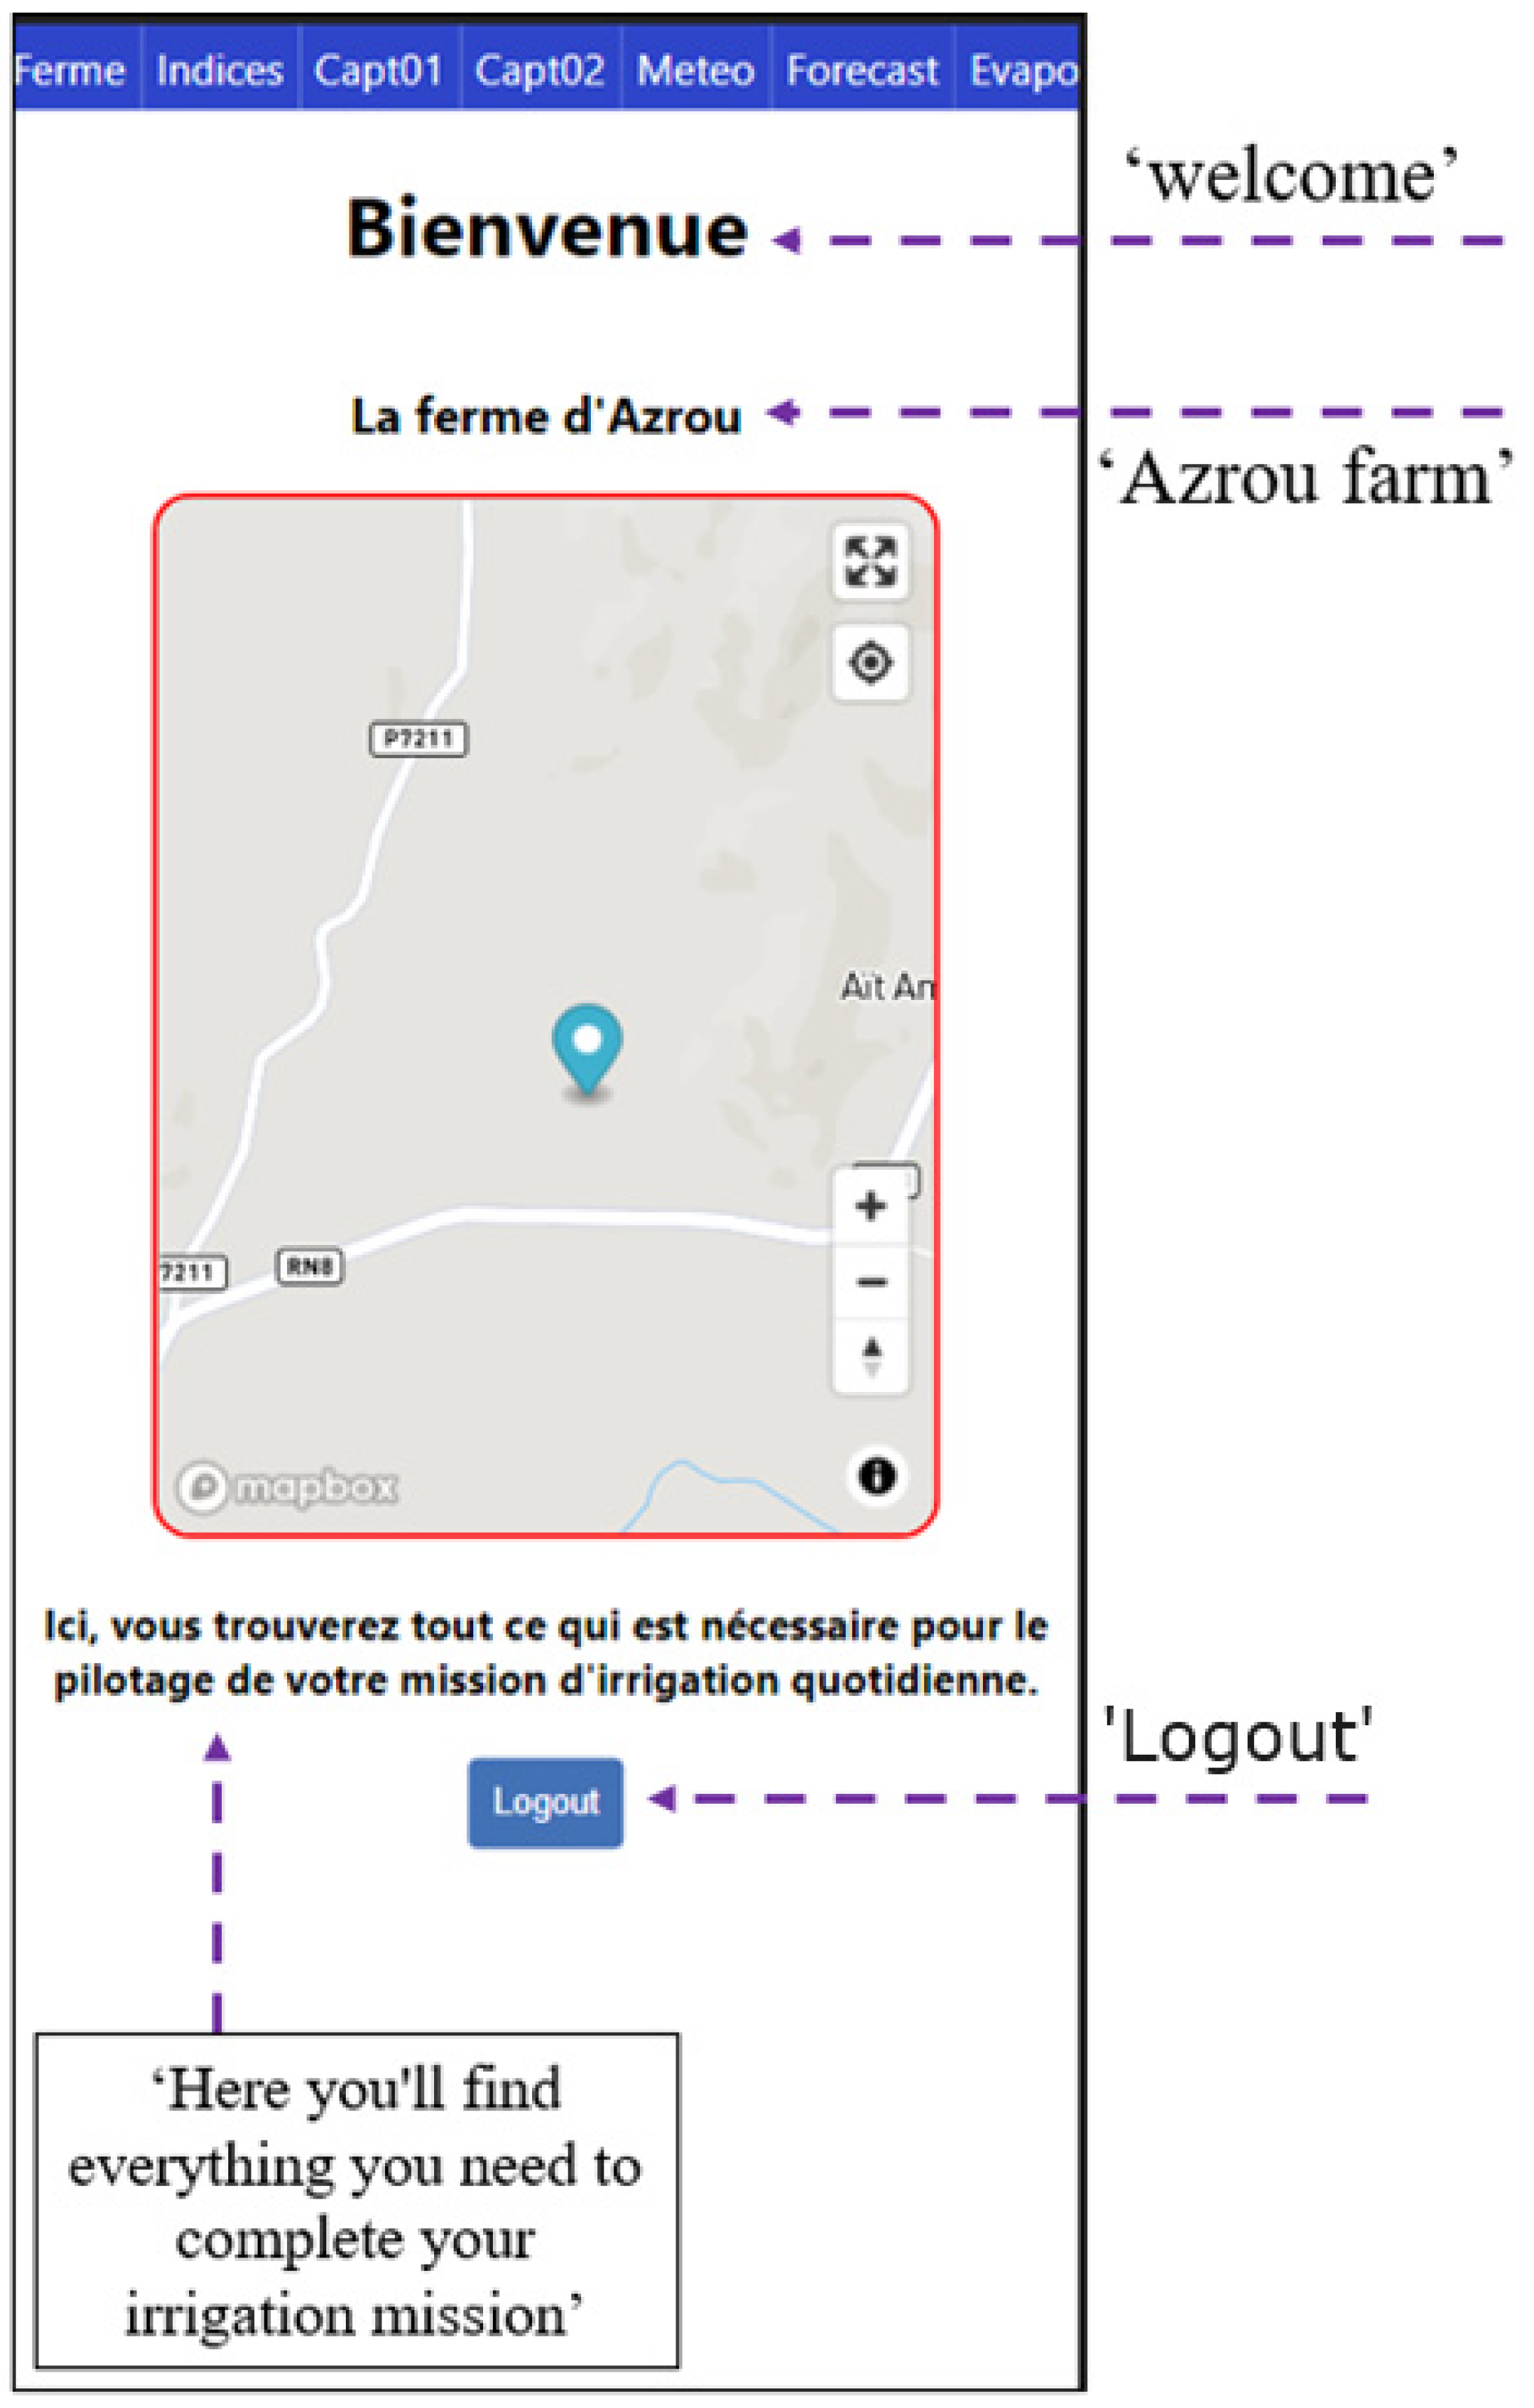
- Access Page (Figure 10a): This segment focuses on the access page of the application, emphasizing its crucial role in user interaction. Users input their credentials (username and password) to gain entry to the application. Upon successful authentication, they are directed to the home page; otherwise, an error message is displayed.
- Home page (Figure 10b): The home page is defined as the users’ initial impression. It showcases a map centered on the farm, a marker for the centroid, and a navigation bar to access various functionalities.
- 3.
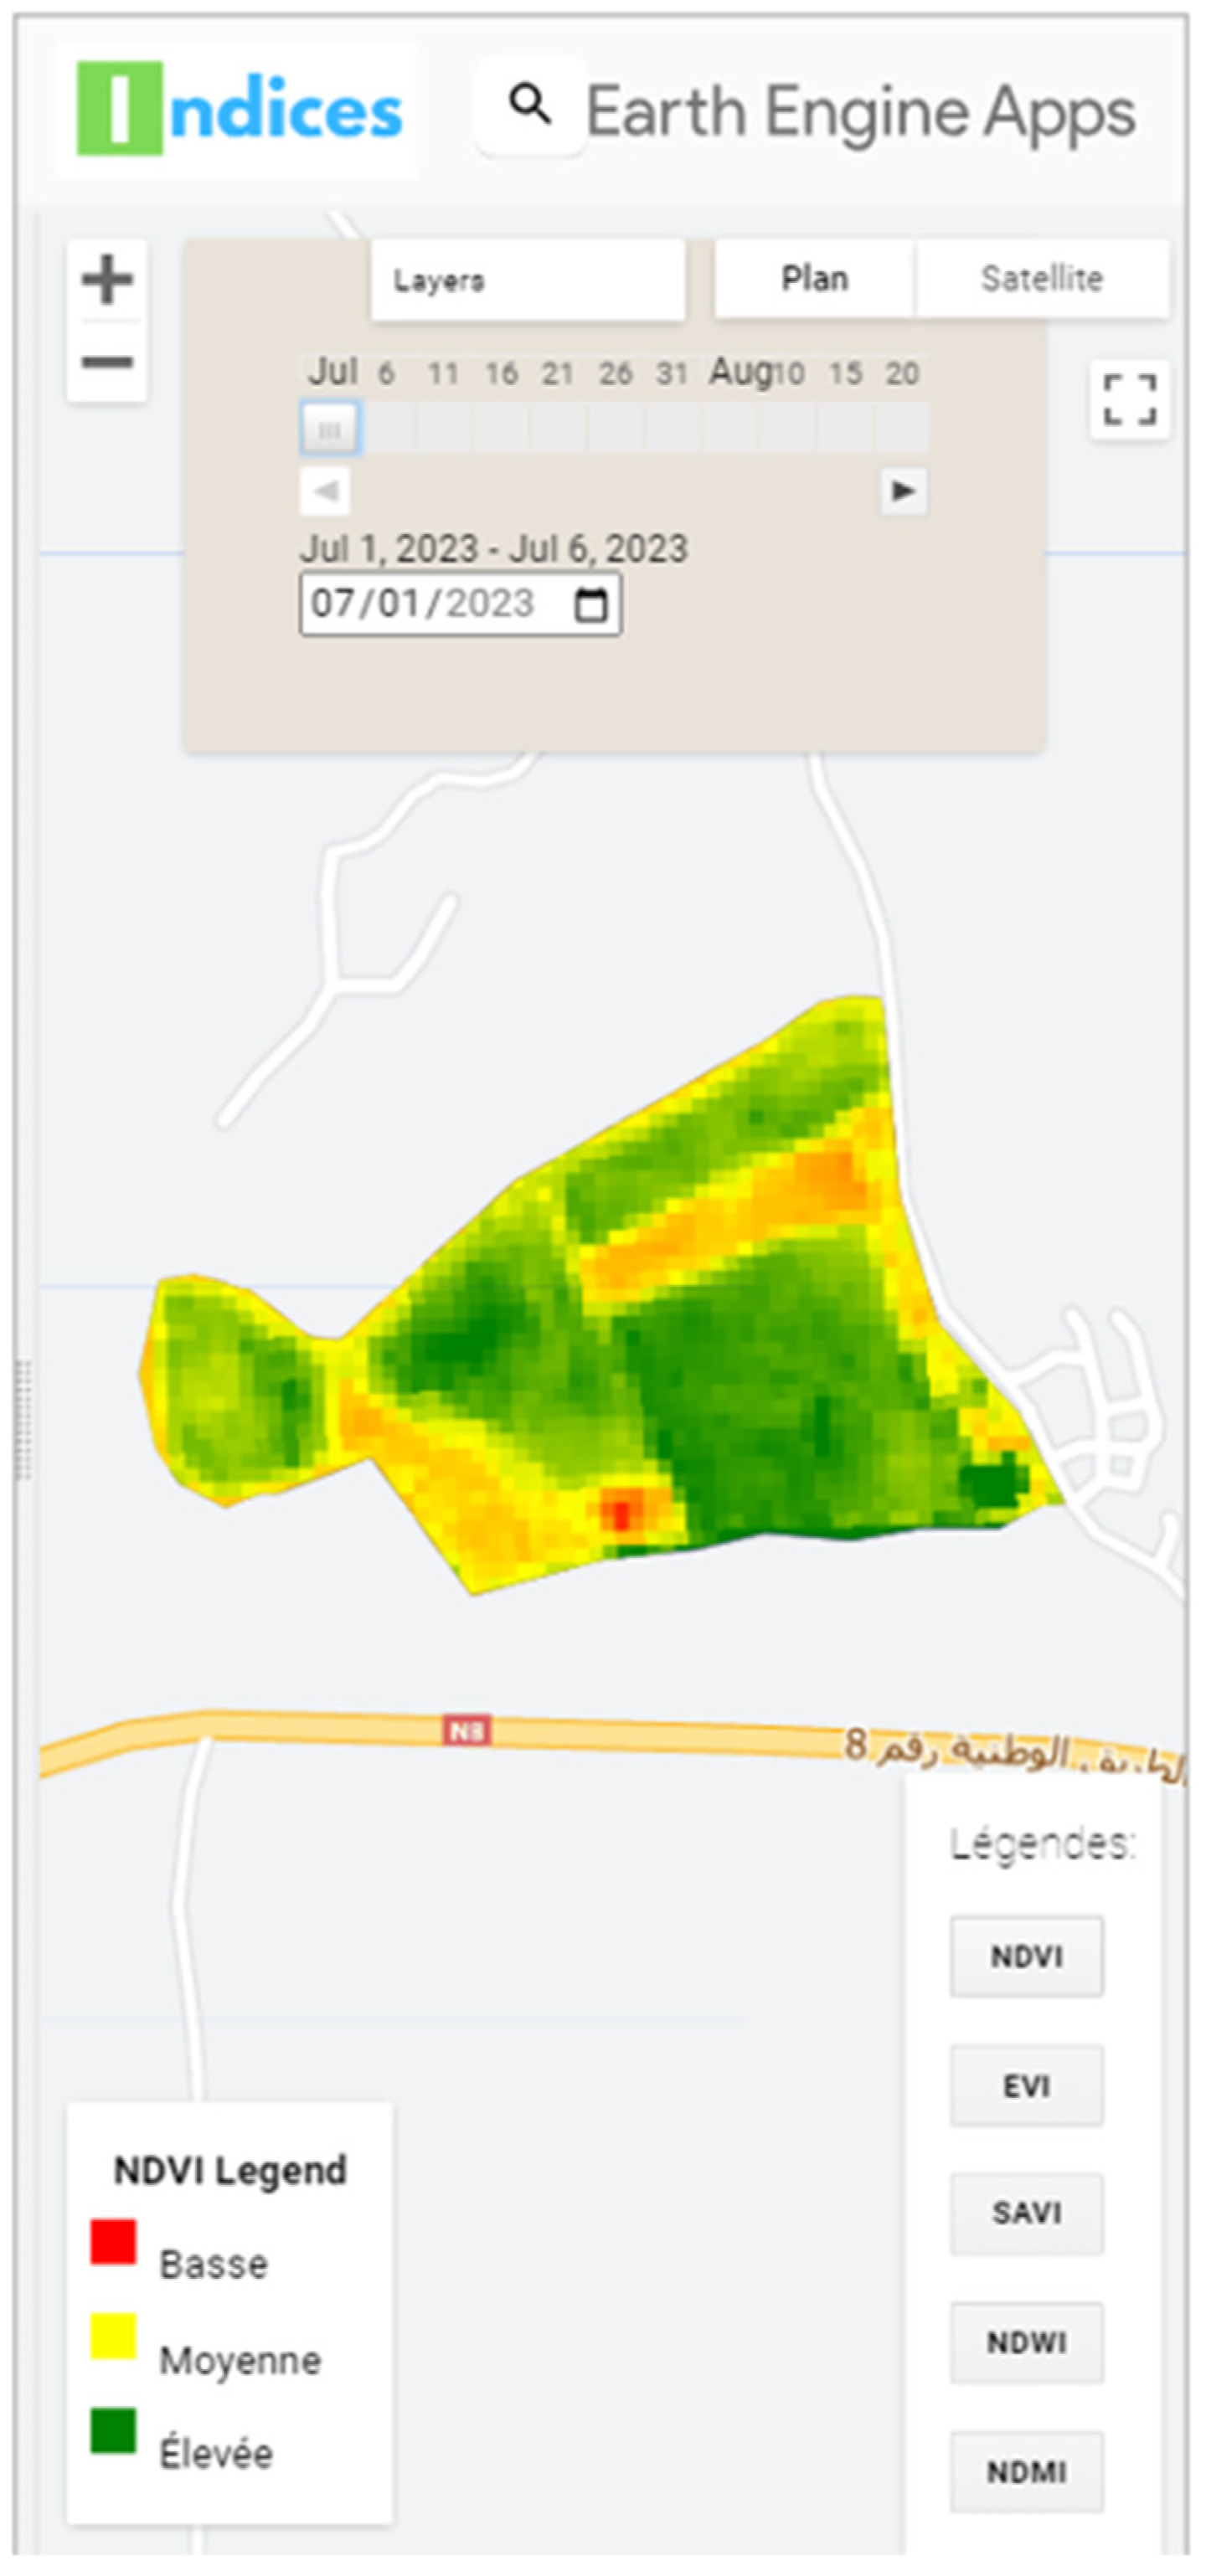
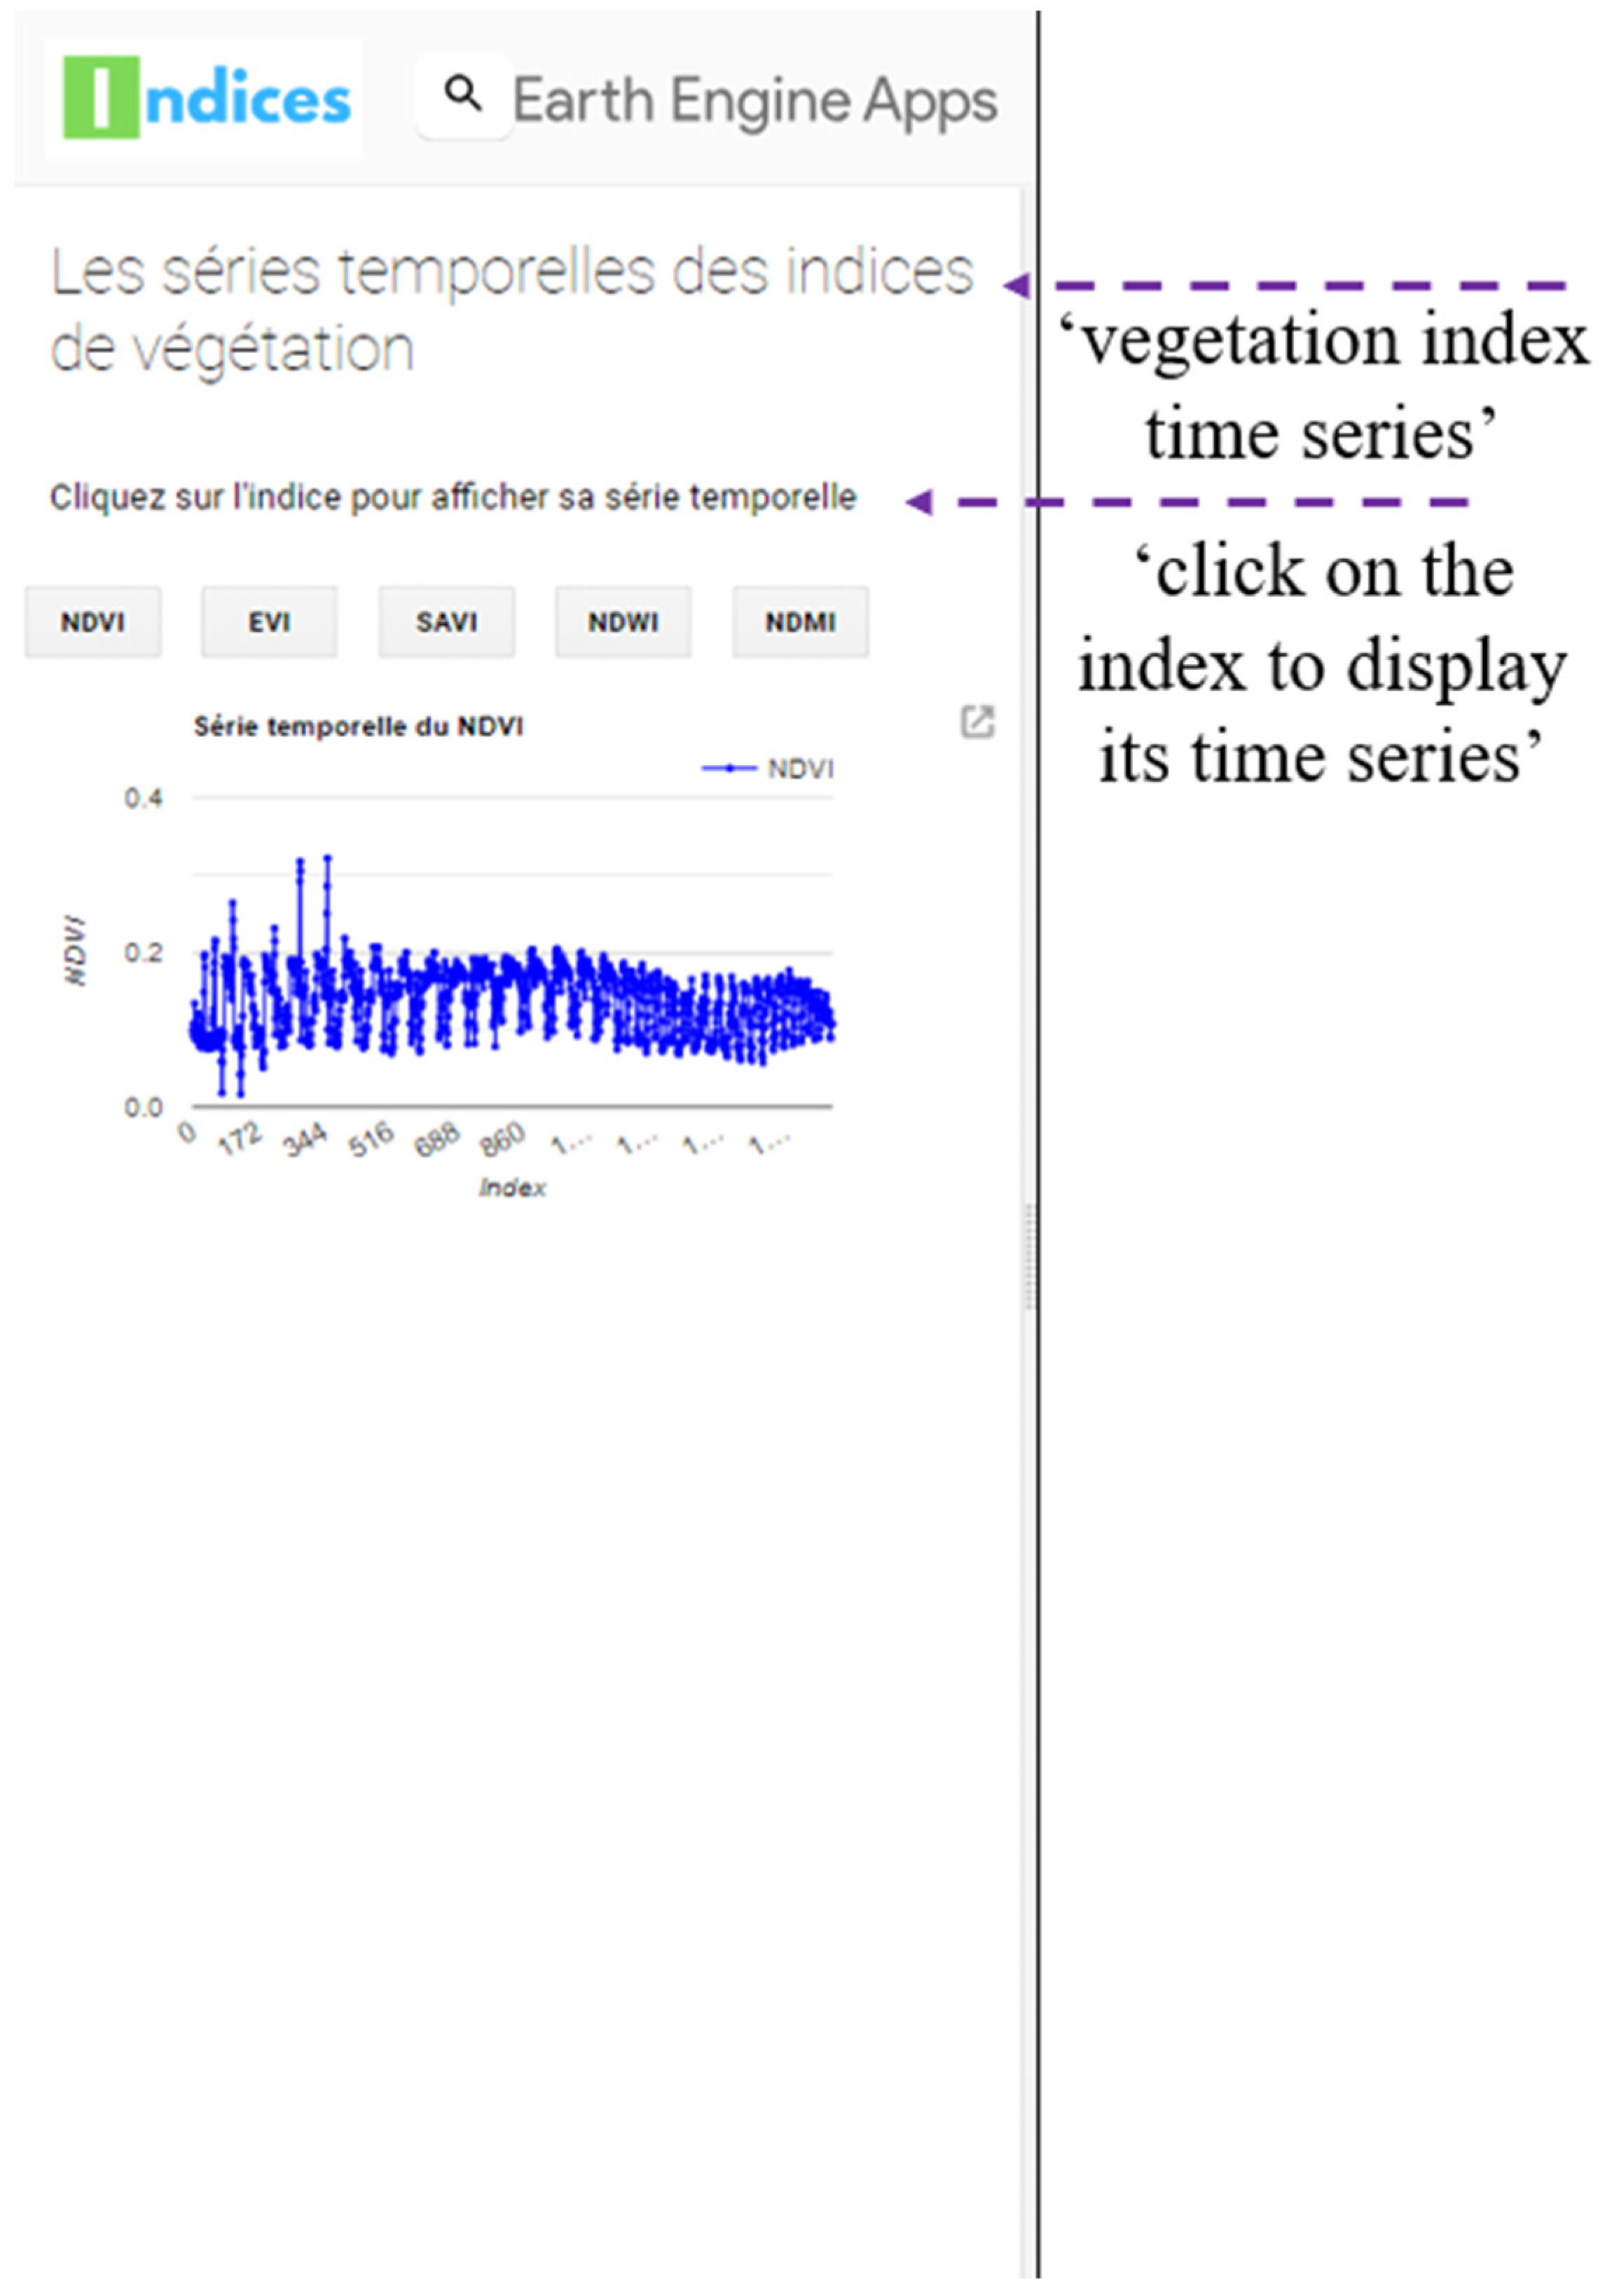
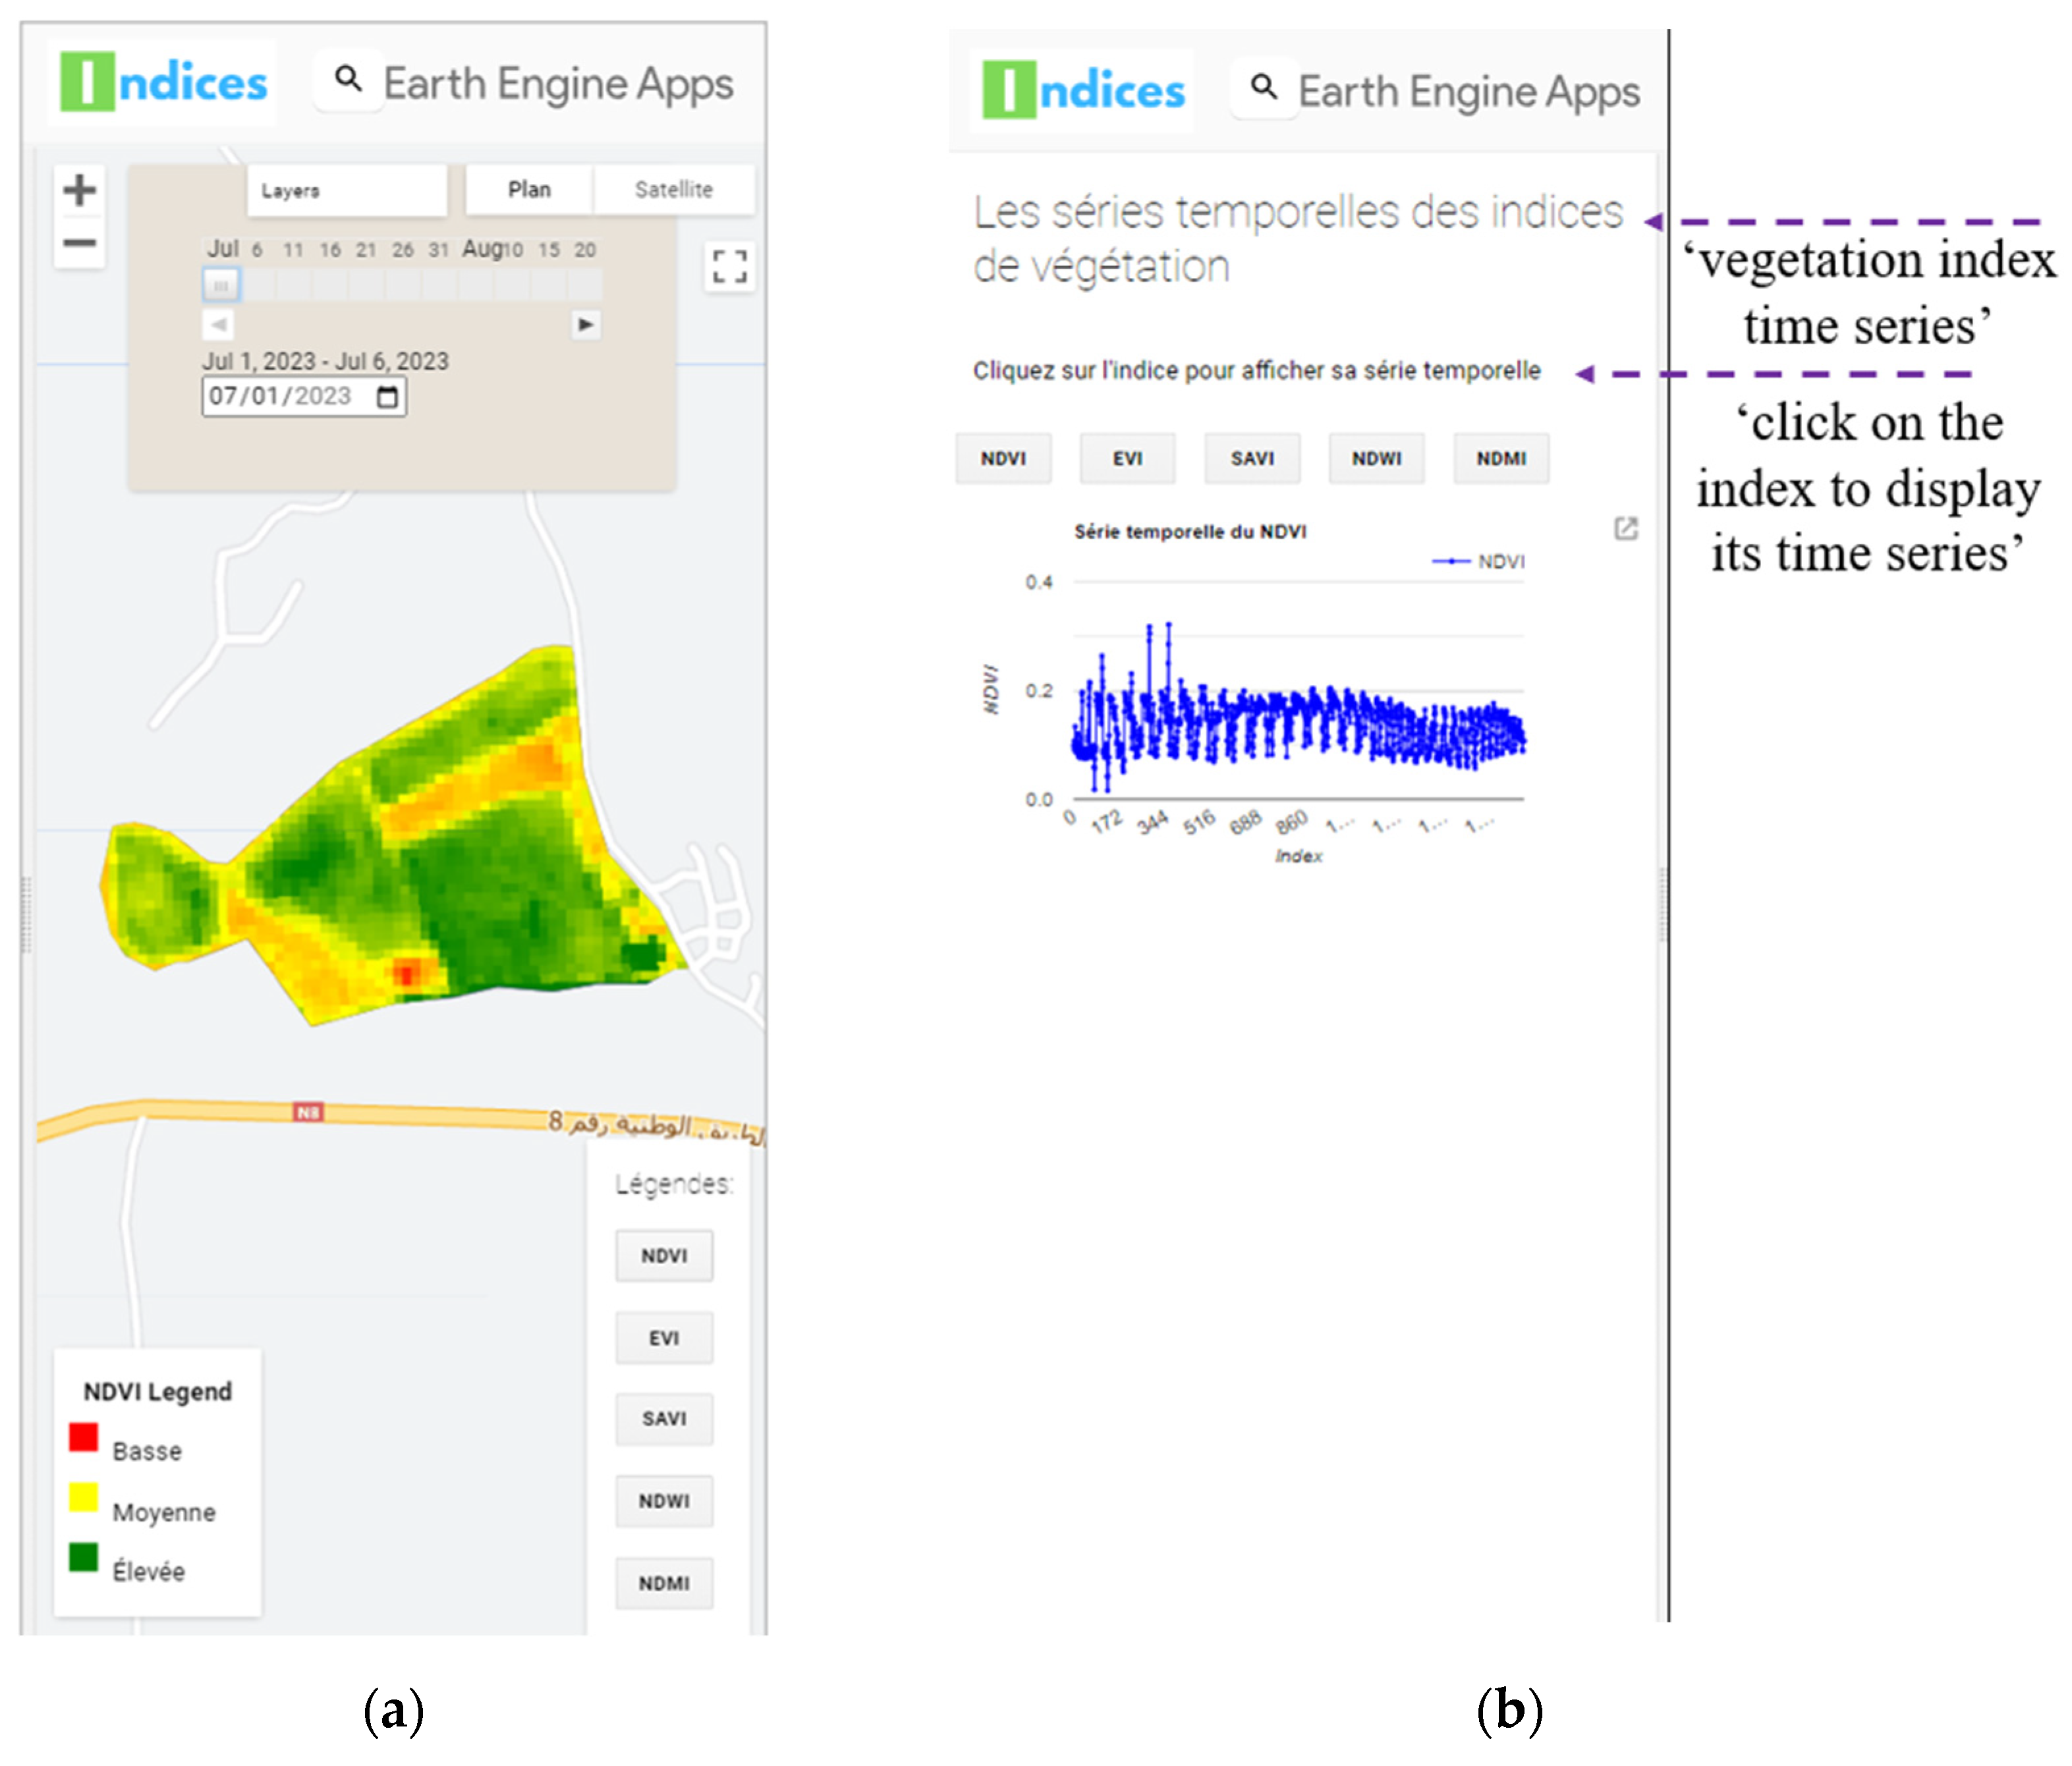
- Service n° 1 (Figure 11 and Figure 12): Spatio-Temporal Monitoring of Vegetation Indices. This section focuses on visualizing classification maps of vegetation indices such as NDVI, SAVI, EVI, NDMI, and NDWI, along with their temporal evolution graphs. The user selects a date between July 1st and November 1st to display corresponding maps, classified into three palettes reflecting the level of index activity in a given area. Interactive tools like DateSlider and the Layers menu facilitate navigation and exploration.
- 4.
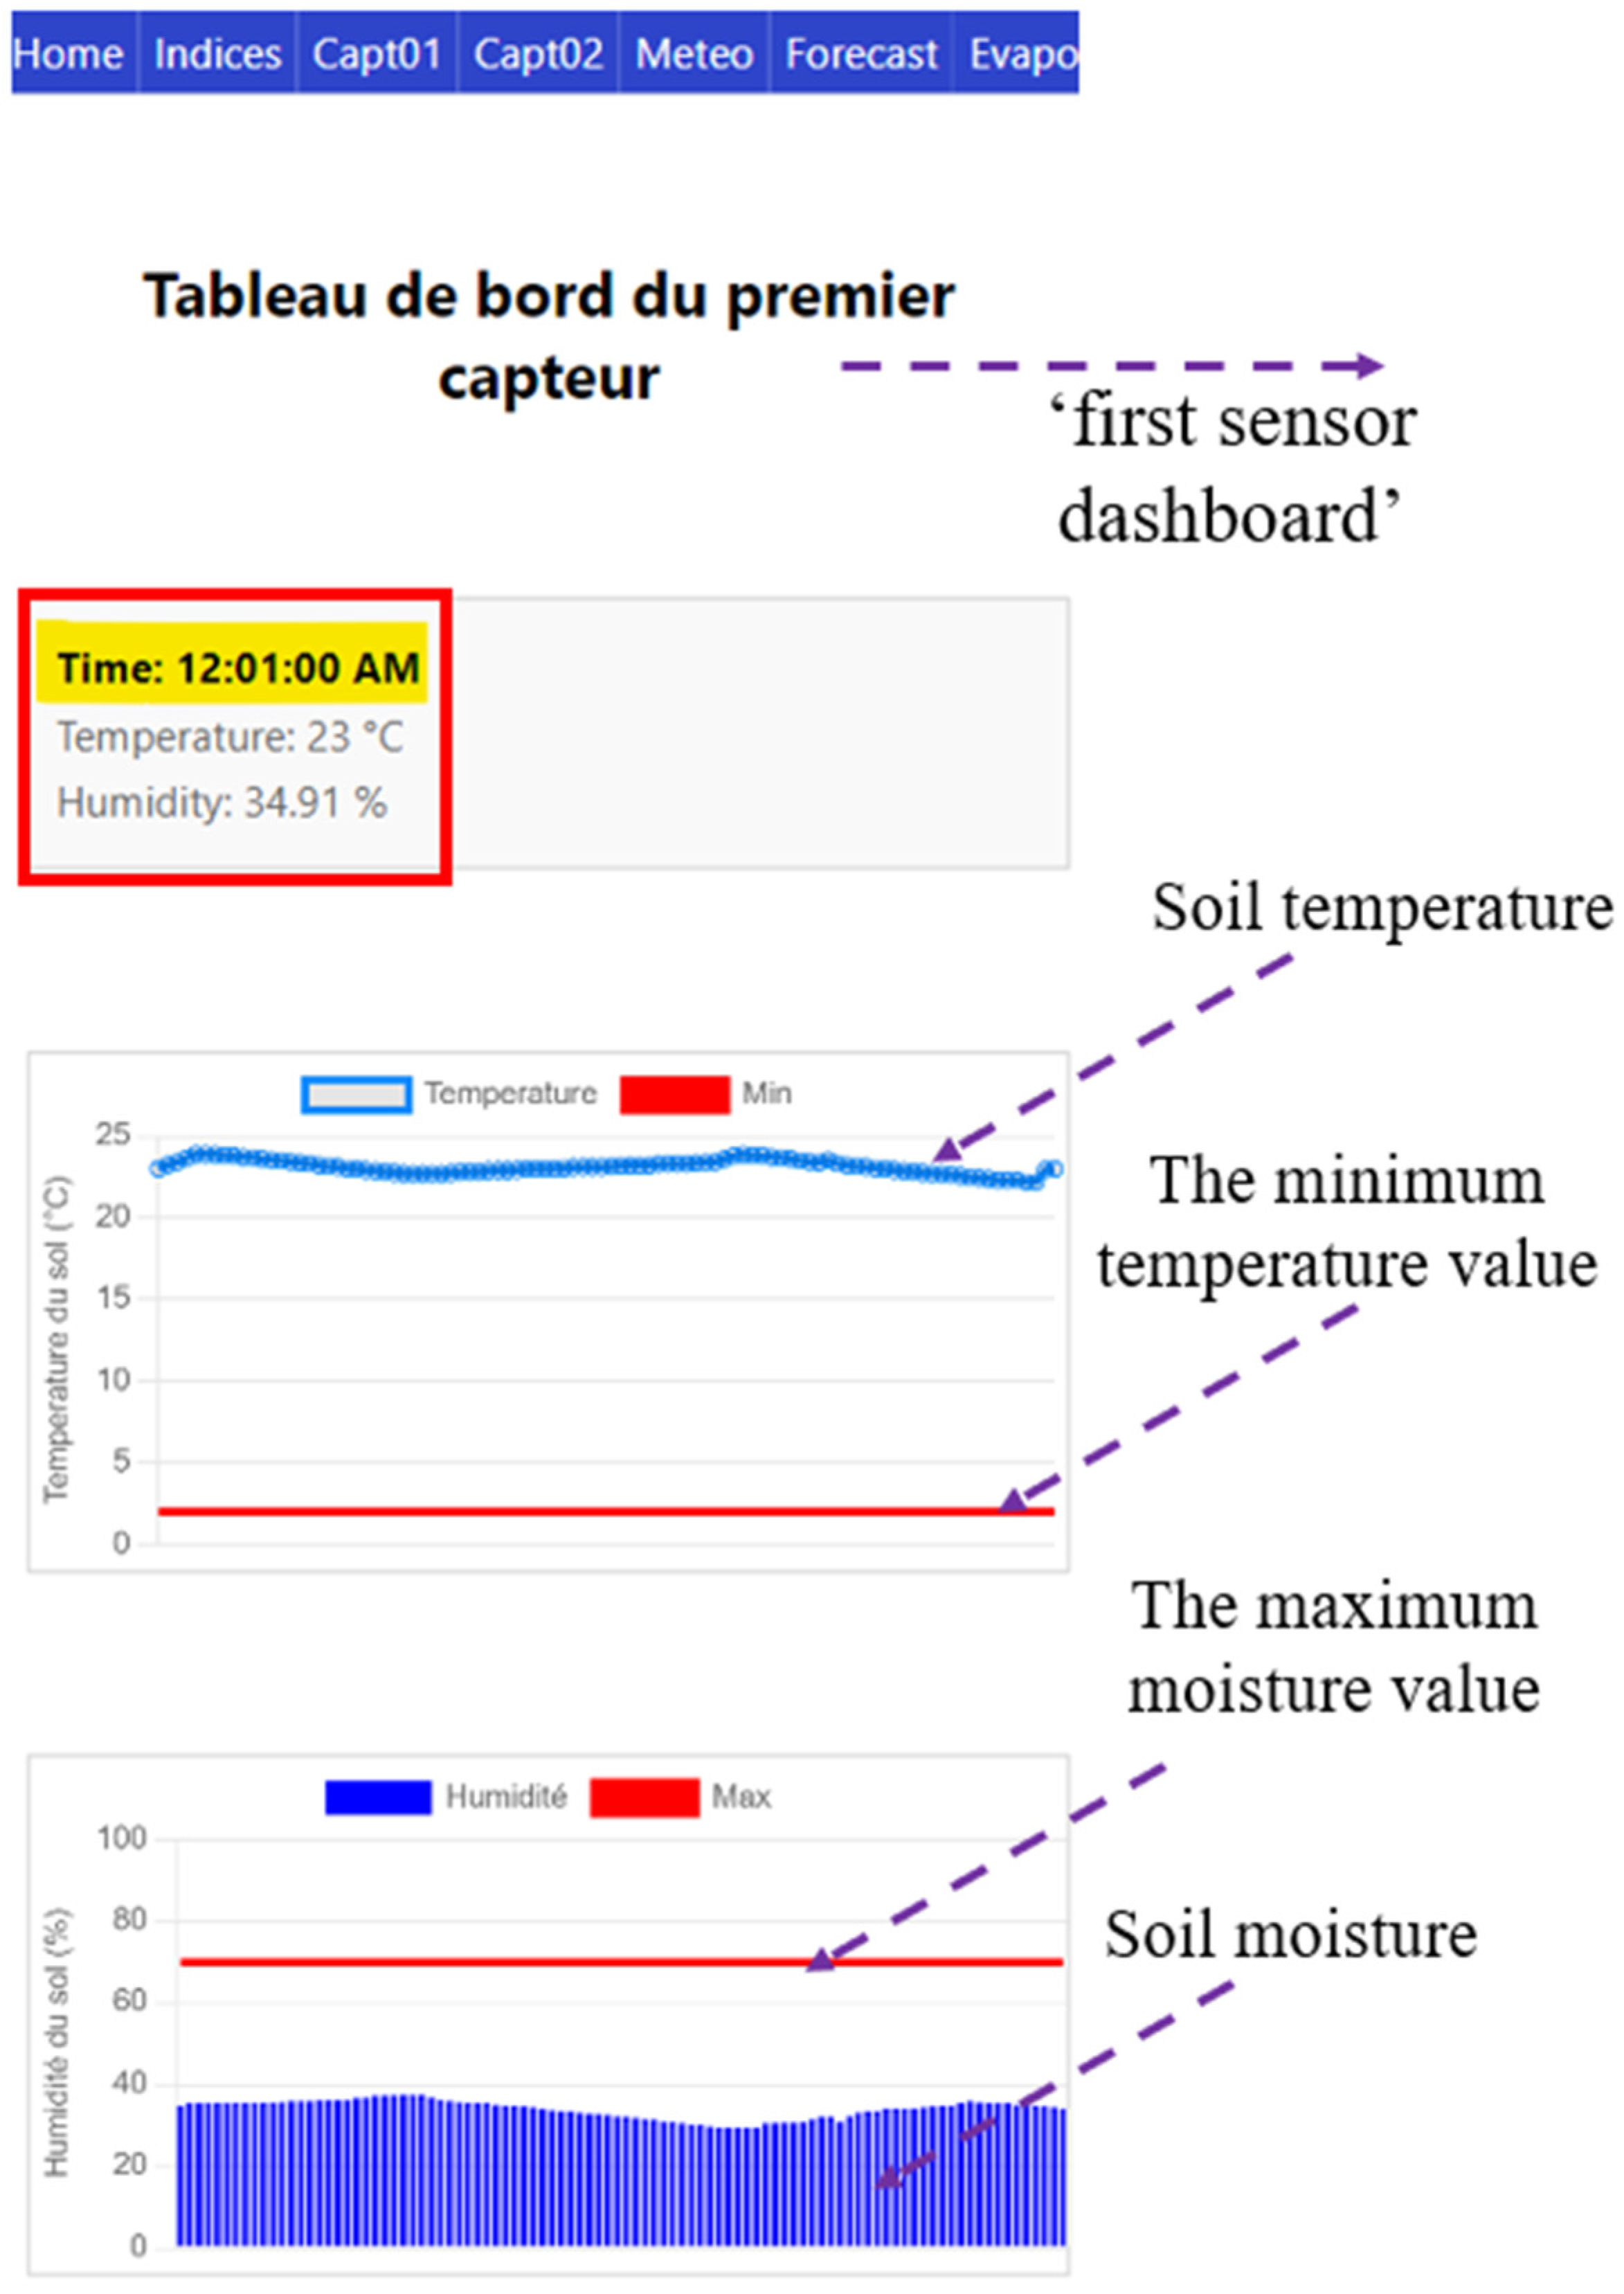
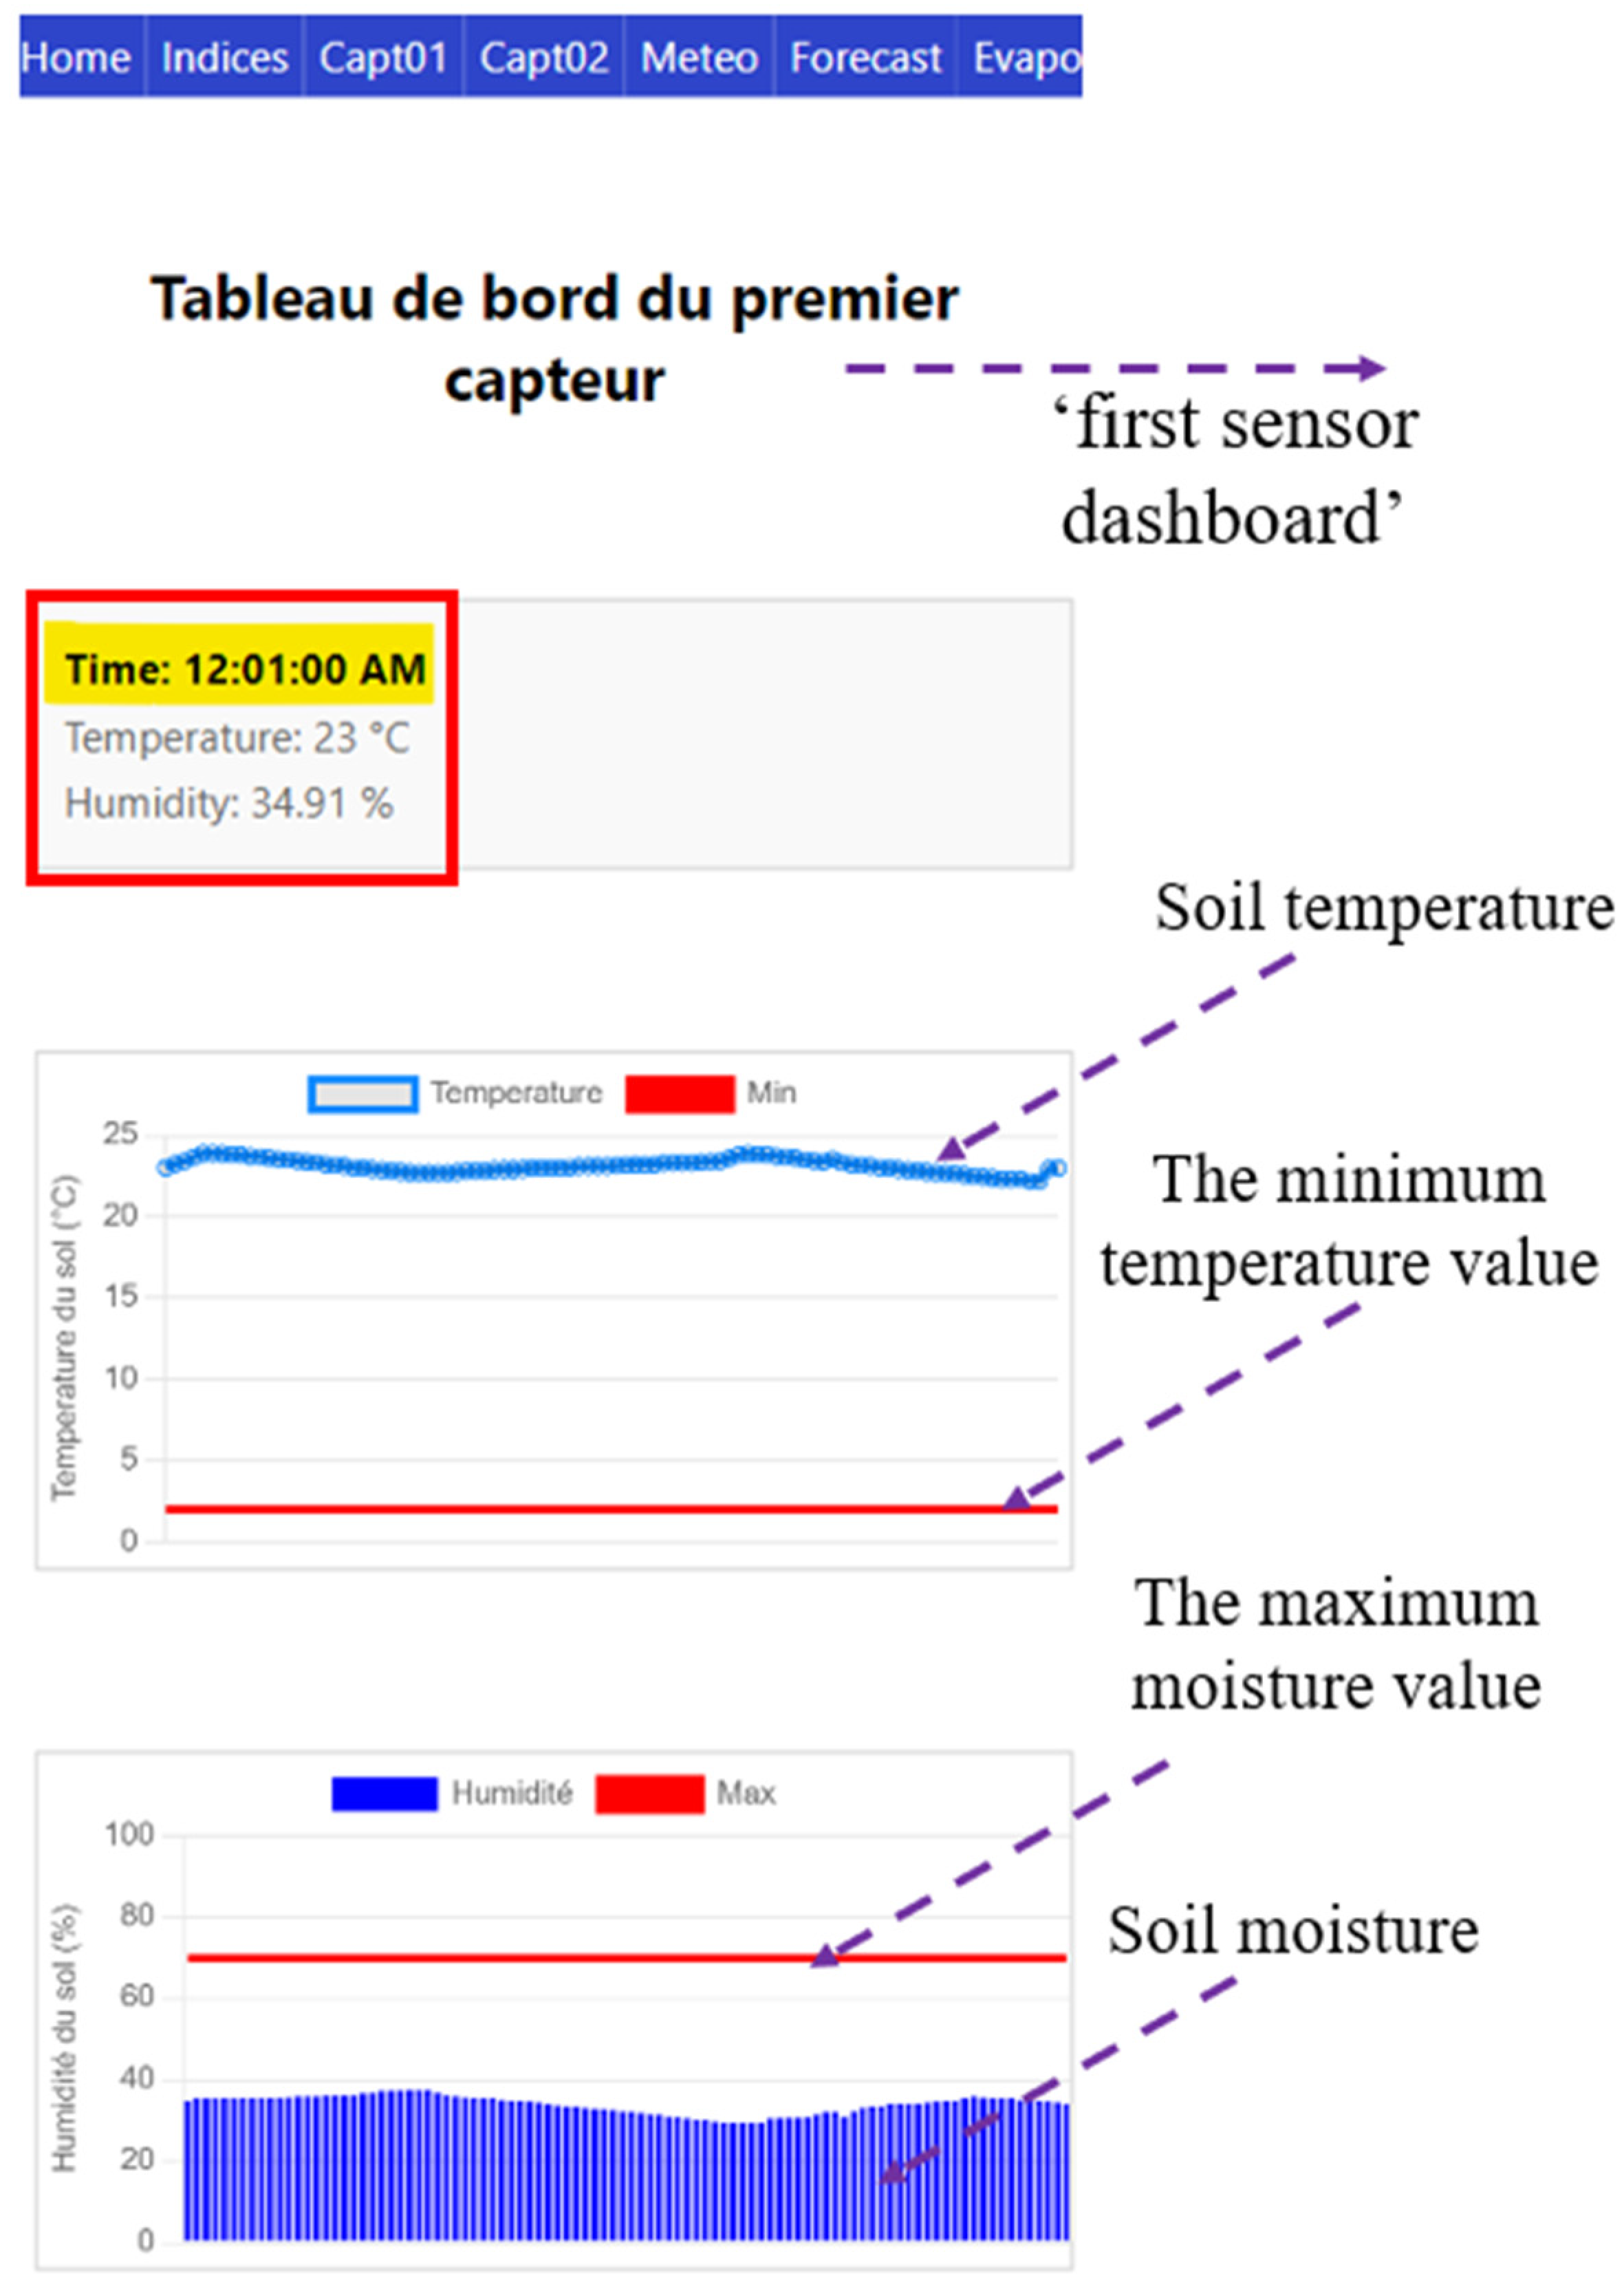
- Service n° 2: Dashboards for sensor data (Figure 13). This section looks at the detailed dashboards for data collected by the JEROMINE and GALA sensors. Temperature and soil moisture graphs display variations over the past 24 h, with a recording frequency of 15 min. Interactive bars provide a user-friendly representation of values and allow points to be selected for precise information.
- 5.
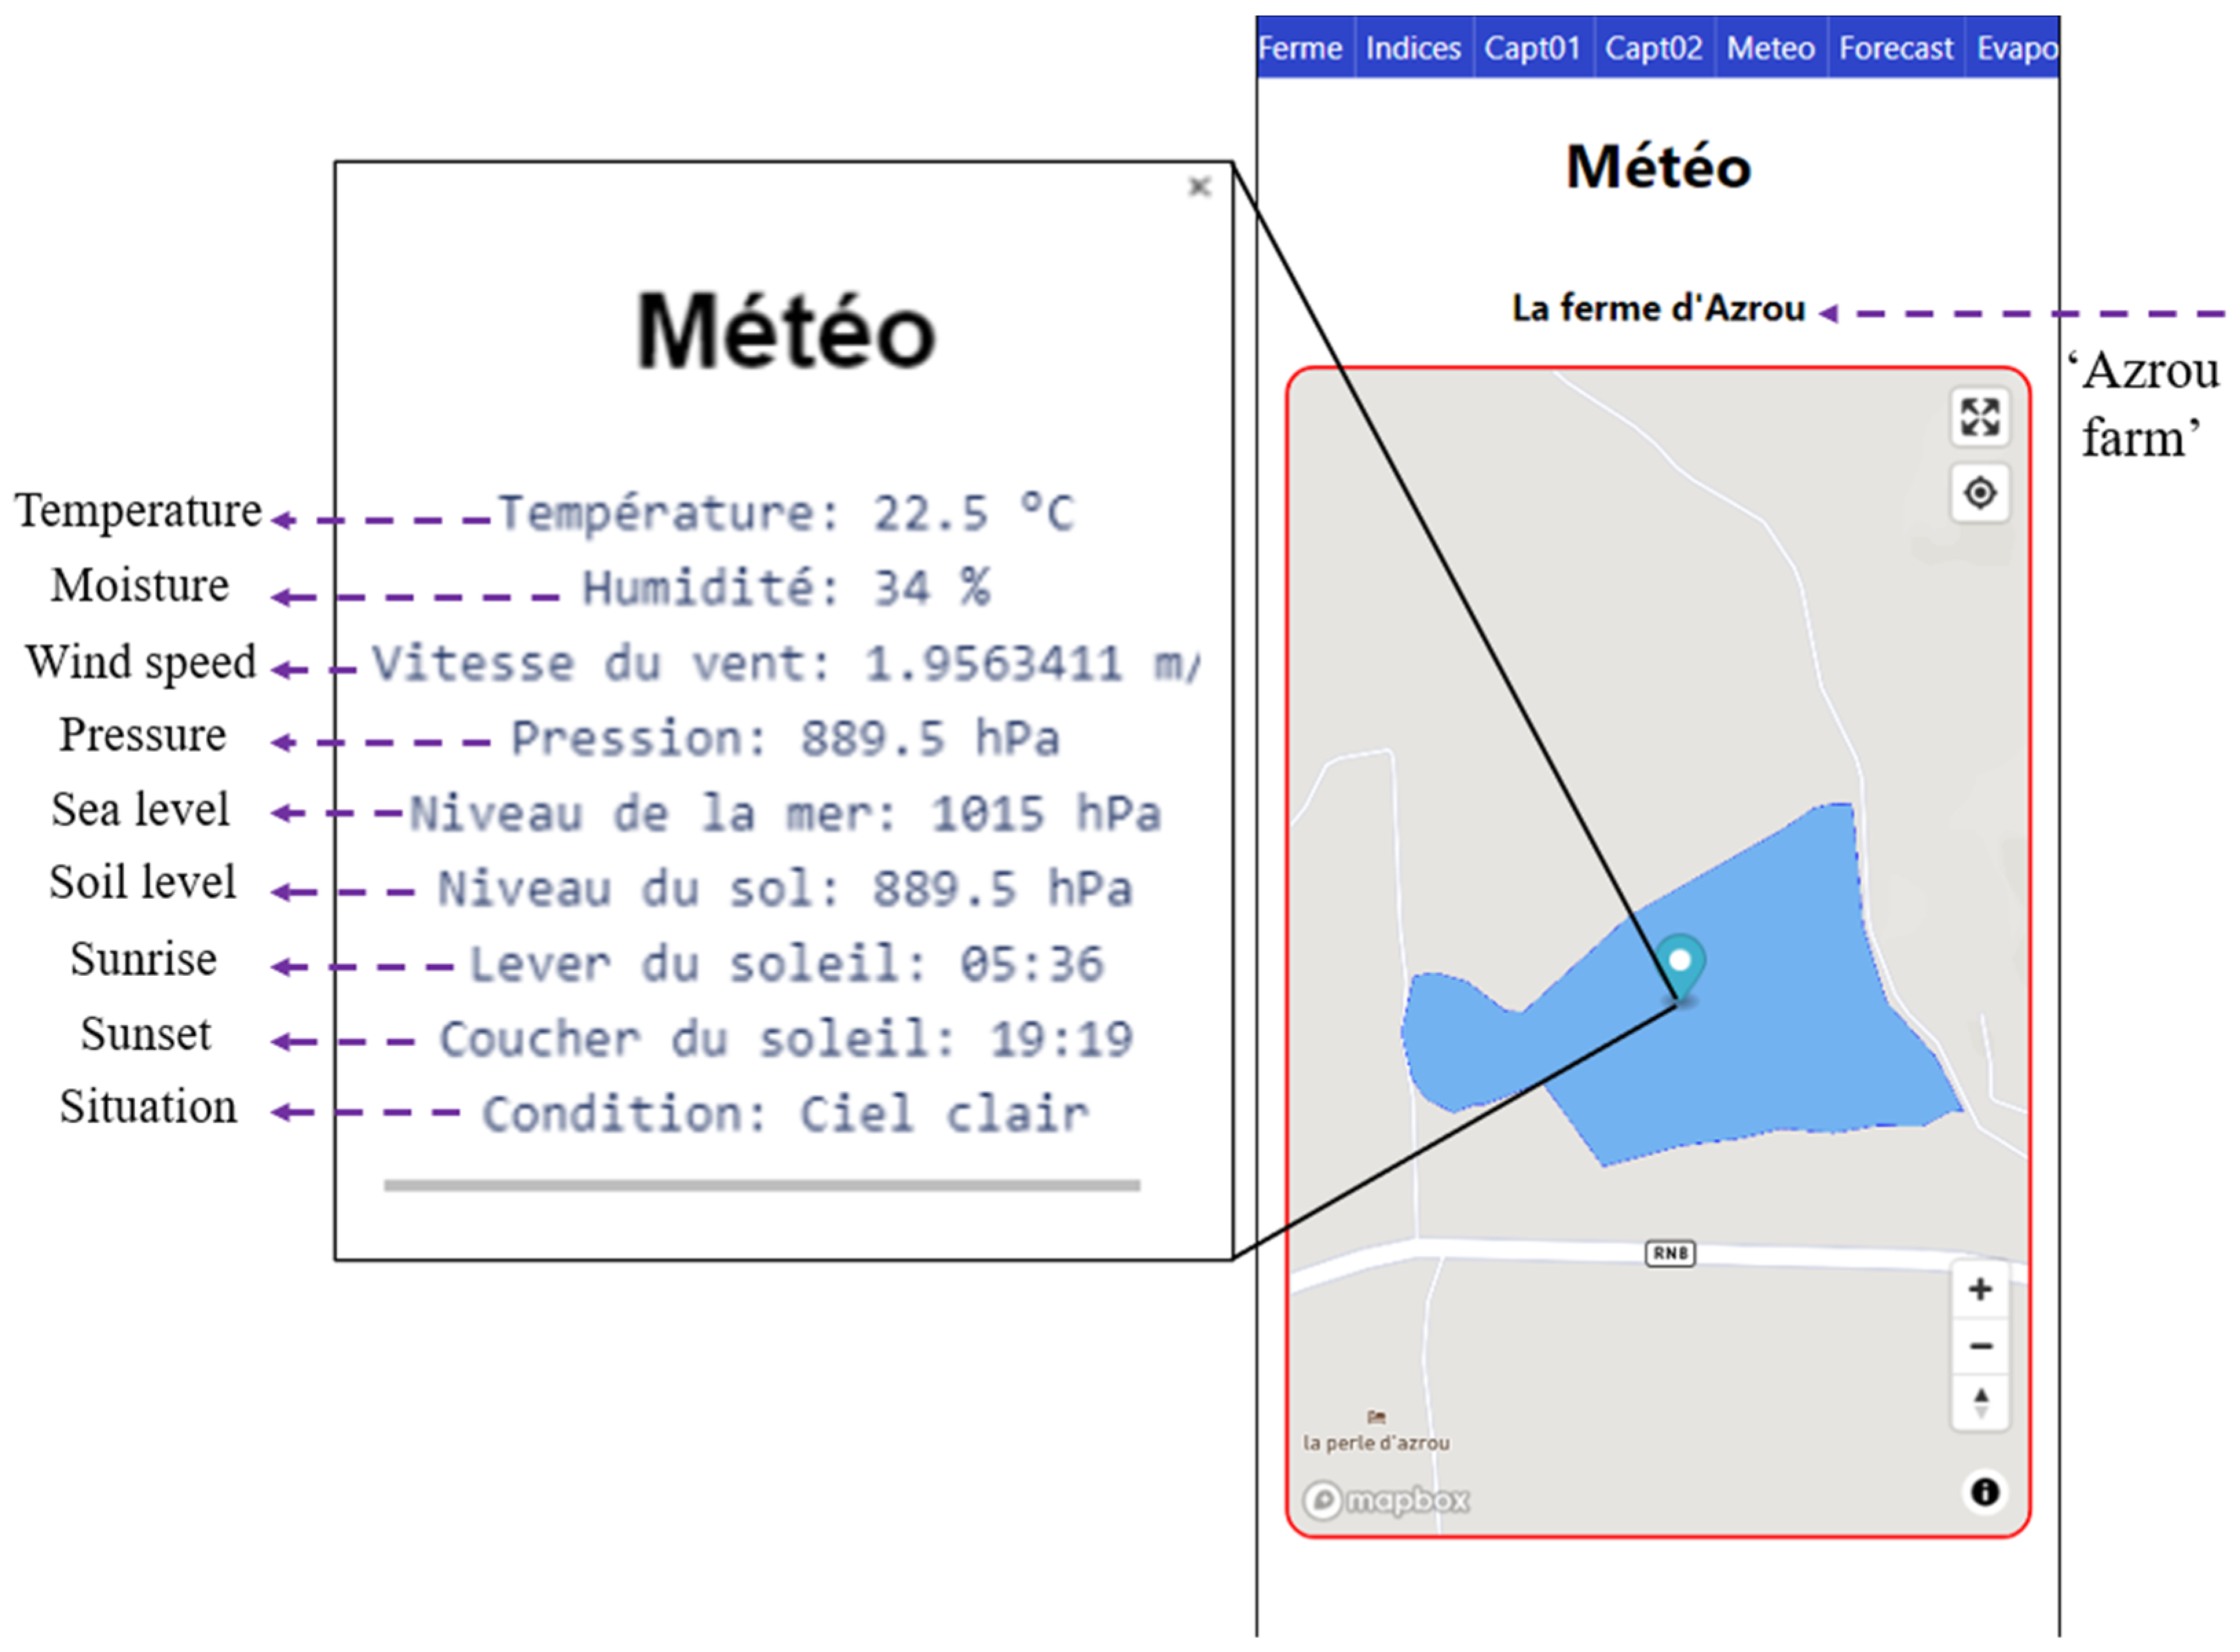
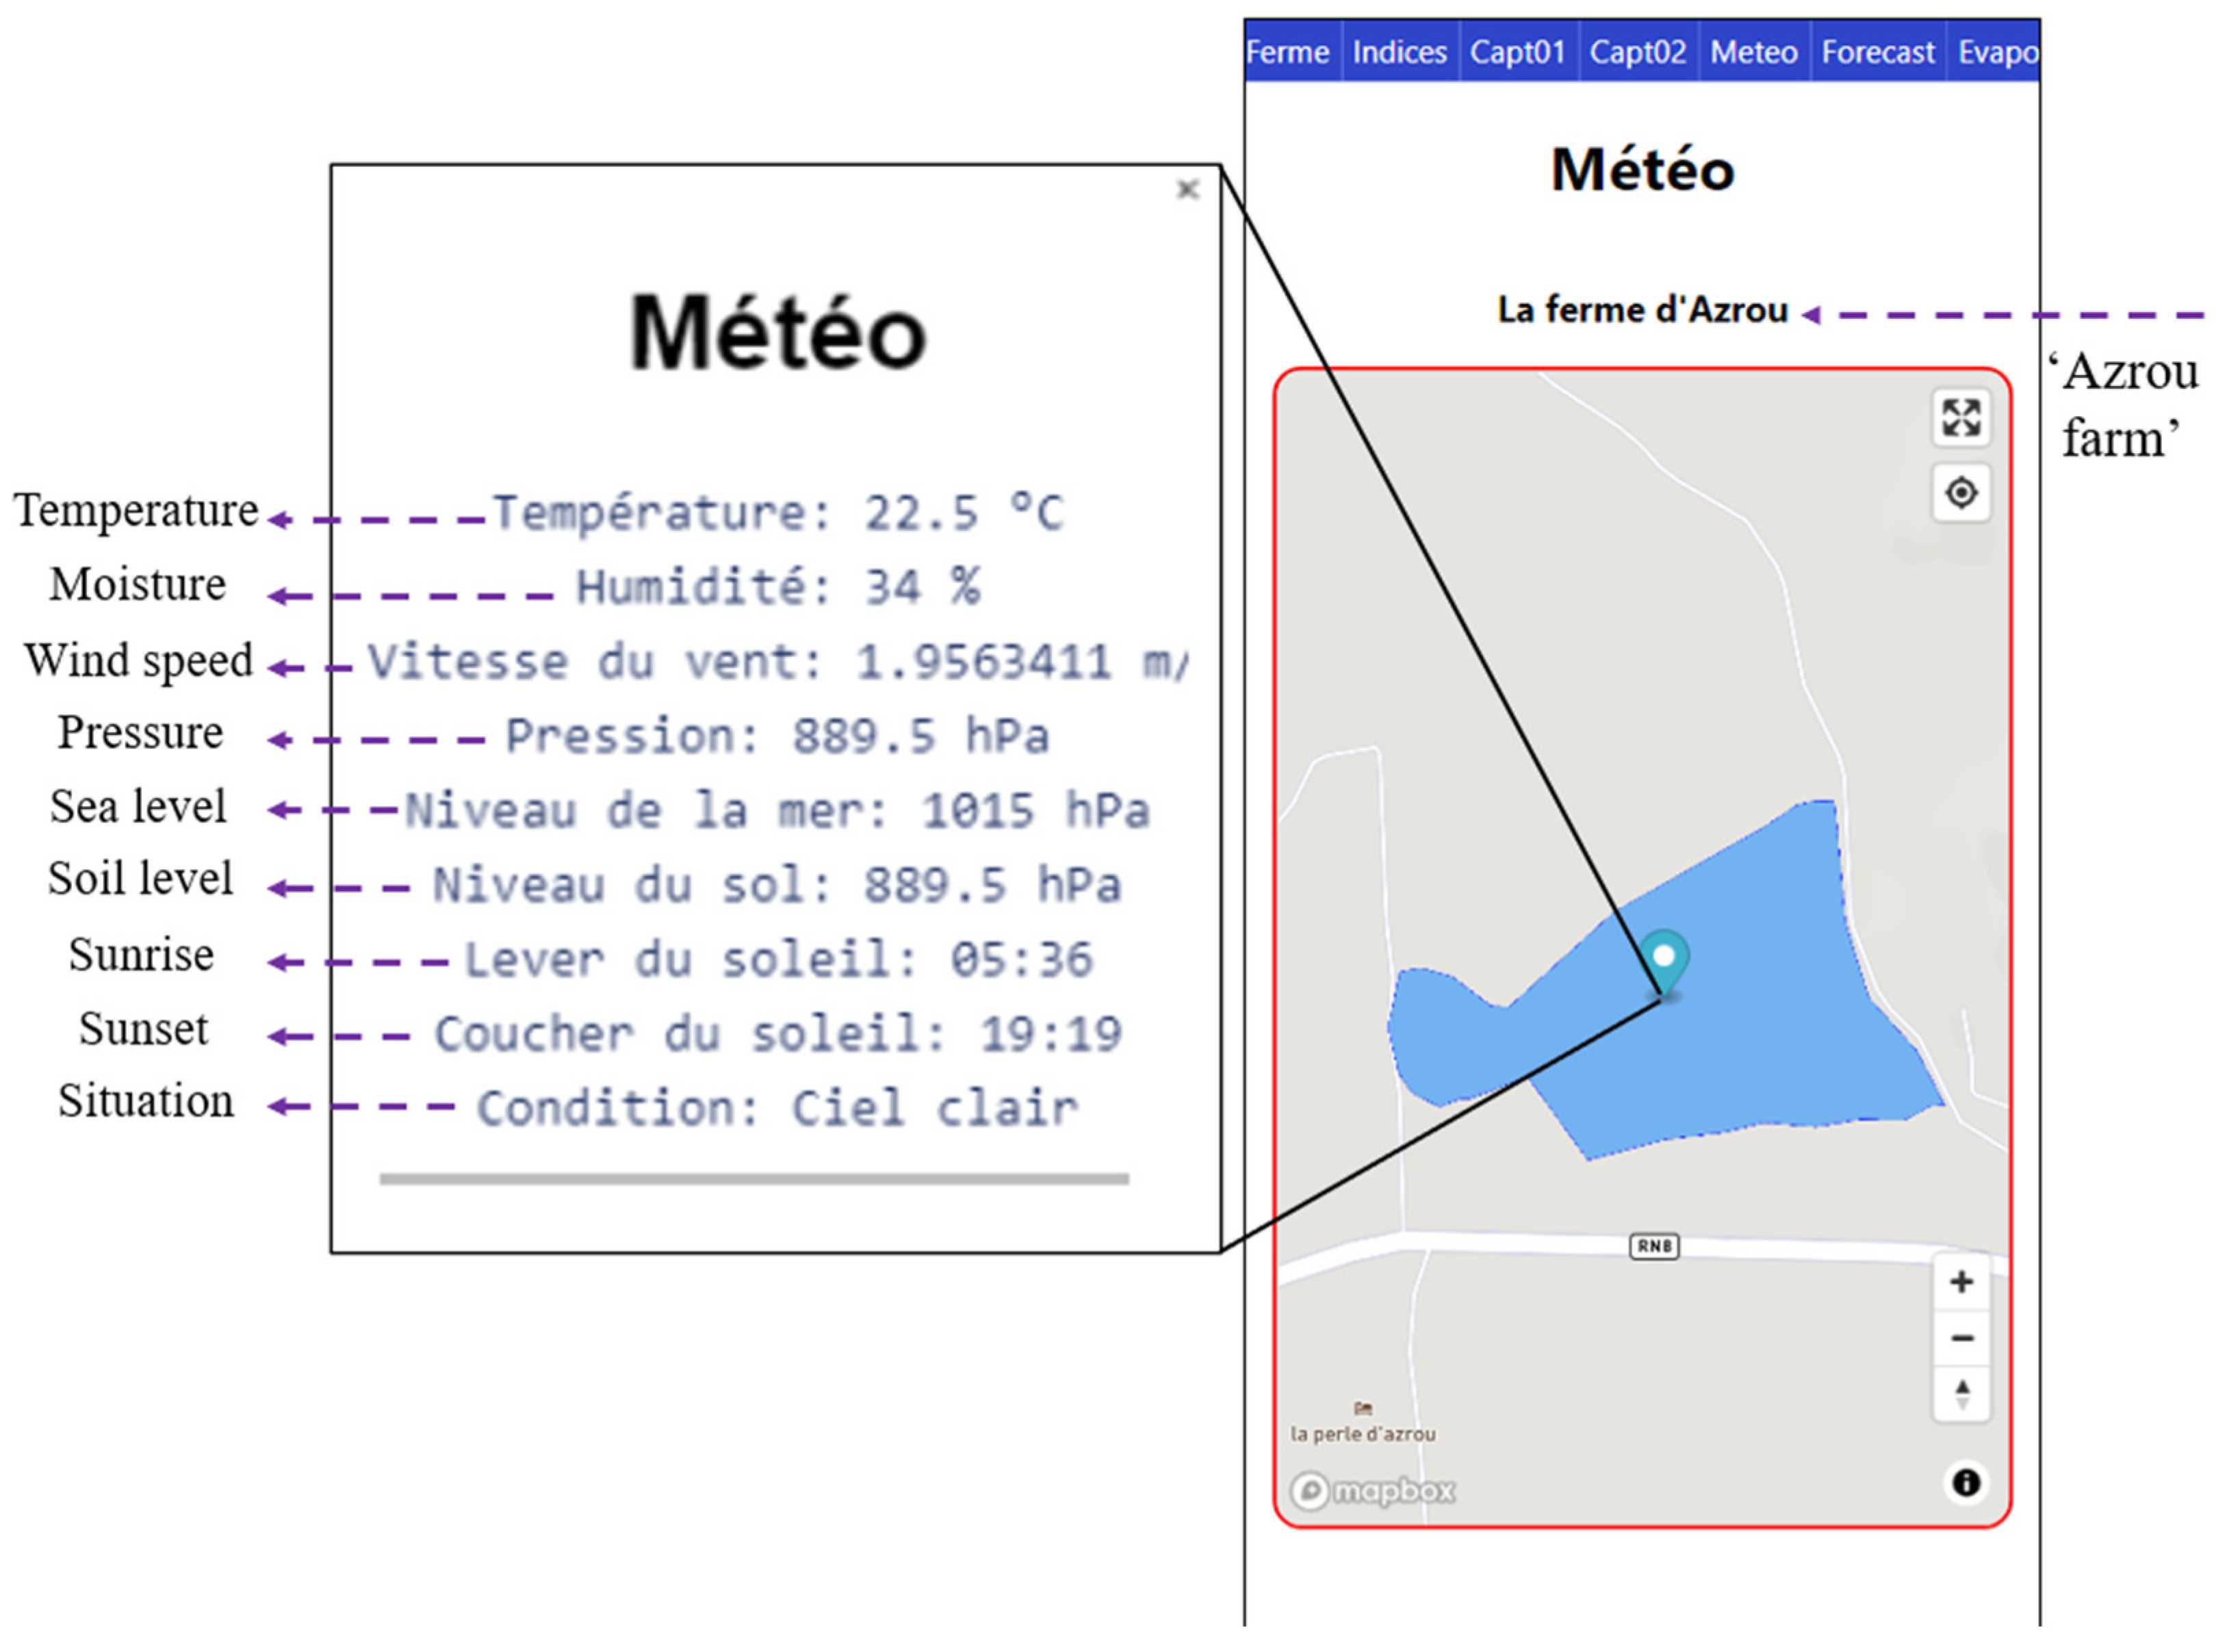
- Service n° 3: Current Weather Conditions Consultation (Figure 14). This section explains how users can access current weather conditions. A MapBox map displays the plot boundaries with meteorological information, including air temperature, air humidity, wind speed. These data empower farmers to make informed decisions for their agricultural activities.
- 6.
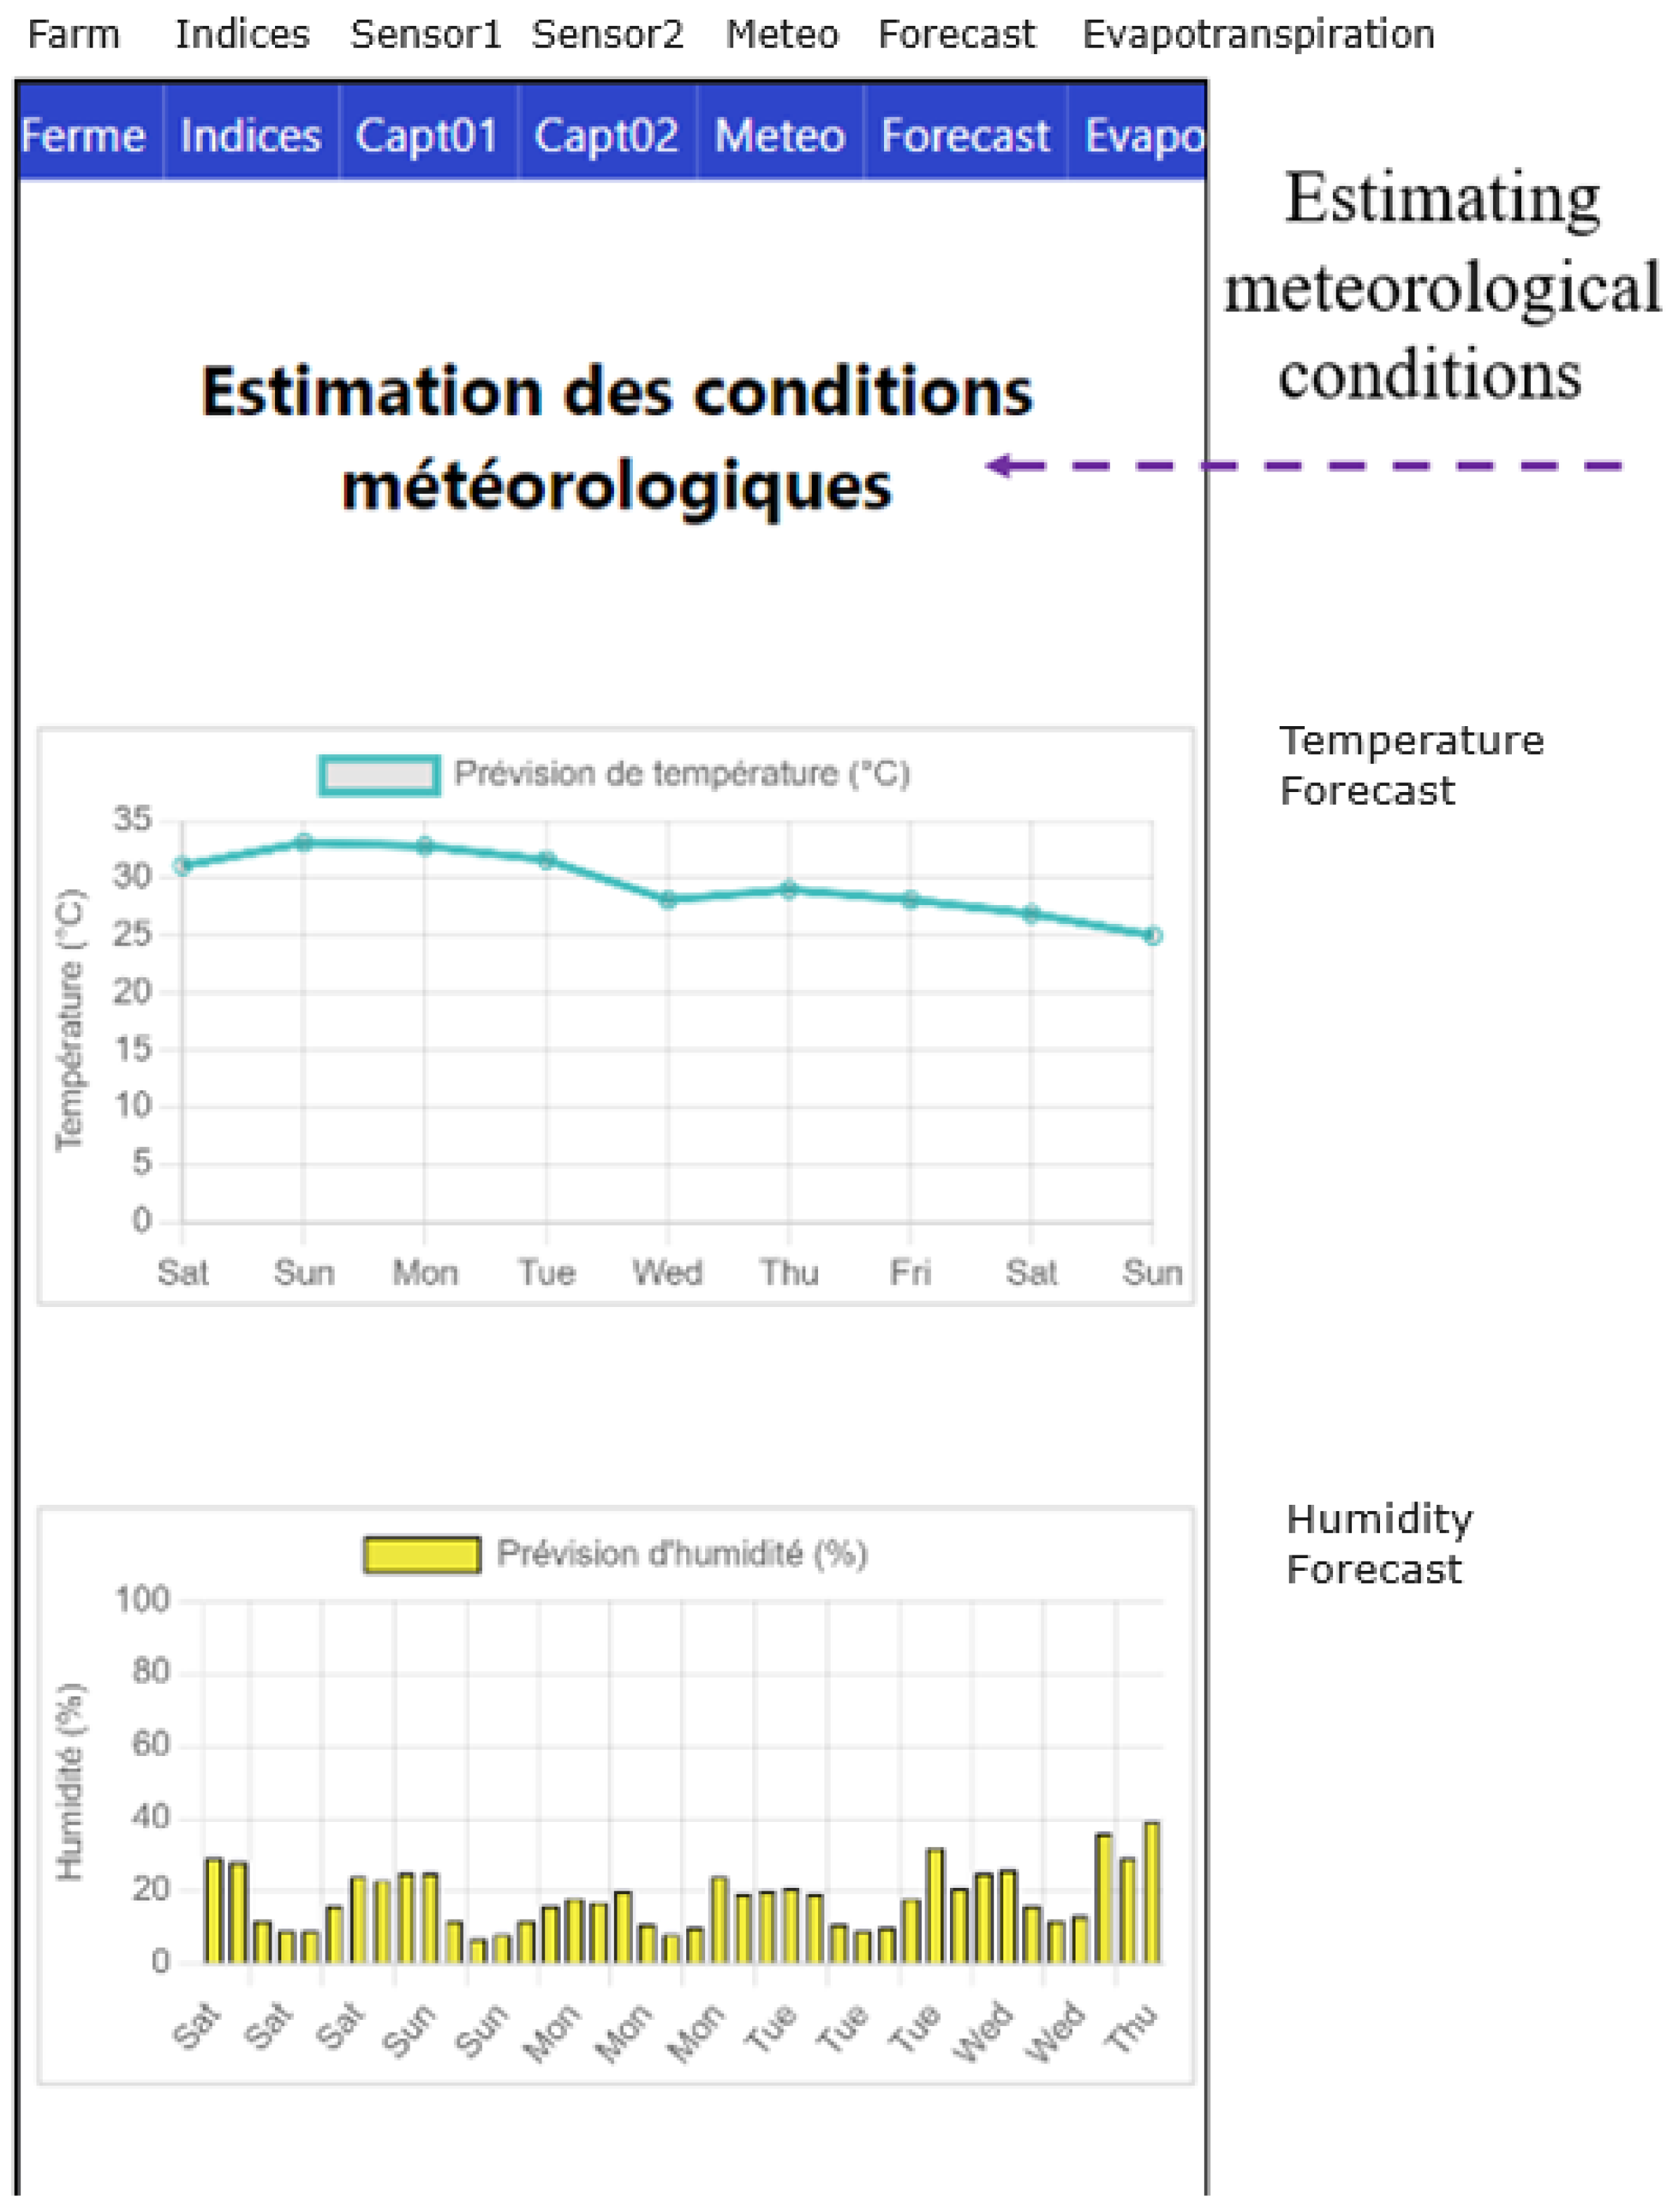
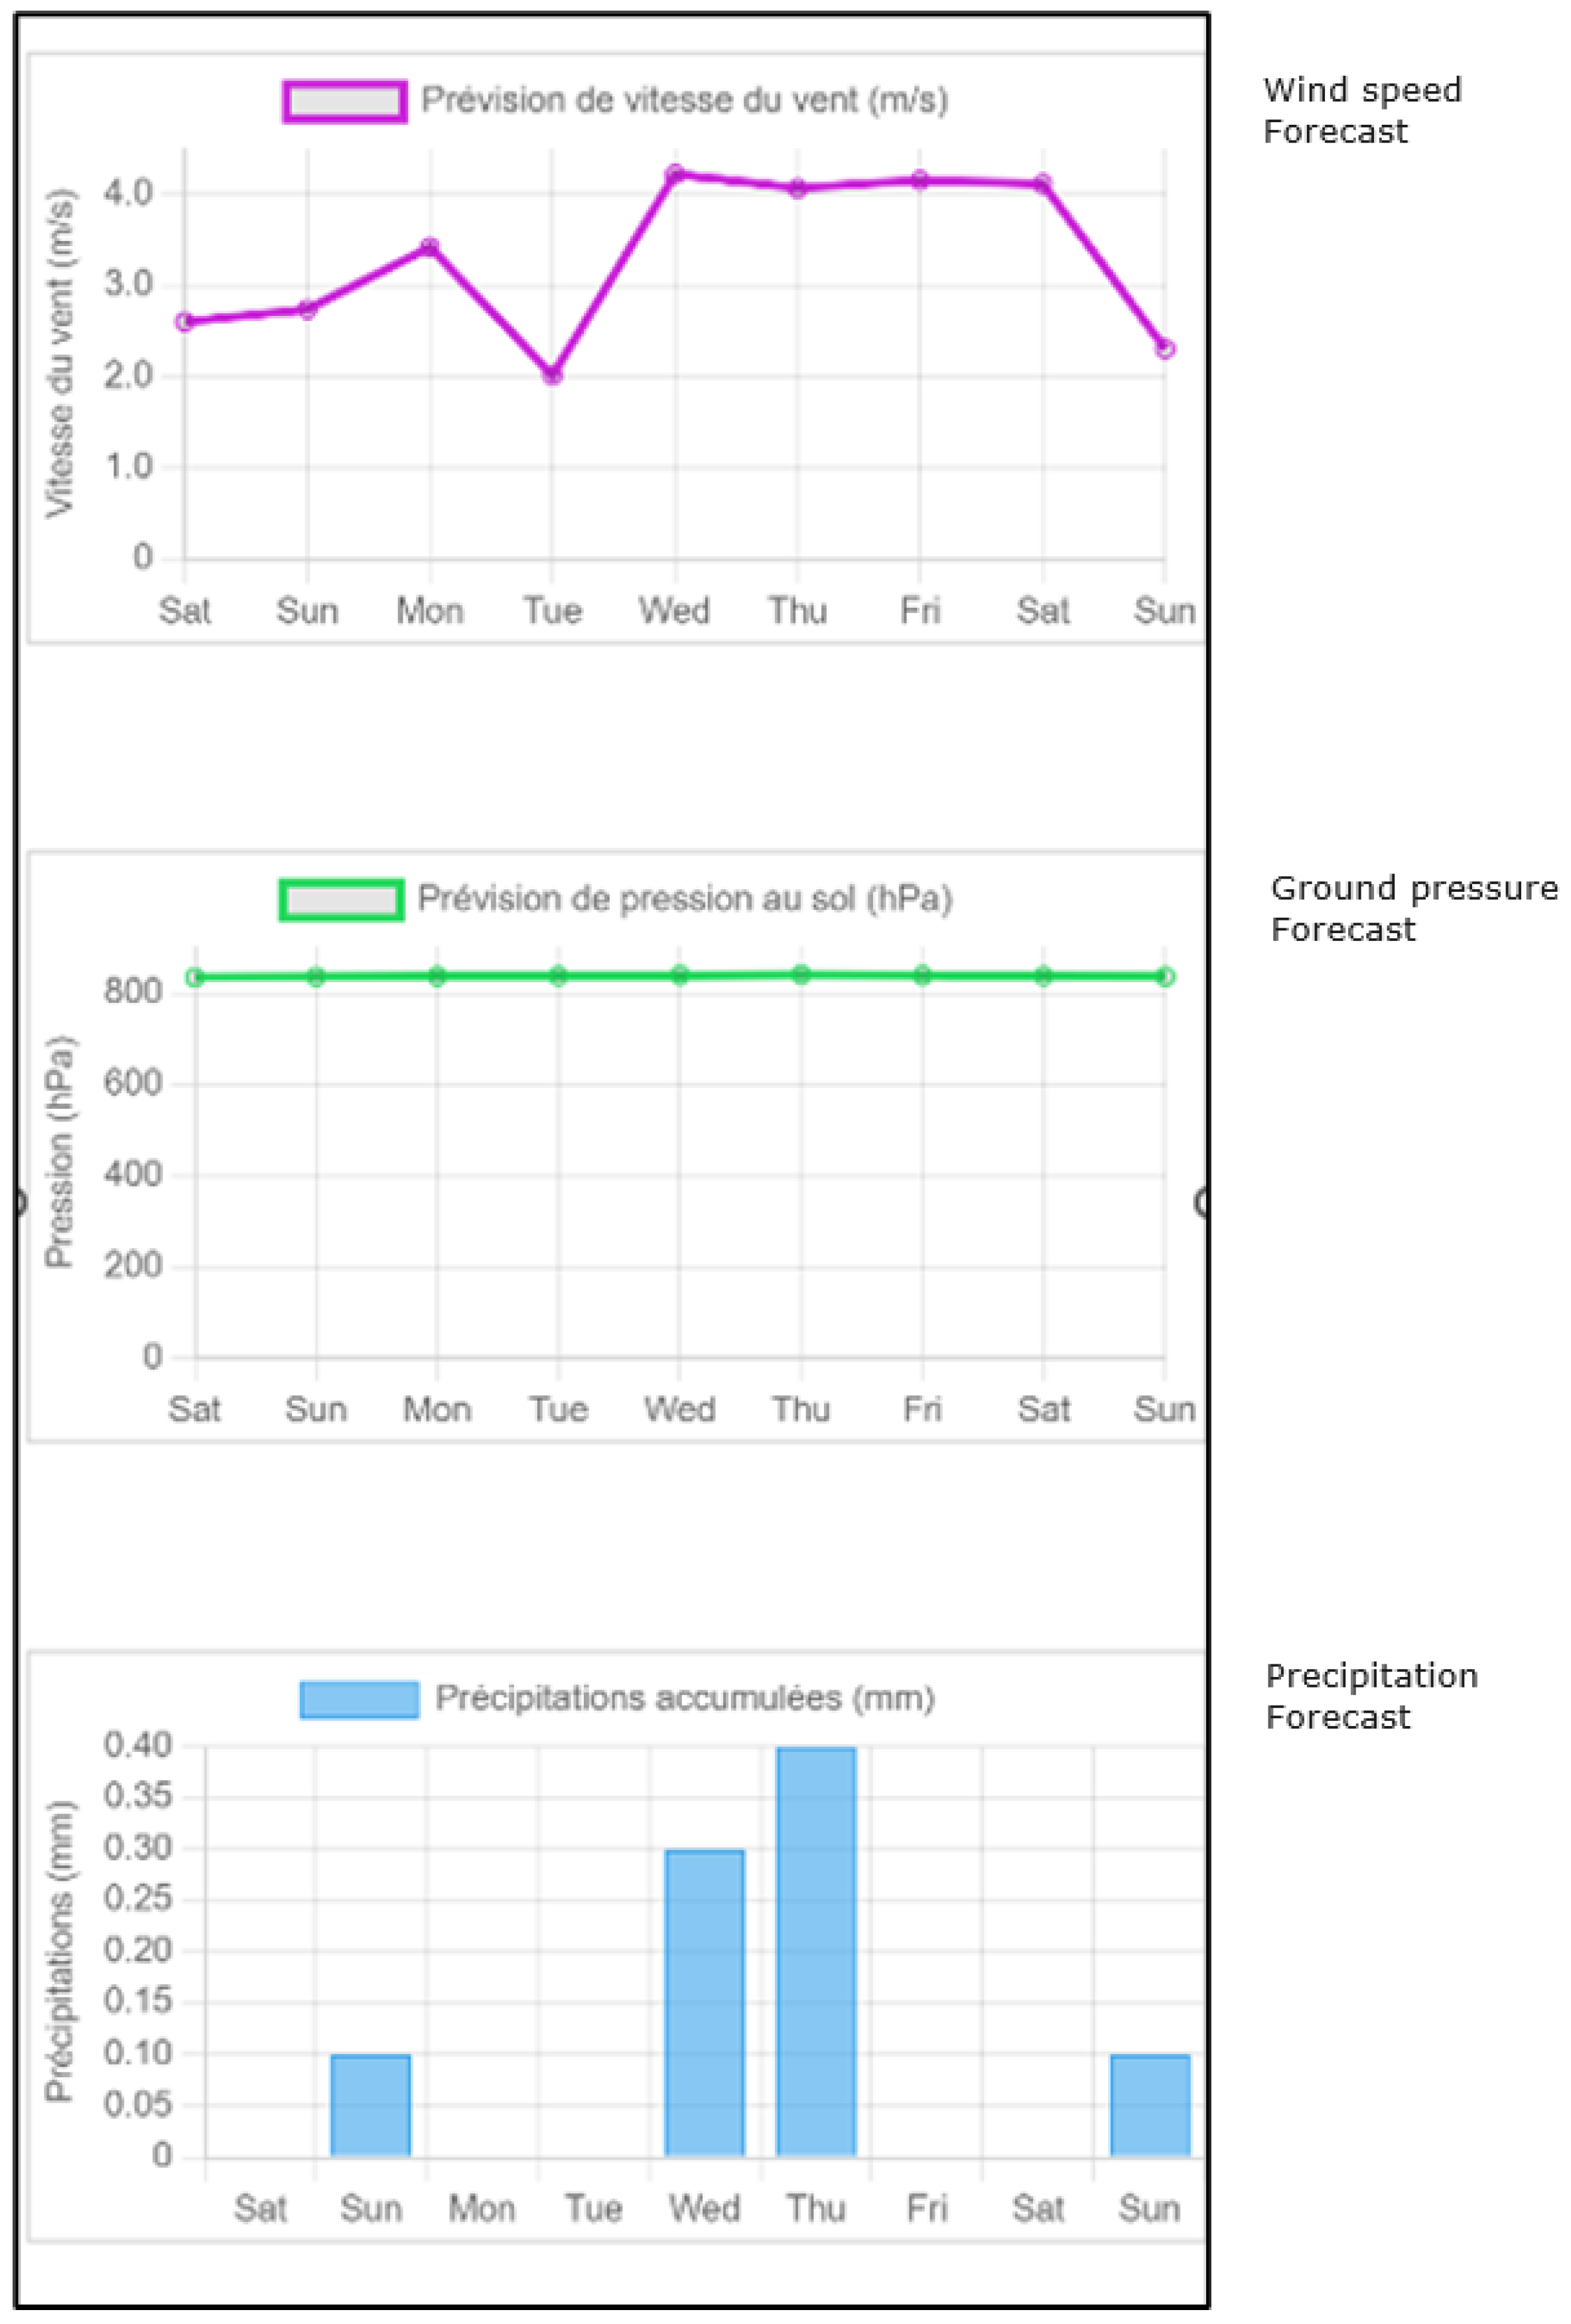
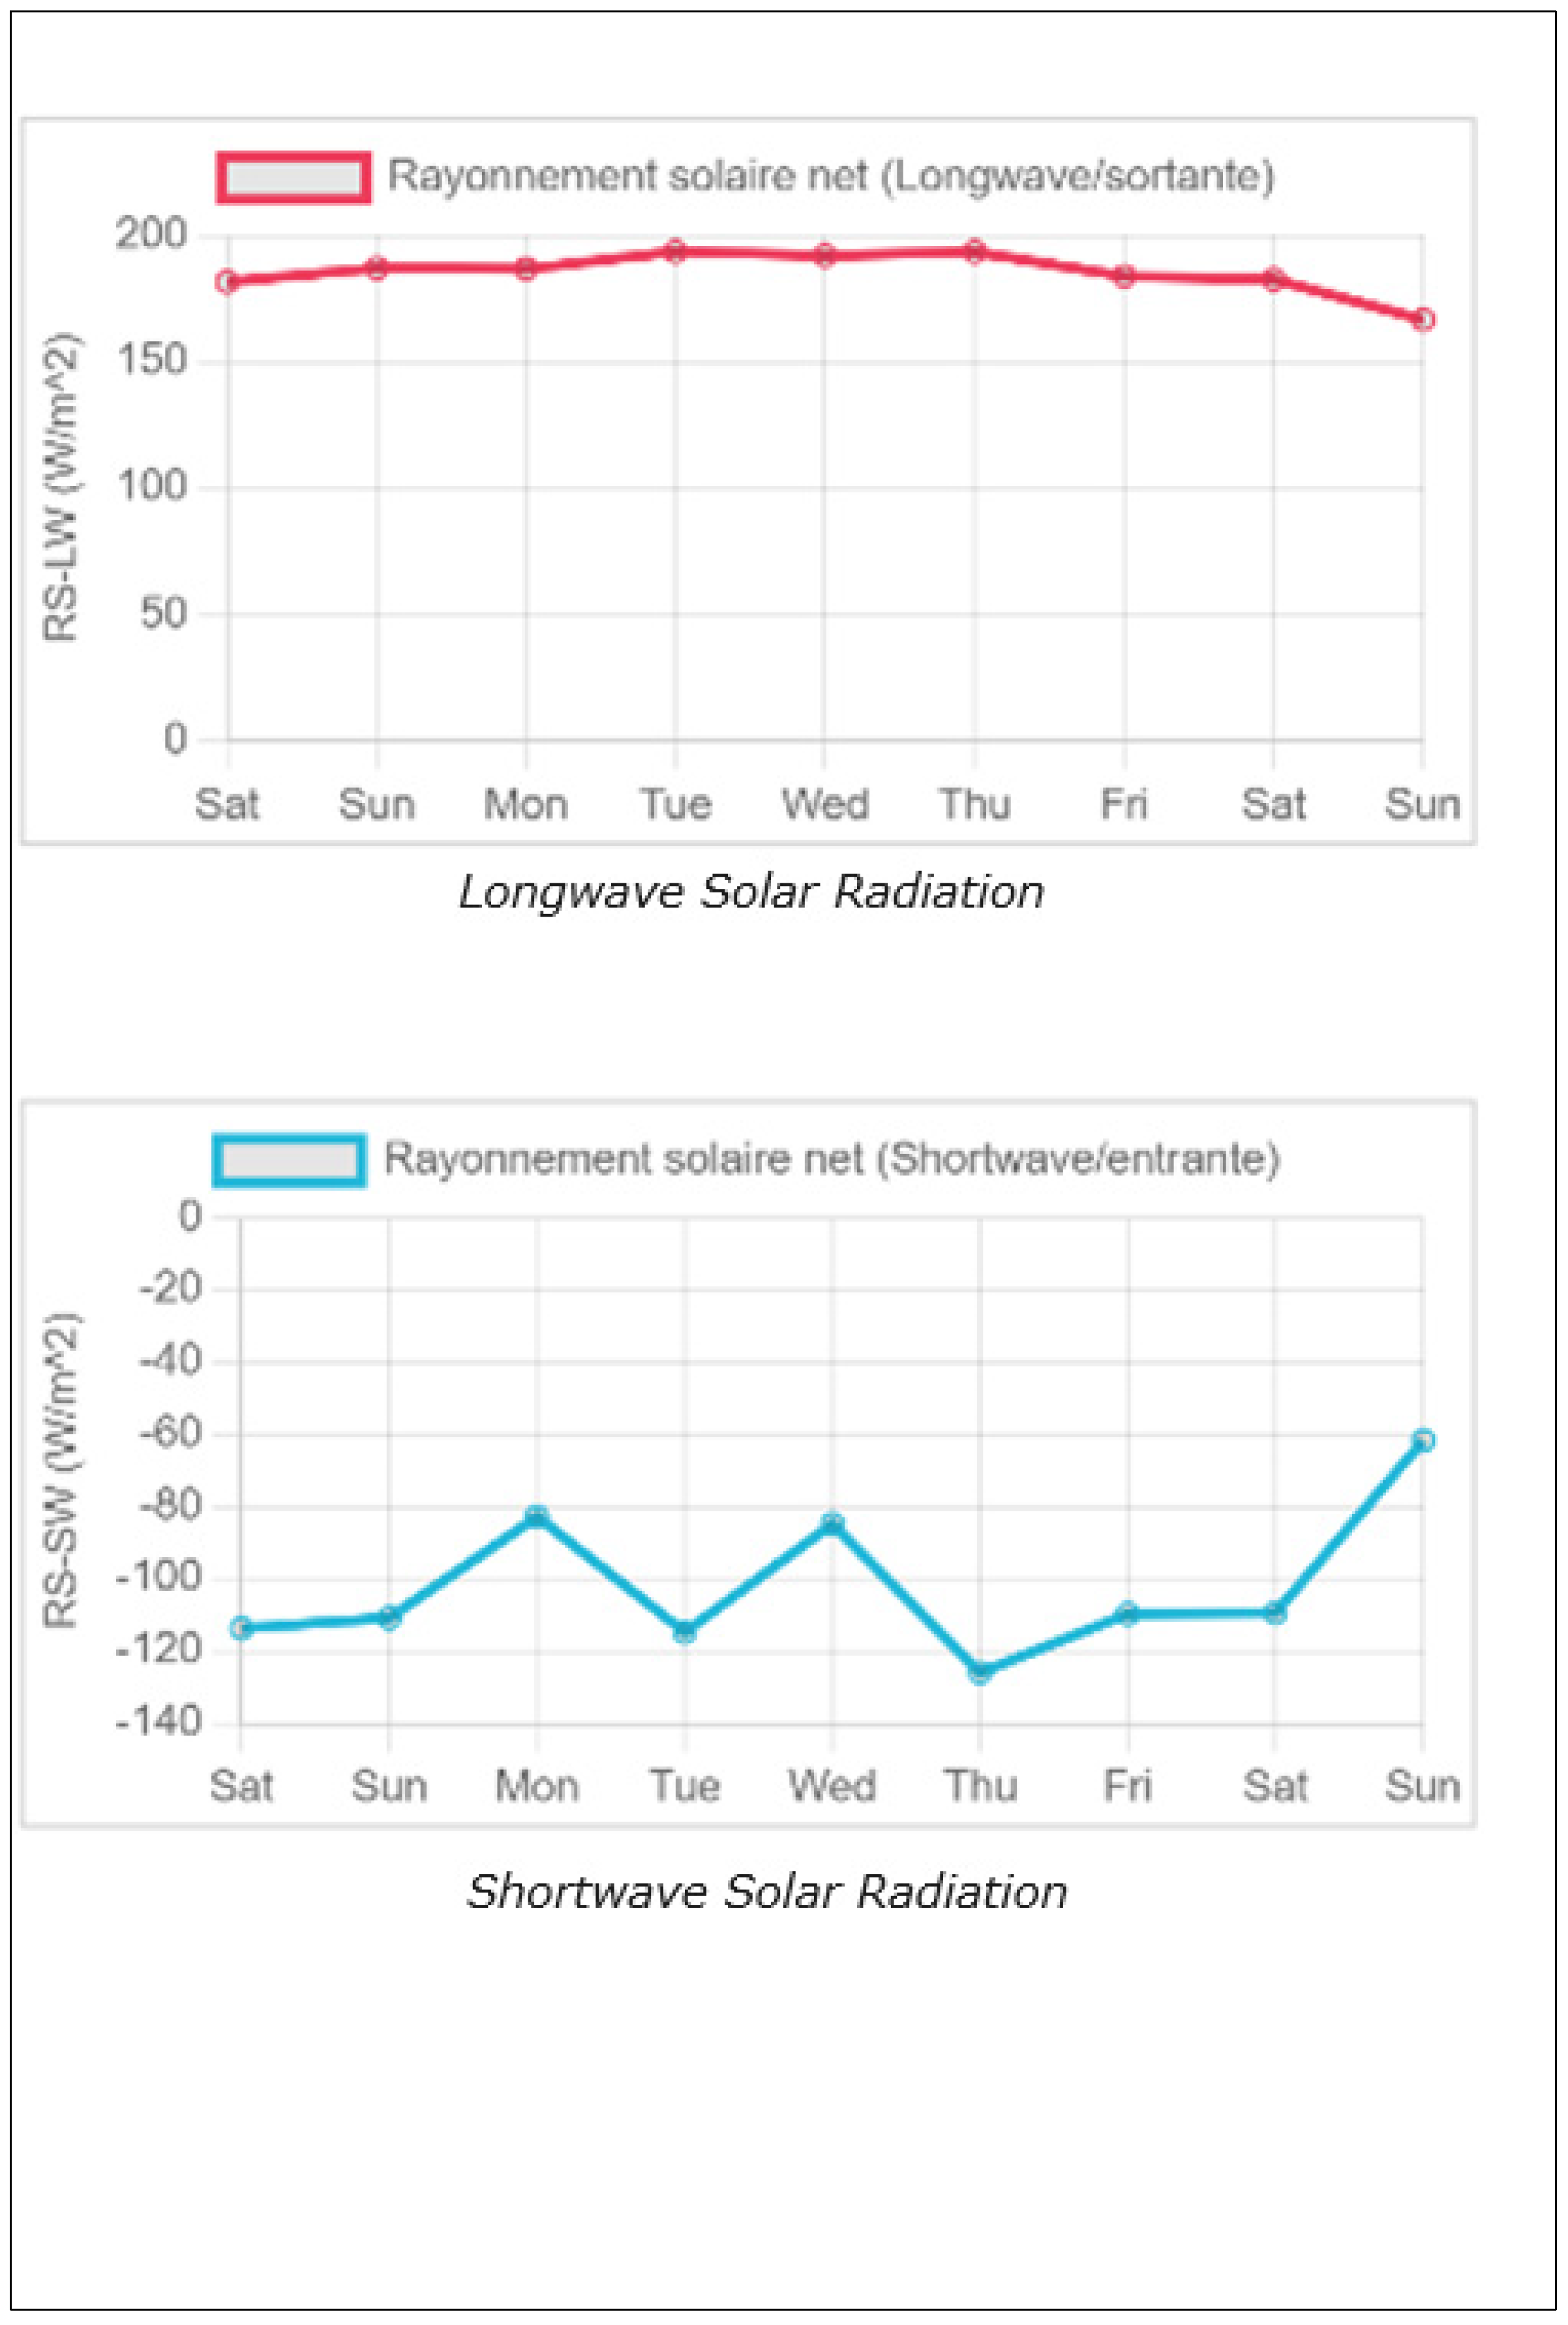
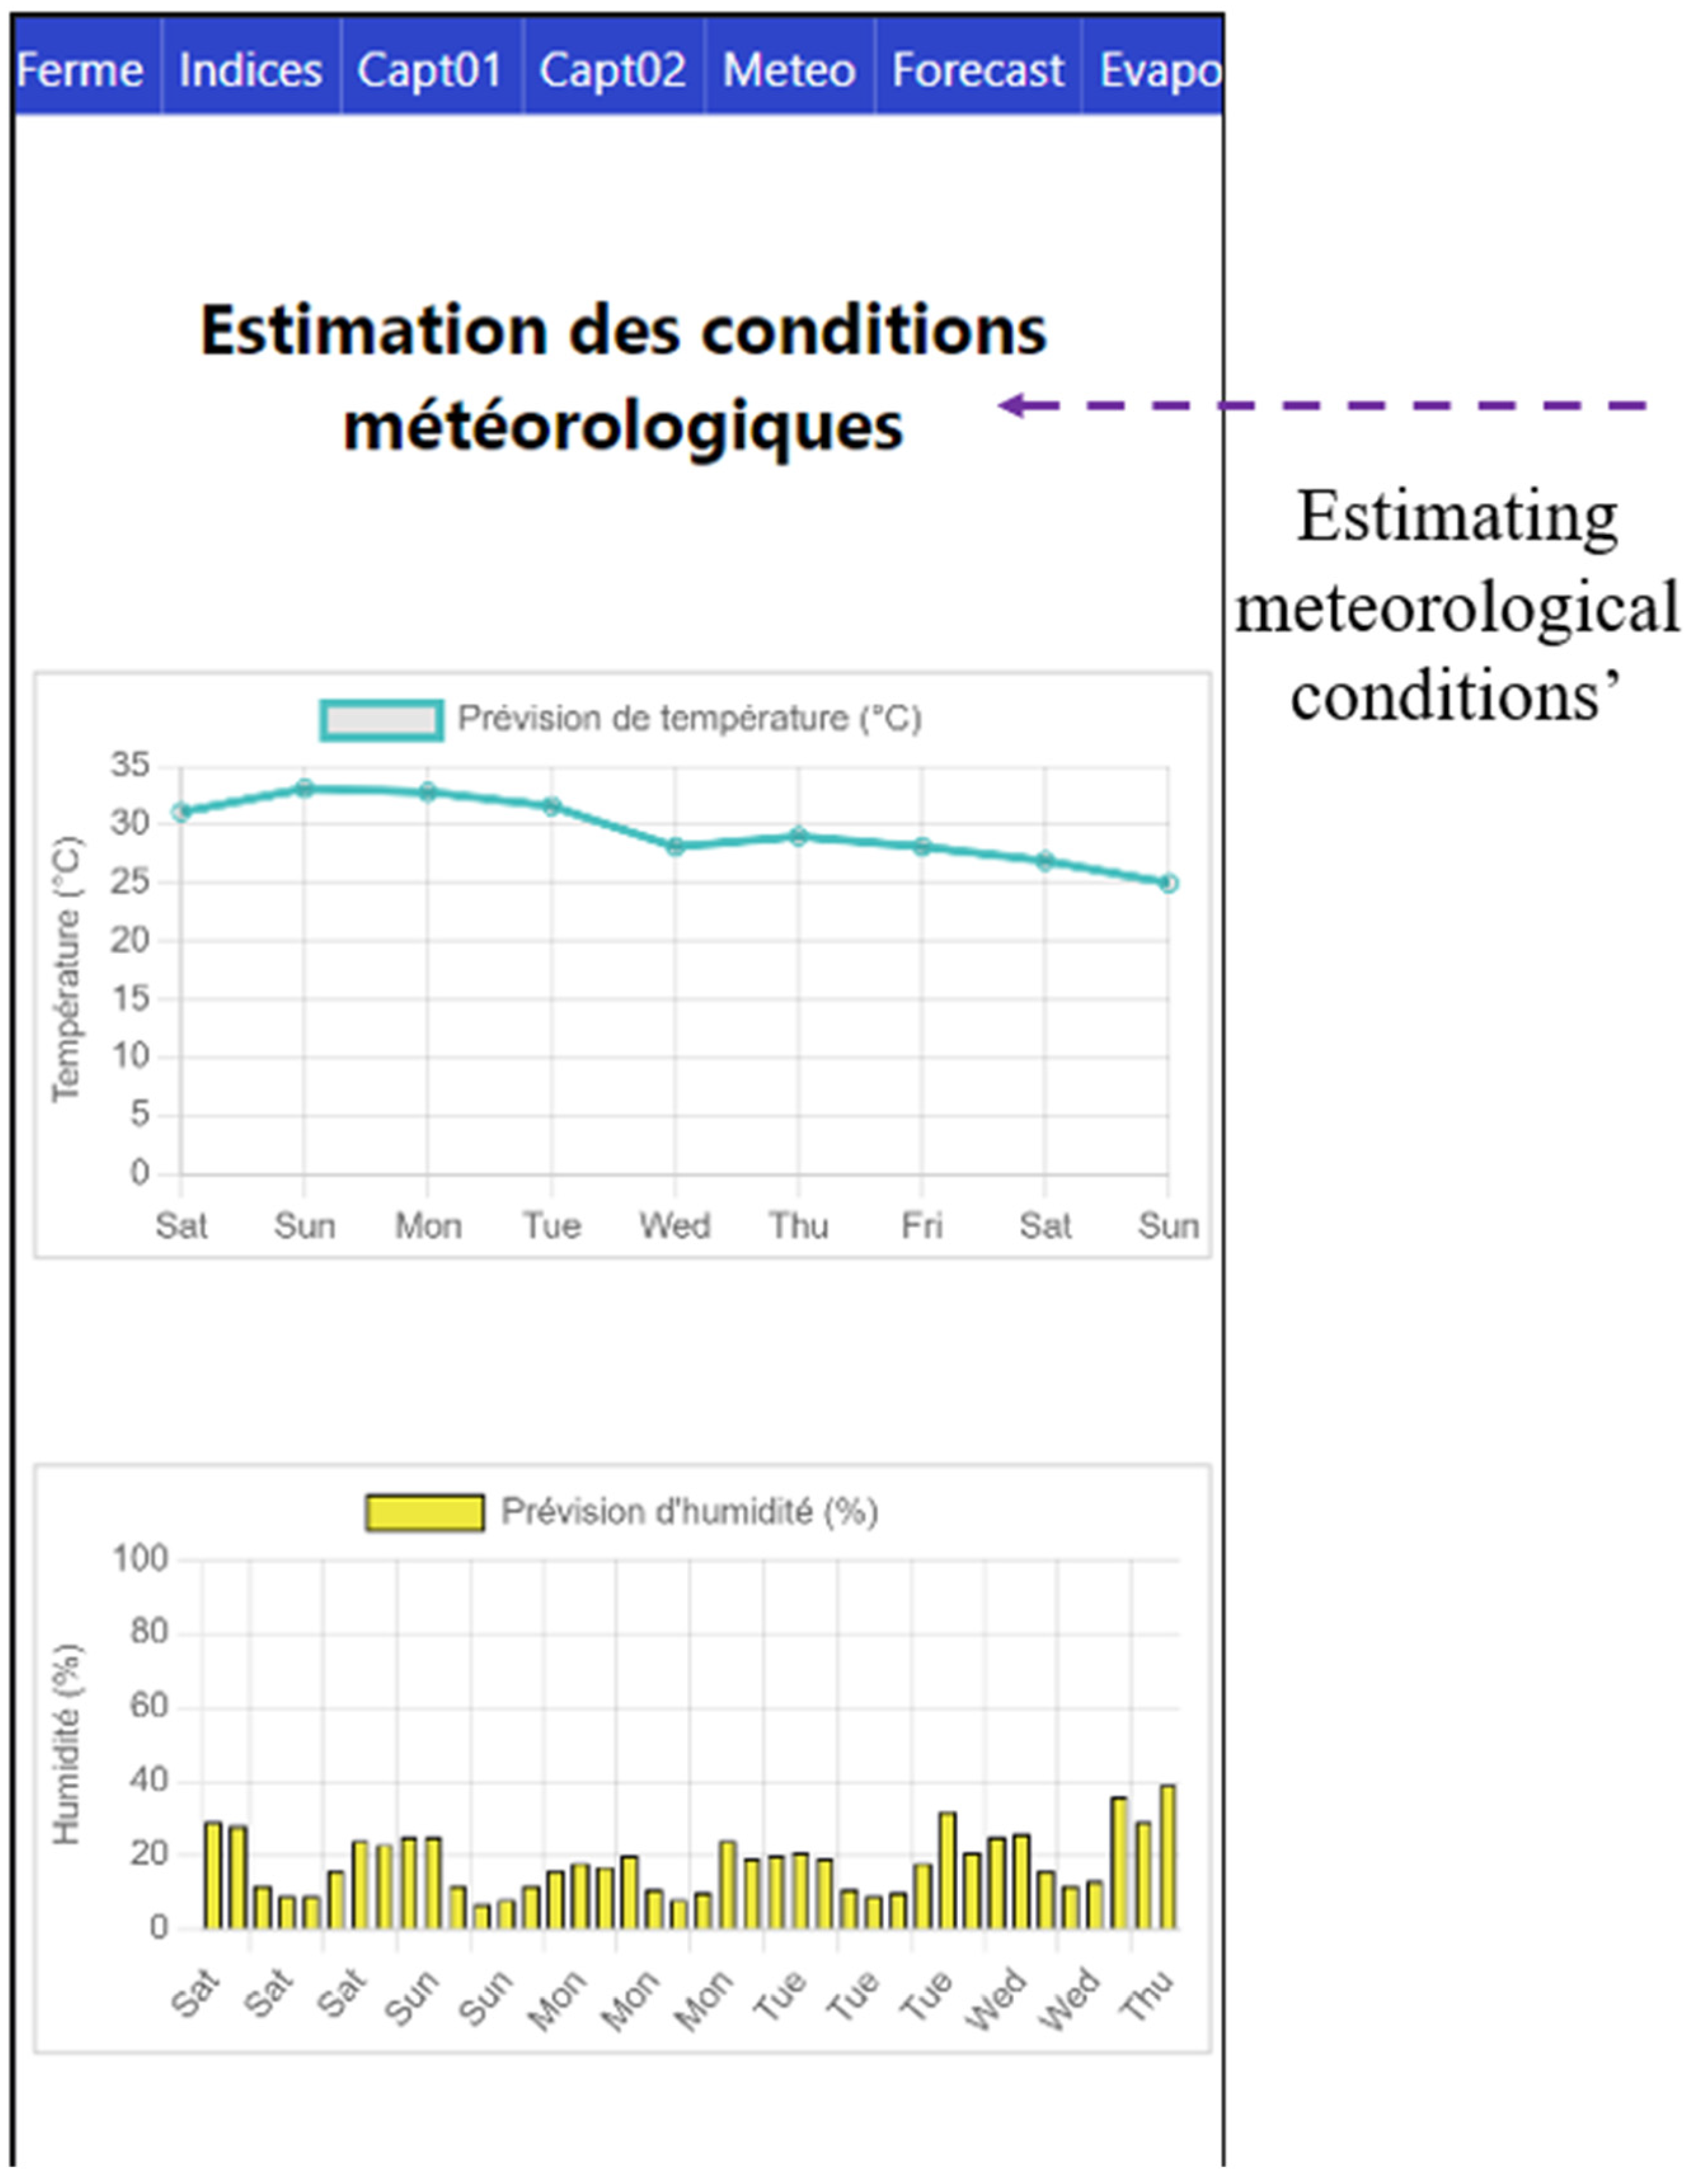
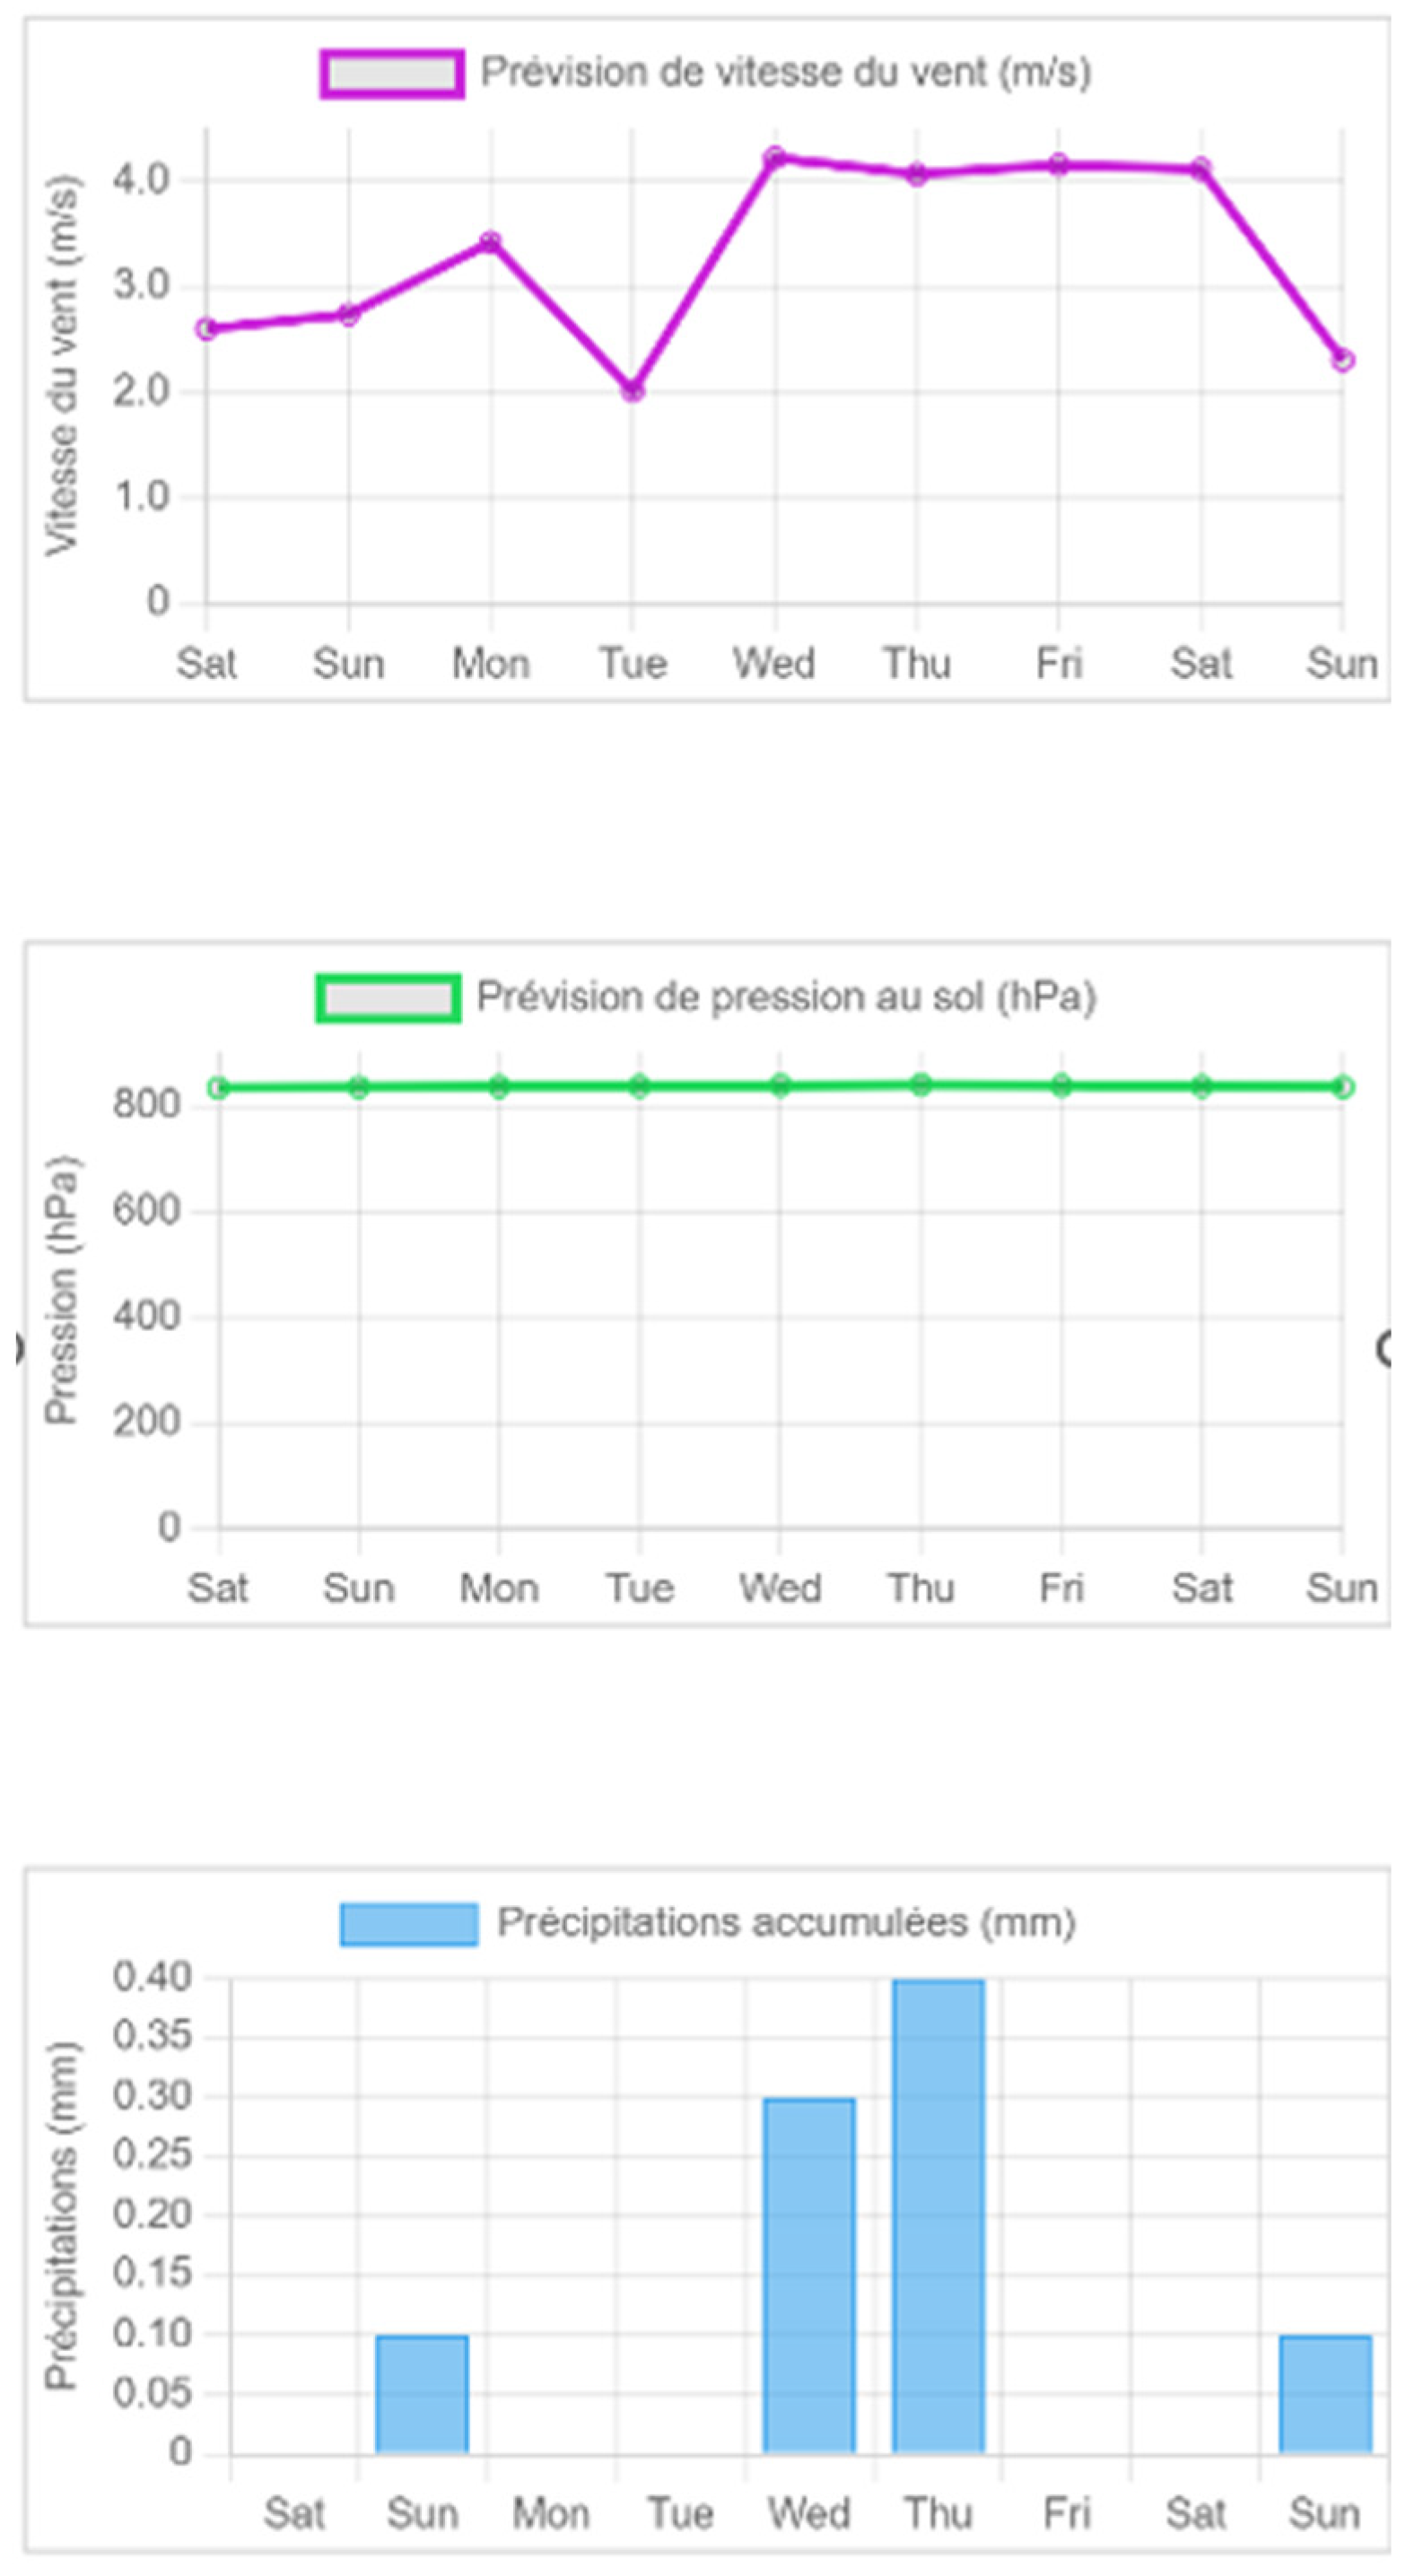
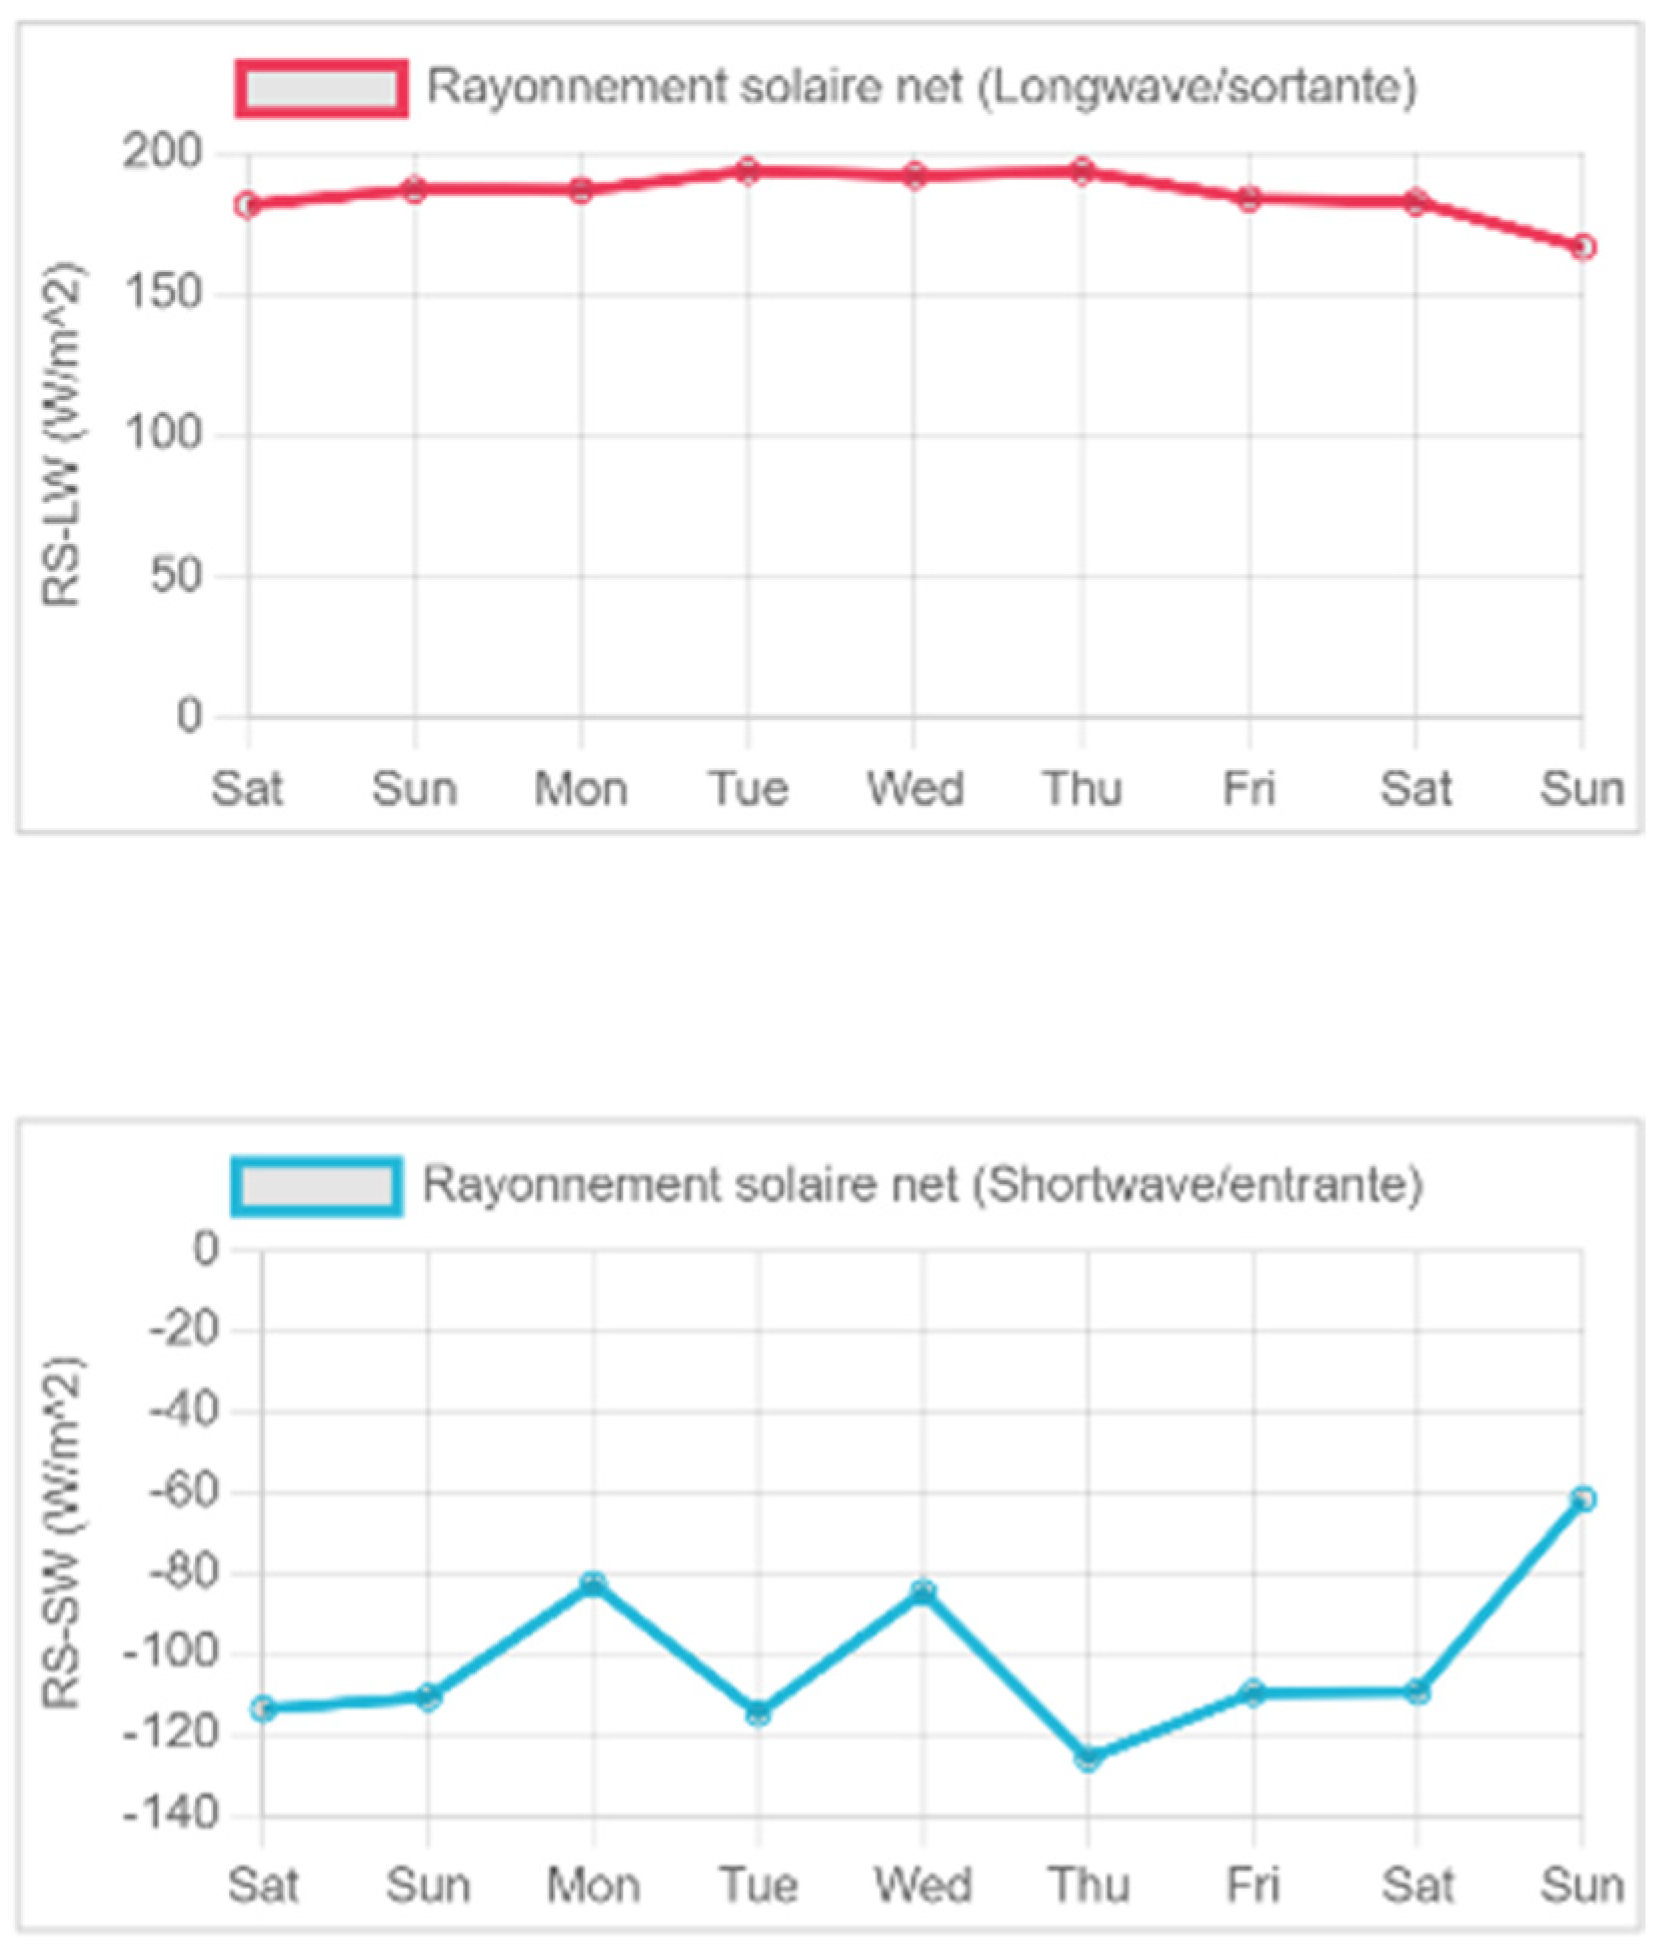
- Service n° 4: Visualization of Downloaded Weather Forecast Data (Figure 15, Figure 16 and Figure 17). This service provides farmers with comprehensive forecasts of future weather conditions for the next 8 days. The data include air temperature, air humidity, wind speed. Clear and interactive graphs enable users to review the values of each variable and adjust their irrigation schemes accordingly. It is important to note that the forecasting of meteorological data comes from available APIs, namely, WeatherBit and OpenWeatherMap. Each website employs a combination of numerical weather prediction models to generate these forecasts such as GFS, and ECMWF [40].
- 7.
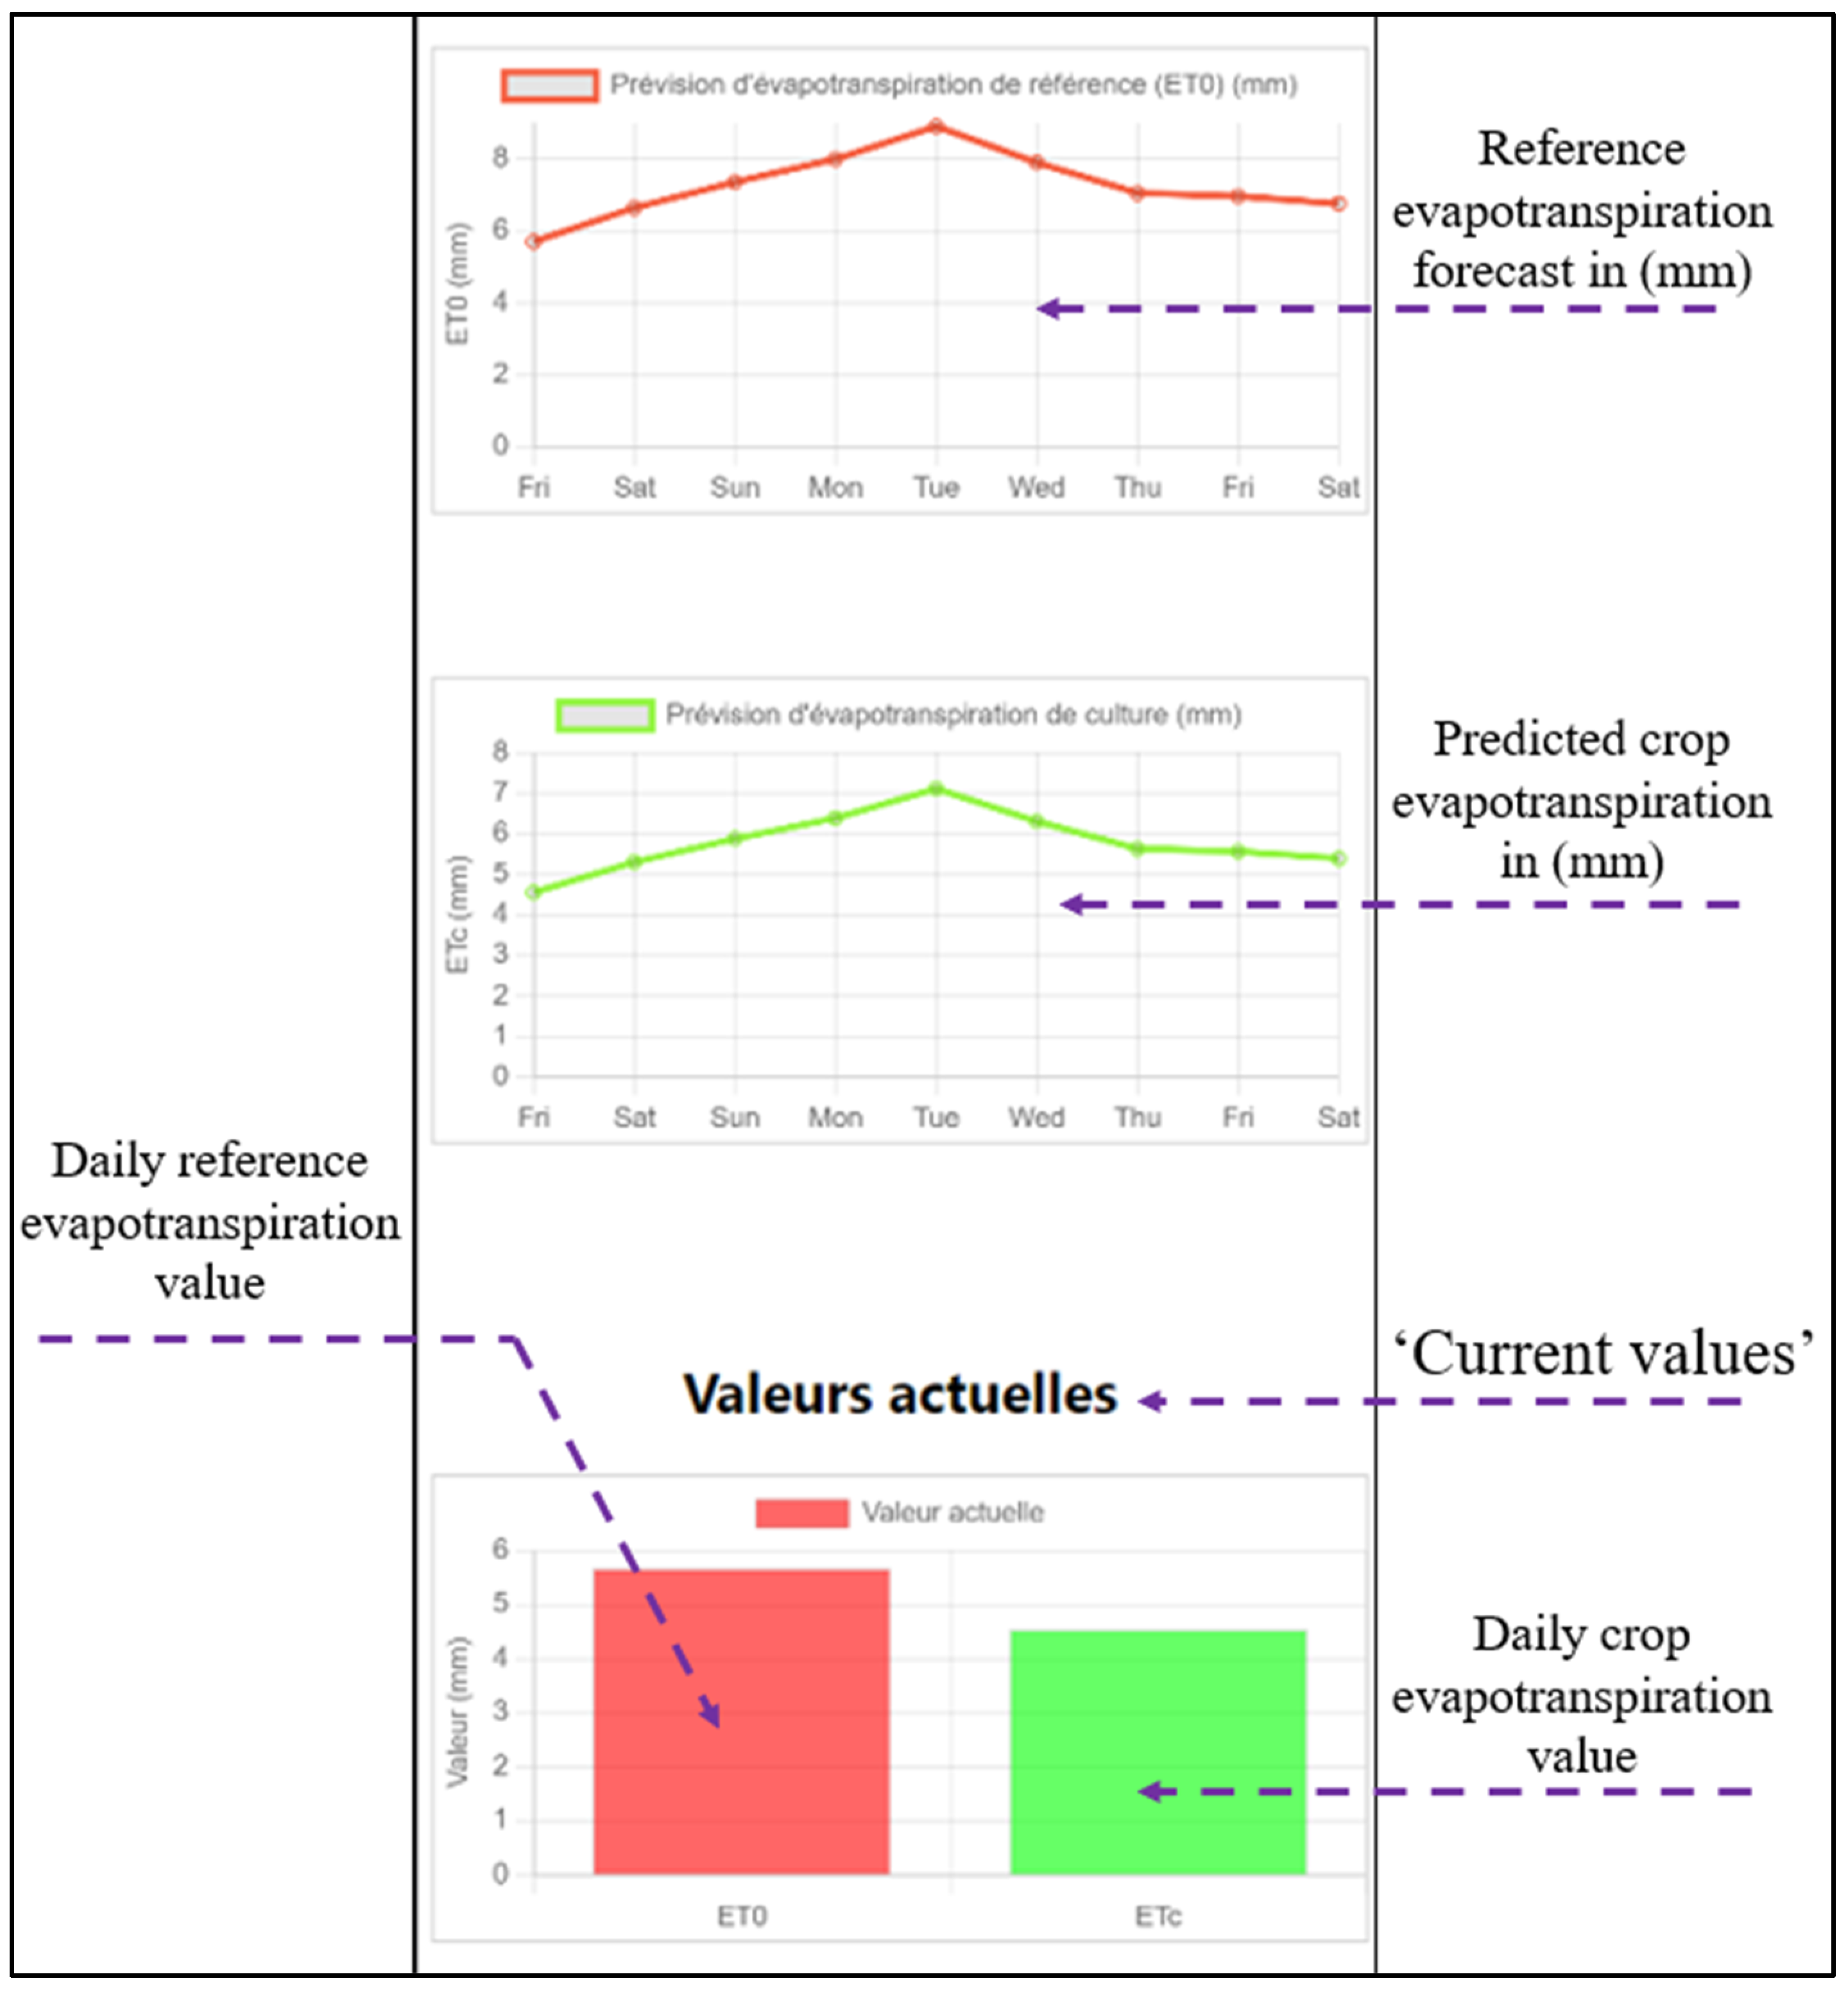
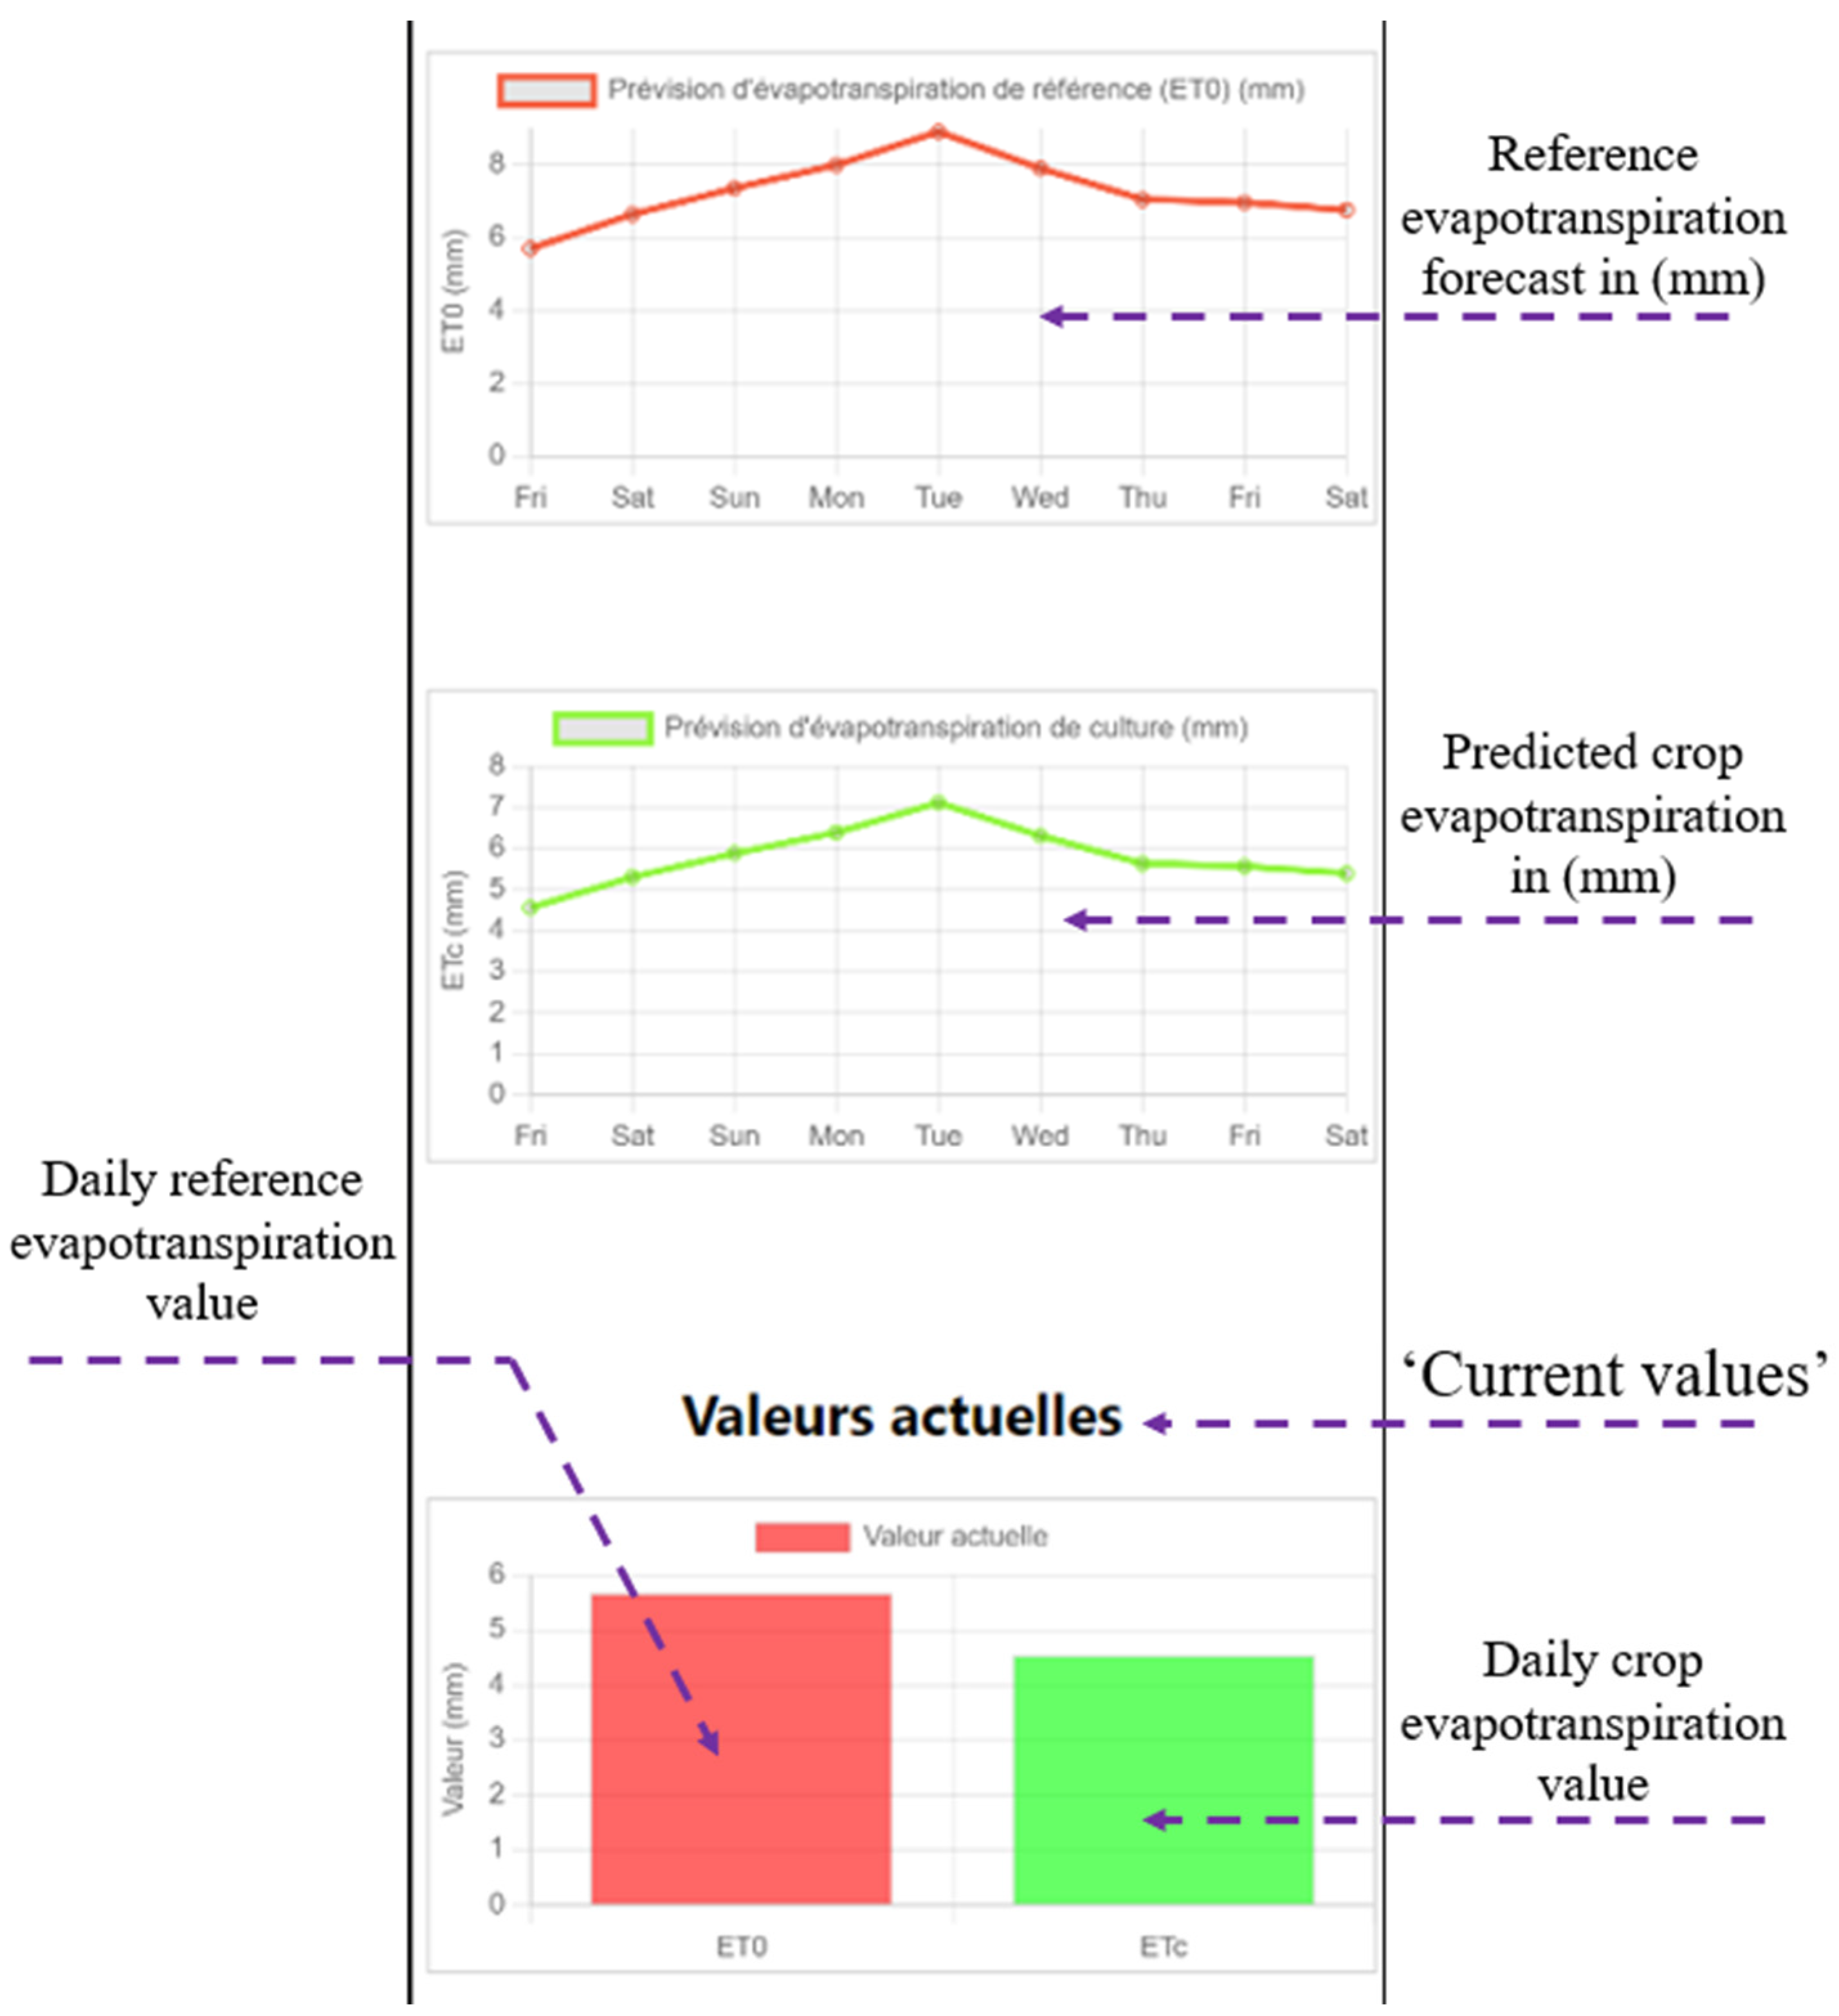
- Service n° 5: Visualization of Downloaded Evapotranspiration Forecasts (Figure 18). This section illustrates how the application visualizes daily and weekly forecasts of reference and crop evapotranspiration. These data are crucial for optimal irrigation. Farmers can plan water quantities based on weekly forecasts and adjust their irrigation schemes accordingly.
- 8.
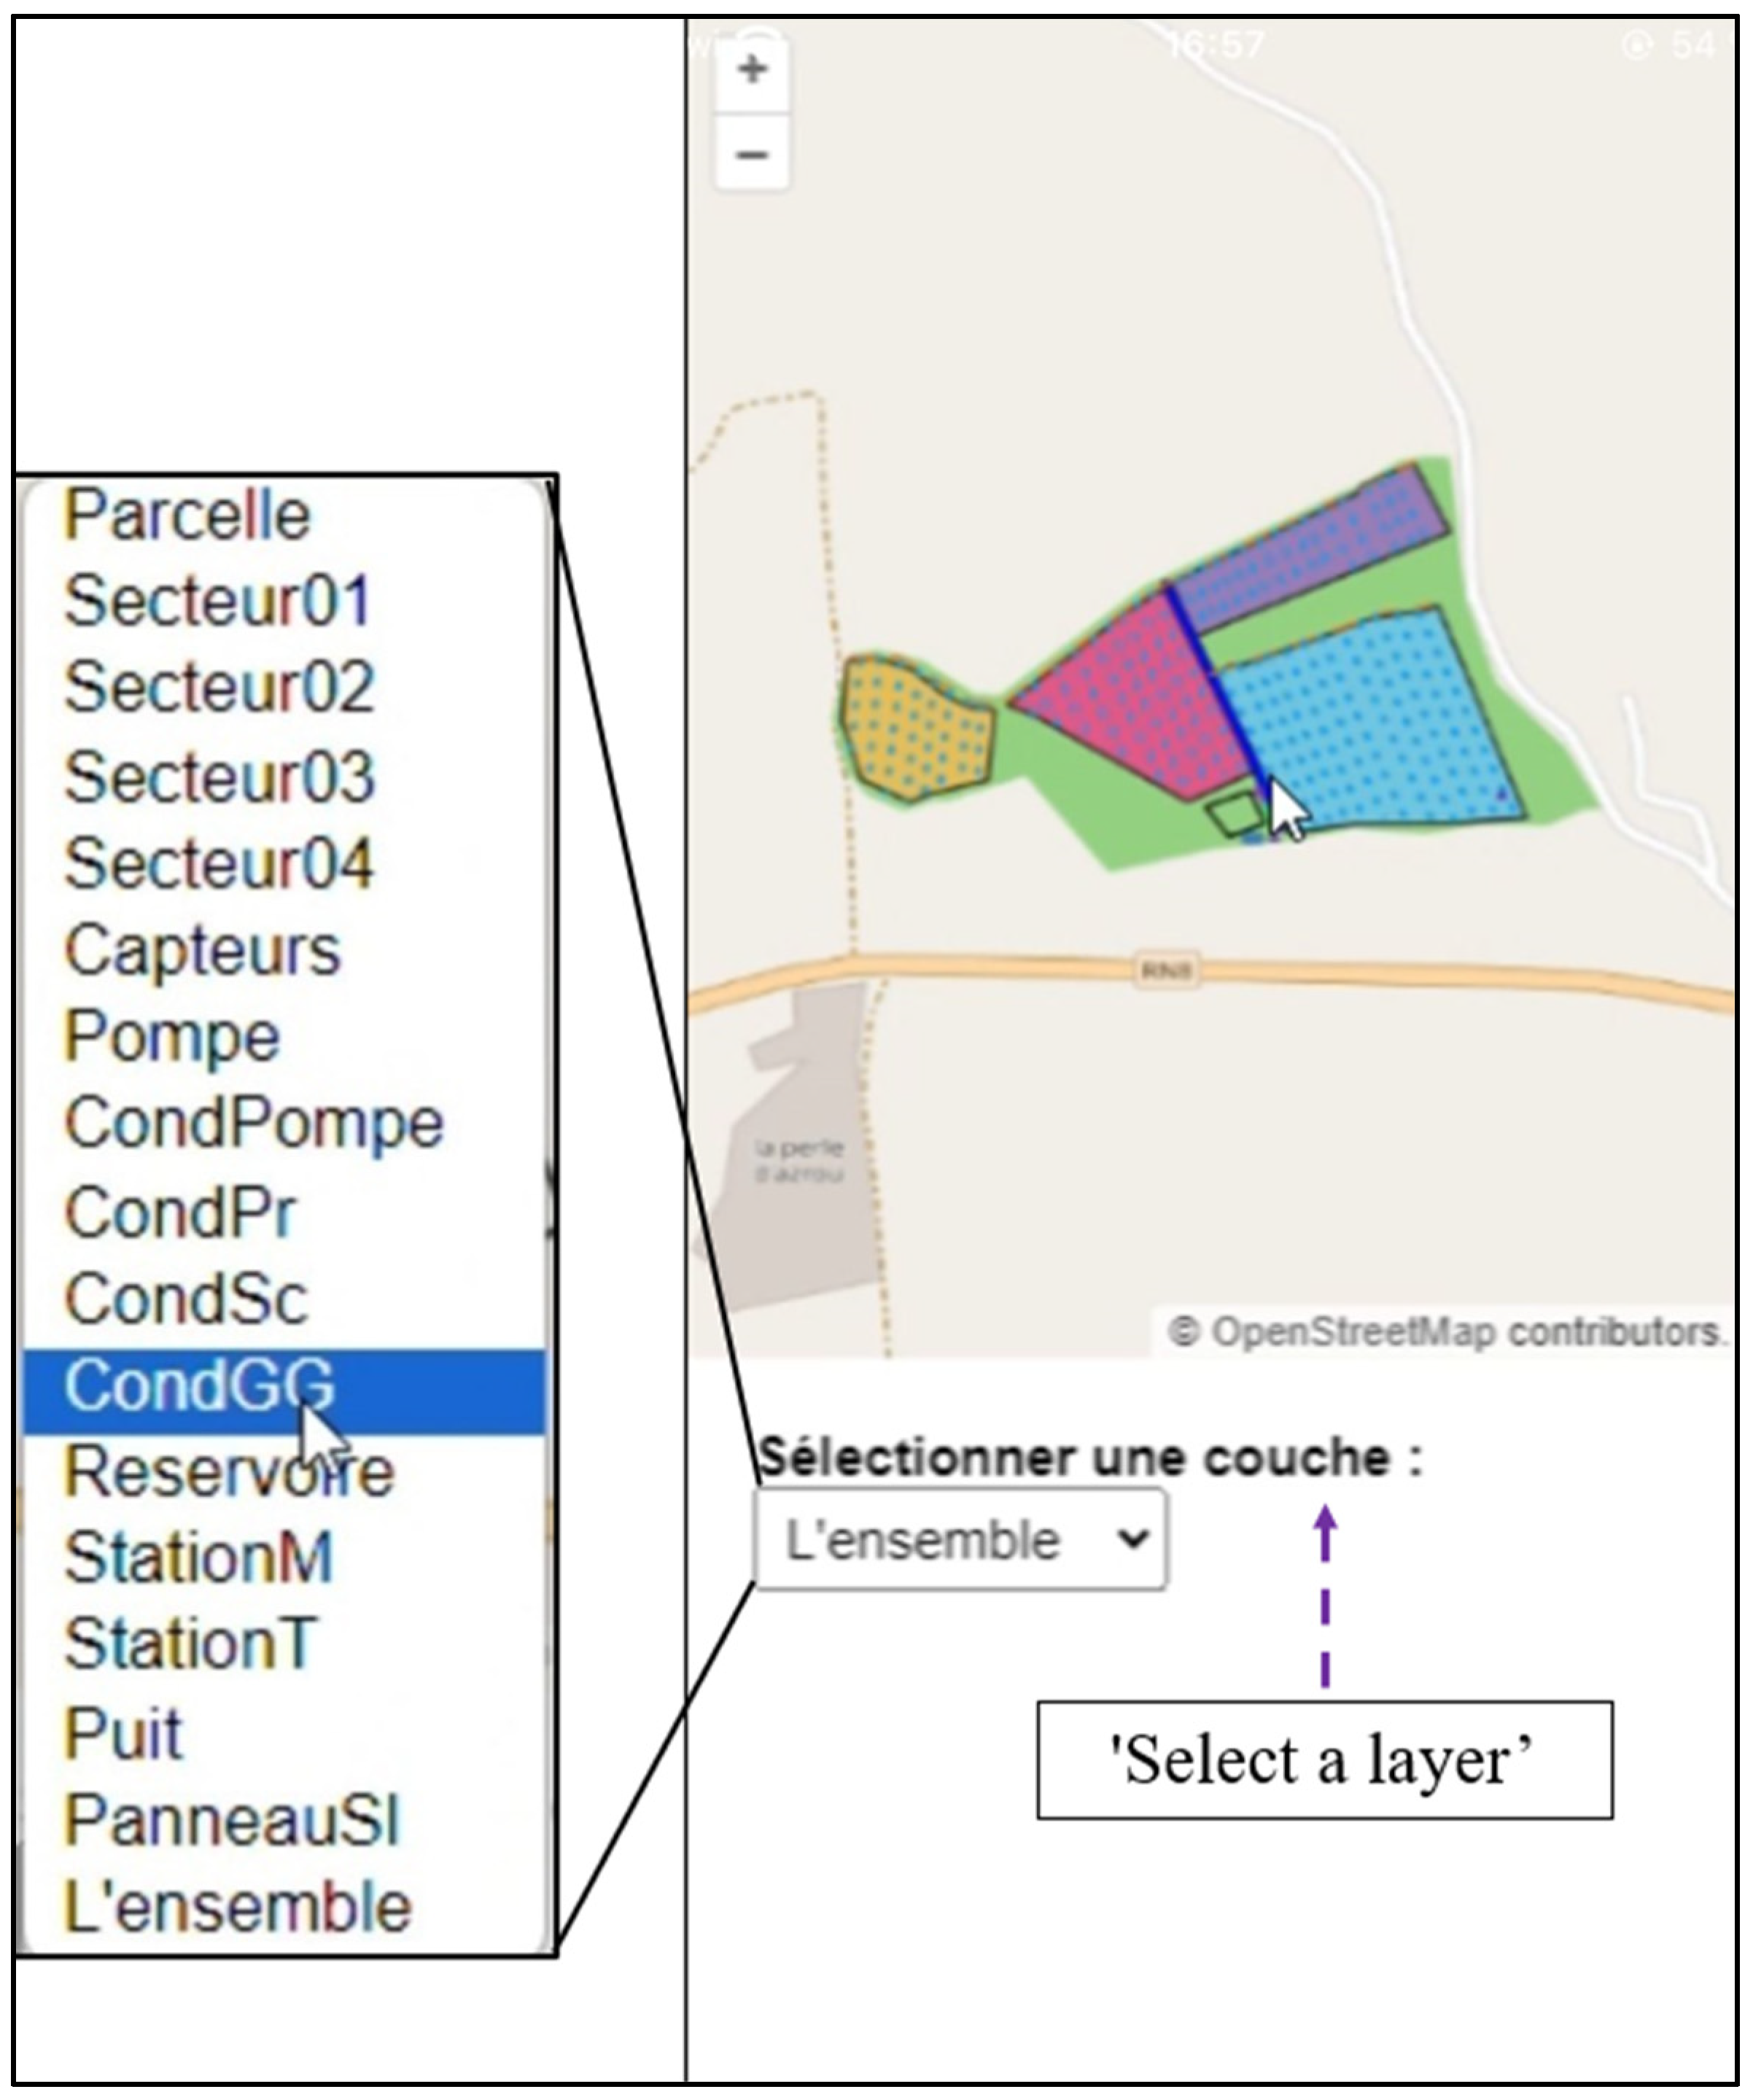
- Service n° 6: Visualization of Geospatial Data on OpenStreetMap (Figure 19). This service enables users to explore the geographical entities of the farm by integrating stored information with OpenStreetMap mapping. Users can precisely select the specific entity they wish to examine. It is important to note that the results of this phase have not been integrated into the final application due to constraints related to the quality of geospatial data.
4. Discussion
- -
- Track the soil water status during the crop growing period: The soil parameter visualization service, including temperature and humidity, provides farmers with the ability to monitor these parameters in real-time and take relevant actions. The data recorded in the database are transmitted in real-time from the sensor to the database.
- -
- Diagnose fruit growth phases in orchards: Visualization services for vegetation indices’ classification maps and indices’ evolution graphs meet this need. Farmers can assess the condition of trees in different parts of the orchard and track seasonal changes to assess the crop status, density, and growth.
- -
- View daily weather conditions: The current weather data viewing service provides farmers with real-time access to crucial weather information for planning agricultural activities.
- -
- Visualize forecast weather data: The service for displaying weather forecasts over a period of 7 days meets this need by providing reliable data to anticipate short-term weather conditions and allow optimal irrigation scheduling.
- -
- Estimate the daily crop evapotranspiration: The daily evapotranspiration display service provides farmers with estimates of the water requirements of the trees, which is also essential for optimal irrigation scheduling.
- -
- Estimate weekly crop evapotranspiration (forecasts): The weekly crop evapotranspiration forecast visualization service allows farmers to plan water distribution strategically for each week.
5. Conclusions
Author Contributions
Funding
Data Availability Statement
Acknowledgments
Conflicts of Interest
Appendix A
- ▪ Login: To log in, simply enter the username and password.

- ▪ Navigate the application: Once you have logged in, you can navigate through the various application windows and consult all the services on offer. To view information about the farm or the daily weather forecast, simply click on the ‘location’ icon, and the text window (containing the information) will appear. For other services, on the other hand, the information is displayed directly as soon as you click on the service in question.


- ▪ Air temperature;
- ▪ Air humidity;
- ▪ Wind speed;
- ▪ Ground pressure;
- ▪ Accumulated precipitation;
- ▪ Outgoing solar radiation (LongWave);
- ▪ Incoming solar radiation (ShortWave);

References
- Évaluation de L’approvisionnement en eau et des Services D’assainissement|Rapport Mondial 2021 de l’ONU sur la Mise en Valeur des Ressources en eau. Available online: https://www.unesco.org/reports/wwdr/2021/fr/evaluation-de-lapprovisionnement-en-eau-et-des-services-dassainissement (accessed on 20 November 2023).
- Le Rapport sur L’état des Ressources en Eau Dans le Monde Renseigne sur les Cours d’eau, le Stockage des Eaux Terrestres et les Glaciers, Organisation Météorologique Mondiale. Available online: https://wmo.int/fr/media/le-rapport-sur-letat-des-ressources-en-eau-dans-le-monde-renseigne-sur-les-cours-deau-le-stockage (accessed on 20 November 2023).
- La Problématique des Ressources en Eau. Available online: https://fnh.ma/article/developpement-durable/la-problematique-des-ressources-en-eau (accessed on 18 September 2023).
- AgriMaroc.Ma, “Le Secteur Agricole au Maroc—AgriMaroc.ma”. Available online: https://www.agrimaroc.ma/secteur-agricole-au-maroc/ (accessed on 27 May 2023).
- Messaoudi, Z.; Kodad, O.; En-Nahli, S.; Ait Haddou, L.; Marrakchi-Benazzouz, L.; Loukili, M.; El Fadl, A.; Berrichi, A.; Beniken, L.; Omari, F.; et al. Gestion Rationnelle de L’irrigation en Vergers D’agrumes dans le Périmètre Irrigué de l’Oriental. Rapport de Projet. 15 April 2021. Available online: https://www.agriculture.gov.ma/sites/default/files/inline-files/MessaoudiMCRDVGestionIrrigationAgrumesOrientalRapportFinal15Avril21%20%281%29.pdf (accessed on 27 May 2023).
- Larousse, É. Définitions: Irrigation—Dictionnaire de Français Larousse. Available online: https://www.larousse.fr/dictionnaires/francais/irrigation/44355 (accessed on 24 May 2023).
- Capraro, F.; Tosetti, S.; Rossomando, F.; Mut, V.; Serman, F.V. Web-Based System for the Remote Monitoring and Management of Precision Irrigation: A Case Study in an Arid Region of Argentina. Sensors 2018, 18, 3847. [Google Scholar] [CrossRef] [PubMed]
- Ancd Ipsita Das, N.G.S. Precision Irrigation: Sensor Network Based Irrigation. In Problems, Perspectives and Challenges of Agricultural Water Management; Kumar, M., Ed.; InTech: London, UK, 2012. [Google Scholar] [CrossRef]
- Hermann, E. Les Applications Mobiles: Analyse et Proposition d’un Concept de Collection Pour la Bibliotheque Nationale Suisse. Ph.D. Thesis, Université de Fribourg, Fribourg, Switzerland, 2017. [Google Scholar]
- Abioye, E.A.; Hensel, O.; Esau, T.J.; Elijah, O.; Abidin, M.S.Z.; Ayobami, A.S.; Yerima, O.; Nasirahmadi, A. Precision Irrigation Management Using Machine Learning and Digital Farming Solutions. AgriEngineering 2022, 4, 70–103. [Google Scholar] [CrossRef]
- Jha, K.; Doshi, A.; Patel, P.; Shah, M. A comprehensive review on automation in agriculture using artificial intelligence. Artif. Intell. Agric. 2019, 2, 1–12. [Google Scholar] [CrossRef]
- Welcome to AgriEdge. Available online: https://www.agriedge.ma/ (accessed on 31 May 2023).
- IrriSmart, the Smart Irrigation System for FoodLAND—FoodLAND. Available online: https://foodland-africa.eu/2022/06/15/irrismart-the-smart-irrigation-system-for-foodland/ (accessed on 25 November 2023).
- Saab, M.A.; Jomaa, I.; Skaf, S.; Fahed, S.; Todorovic, M. Assessment of a Smartphone Application for Real-Time Irrigation Scheduling in Mediterranean Environments. Water 2019, 11, 252. [Google Scholar] [CrossRef]
- Jaafar, H.; Mourad, R.; Hazimeh, R.; Sujud, L. AgSAT: A Smart Irrigation Application for Field-Scale Daily Crop ET and Water Requirements Using Satellite Imagery. Remote Sens. 2022, 14, 5090. [Google Scholar] [CrossRef]
- SmartIrrigationApps.org|Smartphone Technology for Managing Urban and Agricultural Irrigation. Available online: https://smartirrigationapps.org/ (accessed on 25 November 2023).
- Quelle est la Différence Entre les Applications Mobiles et les Applications Web? Available online: https://www.hello-pomelo.com//articles/quelle-est-la-difference-entre-les-applications-mobiles-et-les-applications-web (accessed on 18 September 2023).
- Application Web vs. Application Mobile?—Vertuoz. Available online: https://www.vertuoz.fr/blog/webmarketing/application-web-vs-application-mobile (accessed on 18 September 2023).
- Oles, B. An Introduction to TimescaleDB, Severalnines. Available online: https://severalnines.com/blog/introduction-timescaledb/ (accessed on 16 August 2023).
- “PostGIS”, PostGIS. Available online: https://postgis.net/ (accessed on 25 November 2023).
- Chen, S.; Thaduri, U.R.; Ballamudi, V. Front-End Development in React: An Overview. Eng. Int. 2019, 7, 117–126. [Google Scholar] [CrossRef]
- Introduction to Node.js|Node.js. Available online: https://nodejs.org/en/learn/getting-started/introduction-to-nodejs (accessed on 25 November 2023).
- Express/Node Introduction—Learn Web Development|MDN. Available online: https://developer.mozilla.org/en-US/docs/Learn/Server-side/Express_Nodejs/Introduction (accessed on 25 November 2023).
- Obe, R.; Hsu, L.S. PostGIS in Action, 3rd ed.; Simon and Schuster: New York, NY, USA, 2021. [Google Scholar]
- Minghini, M.; Kotsev, A.; Lutz, M. Comparing inspire and openstreetmap data: How to make the most out of the two worlds. Int. Arch. Photogramm. Remote Sens. Spat. Inf. Sci. 2019, XLII-4-W14, 167–174. [Google Scholar] [CrossRef]
- Current Weather and Forecast—OpenWeatherMap. Available online: https://openweathermap.org/ (accessed on 25 November 2023).
- Current Weather, Historical Weather, and Forecast Weather Data in One Package. Available online: https://www.weatherbit.io/features (accessed on 25 November 2023).
- IBM Documentation. Available online: https://www.ibm.com/docs/fr/rational-soft-arch/9.5?topic=diagrams-use-case (accessed on 25 November 2023).
- Parvathaneni, S. A Complete Guide for POSTGRES Timescale DB, Medium. Available online: https://medium.com/@SaiParvathaneni/a-complete-guide-for-postgres-timescale-db-ae75a4d45b8d (accessed on 25 November 2023).
- Mutanga, O.; Kumar, L. Google Earth Engine Applications. Remote Sens. 2019, 11, 591. [Google Scholar] [CrossRef]
- Rouse, J.W.; Haas, R.W.; Schell, J.A.; Deering, D.W.; Harlan, J.C. Monitoring the Vernal Advancement and Retrogradation (Greenwave Effect) of Natural Vegetation; NASA/GSFCT Type III Final Report; NASA: Greenbelt, MD, USA, 1974. [Google Scholar]
- Huete, A.R. A soil-adjusted vegetation index (SAVI). Remote Sens. Environ. 1988, 25, 295–309. [Google Scholar] [CrossRef]
- Liu, H.Q.; Huete, A.R. A feedback-based modification of the NDVI to minimize canopy background and atmospheric noise. IEEE Trans. Geosci. Remote Sens. 1995, 33, 457–465. [Google Scholar] [CrossRef]
- Gao, B.-C. NDWI—“A normalized difference water index for remote sensing of vegetation liquid water from space”. Remote Sens. Environ. 1995, 58, 257–266. [Google Scholar] [CrossRef]
- Jin, S.; Sader, S.A. Comparison of time series tasseled cap wetness and the normalized difference moisture index in detecting forest disturbances. Remote Sens. Environ. 2005, 94, 364–372. [Google Scholar] [CrossRef]
- What Is an Application Programming Interface (API)?|IBM. Available online: https://www.ibm.com/topics/api (accessed on 25 November 2023).
- Bouhlassa, S.; Pare, S. Évapotranspiration de référence dans la région aride de Tafilalet au sud-est du MarocReference evapotranspiration in the arid area of Tafilalet, south-East of Morocco. Afr. J. Environ. Assess. Manag. 2006, 11, 1–16. [Google Scholar]
- Jadhav, M.A.; Sawant, B.R.; Deshmukh, A. Single Page Application using AngularJS. Int. J. Comput. Sci. Inf. Technol. 2015, 6, 2876–2879. [Google Scholar]
- Beke, M. On the Comparison of Software Quality Attributes for Client-Side and Server-Side Rendering. Ph.D. Thesis, University of Antwerp, Antwerp, Belgium, 2018. [Google Scholar]
- Forecast API|Weatherbit. Available online: https://www.weatherbit.io/api/weather-forecast-api (accessed on 31 January 2024).


| Application | Limits | User Experience |
|---|---|---|
| AquaEdge |
|
|
| Sowater |
|
|
| Irrismart |
|
|
| Index | Definition | Equation | Reference |
|---|---|---|---|
| NDVI (Normalized Difference Vegetation Index) | NDVI is used to determine the health of vegetation by indicating the chlorophyll content of plants. In agriculture, this vegetation index is used to measure the rate of plant cover and the vigor of the crop present on an agricultural plot. | (NIR − Red)/(NIR + Red) | [31] |
| SAVI (Soil-Adjusted Vegetation Index) | SAVI is an adjusted form of NDVI, designed to minimize the influence of soil luminosity by means of a soil luminosity correction factor. This index is often used in arid regions with low vegetation cover. | ((NIR − Red)/(NIR + Red + L)) × (1 + L) | [32] |
| EVI (Enhanced Vegetation Index) | This enhanced index accounts for atmospheric variations and vegetation cover, providing better sensitivity to changes in vegetation cover compared to NDVI. It is more sensitive in areas with dense vegetation. | 2.5 × ((NIR − Red)/(NIR + 6 × Red − 7.5 × Blue + 1)) | [33] |
| NDWI (Normalized Difference Water Index) | NDWI is an index strongly related to the water content of the plant. It helps create water stress maps and is therefore relevant in precise irrigation management. | (Green − NIR)/(Green + NIR) | [34] |
| NDMI (Normalized Difference Moisture Index) | NDMI indicates the water stress level. It is used to assess and monitor the moisture content of vegetation, helping in irrigation monitoring. | (NIR − SWIR)/(NIR + SWIR) | [35] |
Disclaimer/Publisher’s Note: The statements, opinions and data contained in all publications are solely those of the individual author(s) and contributor(s) and not of MDPI and/or the editor(s). MDPI and/or the editor(s) disclaim responsibility for any injury to people or property resulting from any ideas, methods, instructions or products referred to in the content. |
© 2024 by the authors. Licensee MDPI, Basel, Switzerland. This article is an open access article distributed under the terms and conditions of the Creative Commons Attribution (CC BY) license (https://creativecommons.org/licenses/by/4.0/).
Share and Cite
Ennatiqi, L.; Bouziani, M.; Yaagoubi, R.; Kenny, L. Soqia: A Responsive Web Geographic Information System Solution for Dynamic Spatio-Temporal Monitoring of Soil Water Status in Arboriculture. AgriEngineering 2024, 6, 724-753. https://doi.org/10.3390/agriengineering6010042
Ennatiqi L, Bouziani M, Yaagoubi R, Kenny L. Soqia: A Responsive Web Geographic Information System Solution for Dynamic Spatio-Temporal Monitoring of Soil Water Status in Arboriculture. AgriEngineering. 2024; 6(1):724-753. https://doi.org/10.3390/agriengineering6010042
Chicago/Turabian StyleEnnatiqi, Lahoucine, Mourad Bouziani, Reda Yaagoubi, and Lahcen Kenny. 2024. "Soqia: A Responsive Web Geographic Information System Solution for Dynamic Spatio-Temporal Monitoring of Soil Water Status in Arboriculture" AgriEngineering 6, no. 1: 724-753. https://doi.org/10.3390/agriengineering6010042
APA StyleEnnatiqi, L., Bouziani, M., Yaagoubi, R., & Kenny, L. (2024). Soqia: A Responsive Web Geographic Information System Solution for Dynamic Spatio-Temporal Monitoring of Soil Water Status in Arboriculture. AgriEngineering, 6(1), 724-753. https://doi.org/10.3390/agriengineering6010042