Article

Effects of Bicarbonate Addition and N:P Ratio on Microalgae Growth and Resource Recovery from Domestic Wastewater

by
Mariana Daniel Tango
,
José Antônio Zanetoni Filho
*,
Luiz Antonio Daniel
,
Luan de Souza Leite
,
Maria Teresa Hoffmann
and
Fellipe Henrique Martins Moutinho
Department of Hydraulics and Sanitation, São Carlos School of Engineering, University of São Paulo, Av. Trabalhador São-Carlense, 400, São Carlos 13566-59, São Paulo, Brazil
*
Author to whom correspondence should be addressed.
AgriEngineering 2023, 5(3), 1178-1195; https://doi.org/10.3390/agriengineering5030075
Submission received: 1 March 2023 / Revised: 6 June 2023 / Accepted: 22 June 2023 / Published: 4 July 2023

Abstract

:
Nutrient availability plays a crucial role in microalgae growth in domestic wastewater. In this study, we investigated the impact of different nitrogen and phosphorus ratios (5:1, 10:1, and 20:1, m∙m−1), and the addition of inorganic carbon on microalgae growth and nutrient uptake from domestic wastewater. Microalgae biomass achieved values ranging from 0.54 to 1.41 g·L−1. The cultivation process had maximum removal efficiencies of 83.7% for soluble chemical oxygen demand (sCOD), 74.0% for total Kjeldahl nitrogen (TKN), and 100.0% for ammonia (NH3) and orthophosphate (PO43−). All the NH3 and PO43− concentrations from domestic wastewater without supplementation were completely removed on the fourth day of cultivation. Moreover, no significant differences in microalgae growth, and NH3 and PO43− removals were observed between the conditions with and without nutrient supplementation on the fourth day of cultivation. This study has shown the feasibility of growing microalgae in domestic wastewater without any nutritional supplementation. Further investigations are required to check the long-term performance, energy requirements, and economic viability of this system for wastewater treatment and the production of nutrient-rich biomass for agricultural applications.

1. Introduction

Wastes are recognized as valuable sources of nutrients in the circular economy [1] and it has been estimated that 30% of imported phosphates in the European Union could be recovered from various sources, such as sewage sludge and biodegradable wastes [2]. Over the past decades, microalgae-based wastewater treatment systems have been extensively studied as an alternative to conventional municipal wastewater treatment [3]. These systems offer an environmentally friendly solution for the removal of carbon, nitrogen, and phosphorus from wastewater, and the biomass generated can be converted into high-value agricultural biofertilizers [2,4].
The availability of nutrients in the culture medium plays a crucial role in microalgal growth and poses a challenge for scaling up wastewater treatment processes [5,6]. Domestic wastewater (DWW) derived from centralized sanitation systems in Brazil is highly diluted, which can make it technically and economically impractical for microalgae cultivation [7]. As an alternative approach, Leite et al. (2019) [7] investigated the feasibility of blending DWW with piggery effluent to enhance the nutrient concentrations (carbon, nitrogen, and phosphorus) for microalgae cultivation. This study reported the successful production of 1.0 g·L−1 of Chlorella sorokiniana, accompanied by average removals of dissolved inorganic carbon, PO43−, and NH3 ranging from 46% to 56%, 40% to 60% and 100%, respectively.
Besides the nutrient availability, the efficiency of microalgae-based wastewater processes is often limited by the unbalanced carbon-to-nitrogen-to-phosphorus (C/N/P) ratio, for example, the ratio (100/25/12) of secondary effluent [8]. A well-balanced C/N/P ratio is required for microalgae growth and effective N and P removal from wastewater through assimilation [8], although it has received limited attention in previous studies. Choi and Lee (2015) [9] checked the effect of the N:P ratio (5 to 70) on Chlorella vulgaris cultivation in municipal wastewater. The optimum N/P ratio for biomass productivity and nutrient removal varied from 5 to 20, depending on the specific ecological conditions of the wastewater. These results oppose the traditional Redfield N:P ratio of 7.23:1 m∙m−1 [9], endorsing the need for optimizing the N:P for each wastewater type and microalgae species.
In this context, the direct application of DWW following preliminary treatments (screening and grit removal) is advantageous for wastewater treatment mediated by algae [9]. Therefore, it is essential to thoroughly investigate the nutrient removal and biomass production aspects specific to this type of effluent. In this study, we aim to assess the impact of different N/P ratios (5:1, 10:1, and 20:1 m∙m−1) and bicarbonate addition on biomass production and nutrient removal from DWW.

2. Materials and Methods

2.1. Biomass Production

The genus Chlorella is predominant in some cultivation systems using wastewater as a culture medium [7,10]. Microalgae Chlorella sorokiniana (strain CK) was chosen for this experiment because of its effective application for wastewater remediation and the production of value-added products [11,12].
Chlorella sorokiniana was cultivated in a modified M8a medium [13], as described by Leite et al. (2021) [14]. The microalgae were acclimated to domestic wastewater obtained from the Monjolinho Wastewater Treatment Plant (WWTP) in São Carlos, SP, Brazil. Sequential dilutions were performed over four weeks to gradually transition the microalgae from the culture medium to the wastewater. Subsequently, 1.25% (v·v−1) of this acclimated inoculum was utilized in the seven-day batch experiments.
Each photobioreactor (PBR) unit was equipped with an individual aeration system, consisting of a rotameter and needle valve for precise control. The distribution of air inside the reactor was achieved using a porous hose commonly used in fish farming, with an internal diameter of 16 mm and 5 mm thickness. The airflow rate was 10 L·min−1 for the volume of 40 L per unit. For each PBR, 16 tubular fluorescent lamps (8 on each side) of 40 W and 120 cm long were installed on a stainless-steel plate to increase the light intensity. A 12 h photoperiod was used with a light intensity of approximately 261.89 μmol·m−2·s−1 (14,156 lux). The inoculum added to all the PBRs at the beginning of each operation was obtained from the same PBR with the best biomass production.
For each batch, a volume of approximately 165 L DWW was collected from the full-scale Monjolinho WWTP. The samples were collected strictly at the same time for characterization in terms of pH, total alkalinity, partial alkalinity, TKN, total phosphorus (TP), and chemical oxygen demand (COD), according to APHA (2017) [15]. The evaluation of the cultivation was conducted in three stages as indicated in Figure 1. Stage 1 was performed in the month of February 2021, Stage 2 in June and July 2021, and Stage 3 in September 2021. The first stage corresponds to operations 1–3 (OPRs 1–3), with supplementation of N and P by the addition of NH4Cl and KH2PO4. The inorganic carbon was not added (i.e., no bicarbonate-NB). Four nutritional conditions (N:P) were analyzed: DWW without supplementation (negative control) (DWW—NB), 5:1 (5:1—NB), 10:1 (10:1—NB), and 20:1 (20:1—NB). The nitrogen concentration was the same (100.0 mg N·L−1) for all the N:P conditions (5:1, 10:1, and 20:1). The N:P ratios were selected based on a previous study [9].
In Stage 2, operations 4, 5, and 6 (OPRs 4–6) had supplementation of N, P, and inorganic carbon by the addition of NaHCO3 (i.e., with bicarbonate-WB). The nutritional conditions were: DWW without supplementation (negative control) (DWW—WB), 5:1 (5:1—WB), 10:1 (10:1—WB), and 20:1 (20:1—WB). The nitrogen concentration (100 mg N·L−1) and initial partial alkalinity of 400 mg CaCO3·L−1 were applied for the three conditions of N:P. For both Stages 1 and 2, 200 mL of samples were collected at the beginning and the end of each operation, strictly at the same time. In Stage 3, the best N:P ratio (TKN: total P) in terms of biomass production was evaluated with and without NaHCO3 supplementation (OPR 7). The evaluation was made using two PBRs, one of which added NaHCO3 (up to a concentration of, approximately, 400 mg CaCO3·L−1 in terms of partial alkalinity), while the other PBR was used with DWW without supplementation as a negative control. In this stage, 50 mL of samples were collected daily, strictly at the same time. All the samples were analyzed immediately.

2.2. Monitoring of Microalgae Growth and Wastewater Treatment

The analyses performed and their frequency are shown in Table 1. The temperature was measured daily by TMM Zurich. The DO and pH variables were measured at the end of the light period, according to APHA (2017) [15].
The microalgae development was monitored by absorbance at 530 and 680 nm (i.e., OD530 and OD680) using a spectrophotometer (DR 5000™, Hach®, Ames, Iowa, USA), chlorophyll-a [18,19], and DW [7].
Samples were fixed in 1% acetic Lugol and kept in amber glass vials for subsequent analysis. The identification of the microalgae genus and species was conducted according to Bicudo and Menezes (2017) [22], and Oliveira (2015) [23], respectively. It was based on the morphometric characteristics of population samples (n = 30).
The counts for cell density (cells·mL−1) in each sample were performed in a Fuchs–Rosenthal chamber for each square (ranging from 2 to 8 cells). The estimation of the cell density was performed using a trinocular optical microscope (BX51, Olympus®) with a photographic camera attached (Roper ScientificTM). The Image-Pro Plus v.7.0 software was used to obtain the cell measurements.
The counting error (e, %) with a confidence limit of 95% was calculated based on the total number of cells counted in the sample (N), according to Equation (1).
e = 2 N ( 100 )
The cell volume (V, µm3) was calculated using Equation (2) with the information on the cell diameter (d, µm) and length (l, µm) obtained according to the criteria reported previously [20,21].
V = π 6 d 2 l
The volume correction was made to determine the real nutrient concentrations in the reactors considering the evaporation effect. The samples were filtered into 0.45 µm membranes before the analysis of the sCOD, PO43−, NH3, NO3, and NO2. All the analyses were made in triplicate and the nutrient removal efficiency was determined.

2.3. Statistical Analyses

All the results were expressed by the mean and standard deviation. The one-way ANOVA and Tukey test were used to compare the efficiencies obtained for each condition tested. The statistical analyses were performed with a significance level of 0.05 using the OriginPro software (OriginLab Corp., Northampton, MA, USA).

3. Results and Discussion

3.1. Inoculum Characterization

The characteristics of the inoculum added in each operation are shown in Table S1. The dominance of Pectinodesmus pectinatus (P. pectinatus), formerly Scenedesmus pectinatus, of 90–100% was observed in all samples, despite the cultivation operations being performed in different seasons of the year. The other species that appeared sporadically in the samples were: Desmodesmus communis, Navicula sp., and Chlorella vulgaris. Although Chlorella sorokiniana has been previously acclimated to the effluent used as inoculum for this research, its cultivation in non-sterile systems is susceptible to contamination by wild strains unless additional means of control are utilized [24]. Therefore, the predominance of Pectinodesmus pectinatus in our inoculum is probably due to its natural presence in the domestic wastewater used in our work. Our study did not control the microalgae species to simulate the conditions when microalgae are applied to treat wastewater at a large scale, which is impossible to control.
The cell density reported was 1.12–1.32 × 10⁵ cell·mL−1 for Stage 1, 0.29 × 10⁵ cell·mL−1 for Stage 2, and 9.78 × 10⁵ cell·mL−1 for Stage 3. The lowest values of cell density and dry weight were observed in OPR 6. The ratio between the OD680 and OD530 is an indicator of the chlorophyll-a per cell and the values lower than 1.0 suggest inhibition of chlorophyll-a synthesis by the microalgae cells. All the values were above unity (1.05–1.35), which indicates that all the inoculums used were healthy.

3.2. Microalgae Cultivation

Most microalgae species have an optimum growth range between 20 and 30 °C and a light intensity between 33 and 400 µmol·m−2·s−1 [25]. The light intensity applied in this study was approximately 261.9 μmol·m−2·s−1 for all the PBRs. Furthermore, the temperature during the cultivation varied according to the seasons of the year in which they were performed: summer (31.35 ± 1.45 °C, Stage 1), winter (26.04 ± 1.80 °C, Stage 2), and spring (34.08 ± 2.08 °C, Stage 3), however, the values were within the optimal growth range for P. pectinatus (10 to 37 °C) [26].
The same DO trend was observed in all nutrient conditions in Stages 1 and 2: an increase until 72 h, followed by a decrease until 96 h, and a new increase until the end of the operation (Figure 2c). The increase in DO in the first hours of cultivation indicates the increment of photosynthetic activity by the microalgae population, since the aeration rate was the same in all the PBRs [27]. The following oscillations are typical of mixotrophic cultures during the photoperiod. Besides respiration, oxidation of NH3 to NO3 and of NO3 to NO2 may also consume the DO in the medium [28].
No significant differences in DO concentration were observed between the N:P ratios at each stage. The average concentrations reached up to 15.6 ± 0.9 mg·L−1 of DO (DWW-WB) in Stage 2, a value that exceeds 2.5 mg·L−1 of DO, the corresponding nutrient treatment verified in Stage 1 (DWW-NB). A similar relationship was reported previously for the performance of high-rate algae ponds with and without the supplementation of inorganic carbon [29]. The author verified a higher DO concentration in ponds with CO2 supplementation.
Abiotic factors, such as temperature, also affect the concentration of DO in the medium. In general, the higher the temperature, the lower the solubility of oxygen in water, which results in a lower concentration of DO. This was observed in Stages 1 and 2 of the present study: the lowest mean DO concentrations were found during the stage with the highest mean temperature (Stage 1), and the lowest mean DO concentrations were observed during the stage with the lowest mean temperature (Stage 2).
The negative controls (DWW-NB and DWW-WB) had the lowest alkalinity consumption (Figure 3). In Stage 1, the DWW-NB showed removal of total and partial alkalinity of 34.1% and 22.2%, respectively. In Stage 2, the DWW-WB had removal of total and partial alkalinity of 43.4% and 39.6%, respectively. The nutritional adjustments, 5:1, 10:1, and 20:1, in Stage 1 resulted in the highest total (76.6, 91.2, and 98.3%, respectively) and partial (99.8, 95.9, and 99.6%, respectively) alkalinity reductions, resulting in a pH decrease to values of 3.7, 6.0, and 4.5, respectively, after 168 h of cultivation. In Stage 2, the same nutritional conditions resulted in total alkalinity reductions of 75.7, 81.7, and 80.4% (respectively for 5:1, 10:1, and 20:1) and partial alkalinity of 75.9, 83.4, and 78.1% (respectively for 5:1, 10:1, and 20:1), which maintained pH at higher values (8.1, 7.3, and 8.3, respectively, for 5:1, 10:1, and 20:1) than those observed in Stage 1 (Figure 2). The alkalinity consumption is a result of the use of bicarbonate (HCO3) as a source of inorganic carbon for photosynthesis. The HCO3 is converted into CO2 by intracellular enzymes of carbonic anhydrase and there is a consequent release of OH into the medium [25], which justifies the increase in pH at the beginning of the operations (Figure 2).
During Stage 1, the pH of treatments 5:1, 10:1, and 20:1 had an ascending behavior until 24 h (probably because of photosynthetic activity), and then presented a decreasing profile, with some oscillations in the decline until the end of the operation. The highest pH values were observed in the negative control (DWW-WB) and the 20:1-WB nutritional condition in Step 2, reaching 9.8 and 9.4, respectively (Figure 2). The bicarbonate addition kept the pH relatively constant in Stage 2 for all testing conditions.
No considerable difference was observed between the treatment without and with bicarbonate during Stage 3 for pH, DO, and temperature. The total alkalinity concentration without NB and WB were 245.2 ± 64.4 mg CaCO3·L−1 and 377.5 ± 82.0 mg CaCO3·L−1, respectively. The partial alkalinity concentrations of NB and WB were 193.7 ± 47.3 mg CaCO3·L−1 and 315.7 ± 66.8 mg CaCO3·L−1, respectively. The behavior of these conditions differed mainly at the end of the operation. The total and partial alkalinity decreased from 120 h for NB, while there was an exponential increase in these variables from 144 h for WB.

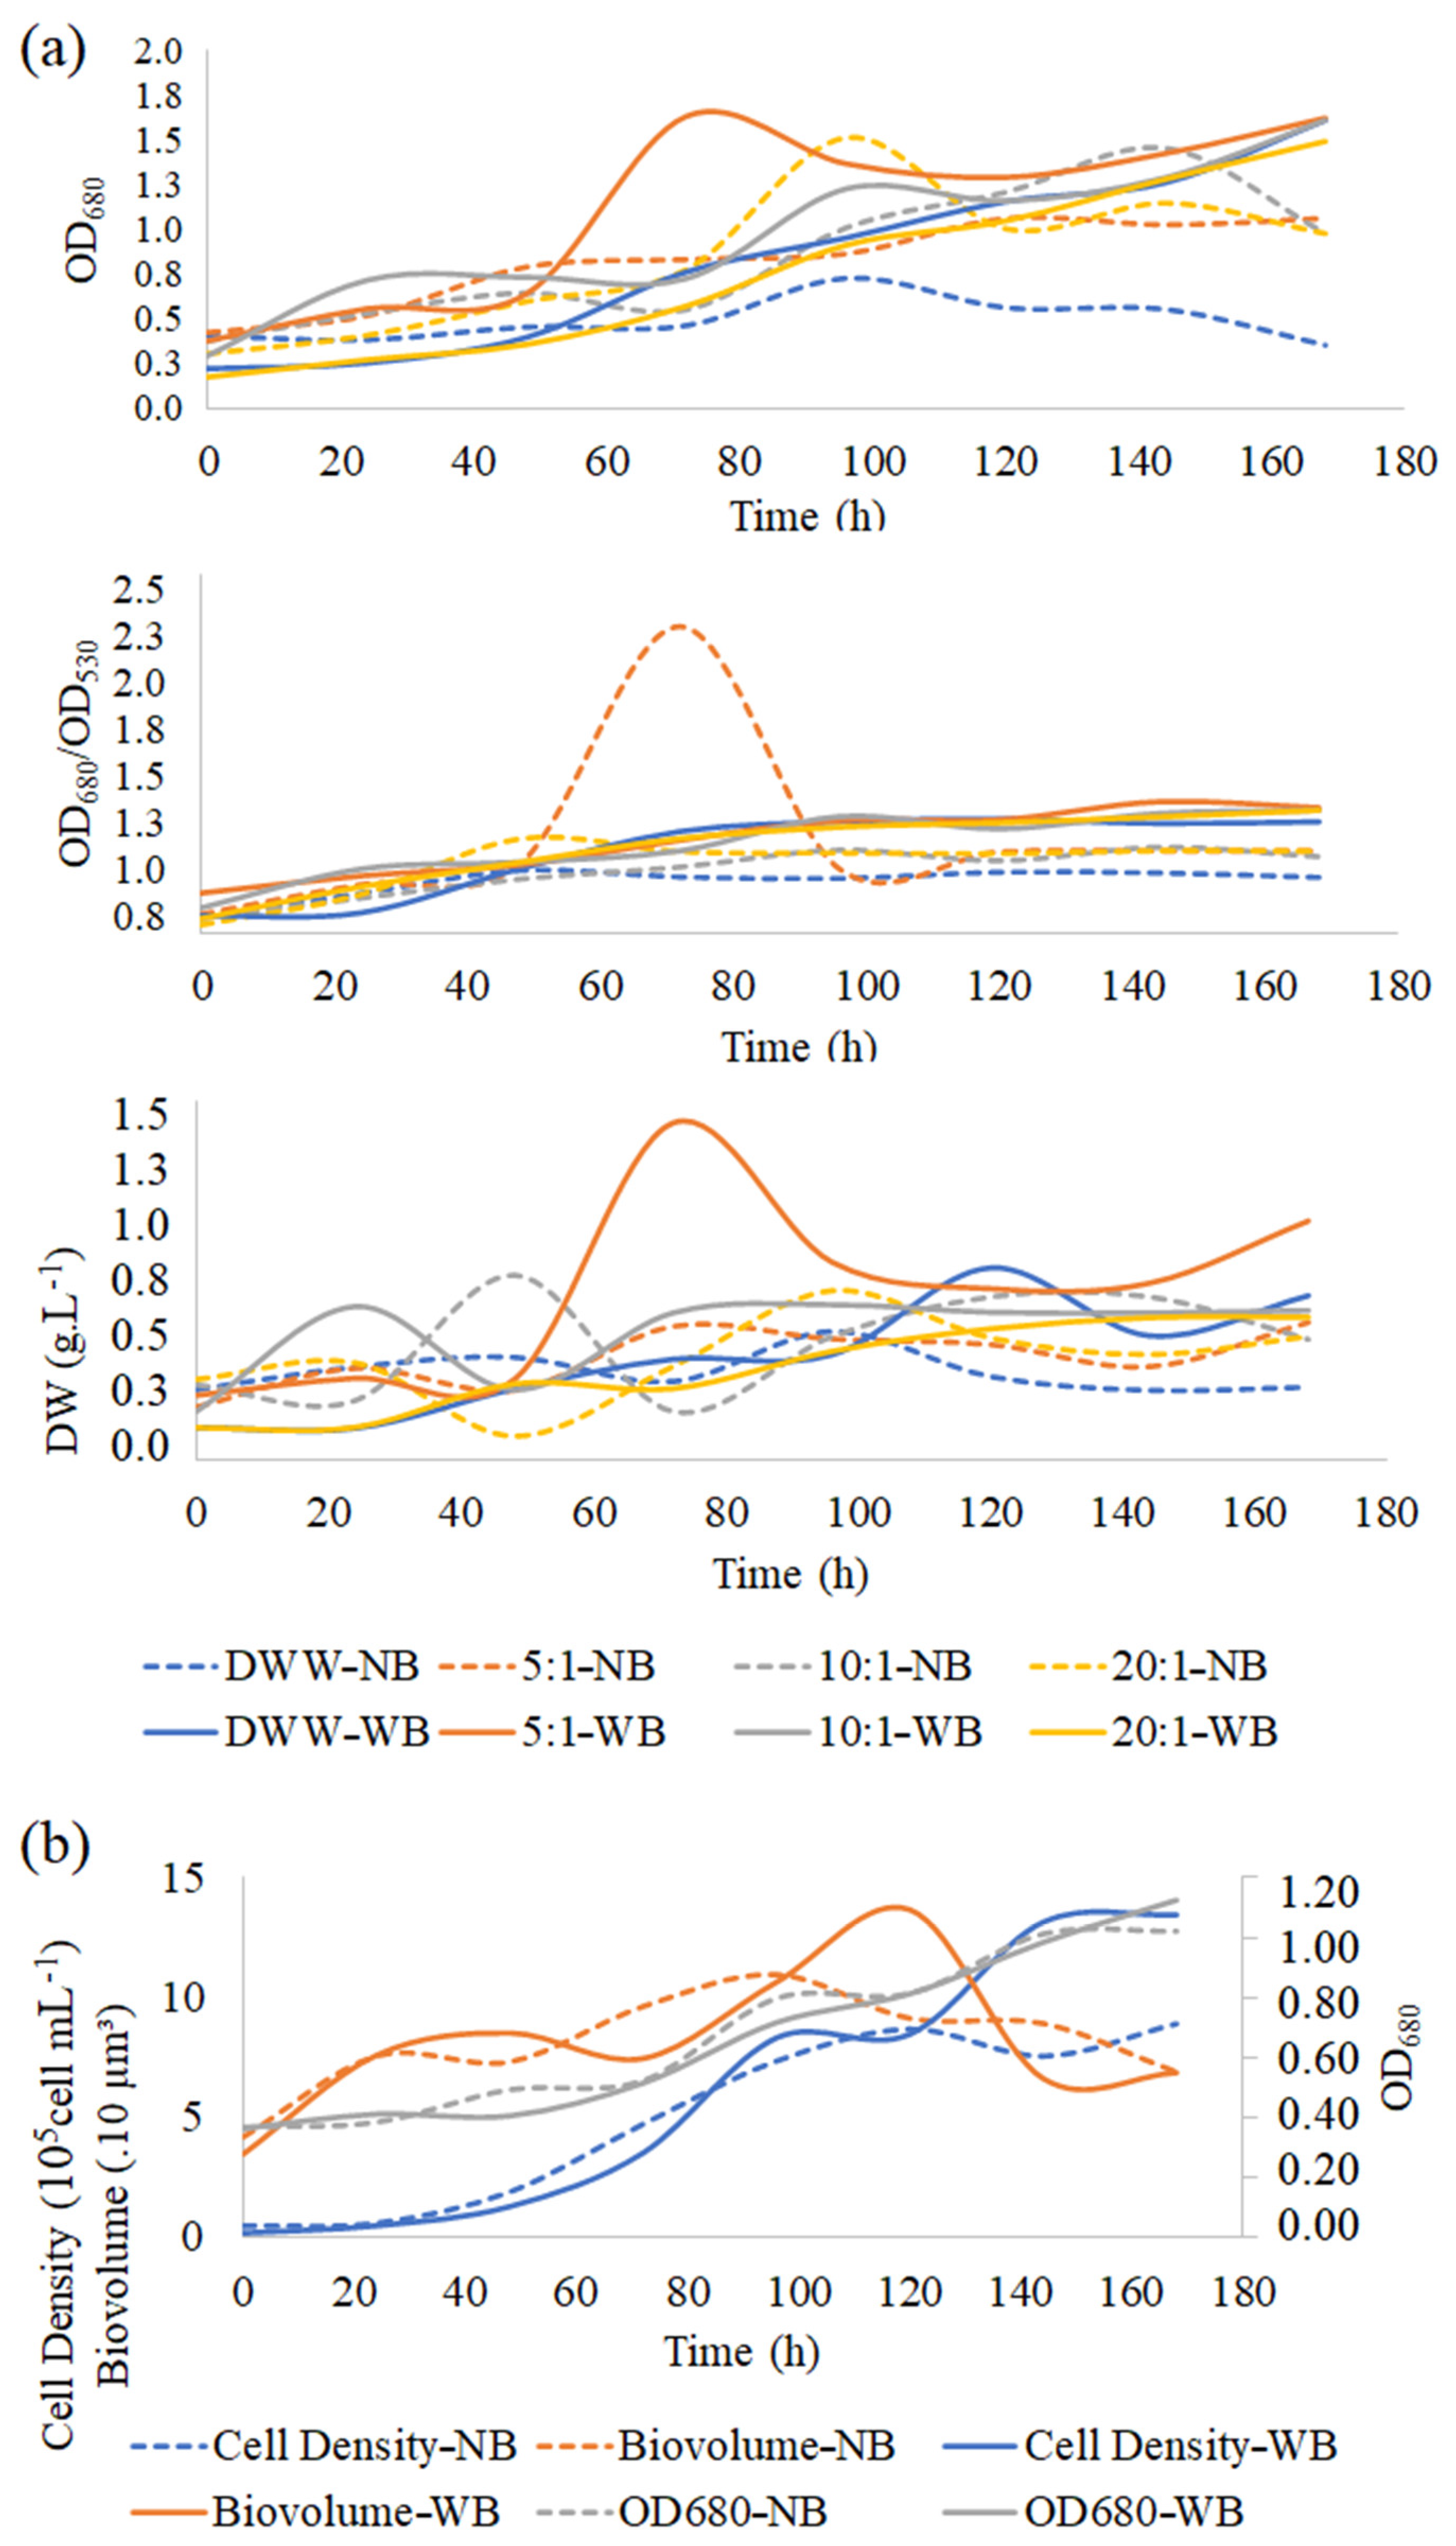
3.3. Microalgae Growth

The microalgae growth was evaluated by the OD680, OD680/OD530, and DW in Stages 1 and 2; and the cell density, biovolume, and OD680 during the operations of Stage 3 (Figure 4).
The highest DO680 (1.63) was found in the 5:1-WB condition. There was a trend of increasing OD680 until 100 h in Stages 1 and 2. After this point, the cultures supplemented with NaHCO3 continued to increase OD680. However, the cultures without NaHCO3 supplementation tended to decline until the end of the batch, except for the 5:1-NB condition. This suggests that longer periods of cultivation with NaHCO3 supplementation should be evaluated. This result is consistent with previous studies [30,31].
No significant differences were observed in terms of the OD680 between the treatments (p > 0.05, Table 2). The OD680/OD530 values remained above 1.0 from 48 to 168 h in Stages 1 and 2. In general, the WB showed higher values than the NB cultivations.
A distinct behavior was observed for the DW in the 5:1-WB compared to the other conditions. It reached a higher value at 72 h of cultivation, corresponding to 1.41 g·L−1 or a productivity of 0.47 g·L−1·d−1. No significant differences (p > 0.05) were found in terms of the DW between the conditions with NB (Table 2). The same was observed for the WB (Table 2), despite the higher biomass production.
These findings contrast with previous studies that identified an optimal N:P ratio. Choi and Lee (2017) [9] found the best N:P ratio of 10:1 for Chlorella vulgaris cultivation in municipal wastewater, reaching 2.97 g∙L−1∙d−1 of biomass productivity, while Arbib et al. (2013) [32] observed maximum biomass productivity (0.32 g L−1∙d−1) at an N:P ratio of 13:1 for Scenedesmus obliquus cultivation in wastewater.
In Stage 3 (Figure 4), the WB showed 5.55 ± 3.71 × 10⁵ cell·mL−1 for cell density, 7.76 ± 2.21 × 10 µm3 for biovolume, and 0.71 ± 0.27 for OD680, while the NB showed 6.55 ± 5.25 × 10⁵ cell·mL−1 for cell density, 7.78 ± 3.01 × 10 µm3 for biovolume, and 0.70 ± 0.28 for OD680. No significant differences (p > 0.05) were observed between the WB and NB for OD680. The addition of NaHCO3 did not result in a considerable difference in these variables. It is common to find different results about the effect of inorganic carbon addition in the literature [33,34]. In this case, there is no reason for supplementation, which is more advantageous from the perspective of cost and operational simplicity in microalgae-based systems.

3.4. Wastewater Treatment Monitoring
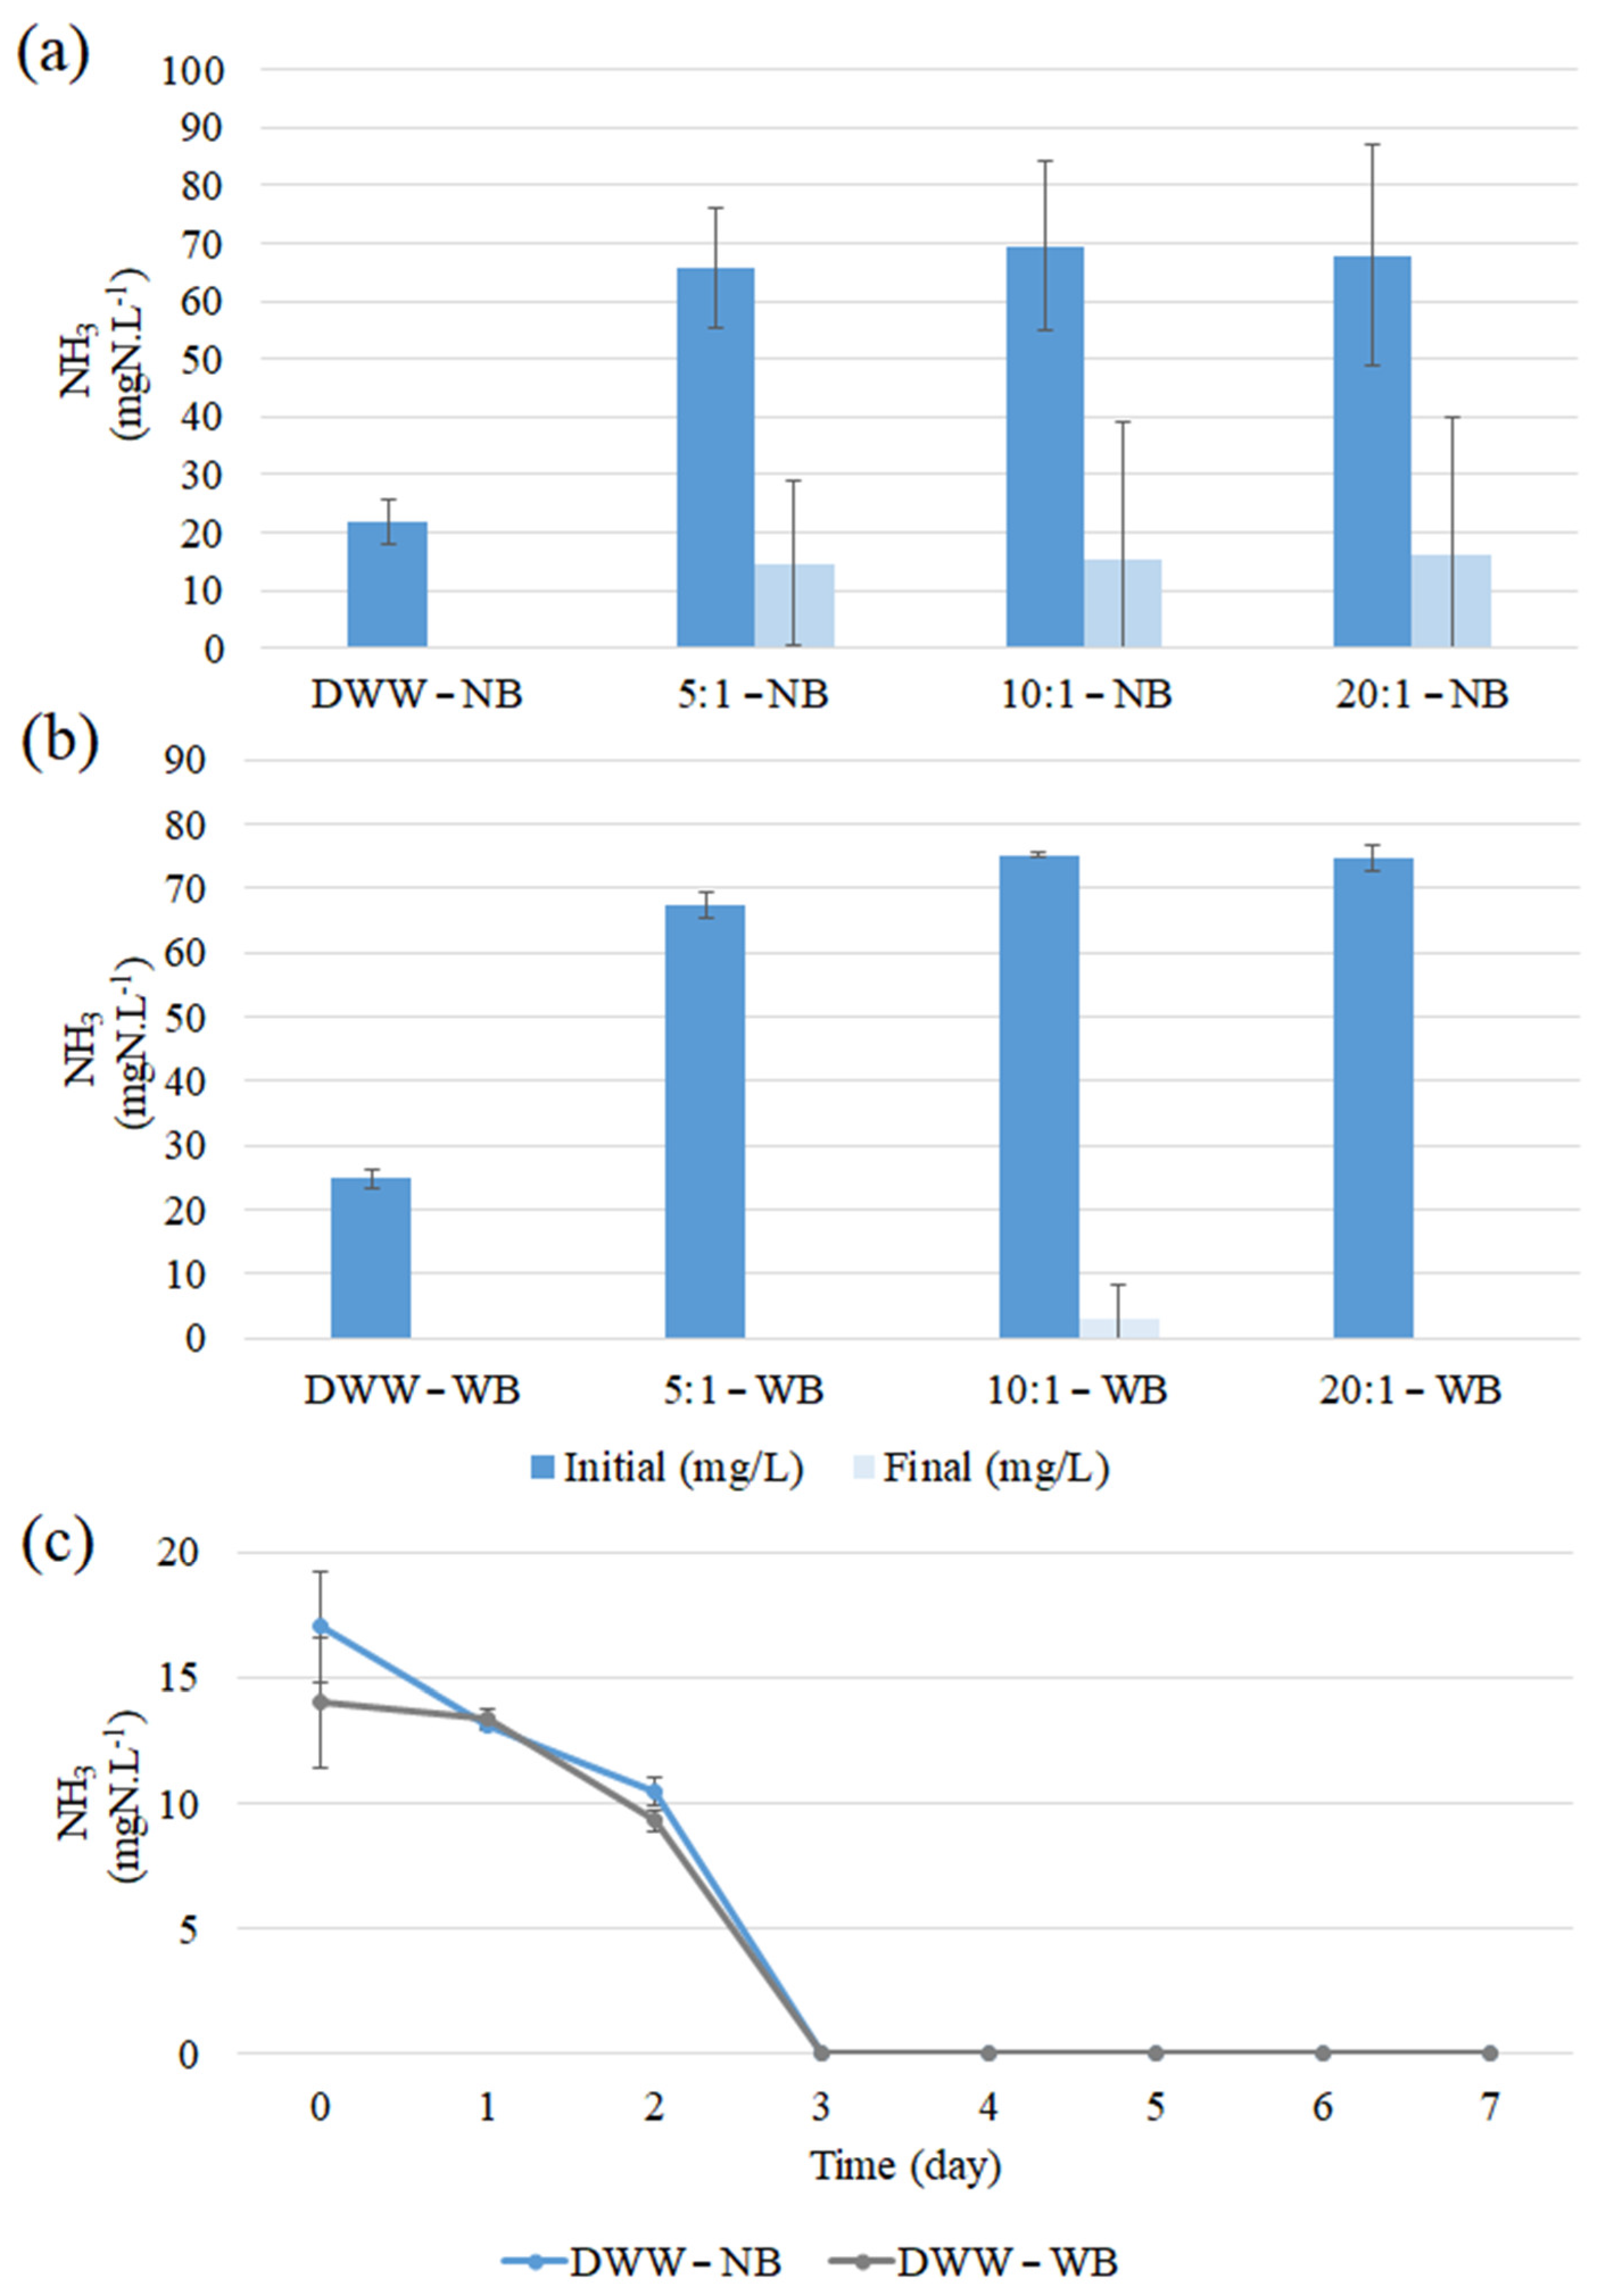
3.4.1. Nitrogen

The TKN removals were 74.0 ± 32.1%, 52.8 ± 18.3%, 46.8 ± 17.9%, and 42.5 ± 21.9% for DWW-NB, 5:1-NB, 10:1-NB, and 20:1-NB in Stage 1, respectively (Figure S1). The TKN removals were 63.0 ± 21.0%, 68.6 ± 9.0%, 72.1 ± 7.5%, and 70.1 ± 6.5% for DWW-WB, 5:1-WB, 10:1-WB, and 20:1-WB in Stage 2, respectively.
Different testing conditions showed total NH3 removal (DWW-NB, DWW-WB, 5:1-WB, and 20:1-WB, Figure 5), while the removals for the other conditions varied from 79.6 to 96% (Table 2). These values are in accordance with the removals previously reported in the literature for different N:P ratios. Alketife et al. (2017) [35] found a complete nitrogen removal using an N:P ratio of 10:1 for C. vulgaris cultivation in synthetic wastewater. Regarding N removal, Arbib et al. (2013) [32] reported an optimal N:P molar ratio of 9:1, which achieved a 95% efficiency for S. obliquus cultivation in pretreated urban wastewater. Furthermore, the results found endorse the expressive capacity of Pectinodesmus sp. for removing nitrogen in domestic wastewater, as observed in previous studies [36,37].
No significant differences (p > 0.05) were observed for TKN and NH3 (Table 2) concentrations between the treatments 5:1, 10:1, 20:1, and the negative control in Stages 1 and 2. The differences observed between earlier studies and the present study can be attributed to various factors that have an impact on microalgae growth and nutrient removal, such as the microalgae species [38], initial nutrient concentration, physicochemical properties (e.g., pH, temperature and nutrient concentration), and other growth conditions (e.g., light and CO2) [39]. Similar to Lu et al. (2021) [40], total NH3 removal was observed for the WB and NB in Stage 3 (Figure 5c), with a mean pH of 9.2 ± 0.6 (NB) and 9.4 ± 0.6 (WB). No relevant differences were observed between the NB and WB for TKN (Figure S1) and NH3 (Figure 5).
The decay of ammonia and, consequently, TKN can occur due to nitrogen transformations (e.g., ammonia oxidation, volatilization, and nitrification) in the reactors and the uptake by microalgae [34]. Microalgae preferentially assimilate nitrogen in the ammonia form, due to the lower metabolic expenditure in the process, when compared to other inorganic nitrogen sources, such as nitrite (NO2) and nitrate (NO3). The environmental conditions for the cultivation (pH > 9.0, aeration, and temperature of 20–25 °C) favor the volatilization of ammonia, causing indirect nitrogen removal [7,40]. The NH3 oxidation reaction and nitrification reaction are carried out by ammonia-oxidizing bacteria and nitrite-oxidizing bacteria, respectively. The activity of the bacteria can be affected by the environmental conditions (temperature, pH, and DO) and it can allow the NO3 accumulation [41]. In Stage 1 and 2, a considerable nitrification process is happening and concentrations up to 10.14 ± 0.15 mg N∙L−1 of NO2 (10:1-WB, in Stage 2, Figure S2) and 19.72 ± 7.44 mg N∙L−1 of NO3 (10:1-NB, in Stage 1, Figure 6) were reported during the cultivation period. These processes can occur simultaneously, and it is challenging to accurately specify their contribution to nitrogen removal.
Significant differences (p < 0.05) were found for the nitrate concentration (Figure 6, Table 2) among the 5:1, 10:1, 20:1, and DWW-NB in Stage 1. Nitrate increased in all testing conditions in Stage 1, showing maximum final concentrations of 19.72 ± 7.44 and 9.13 ± 5.18 mg N·L−1 for 5:1-NB and 20:1-NB, respectively. The nitrate concentration increased in all N:P treatments in Stage 2, showing final concentrations of 6.33 ± 3.94 and 5.22 ± 6.64 mg N·L−1 for 10:1-WB and 5:1-WB, respectively, but there was no significant difference among the treatments in Stage 2.
No significant differences (p > 0.05) were observed in the nitrite concentration (Figure S2, Table 2) between 5:1-NB, 10:1-NB, 20:1-NB, and DWW-NB in Stage 1. The nitrite increased in all testing conditions in Stage 1, showing final concentrations of 6.83 ± 5.79 and 2.27 ± 2.33 mg N·L−1 for 10:1-NB and 20:1-NB, respectively. However, in Stage 2, there was a significant difference (p < 0.05) observed among the treatments DDW-WB, 5:1-WB, 10:1-WB, and 20:1-WB, showing final concentrations of 0.20 ± 0.04 mg N·L−1, 7.04 ± 4.88 mg N·L−1, 10.14 ± 0.15 mg N·L−1 and 2.54 ± 0.63 mg N·L−1, respectively.
The results suggest that nitrogen supplementation (Stages 1 and 2) favored nitrification, however, the differences between the operations with N supplementation and DWW are not significant (p > 0.05). Besides that, bicarbonate addition did not impact the nitrification process in Stage 3 and the nitrite and nitrate concentrations in DWW-NB and DWW-WB are not significantly different (p > 0.05).

3.4.2. Orthophosphate
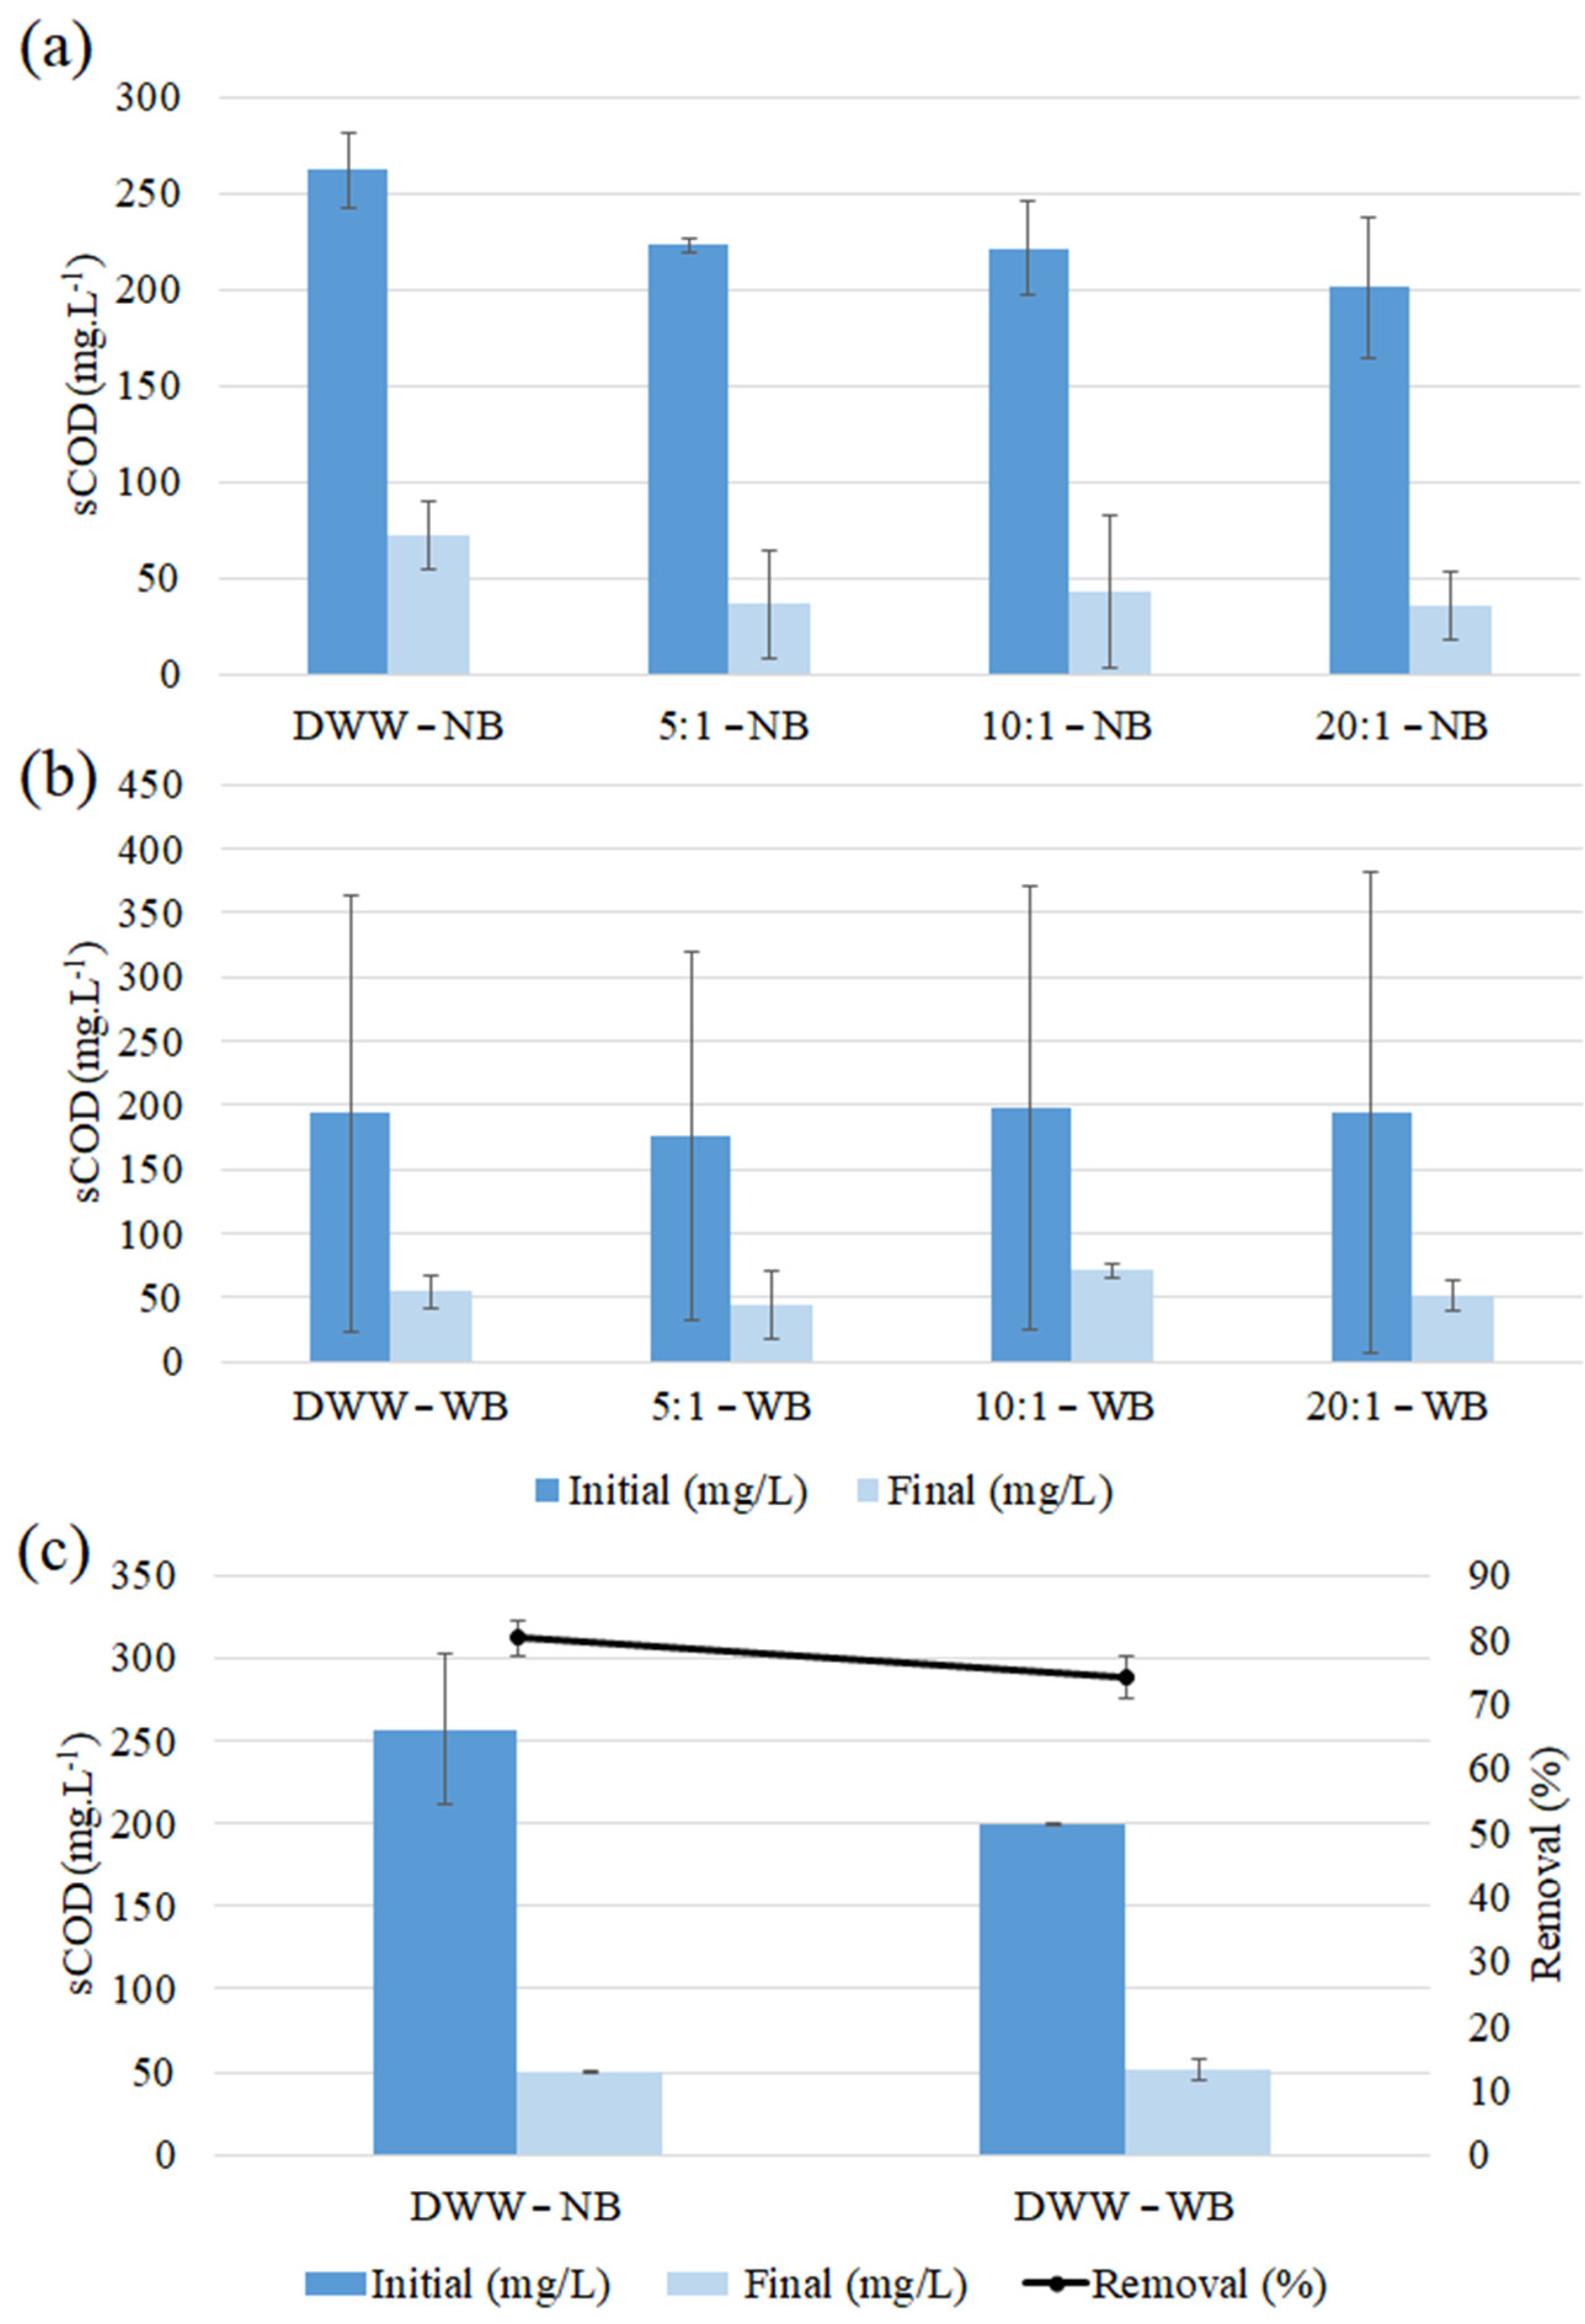
The highest removals of PO43− (Figure 7) in Stage 1 were 94.08 ± 9.16 and 100.00 ± 0.00% for the DWW-NB and 20:1-NB, respectively. The 5:1-NB and 10:1-NB had removals of 1.98 ± 9.65% and 5.13 ± 24.53%, respectively. While the highest removals in Stage 2 were 97.46 ± 3.99% and 98.33 ± 2.58% for the DWW-WB and 20:1-WB, respectively. The 5:1-NB and 10:1-NB had removals of 1.98 ± 9.65% and 5.13 ± 24.53%, respectively. The 10:1-WB had a removal of 73.32 ± 21.78%, while the 5:1-WB had an increment of 30.59 ± 162.25%. No significant differences were found for orthophosphate removal in Stage 2 (p > 0.05, Table 2).
In general, these values are in agreement with the removals previously reported in the literature using different N:P ratios [42]. Delgadillo-Mirquez et al. (2016) [43] reported a PO43− removal of 100% using an N:P of 17:1 after 100–150 h of cultivation in municipal primary wastewater, using a high rate algal pond. Choi and Lee (2015) [9] found total phosphorus removal of over 80% until the N:P ratio reaches a value of 1:20, while the removal decreased significantly for higher N:P values. In our studies, the best removals were obtained for DWW-NB (94.1%), DWW-WB (97.5%), 20:1-NB (100%), and 20:1-WB (98.3%).
In Stage 1, the phosphate removal resulting from the DWW-NB and 20:1-NB treatments were statistically similar, while the phosphate removal from the 5:1-NB and 10:1-NB treatments were also statistically similar (p > 0.005, Table 2). No significant differences were found for the PO43− removal in Stage 2 (p > 0.05, Table 2).

3.4.3. sCOD

The sCOD removals (Figure 8) were 72.09 ± 7.99, 83.65 ± 12.52, 81.39 ± 15.96, and 81.67 ± 10.64% for DWW-NB, 5:1-NB, 10:1-NB, and 20:1-NB, respectively. While the sCOD removal efficiencies were 45.20 ± 35.06, 41.39 ± 50.25, 19.53 ± 59.20, 35.21 ± 47.33% for DWW-WB, 5:1-WB, 10:1-WB, and 20:1-WB in Stage 2. No significant differences were found between all testing conditions in Stages 1 and 2 (p > 0.05). In Stage 3, the removal of 80.14 ± 2.70 and 74.01 ± 3.32% were reported for DWW-WB and DWW-NB, respectively. No significant differences (p > 0.05) were observed between these treatments. These results are consistent with the ones previously reported in the literature for domestic/municipal wastewater [28,44].

4. Conclusions

In this study, different ratios of nitrogen and phosphorus (DWW, 5:1, 10:1, and 20:1) and the addition of inorganic carbon were evaluated for microalgae growth and nutrient uptake. Microalgae growth reached DW values ranging from 0.54 to 1.41 g·L−1. The cultivation process had maximum removals of 87.7, 74.0, 100.0, and 100.0% for sCOD, TKN, NH3, and PO43−, respectively. All the NH3 and PO43− concentrations from DWW without supplementation were completely removed on the fourth day of cultivation. Moreover, no significant differences in the microalgae growth were observed between the conditions with and without supplementation on the fourth day of cultivation. Similarly, no significant differences in the removal of NH3 and PO43− were observed between the conditions tested throughout the entire cultivation period. In our study, the supplementation of nitrogen, phosphorus, and bicarbonate did not significantly change the microalgae growth, showing the feasibility of cultivating microalgae in domestic wastewater.

Supplementary Materials

The following supporting information can be downloaded at: https://www.mdpi.com/article/10.3390/agriengineering5030075/s1.

Author Contributions

M.D.T.: Methodology, data compilation, analysis, investigation, writing (original draft). J.A.Z.F.: Methodology, data compilation, analysis, investigation, writing (original draft). L.A.D.: Methodology, project administration, resources, supervision, funding acquisition and writing (review and edit). L.d.S.L.: Methodology, data analysis and writing (review and edit). M.T.H.: Data analysis and writing (review and edit). F.H.M.M.: Data analysis and writing (review and edit). All authors have read and agreed to the published version of the manuscript.

Funding

This research was funded by the São Paulo Research Foundation (FAPESP) (Proc. 2018/23878-5), and the Coordination for the Improvement of Higher Education Personnel—Brazil (CAPES) (Finance Code 001).

Data Availability Statement

The data that support the findings of our study are available from the corresponding author, upon reasonable request.

Acknowledgments

The authors would like to thank the SAAE São Carlos (SP, Brazil) for providing access to its facilities, during the execution of this work.

Conflicts of Interest

The authors declare that they have no known competing financial interests or personal relationships that could appear to influence the work reported in this paper.

References

  1. Drosou, F.; Kekes, T.; Boukouvalas, C.L. Life cycle assessment of the canned fruits industry: Sustainability through waste valorization and implementation of innovative techniques. AgriEngineering 2023, 5, 395–412. [Google Scholar] [CrossRef]
  2. Álvarez-González, A.; Uggetti, E.; Serrano, L.; Gorchs, G.; Escolà Casas, M.; Matamoros, V.; Gonzalez-Flo, E.; Díez-Montero, R. The potential of wastewater grown microalgae for agricultural purposes: Contaminants of emerging concern, heavy metals and pathogens assessment. Environ. Pollut. 2023, 324, 121399. [Google Scholar] [CrossRef] [PubMed]
  3. Passos, F.; Gutiérrez, R.; Uggetti, E.; Garfí, M.; García, J.; Ferrer, I. Towards energy neutral microalgae-based wastewater treatment plants. Algal Res. 2017, 28, 235–243. [Google Scholar] [CrossRef] [Green Version]
  4. Hussain, F.; Shah, S.Z.; Ahmad, H.; Abubshait, S.A.; Abubshait, H.A.; Laref, A.; Manikandan, A.; Kusuma, H.S.; Iqbal, M. Microalgae an ecofriendly and sustainable wastewater treatment option: Biomass application in biofuel and bio-fertilizer production. A review. Renew. Sustain. Energy Rev. 2021, 137, 110603. [Google Scholar] [CrossRef]
  5. Chen, G.; Zhao, L.; Qi, Y. Enhancing the productivity of microalgae cultivated in wastewater toward biofuel production: A critical review. Appl. Energy 2015, 137, 282–291. [Google Scholar] [CrossRef]
  6. Chew, K.W.; Chia, S.R.; Show, P.L.; Yap, Y.J.; Ling, T.C.; Chang, J.-S. Effects of water culture medium, cultivation systems and growth modes for microalgae cultivation: A review. J. Taiwan Inst. Chem. Eng. 2018, 91, 332–344. [Google Scholar] [CrossRef]
  7. Leite, L.D.S.; Hoffmann, M.T.; Daniel, L.A. Microalgae cultivation for municipal and piggery wastewater treatment in Brazil. J. Water Process Eng. 2019, 31, 100821. [Google Scholar] [CrossRef]
  8. Gao, P.; Guo, L.; Zhao, Y.; Jin, C.; She, Z.; Gao, M. Enhancing microalgae growth and product accumulation with carbon source regulation: New perspective for the coordination between photosynthesis and aerobic respiration. Chemosphere 2021, 278, 130435. [Google Scholar] [CrossRef]
  9. Choi, H.J.; Lee, S.M. Effect of the N/P ratio on biomass productivity and nutrient removal from municipal wastewater. Bioprocess Biosyst. Eng. 2015, 38, 761–766. [Google Scholar] [CrossRef]
  10. Hong, J.W.; Kim, O.H.; Jo, S.W.; Cho, H.W.; Yoon, H.S. Mass Cultivation from a Korean Raceway Pond System of Indigenous Microalgae as Potential Biofuel Feedstock. Oil Gas Res. 2016, 2, 108. [Google Scholar]
  11. Rani, S.; Ojha, C.S.P. Chlorella sorokiniana for integrated wastewater treatment, biomass accumulation and value-added product estimation under varying photoperiod regimes: A comparative study. J. Water Process Eng. 2021, 39, 101889. [Google Scholar] [CrossRef]
  12. Leite, L.S.; Daniel, L.A. Optimization of microalgae harvesting by sedimentation induced by high pH. Water Sci. Technol. 2020, 82, 1227–1236. [Google Scholar] [CrossRef]
  13. Jánoska, A. A Liquid Foam-Bed Photobioreactor for Microalgae Production; Wageningen University and Research: Wageningen, The Netherlands, 2018. [Google Scholar]
  14. Leite, L.D.S.; Hoffmann, M.T.; De Vicente, F.S.; Dos Santos, D.V.; Daniel, L.A. Adsorption of algal organic matter on activated carbons from alternative sources: Influence of physico-chemical parameters. J. Water Process Eng. 2021, 44, 102435. [Google Scholar] [CrossRef]
  15. APHA. Standard Methods for the Examination of Water and Wastewater, 23rd ed.; Water Environment Federation: Washington, DC, USA, 2017. [Google Scholar]
  16. Riccio, G.; De Luca, D.; Lauritano, C. Monogalactosyldiacylglycerol and Sulfolipid Synthesis in Microalgae. Mar. Drugs 2020, 18, 237. [Google Scholar] [CrossRef]
  17. Phinyo, K.; Pekkoh, J.; Peerapornpisal, Y. Distribution and ecological habitat of Scenedesmus and related genera in some freshwater resources of Northern and North-Eastern Thailand. Biodiversitas J. Biol. Divers. 2017, 18, 1092–1099. [Google Scholar] [CrossRef]
  18. NEN 6520:1981; Water: Spectrofotometrische Bepaling van Het Gehalte aan Chlorofyl-a. Nederlands Normalisatie Instituut: Delft, The Netherlands, 1981.
  19. Nush, E. Comparison of differents methods for chlorophyll and phaeropigments determination. Arch. Hydrobiol. 1980, 4, 14–36. [Google Scholar]
  20. Hillebrand, H.; Dürselen, C.D.; Kirschtel, D.; Pollingher, D.; Zohary, T. Biovolume calculation for pelagic and benthic microalgae. J. Phycol. 1999, 35, 403–424. [Google Scholar] [CrossRef]
  21. Fonseca, B.M.; Ferragut, C.; Tucci, A.; Crossetti, L.O.; Ferrari, F.; Bicudo, D.d.C.; Sant’Anna, C.L.; Bicudo, C.E.d.M. Biovolume de cianobactérias e algas de reservatórios tropicais do Brasil com diferentes estados tróficos. Hoehnea 2014, 41, 9–30. [Google Scholar] [CrossRef] [Green Version]
  22. Bicudo, C.E.D.M.; Menezes, M. Gêneros de Algas de Águas Continentais do Brasil (Chave Para Identificação e Descrições), 3rd ed.; RiMa: São Carlos, Brazil, 2017. [Google Scholar]
  23. Oliveira, R.S. Família Scenedesmaceae (Chlorophyceae, Sphaeropleales) no Estado de Goiás: Biodiversidade e distribuição geográfica; Universidade Federal de Goiás: Goiânia, Brazil, 2015. [Google Scholar]
  24. Lage, S.; Toffolo, A.; Gentili, F.G. Microalgal growth, nitrogen uptake and storage, and dissolved oxygen production in a polyculture based-open pond fed with municipal wastewater in northern Sweden. Chemosphere 2021, 276, 130122. [Google Scholar] [CrossRef]
  25. Leite, L.S.; Daniel, L.A. Microalgae Production Integrated with the Wastewater Treatment: A Management Approach. Cost-efficient Wastewater Treatment Technologies. In The Handbook of Environmental Chemistry; Nasr, M., Negm, A.M., Eds.; Springer: Cham, Switzerland, 2022; Volume 117. [Google Scholar] [CrossRef]
  26. Singh, S.P.; Singh, P. Effect of temperature and light on the growth of algae species: A review. Renew. Sustain. Energy Rev. 2015, 50, 431–444. [Google Scholar] [CrossRef]
  27. Assemany, P.P.; Calijuri, M.L.; Tango, M.D.; Couto, E.A. Energy potential of algal biomass cultivated in a photobioreactor using effluent from a meat processing plant. Algal Res. 2016, 17, 53–60. [Google Scholar] [CrossRef]
  28. Foladori, P.; Petrini, S.; Nessenzia, M.; Andreottola, G. Evolution of real municipal wastewater treatment in photobioreactors and microalgae-bacteria consortia using real-time parameters. Chem. Eng. J. 2018, 345, 507–516. [Google Scholar] [CrossRef]
  29. Couto, E.A. Produção de Biomassa em Lagoas de Alta Taxa com Diferentes Profundidades e Seu Aproveitamento para Geração de Energia via Liquefação Hidrotérmica. Ph.D. Thesis, Universidade Federal de Viçosa, Viçosa, Brazil, 2016. [Google Scholar]
  30. Umetani, I.; Janka, E.; Sposób, M.; Hulatt, C.J.; Kleiven, S.; Bakke, R. Bicarbonate for microalgae cultivation: A case study in a chlorophyte, Tetradesmus wisconsinensis isolated from a Norwegian lake. J. Appl. Phycol. 2021, 33, 1341–1352. [Google Scholar] [CrossRef]
  31. Whangchai, K.; Mathimani, T.; Sekar, M.; Shanmugam, S.; Brindhadevi, K.; Van Hung, T.; Chinnathambi, A.; Alharbi, S.A.; Pugazhendhi, A. Synergistic supplementation of organic carbon substrates for upgrading neutral lipids and fatty acids contents in microalga. J. Environ. Chem. Eng. 2021, 9, 105482. [Google Scholar] [CrossRef]
  32. Arbib, Z.; Ruiz, J.; Álvarez-Díaz, P.; Garrido-Pérez, C.; Barragan, J.; Perales, J.A. Photobiotreatment: Influence of Nitrogen and Phosphorus Ratio in Wastewater on Growth Kinetics of Scenedesmus Obliquus. Int. J. Phytoremediat. 2013, 15, 774–788. [Google Scholar] [CrossRef]
  33. Ratomski, P.; Hawrot-Paw, M.; Koniuszy, A. Utilization of CO2 from Sodium Bicarbonate to produce Chlorella vulgaris biomass in tubular photobioreactors for biofuel purposes. Sustainability 2021, 13, 9118. [Google Scholar] [CrossRef]
  34. Lee, S.-H.; Ahn, C.-Y.; Jo, B.-H.; Lee, S.-A.; Park, J.-Y.; An, K.-G.; Oh, H.-M. Increased microalgae growth and nutrient removal using balanced N:P ratio in wastewater. J. Microbiol. Biotechnol. 2013, 23, 92–98. [Google Scholar] [CrossRef] [Green Version]
  35. Alketife, A.M.; Judd, S.; Znad, H. Synergistic effects and optimization of nitrogen and phosphorus concentrations on the growth and nutrient uptake of a freshwater Chlorella vulgaris. Environ. Technol. 2017, 38, 94–102. [Google Scholar] [CrossRef]
  36. Sacristán de Alva, M.; Luna-Pabello, V.M.; Cadena, E.; Ortíz, E. Green microalga Scenedesmus acutus grown on municipal wastewater to couple nutrient removal with lipid accumulation for biodiesel production. Bioresour. Technol. 2013, 146, 744–748. [Google Scholar] [CrossRef]
  37. Koreivienė, J.; Valčiukas, R.; Karosienė, J.; Baltrėnas, P. Testing of Chlorella/Scenedesmus microalgae consortia for remediation of wastewater, co₂ mitigation and algae biomass feasibility for lipid production. J. Environ. Eng. Landsc. Manag. 2014, 22, 105–114. [Google Scholar] [CrossRef] [Green Version]
  38. Gupta, S.; Pawar, S.; Pandey, R.A. Current practices and challenges in using microalgae or treatment of nutrient rich wastewater from agro-based industries. Sci. Total Environ. 2019, 687, 1107–1126. [Google Scholar] [CrossRef]
  39. Wang, Q.; Wang, X.; Hong, Y.; Liu, X.; Zhao, G.; Zhang, H.; Zhai, Q. Microalgae cultivation in domestic wastewater for wastewater treatment and high value-added production: Species selection and comparison. Biochem. Eng. J. 2022, 185, 108493. [Google Scholar] [CrossRef]
  40. Lu, W.; Liu, S.; Lin, Z.; Lin, M. Enhanced Microalgae Growth for Biodiesel Production and Nutrients Removal in Raw Swine Wastewater by Carbon Sources Supplementation. Waste Biomass Valorization 2021, 12, 1991–1999. [Google Scholar] [CrossRef]
  41. Chen, C.; Song, Y.; Yuan, Y. The operating characteristics of partial nitrification by controlling pH and alkalinity. Water 2021, 13, 286. [Google Scholar] [CrossRef]
  42. Mao, Y.; Xiong, R.; Gao, X.; Jiang, L.; Peng, Y.; Xue, Y. Analysis of the status and improvement of microalgal phosphorus removal from municipal wastewater. Processes 2021, 9, 1486. [Google Scholar] [CrossRef]
  43. Delgadillo-Mirquez, L.; Lopes, F.; Taidi, B.; Pareau, D. Nitrogen and phosphate removal from wastewater with a mixed microalgae and bacteria culture. Biotechnol. Rep. 2016, 11, 18–26. [Google Scholar] [CrossRef]
  44. Fito, J.; Alemu, K. Microalgae—Bacteria consortium treatment technology for municipal wastewater management. Nanotechnol. Environ. Eng. 2018, 4, 4. [Google Scholar] [CrossRef]
Figure 1. Cultivation stages evaluated in this study.
Agriengineering 05 00075 g001
Figure 2. Values of (a) pH during Stages 1 and 2; (b) pH and DO during Stage 3; and (c) DO during Stages 1 and 2. The mean value of the triplicate samples is shown.
Agriengineering 05 00075 g002
Figure 3. Total and partial alkalinity during the operations of (a) Stage 1, (b) Stage 2 and (c) Stage 3. The mean value of the triplicate samples is shown.
Agriengineering 05 00075 g003
Figure 4. Values for absorbance (OD680, OD680/OD530) and dry weight (DW), during (a) Stages 1 and 2, and cell density, biovolume and absorbance (OD680) during the operations of (b) Stage 3. The mean value of the triplicate samples is shown.
Agriengineering 05 00075 g004
Figure 5. Ammonia (NH3) concentrations during (a) Stage 1 (without bicarbonate addition), (b) Stage 2 (with bicarbonate addition), and (c) Stage 3 (with and without bicarbonate addition). The mean and standard deviation of the triplicate samples are shown.
Agriengineering 05 00075 g005
Figure 6. Values of nitrate (NO3) during the operations of (a) Stage 1 (without bicarbonate addition), (b) Stage 2 (with bicarbonate addition), and (c) Stage 3 (with and without bicarbonate addition). The mean and standard deviation of the triplicate samples are shown.
Agriengineering 05 00075 g006
Figure 7. Values for orthophosphate during the operations of (a) Stage 1 (without bicarbonate addition), (b) Stage 2 (with bicarbonate addition), and (c) Stage 3 (with and without bicarbonate addition). The mean and standard deviation of the triplicate samples are shown.
Agriengineering 05 00075 g007
Figure 8. Soluble chemical oxygen demand (sCOD) concentrations in operations during (a) Stage 1 (without bicarbonate addition), (b) Stage 2 (with bicarbonate addition), and (c) Stage 3 (with and without bicarbonate addition). The mean and standard deviation of the triplicate samples are shown.
Agriengineering 05 00075 g008
Table 1. Frequency of analyses in each stage. Stage 1: without NaHCO3 supplementation and with NH4Cl and KH2PO4 supplementation, to obtain N:P ratios of 5:1, 10:1, and 20:1. Stage 2: with supplementation of NaHCO3, NH4Cl, and KH2PO4. Stage 3: two nutritional conditions, with and without NaHCO3 supplementation for the best N:P condition verified in Stages 1 and 2.
Daily AnalysesAbbreviationUnitReferenceStagePBR Input and Output AnalysisAbbreviationUnitReferenceStage
1, 231, 23
Maximum and minimum temperatureTMAX and TMIN°C[15]XXCell Biovolume-µm3[20,21]XX
Dissolved OxygenDOmg O2·L−14500-O [15]XXGenus and Species Identification--[22,23]XX
pH--4500-H+ [15]XXVolatile Suspended SolidVSSmg·L−12540 D [15]XX
Partial and Total Alkalinity-mg CaCO3·L−12320-B [15]XXTotal Suspended SolidTSSmg·L−12540 D [15]XX
Optical Density at 530 and 680 nmOD530 and OD680-[16,17]XXFixed Suspended SolidFSSmg·L−12540 D [15]XX
Chlorophyll-a-mg·L−1[18,19]X Ammonia NitrogenNH3mg N·L−14500-NH3C [15]X
Dry WeightDWmg·L−1[7]X Total Kjeldahl NitrogenTKNmg N·L−14500-Norg.B [15]X
Ammonia NitrogenNH3mg N·L−14500-NH3C [15] XNitrateNO3mg N·L−1Hach® 10020 [15]X
Total Kjeldahl NitrogenTKNmg N·L−14500-Norg.B [15] XNitriteNO2mg N·L−1Hach® 10019 [15]X
NitrateNO3mg N·L−1Hach® 10020 XTotal PhosphorusTPmg P·L−14500-P E [15]X
NitriteNO2mg N·L−1Hach® 10019 XOrthophosphatePO43−mg P·L−14500-P E [15]X
Total PhosphorusTPmg P·L−14500-P E [15] XSoluble Chemical Oxygen DemandsCODmg O2·L−15220 B [15]X
OrthophosphatePO43−mg P·L−14500-P E [15] X
Soluble Chemical Oxygen DemandsCODmg O2·L−15220 B [15] X
Table 2. Results of the N:P conditions in Stage 1 (without bicarbonate addition—NB) and Stage 2 (with bicarbonate addition—WB).
ConditionDW 96 hOD 96 h (680 nm)sCOD Removal (%)TKN Removal (%)NH3 Removal (%)NO2NO3PO43− RemovalVSS Increment (%)
(g·L−1)(mg·L−1)(mg·L−1)(%)
Stage 1
DWW-NB0.54 ± 0.29 a0.73 ± 0.16 a72.09 ± 7.99 a73.98 ± 32.08 a100 a1.20 ± 1.79 a1.28 ± 0.10 b94.09 ±9.16 a8.82 ± 96.51 a
5:1-NB0.51 ± 0.22 a0.86 ± 0.03 a83.65 ± 12.53 a52.80 ± 18.33 a79.55 ± 16.97 a1.09 ± 1.63 a19.72 ± 7.45 a1.99 ± 9.65 b288.90 ± 530.97 a
10:1-NB0.51 ± 0.57 a1.01 ± 0.46 a81.40 ± 15.96 a46.76 ± 17.90 a81.16 ± 27.29 a6.83 ± 5.79 a3.21 ± 1.94 b5.13 ± 24.53 b108.42 ± 161.13 a
20:1-NB0.71 ± 0.01 a1.5 ± 0.88 a81.68 ± 10.64 a42.51 ± 21.87 a80.41 ± 25.88 a2.28 ± 2.33 a9.13 ± 5.18 ab100 a322.63 ± 498.63 a
Stage 2
DWW-WB0.44 ± 0.11 c0.95 ± 0.18 c45.21 ± 35.07 c62.87 ± 21.04 c100 c0.20 ± 0.04 e0.76 ± 0.10 c97.46 ± 4.00 c440.95 ± 496.29 c
5:1-WB0.82 ± 0.42 c1.36 ± 0.58 c41.39 ± 50.26 c68.58 ± 8.97 c100 c7.05 ± 4.88 cd5.22 ± 6.64 c−30.60 ± 162.25 c63.29 ± 52.65 c
10:1-WB0.64 ± 0.38 c1.22 ± 0.84 c19.53 ± 59.21 c72.06 ± 7.52 c95.97 ± 6.9 c10.14 ± 0.15 c6.33 ± 3.94 c73.32 ± 21.78 c301.35 ± 74.99 c
20:1-WB0.45 ± 0.21 c0.91 ± 0.33 c35.21 ± 47.33 c70.08 ± 6.54 c100 c2.54 ± 0.63 de4.38 ± 2.97 c98.33 ± 2.58 c331.86 ± 18.28 c
Different letters in the same column indicate significant differences between reactors treatments (one-way ANOVA with Tukey test, p < 0.05). The statistical analysis was performed specifically for each stage of the research, considering the nutritional conditions of DWW, 5:1, 10:1, and 20:1, with or without bicarbonate, depending on the stage. It is not a direct comparison between Stages 1 and 2. The removal percentages are associated with the initial and final days of cultivation. As for the variables associated with microalgae growth (OD 96 h—680 nm) and total biomass (DW 96 h), they correspond to a cultivation period of 96 h.
Disclaimer/Publisher’s Note: The statements, opinions and data contained in all publications are solely those of the individual author(s) and contributor(s) and not of MDPI and/or the editor(s). MDPI and/or the editor(s) disclaim responsibility for any injury to people or property resulting from any ideas, methods, instructions or products referred to in the content.

