1. Introduction
Panama wilt disease is a devastating disease that affects banana plants and can cause up to 100% crop loss. Panama wilts disease can spread quickly and can cause serious economic losses for banana growers. The disease is particularly destructive in tropical and subtropical areas where bananas are grown commercially. The presence of Panama wilts disease can reduce the yield of banana plants and the quality of the fruit produced. The disease is also known to cause wilting and chlorosis on the leaves of affected plants. The spread of Panama wilts disease can be prevented by following good agricultural practices, such as crop rotation and disease-resistant varieties. Additionally, using fungicides can help reduce the spread of the disease. Initially, the margins of the lower leaves are grey. Eventually, this yellow color spreads to the center or midrib of the leaf, and eventually, the entire leaf turns yellow [
1]. Then this yellow color spreads from the lower leaves to the upper leaves, and all the leaves in the banana tree turn yellow. It spreads to the leaves and turns yellow in all the banana tree leaves [
2,
3]. The lower leaves of the affected tree are torn off at the petiole and hang around the stem. Cracks are seen from the bottom along the length of the stem [
4]. Sometimes many side shoots appear before the tree dies. Tars do not usually appear on diseased banana trees. Even though it is harvested, the pods are tiny and few [
5]. These fruits also do not ripen uniformly. In bananas, the leaves are burnt, the bats are broken, and the banana tree is wrapped in cloth. Then the center of the leaf turns yellow and continues to burn. Due to this, the banana peels will break and hang. If it cuts the banana tuber crosswise, a yellow–red–brown mass can be seen inside. The leaves of the tree turn yellow and die quickly. The water-absorbing tissues are discolored and filled with fungi if they cut a banana stem. This disease reduces the yield of banana crops and poses a severe challenge to the farmers’ economy.
The flesh is also tasteless and acidic. If the rhizome is cut crosswise, it can be seen in yellow, brown, black, and others. [
6]. These ductal discolorations can also be seen when the mat is split lengthwise. After a long time, the diseased tree will rot, and the cut stem will smell like rotten fish [
7]. This wilt disease is caused by a fungus called Fusarium. This flower produces many kinds of seeds that can live in the soil for about 30 years [
8]. Avoid transplanting infected tubers or tubers from one location to another [
9].
Banana plantations unaffected by blight should be visited before cutting, and the seedlings should be selected [
10]. After taking the calves from the banana plantations, remove the skin and roots of the tubers and then dip the tuber in 0.2 percent carbendazim (2 g in 1 L of water) and monocrotabas (14 mL in 1 L of water) solution for 30 min, then dry in the shade and plant [
11]. After planting, 20 g of Trichotoma viridis and 20 g of Pseudomonas fluorescent should be mixed with half a kilogram of vermicompost and watered around the tuber [
12]. Repeat this process at 2, 4, and 6 months after calving. Fusarium wilt disease can be controlled by applying carbendazim (2 mL in 1 L of water) to all banana trees at the rate of 2 L of drug mixture per banana tree as soon as the disease symptoms appear in one or two bananas [
13]. Ten to fifty percent of yield is affected by nematode and blight attacks in banana crops. Blight is spread through soil and tubers. The basal leaves’ edges first turn yellow and extend to the center [
14]. The edges become wilted and dry as the disease progresses, and the stem splits [
15]. Fungal filaments spread in the tissues, the sap canal becomes blocked, and the tree dies. The cultivation of rice or sugarcane next to bananas can prevent powdery mildew development [
16]. Take 50 kg of compost per acre mixed with neem powder, and two and a half kg of Pseudomonas fluorescence antibiotic can be applied under the soil [
17].
Before planting, the old root and infected part above the tuber should be removed. Mix one gram of carbendazim per liter, soak the tubers for 20 min and rub them in the clay. Forty grams of carbofuran per tuber should be mixed and washed [
18]. Alternatively, 20 mL of carbendazim solution per liter should be injected into the side of the tuber through a small needle [
19]. Attacks by borer, root rot, root-knot, and spiral nematodes can cause yellowing and reduced banana leaves. Trees will stunt growth. Roots are black or crimson with rot and root nodules [
20,
21]. As a result, the roots of the trees can quickly sink into the soil without getting caught. Banning bananas as a single crop should be avoided [
22]. The cultivation of cereals and cotton as alternative crops can control nematodes. Nematodes can be controlled by picking them before flowering and placing them between banana plants with soil embankments [
23,
24]. The soil should be cut once in two months, and the soil should be mulched with bunches. Side shoots should be removed once a month. Dry and diseased leaves should be collected and burnt. By doing this, leaf spot disease can be controlled [
25]. The male should be propped up one week after the last comb emerges so he does not release the flower. Cover the hammock with glass leaves to prevent rotting. Cover the pods with banana leaves to prevent sun damage [
26,
27]. After the tree is cleared, a vigorous calf should be set aside for the re-tampon crop. Most banana varieties are resistant to wilt, but some varieties are easily affected by Panama wilt disease. When planting banana seedlings, select healthy seedlings free from the disease [
28]. The disease effect can be found by looking at the tubers of the calf. Red marks on the seed tuber should be combed. Nematode attack can be avoided if the tuber is dipped in the clay solution; the pit is sprinkled with carbofuran, and the blight attack will be controlled [
29]. There is currently no known cure for Panama wilts disease in banana leaves; however, deep learning may offer a way to prevent the disease from spreading. This is because deep learning can be used to identify patterns in data that may be indicative of the disease [
30]. For example, if the leaves of a banana plant begin to turn yellow, this could be a sign that Panama wilts disease is present. By using deep learning to identify these patterns, it may be possible to develop a system that can warn farmers of the disease before it has a chance to spread [
31]. Panama wilts disease is a devastating disease that can destroy entire crops of bananas. If deep learning can be used to identify the early signs of the disease, it could help prevent the disease from spreading and causing extensive damage [
32]. The significant contributions of this work are as follows:
- ⮚
Early detection: Panama wilts disease can be detected early, which makes it easier to treat the plant and reduce the spread of the disease.
- ⮚
Prevention of crop loss: By detecting Panama wilts disease early, farmers can take measures to prevent crop loss and maximize yields.
- ⮚
Cost savings: Early detection of Panama wilts disease can help reduce the costs associated with treating the disease and the costs associated with replacing crops that have been affected by the disease.
- ⮚
Control of disease: Detecting Panama wilts disease early helps control and reduce the spread of the disease, which can help protect other plants from becoming infected.
- ⮚
Improved agricultural practices: The early detection of Panama wilts disease can help farmers implement better agricultural practices and reduce the spread of the disease.
The main objective of this work is to identify the symptoms of Panama wilt disease in banana leaves and advise the farmers on preventive measures. The primary contribution of this paper is to analyze data on color change in the banana leaf using the deep learning method and calculate disease severity based on it. Also, the effects are calculated on a whole banana leaf based on its color block variation, which is estimated to determine the severity of Panama wilt disease. The abbreviation details are shown in
Table 1.
The organization of this paper are as follows. The related works are described in
Section 2. The existing research was studied here, and the pros and cons were analyzed.
Section 3 explains the proposed model and includes the proposed block diagram and algorithm. The comparative analysis is expressed in
Section 4. Some existing works are compared with the proposed model, and the results are demonstrated here. Finally,
Section 5 provides the conclusion and future enhancements of the proposed model.
2. Related Work
Identifying Panama wilt disease in banana leaf plants is important in order to monitor the spread of the disease and take appropriate steps to prevent further damage. The symptoms of Panama wilt disease include wilting of the banana plant, yellowing and wilting of the leaves, and death of the entire plant. Early detection and management of the disease is very important in order to reduce the spread of the disease and limit the damage it can cause. This section describes previous research and methods on Panama wilt disease.
2.1. Related Works
Park H. et al. [
33] were discussed as a crop disease diagnosis using an image-based deep learning mechanism. In this method, the authors analyzed the images of healthy and disease-free parts of crops. Then the severity of the disease is calculated based on the sets of colors of its affected areas, and the affected areas are analyzed. Based on the identification, they proposed some recovery actions. One kg of neem paste per hectare or pit and five kg of sugar mill waste per pit should be applied. The attack of this disease is more in acidic soil. Therefore, one to two kg of calcareous soil should be applied. The blight factor remains in the soil for a long time. They identified that the fungus penetrates the banana tree through the roots. The disease is also spread through irrigation water. Therefore, water should not accumulate in the ground during the rainy season and should be drained well. Jogekar R. N. et al. [
34] discussed deep learning techniques for identifying and diagnosing plant leaf disease. In this method, the authors gathered the training data. In this data, various diseased images were stored in an image database, and their blocks were classified into multivariate patterns. Based on the various parameters of this classification, the testing data taken were compared in the list. Based on this comparison results, the disease’s severity and the spread rate were calculated. Here, the authors provide the drip irrigation system that is best for banana harvesting. Biological control has been followed to control the disease in the affected area. Seed treatment can be performed at 10 gm per banana plant with the biocide Pseudomonas fluorescent. Wilt disease can be controlled by applying Pseudomonas plans at 2.5 kg per hectare mixed with 50 kg of compost or vermicompost, dried in the shade for ten to fifteen days.
Senthilraj P. et al. [
35] discussed an effectual multivariate SVM integrated with CNN for identifying diseases in banana trees. In this way, the authors have proposed a disease classification system based on a fine-tuned algorithm based on CNN. That is, after dividing the affected area of the banana into small blocks based on the CNN algorithm, they calculated the severity of the disease spread in a specific area through the proposed method based on the measurement of colors according to the classification of those blocks. Based on the identification, they suggest some prevention activities. The carbendazim 0.2 percent or proposal 0.1 percent fungicide should be mixed with water around the tree after five months of seedling and two months apart to soak the soil. All trees should be treated with a 3 mL carbendazim 2 percent solution in the tuber when symptoms of powdery mildew appear. Instead of the drug solution, a vial filled with 60 mL of carbendazim can be injected through a 7 mm hole in the tuber.
Narayanan K.L. et al. [
36] discussed banana plant disease classification using a hybrid convolution neural network. Here, the disease computations are classified using the CNN algorithm designed in the hybrid method. In the lands where the wilt disease is prevalent, other types of bananas resistant to this disease can be planted. Bananas can be planted after planting rice as an alternative crop in diseased lands. Banana seedlings should be selected from disease-free plantations. The seed tubers should be combed until the red pits are removed. Bannihatti R.K. et al. [
37] discussed image-based high throughput phenotyping for Fusarium wilt resistance in pigeon pea. Before planting the tubers, it should be sprinkled evenly on the tubers soaked in 2 percent Pseudomonas water solution. A puncture should inject a 2 percent solution of Pseudomonas into the tuber. This disease can be controlled as much as possible by keeping the field clean without weeds. Also, infected calves should not be used for planting. Even when no crop is in the field, these insects grow in the weeds; so ensure no weeds are growing nearby.
Rinu, R., et al. [
38] discussed a deep learning based approach for classifying banana leaf disease using CNN and transfer learning. The multivariate image classifications generated by this method are the maximum classification accuracy of the proposed method. Chaudhari V. et al. [
39] discussed the banana leaf disease detection using K-means clustering and feature extraction techniques. In this method, only disease blocks were classified separately. Saleem M.H. et al. [
40] provided insights into plant disease detection and classification by deep learning. In this manner, Panama disease was classified based on the severity of its impact. Here, disease prevalence is predicted based on various shape differences and instability in color blocks. Based on that, some preventive measures are proposed. The tubers should be dipped in 0.1 percent carbendazim solution for 5 min. The calves should be dipped in mud, and borate fungicide should be sprinkled at 12 g per tuber. Water is an essential part of planting banana trees. Sahu P. et al. [
41] discussed the classification and activation map visualization of banana diseases using deep learning models. After planting the banana seeds, water should be irrigated continuously once a week on plantation land and once in 10–15 days in irrigated areas. From the fourth month after planting, 15 L of water per tree per day should be given through drip irrigation. Selvaraj M. G. et al. [
42] reviewed the detection of banana plants and their significant diseases through aerial images and machine learning methods. This method is designed based on different color changes occurring in blocks based on images. By calculating different types of stroke data in colors, the disease-affected areas were detected by the analytical methods designed for this purpose. This should be applied before the application of chemical fertilizers. For tissue culture banana, 50 percent additional fertilizer should be applied at 2, 4, 6, and 8 months after planting.
Coronel A. D. et al. [
43] discussed machine learning methods for an intelligent identification system of Fusarium Oxysporum Sp. in soil samples. Here, the pits should be cut between rows and the pits should be deepened at regular intervals, and the soil should be spread over the beds. Dig the hole once in two months. Remove excess side shoots once a month. Male flowers should be removed a week after the flower has fully expanded. Calves should be propped before flowering or during flowering. Ye H. et al. [
44] explained the identification of banana Fusarium wilt using UAV-based multi-spectral imagery. The second flowering of the second crop should be allowed only after the harvest of the first crop. Small white spots appear on the upper part of the leaves as aphids and glassy bugs suck sap from the leaves. It will affect the growth of bananas. Singh A.K. et al. [
45] discussed deep learning for plant stress phenotyping: trends and future perspectives. The nematodes feed on roots and tubers by sucking the sap. Due to this, dark colors are seen in roots and tubers. Bacterial and fungal pathogens can quickly enter and cause disease through wounds caused by nematodes. Feng W. K et al. [
46] discussed image recognition of plant diseases and pests based on deep learning. This way, analyses were carried out based on different types of problems caused by insects. The method was designed to assess the damage caused by insects by analyzing half-leaves and minor holes. Eunice J et al. [
47] explored deep learning-based leaf disease detection in crops using images for agricultural applications. The edges of the banana leaves become dry, and the leaves turn white. The leaves appear to emerge from a single point in clusters. Abigan E. G. T. et al. [
48] analyzed the effects of microscopy techniques on the performances of convolution neural networks. The banana leaves infected with Chikatoka leaf spots first appear as yellow spots, which then turn into brown streaks with a grey center. Infected leaves begin to scorch from the tip, and the entire leaf dries up in the testicles.
2.2. Literature Discussion
Detecting Panama wilts disease is helpful because it allows for early detection and control. Early detection can help limit the disease’s spread and prevent it from causing significant damage to crops. Early detection can also helps ensure that the appropriate control measures are taken to limit its spread and reduce the economic impact of the disease. Additionally, early detection can help identify potential new sources of the disease and prevent further outbreaks. Some of the key findings from the existing research works are listed below.
- ⮚
Lack of data sets to train deep learning models for early detection of Panama wilts disease.
- ⮚
Limited understanding of the disease’s genetic makeup is necessary for developing deep learning models.
- ⮚
Difficulty mapping the symptoms of Panama wilts disease to an appropriate deep learning model.
- ⮚
The need to develop more robust deep learning architectures that can accurately detect the disease in a short amount of time.
- ⮚
Challenges in collecting and labeling data to train the deep learning models.
- ⮚
Limited research on developing cost-effective, accurate deep learning models for Panama wilts disease detection.
- ⮚
Difficulty designing efficient deep learning models that can tackle the complex nature of Panama wilts disease.
- ⮚
Lack of research on adapting existing deep learning models for Panama wilts detection.
- ⮚
Inability to accurately predict the disease using deep learning models due to the dynamic nature of the disease.
- ⮚
Difficulty optimizing the parameters of deep learning models for improved detection of Panama wilts disease.
Previous research has proposed predictions of Panama wilt disease symptoms and outcomes. Disease severity can be calculated based on these data, and most previous methods do not accurately predict the outcome of color variations. More likely, problems will arise in accurately interpreting the resulting disease as Panama disease. In a few proposed methods, only the amount of disease present in a specific area of the banana leaf has been calculated. However, analyzing the leaves on a tree does not calculate the extent of the disease throughout the tree. Some of the proposed methods have been used to quantify the symptoms of Panama wilt disease and calculate its severity. However, data such as the duration and speed of its spread could not be calculated.
Based on the existing analysis, some of the following improvements are planned to implement in the proposed research:
- ⮚
The severity of the disease can be accurately predicted by continuously monitoring the banana from the time of planting to the time of harvest till the color change occurs.
- ⮚
Also, the related dataset is trained when there are symptoms other than Panama wilt disease. The proposed method works to predict the co-morbidities of Panama wilt disease.
The main novelty of the proposed agro deep learning model for detecting Panama wilts disease is its ability to quickly and accurately analyze large amounts of data. This model can be used to identify the presence of the disease in an image. Additionally, the model can be used to identify potential treatments and preventive measures that could be taken. It could save significant time, money, and resources in the fight against Panama wilts disease.
3. Materials and Methods
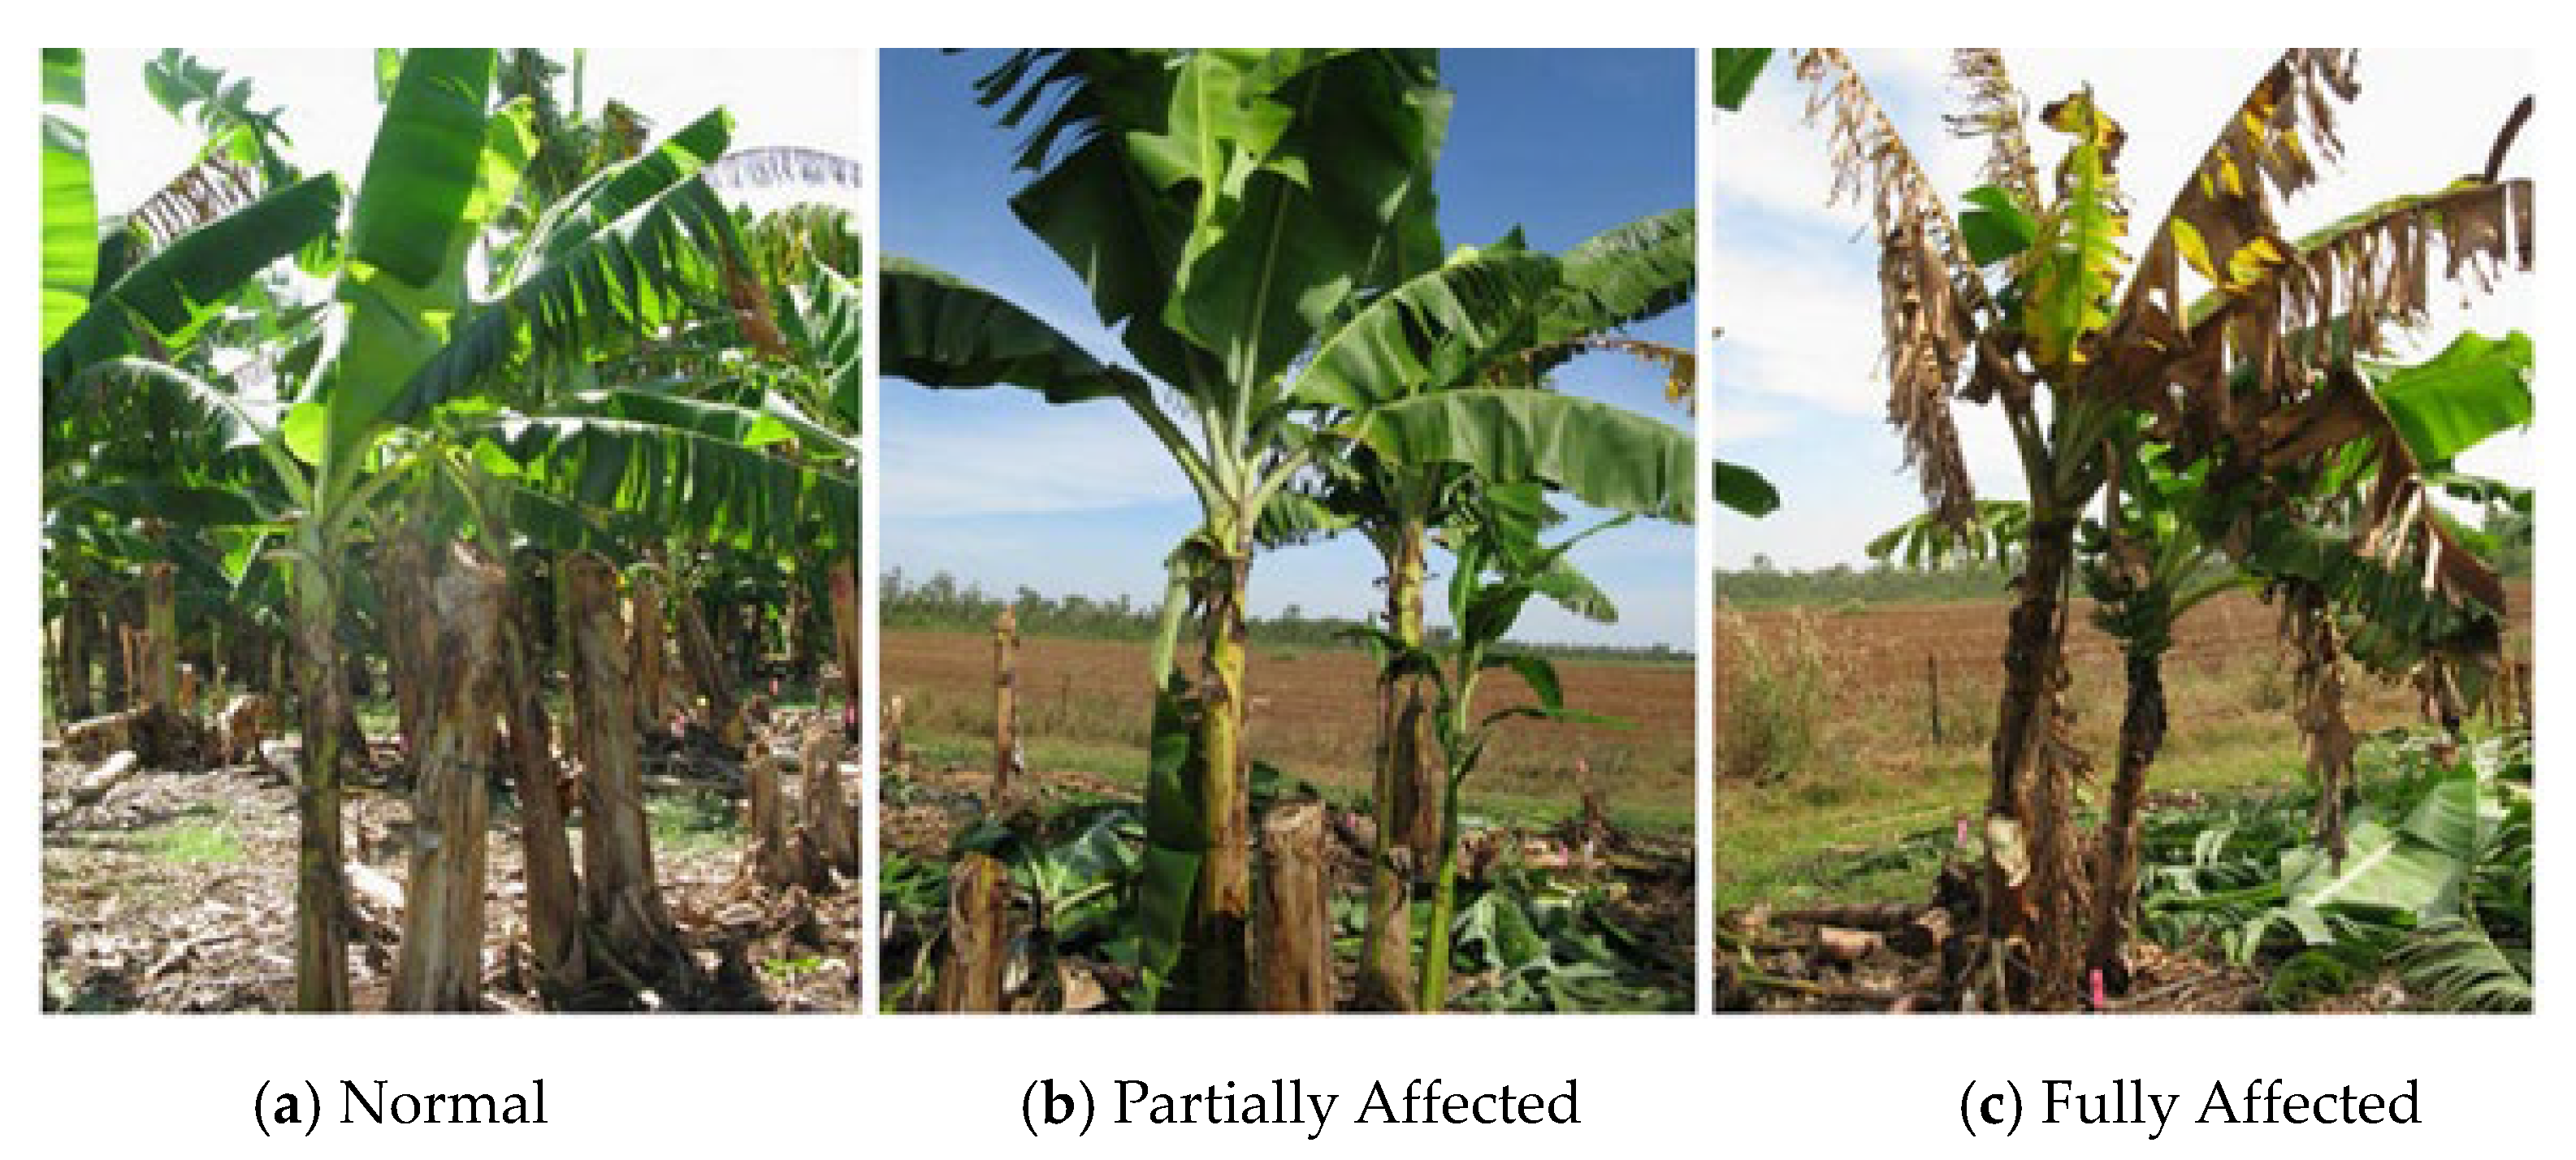
Panama wilt disease in banana crops can cause scorched leaves, broken bats, and a cloth wrapped around the tree. At first, it appears yellow on the edge of the leaf. Then the center of the leaf turns yellow and continues to burn. If it cuts this banana crosswise, a yellow-red-brown color can be seen inside. If it cuts a banana stem, the water-absorbing tissues will change color and be full of pollen. The infected plant’s images are shown in
Figure 1.
It is known as blasted banana disease or Panama wilt disease. A clear block diagram of this is shown in
Figure 2.
In the currently proposed method, images of banana leaves are given as input. Next, these images are analyzed through preprocessing. In this method, the normal leaf area and the Panama disease-infected area are separated. Then those regions are segmented into small groups and fed into the proposed agro deep learning algorithm module. This proposed algorithm inputs the training image blocks from the image database. The given test and training image blocks are compared. Based on this, the diseased area and its boundaries are defined on the banana leaf. The image database collects various pictures of Panama wilt-infected banana leaves. It also stores images of healthy (disease-free) banana leaves.
3.1. Dataset Description
- ⮚
The symptoms dataset [
44] was expressed in the following. Initially, the yellowing and wilting occur on the lower leaves, especially on the leaf margins. Then, this yellow color spreads to the center of the leaf, and the edges dry up. The lower leaves of the affected tree are detached from the petiole and hang around the stem. It looks like a tree skirt. When the tuber is cut crosswise, the color change is circular, and the effect is more significant in the middle part of the tuber, i.e., the tuber set. This color change is visible even if the stem is split lengthwise. This disease spreads through the soil. The fungus penetrates through the thin fibrous roots. Acid and salty soils are more susceptible to the disease. Insects, calves, gnats, field implements, vehicles, and irrigation water spread the disease.
- ⮚
The characteristics and specifications of the dataset will vary depending on the type of images that are included and the purpose of the dataset. For example, a dataset of pictures of people might have a different specification than a dataset of pictures of animals. Generally, the characteristics and specifications of a dataset should include:
- ⮚
Image dimension: The size of the images is 200 × 300 pixels.
- ⮚
Resolution: The resolution of the images in terms of dots per inch (DPI) is 300 DPI.
- ⮚
Number of images: The total number of images included in the dataset is 1000 images.
- ⮚
File format: The format of the images is JPEG or PNG.
- ⮚
Color space: The color space of the images is RGB.
3.2. Pre-Processing
Figure 3 shows the current data of banana leaf (orange-colored inputs) as input. Moreover, its corresponding kernel blocks are inputted as a test data block (grey entries) of size 3 × 3, and a complete image matrix is designed. Variance volumes are calculated, and finally, the diseased area (blue color) is calculated. This method is called slicing. In the currently proposed method, the image-related preprocessing is carried out in the following steps.
Image Resizing: Test image data and training image data are in different sizes and color sets. Thus, there is a high chance that the calculation time will increase. Thus, the images must be converted to a specified or fixed size (m × n). Thus, all the images work based on correct timing calculation in test and training blocks.
Image Transformation: At this point, the resized image block is segmented based on colors. These are divided based on RGB colors. Its measurement formula is shown in Equation (1).
where the term ‘P’ denotes the corresponding pixel value of the image.
Image Filtering: The last step in the preprocessing method is filtering out the unwanted blocks in the image block. After obtaining the basic data for filtering other unwanted blocks are filtered out and the complete image is kept ready for further processing,
where the term ‘i’ denotes the positive edge values of the input images. Here, each complex image block is continuously filtered based on the application referred to as “ReLU”. This ensures a clear image sequence.
3.3. Segmentation
Segmentation is the process of breaking down a whole image set into smaller pieces and analyzing it; the images in a given image database are divided into smaller image blocks that can be compared to the images in the training and testing blocks. This is shown in
Figure 4.
Each block of the image is divided into square blocks of size 2 × 2 and its color change components are analyzed. Thus, even small color changes in a block are accurately calculated and its boundaries are defined. The output level was calculated with the help of Equation (3).
where f = vector label for the target input image; g(z) = vector label for the target output image.
3.4. Feature Extraction
In this method of analyzing the measurements of image data, the input image data is prepared for analysis by fitting its segment data.
where the * denotes the convolution operator and x(α,β,γ) is the Gaussian parameter for variable image scale. F(α,β) indicates the input image values and P(α,β,γ) denotes the difference of Gaussian value. The filtered convolution image was obtained to resolve Equation (7).
where α′= α cos b + β sin

b; β′ = −α sin b + β cos

b; ‘a’ denotes the frequency factor of the spatial sinusoidal indicator; ‘b’ denotes the Gabor function constant between the normal to parallel indication; the phase offset was denoted by ‘c’; the standard deviation of the Gaussian kernel was indicated by ‘d’; and the spatial aspect ratio was expressed by ‘e’. Finally, the result obtained the 8 dimensional vectors with 3 × 3 image array of histogram bits. Hence 3 × 3 × 8 = 72 dimensions.
3.5. Classification
The logarithmic axis is the optimal method for the representation of spatial frequency response. The filtering images are filtered by using EGF (enhanced Gabor function). When the feature extraction was completed, then the CCS (Cartesian coordinate system) expressed its function. It is shown in Equation (8),
where σ
0 is the representation of the midpoint, b is the radial path of the image, φ
0 is the direction position of the image vector, X is the sizing factor, and ∆φ is the direction spacing of the image. Here, the classification of the process performed is as follows:
where a
1 = a cos

θ+ b sin

θ; b
1 = −a sin

θ+ b cos

θ; ‘θ’ represents the direction of the image vector. The center vector frequency denotes the term ‘a
1′, and ‘i’ expresses the term of the image bandwidth in the a1 direction. The ∆x is the filter bandwidth in a1 direction. Consider an image f(a,b) with the indexing window size x,y. Now the convolution window was expressed by
where x × y is the mask size of the image filter. ‘a’ and ‘b’ are the image orientations of the feature image vector. The magnitude of the image vector is,
The mean value is used to detect Panama wilt disease in plants by measuring the extent of disease severity. It is computed by taking the average of all the observations of the disease on a particular plant or crop. The mean value can then be used to compare the severity of the disease across different plants or crops, and to detect any differences in disease severity between plants of the same species. This can help farmers and researchers identify areas where Panama wilt disease is more prevalent, so that they can take measures to prevent or reduce the spread of the disease. The mean value of the image vector is
The purpose of computing the standard deviation value for detecting Panama wilts disease is to measure the variability in the disease symptoms. By analyzing the standard deviation value, researchers can determine the range of symptoms present in an individual or population infected with Panama wilts disease and use this information to develop more accurate diagnosis and treatment strategies. Additionally, the standard deviation can also be used to identify populations that may be at higher risk for developing the disease. The standard deviation of the image vector is
where X*Y expresses the size of the image, the 2D log Gabor filters create a polar coordinate system in frequency domain, and inverse Fourier transform can be used to construct in the spatial domain. Finally, the Log Gabor filters can also expand image information through channels.
3.6. Proposed Algorithm
The currently proposed Algorithm 1 is described below. Initially, the image data is obtained based on given inputs. Image preprocessing is performed based on this input data. At the beginning of this method, the given images are divided into small blocks. These areas are divided into square shapes of equal size. It will increase the chances of getting images of the same size. Then, the grey image blocks are loaded with color based on Equation (1) according to their values, and the blocks also form squares of equal size. Moreover, the redundant data blocks in the image are filtered based on Equation (2). Filtering events provide required data blocks and remove unnecessary image data.
| Algorithm 1: Agro deep learning algorithm |
| Step 1 | Start |
| Step 2 | Enter the input image |
| Step 3 | Initiate the image preprocessing |
| Step 4 | Resize the Image with (m × n) blocks |
| Step 5 | Transform the Image as per Equation (1) |
| Step 6 | Filter the image as per Equation (2) |
| Step 7 | Segment the images |
| Step 8 | Verify the training images |
| Step 9 | If (img_blocks = approved) |
| Step 10 | Then extract the features |
| Step 11 | If (Features = approved) |
| Step 12 | Insert the Test_Img |
| Step 13 | Compare Test_Img |
| Step 14 | If (Test_Img = Training_Img) |
| Step 15 | Display Panama wilts disease- Level 1 |
| Step 16 | Else Store the new sample in Database |
| Step 17 | Else goto step 3 |
| Step 18 | Else goto step 7 |
| Step 19 | Stop |
Then, the input blocks are segmented to fit the testing image data to form small square images. Here, the image is moved to feature extraction operations. Its feature extraction is compared concerning the inputs to the image. If this is performed perfectly, then the test data is entered. Now, test and training image data are compared. If both of these are correct, the entries confirm Panama disease. If the two do not match, then the entered image data can be merged into the database. The proposed flow diagram is demonstrated in
Figure 5.
An improved agro deep learning model for the detection of Panama wilts disease in banana leaves would involve a multi-stage approach. First, a convolutional neural network (CNN) would be used to analyze the images of banana leaves and identify any potential signs of the disease. The CNN would be trained on a large dataset of images of both healthy and diseased leaves, allowing it to recognize the subtle visual differences between them. The CNN would then output a probability score for each image, indicating the likelihood of Panama wilts disease being present. This score would then be used to determine if further analysis is required. If the score is high, then an additional deep learning model could be used to analyze the images in more detail, such as identifying specific areas of damage or discoloration. Finally, a post-processing step would be used to evaluate the results of the deep learning models and make a final decision as to whether Panama wilts disease is present. This could involve combining the results from both models into a single score or performing additional tests such as a tissue culture or laboratory analysis. The post-processing step could also involve additional measures such as checking for other diseases or verifying the accuracy of the model.
4. Comparative Analysis
The proposed agro deep learning model (ADLM) was compared with the existing deep learning models for banana diseases detection (DLM-BDD), an automated segmentation and classification model (ASCM), chickpea disease detection and classification model (CDDCM), and an image-based deep learning mechanism (IDLM). Matlab R2022a is used as the simulation tool to obtain the results.
4.1. Computation of Accuracy
In general, accuracy is the maximum correlation between the obtained value of a quintile and its actual value. It refers to calculating and accurately classifying Panama disease symptoms when given images of banana leaves as input. The maximum accuracy determined by this method means a high degree of diagnostic accuracy. That is, maximum accuracy refers to accurately calculating Panama disease based on calculations.
where S
R means the number of perfect predictable samples and T means the total number of input samples.
Table 2 expressed the accuracy comparison between the existing DLM-BDD, ASCM, CDDCM, IDLM, and proposed ADLM.
Figure 6 demonstrates the evaluation of accuracy between the existing and proposed models. The accuracy of Panama wilt disease identification depends on a number of factors, including the experience and expertise of the person conducting the identification, the method used for identification, and the quality of the sample being examined. Generally, the accuracy of Panama wilt disease identification is estimated to be between 80 and 90%.
In a saturation tip, the existing DLM-BDD reached 55.66%, ASCM achieved 70.03%, CDDCM achieved 70.78%, IDLM reached 72.78%. However, the proposed ADLM obtained 91.56% of accuracy in the same range. Accuracy is helpful for Panama wilt disease identification because it allows researchers to accurately identify which plants are infected with the disease and which are not. It helps ensure that the proper treatment and preventative measures are taken to reduce the spread of the disease and protect other plants from becoming infected. Accurate identification also helps ensure that resources are used efficiently, as resources are not wasted on treating non-infected plants.
4.2. Computation of Precision
The precision means calculating true positives for Panama wilt disease from given image data, along with aggregate true data, and providing accurate results based on that. Here, total true data refers to the sum of input true positive image data and false positive image data. The computation of precision is expressed in Equation (15)
where S
PT = samples in positive true region; S
PF = samples in positive false region;
Table 3 expresses the precision comparison between the existing DLM-BDD, ASCM, CDDCM, IDLM, and proposed ADLM
Figure 7 demonstrates the evaluation of precision between the existing and proposed models. The precision for Panama wilts disease identification depends on the accuracy of the diagnostic tests used to detect the disease. Generally, the accuracy of diagnostics used to identify Panama wilts disease is high, with some tests being able to detect the disease in more than 95% of cases. Additionally, the use of multiple tests increases the precision of the diagnosis.
In a saturation tip, the existing DLM-BDD reached 54.46%, ASCM achieved 68.04%, CDDCM achieved 69.37%, IDLM reached 70.48%. However, the proposed ADLM obtained 91.61% of precision in the same range. Precision is helpful for Panama wilt disease identification because it allows researchers to accurately identify the disease and ensure they are targeting the correct cause. Precision helps reduce the number of false positives when identifying the disease, which can help save valuable time and resources. It also helps reduce the risk of misdiagnosis, which can lead to incorrect treatments. Precision also helps reduce the risk of spreading the disease further as it can be accurately tracked and monitored.
4.3. Computation of Recall
The recall is process that helps retrieve data related to Panama wilt disease from memory. Here, total true data refers to the sum of input true positive image data and false negative image data. The computation of recall is expressed in Equation (16)
where S
PT = samples in positive true region; S
NF = samples in negative false region;
Table 4 expresses the recall comparison between the existing DLM-BDD, ASCM, CDDCM, IDLM, and proposed ADLM
Figure 8 demonstrates the evaluation of recall between the existing and proposed models. Regarding Panama wilts disease identification, recalling the symptoms associated with this plant disease is essential. These symptoms include wilting of the leaves, yellowing of the leaves, stunted growth, and the presence of brown lesions on the stems and petioles. In addition, the leaves may curl, and the stems may become thickened and brittle.
In a saturation tip, the existing DLM-BDD reached 61.42%, ASCM achieved 66.20%, CDDCM achieved 85.84%, IDLM reached 81.06%. However, the proposed ADLM obtained 88.56% of recall in the same range. Recall is an essential tool for Panama wilt disease identification because it allows experts to accurately identify infected plants and take appropriate measures to prevent the spread of the disease. By using recall, experts can quickly identify infected plants and take the necessary steps to contain the disease. In addition, recall helps experts identify those plants that may not be infected but are at risk of developing the disease. It helps prevent the spread of the disease as experts can target the plants most at risk for developing the disease.
4.4. Computation of F1 Score
The F1 score metric is considered to be the most essential in the currently proposed deep learning. Based on this, the maximum efficiency of the proposed method is calculated. It is considered as a measure that combines two measures (precision and recall) to calculate the predictive performance of the proposed model. The computation of F1 score is expressed in Equation (17)
where S
PT = samples in positive true region; S
PF = samples in positive false region; S
NF = samples in negative false region;
Table 5 expresses the F1 score comparison between the existing DLM-BDD, ASCM, CDDCM, IDLM, and proposed ADLM
Figure 9 demonstrates the evaluation of F1 score between the existing and proposed models. The F1 score for Panama wilts disease identification is not a specific value, as it depends on the accuracy of the model used for identification. Generally, a machine learning model used for Panama wilts disease identification should have an F1 score of at least 0.8 (80%) to be considered reliable.
In a saturation tip, the existing DLM-BDD reached 58.09%, ASCM achieved 67.50%, CDDCM achieved 78.62%, IDLM reached 76.61%. However, the proposed ADLM obtained 81.56% of F1 score in the same range. The F1 score is a valuable metric that helps measure the accuracy of a model’s predictions. In the context of Panama wilts disease identification, the F1 score can be used to evaluate how well a model is performing in classifying whether a given sample is infected or not. The F1 score combines precision and recall metrics to provide an overall measure of the model’s effectiveness. It is beneficial in cases where there is an imbalance in the dataset (e.g., a high number of negative samples and a low number of positive samples). The F1 score can determine which model is more accurate in classifying Panama wilts disease.
4.5. Overall Comparison
Table 6 expresses the overall comparison between the existing DLM-BDD, ASCM, CDDCM, IDLM, and proposed ADLM.
Figure 10 demonstrates the overall comparison between the existing and proposed models.
In a saturation tip, the currently proposed method reached 91.56% of accuracy, 91.61% of precision, 88.56% of recall, and 81.56% of F1 score. It has higher accuracy, precision, recall, and F1 score than previous methods.
- ⮚
Improved disease detection accuracy: Agro deep learning can provide more accurate and reliable disease detection compared to traditional methods of diagnosis. This can help reduce the risk of misdiagnosis and ensure a more accurate outcome.
- ⮚
Faster detection: Agro deep learning can detect diseases in a fraction of the time compared to traditional methods. This can help reduce the amount of time required to detect a disease and reduce the spread of the disease in an area.
- ⮚
Automation: Agro deep learning can automate the process of disease detection, eliminating the need for manual labor. This can help save time, resources, and money.
- ⮚
Cost-effectiveness: Agro deep learning can be more cost-effective than traditional methods of disease detection, as it requires fewer resources and less time to detect a disease.
- ⮚
Reduced dependence on expertise: Agro deep learning algorithms do not require expert knowledge to detect diseases. This can help reduce the need for costly expert labor in detecting and managing diseases.
The proposed agro deep learning model can identify the early signs of Panama wilts disease, allowing for early detection and prevention of further spread. It can identify subtle variations in leaf and stem characteristics, which can be used to identify and classify Panama wilts disease accurately.
5. Conclusions
The environmental changes that may be linked to Panama wilts disease, such as changes in soil composition and amounts of water present can be detected by the proposed agro deep learning model. It can be used to rapidly detect the presence of Panama wilts disease in large crops, allowing for quick and effective action to prevent further spread. In this proposed model, various image data of bananas are collected and processed. These activities enable the analysis of various image data from the crop period to the harvest period of bananas. The various methods available in this analytical method make it even more sophisticated. The currently proposed method reached 91.56% of accuracy, 91.61% of precision, 88.56% of recall, and 81.56% of F1 score. It has higher accuracy, precision, recall, and F1 score than previous methods. Panama wilt disease can be predicted with these data. These predictions allow disease severity to be determined, and preventive measures can be taken accordingly. In the future, this proposed method will be further improved by measures of its computational speed. By increasing its calculation speed, it is possible to analyze banana trees grown on sizeable agricultural land quickly. The proposed model’s further enhancements are to improve a more accurate and robust deep learning model using a more extensive and diverse dataset and incorporate data augmentation techniques such as cropping, flipping, rotating, and zooming to increase the scale and diversity of the dataset.; to explore transfer learning to benefit from the knowledge gained from related tasks such as image recognition and object detection and incorporate anomaly detection techniques such as one-class classification and auto encoders to identify novel patterns of disease progression; to develop more efficient and robust training techniques by exploring techniques such as curriculum learning and reinforcement learning and using generative adversarial networks (GANs) to generate more realistic and diverse images of disease progression; and to incorporate more sophisticated feature engineering techniques, such as using CNNs or RNNs, to extract more meaningful features from the raw data and utilize active learning techniques to reduce the annotation burden and improve the accuracy of the models.


 b; β′ = −α sin b + β cos


