Article

Evaluating the Performance of Flexible, Semi-Transparent Large-Area Organic Photovoltaic Arrays Deployed on a Greenhouse

1
Department of Biosystems Engineering, The University of Arizona, Tucson, AZ 85721, USA
2
Triangle Research and Development Center, P.O. Box 2167, Kfar-Qari 30075, Israel
3
Institute of Agricultural Engineering, Agricultural Research Organization, The Volcani Center, HaMaccabim Road 68, P.O. Box 15159, Rishon LeZion 7528809, Israel
*
Author to whom correspondence should be addressed.
AgriEngineering 2022, 4(4), 969-992; https://doi.org/10.3390/agriengineering4040062
Submission received: 17 September 2022 / Revised: 13 October 2022 / Accepted: 17 October 2022 / Published: 19 October 2022

Abstract

:
Agricultural greenhouses have been identified as a niche application for organic photovoltaic (OPV) integration, leveraging key performance characteristics of OPV technology, including semi-transparency, light weight, and mechanical flexibility. For optimal electrical design and performance assessment of greenhouse-integrated OPV systems, knowledge of the solar irradiance incident on OPV module surfaces is essential. Many greenhouse designs feature roof curvature. For flexible OPV modules deployed on curved greenhouse roofs, this results in a non-homogenous distribution of solar radiation across the module surfaces, which affects electrical output. Conventional modeling methods for estimating solar irradiance on a PV surface assume planarity, and therefore they are insufficient to evaluate OPV (and other flexible PV) installations on curved greenhouse structures. In this study, practical methods to estimate incident solar irradiance on curved surfaces were developed and then applied in an outdoor performance evaluation of large-area, roll-to-roll printed OPV arrays (3.4 m2 active area) installed on a gothic-arch greenhouse roof in Tucson, Arizona between October–February. The outdoor performance of six OPV arrays was assessed using the curved-surface modeling tools primarily considering the effect of irradiance on electrical behavior. The OPV arrays had an overall power conversion efficiency (PCE) of 1.82%, with lower PCE in the afternoon periods compared to morning and midday periods. The OPV arrays experienced an average 32.6% loss in normalized PCE over the course of the measurement period. Based on these results, we conclude that the higher performing OPV devices that are more robust in outdoor conditions coupled with accurate performance monitoring strategies are needed to prove the case for agrivoltaic OPV greenhouses.

1. Introduction

One promising strategy for achieving more sustainable food production is the integration of photovoltaic (PV) electricity with agricultural systems—a system design known as agrivoltaics [1]. Greenhouse crop production systems achieve higher annual yields per unit area using significantly less water compared to conventional farming. At the same time, greenhouses can be highly energy-intensive to operate depending on the hardware used in climate control systems and other growing operations [2,3]. Thus, for greenhouse agriculture in particular, increasingly seen a critical component in global food security, agrivoltaics can offer unique opportunities to enhance resource use efficiency, combining year-round food production within controlled environments and renewable energy generation on the same land footprint.
There are many potential strategies for the integration of PV into greenhouse systems involving a range of PV technologies and installation approaches [4]. Stand-alone, ground-mounted PV systems located adjacent to the greenhouse structure, utilizing conventional silicon PV panels, can offset greenhouse electrical demands in part or entirely [5,6]. However, this strategy does not explicitly fulfill the criterion for Agrivoltaic schemes, in which the footprint of the greenhouse and PV system are co-located. The mounting structure for the PV system is also separate from the greenhouse structure, adding to materials and cost. In response to these challenges, PV modules have been installed directly on greenhouse structures. Cossu and Murgia et al. [7] installed monocrystalline silicon PV modules to cover 50% of the roof area for a 960 m2 pitched-roof greenhouse, replacing the PVC cladding in that roof area with PV. The PV modules reduced annual solar radiation by 64% in the growing space and resulted in significant yield reduction in the shaded relative to the unshaded tomato crop as a result of the constrained light levels in those areas. In order to avoid excessive shading caused by roof-installed PV on greenhouses, the PV modules can be arranged with gaps in between to allow for partial sunlight penetration. Kavga et al. [8] showed that partial coverage (20%) of the glass-glazed greenhouse roof area with opaque PV modules did not significantly affect the growth of pepper plants. Less PV coverage of the greenhouse roof area, however, means lower electricity yields from the PV system. Moreover, the distinct PV shadow patterns that are cast on the greenhouse crops have been shown to result in non-uniform and reduced growth and yields [9].
While thin-film semi-transparent PV technologies are generally less efficient than conventional PV, greenhouses have been identified as a niche application for these devices. Theoretically, greenhouse structures clad in semi-transparent PV enable a more balanced and evenly distributed sharing of incident sunlight between the PV system for electricity generation and the crops growing underneath for photosynthesis [10]. A wide range of semi-transparent PV technologies have been demonstrated for this application, including spherical micro-solar cells [11], amorphous silicon panels [12], and dye-sensitized solar cells [13], and luminescent solar concentrator-based PV cells [14].
Semi-transparent organic PV (OPV) possesses unique advantages that make it a particularly promising technology for integration with greenhouse covers. The absorption of the organic semi-conductive materials can be tuned to absorb particular wavelength ranges, meaning that these devices can be spectrally engineered with high precision to optimize compatibility with the spectral needs of plants [15]. The low embodied energy of the solution-processable, semi-conductive polymers that constitute the OPV active layers means significantly lower energy and carbon payback periods for OPV compared to conventional PV technologies [16,17]. Additionally, OPV cells can be deposited onto a variety of different substrates, including flexible plastics that are already widely used for greenhouse covering materials around the world.
Several recent studies have analyzed energy generation, economic costs, and environmental impacts associated with OPV-integrated greenhouses. Okada et al. [18] simulated lettuce crop yield and electric energy production under various OPV film (nominal 3.3% PCE at standard test conditions) coverage ratios in a 140 m2 greenhouse, equipped with wet-pad and fan cooling system, and natural gas-based heating, located in Tucson, Arizona. The study estimated that approximately half (49%) OPV roof coverage was sufficient to meet both desired yields and energy demand of the off-grid greenhouse lettuce crop production system modeled in this study. Ravishankar et al. [19] carried out an energy-balance modeling analysis comparing three different locations/climates in the U.S., and found Arizona to be the most viable location for OPV-integrated greenhouses. The model used an OPV device efficiency of 10% and a stand-alone gable-roof greenhouse (218.6 m2), with 85% of the roof covered by active OPV area. It is shown that the monthly generated electricity from the OPV devices exceed the monthly energy requirements for a greenhouse tomato production system in an arid, high-light intensity region. Hollingsworth et al. [20] determined that if there is not significant reduction in crop yields due to shading effects, OPV-integrated greenhouse design can offer reductions in the environmental burden of greenhouses at competitive costs compared to non-PV powered and silicon-PV (Si-PV)-powered greenhouses.
While these are exciting future prospects for greenhouse-integrated OPV, the commercial potential of this design concept is ultimately determined by technologies that are proven viable for large-area fabrication; the most commercially advanced method for large-area OPV devices is roll-to-roll (R2R) processing, which produces flexible OPV devices deposited on thin-film plastic substrates. One of the most foremost challenges in the OPV market is translating research cell (typically ~1 cm2 in size) performance to the module scale (>800 cm2). The constraints imposed by R2R processing limit the types of materials and device architectures that can be used in OPV module fabrication [21]. Furthermore, compared to the highly controlled laboratory conditions in which research cells are made, the ambient environment in which large-area R2R-processed OPV modules are produced often means sub-optimal production conditions that result in lesser quality and performance. The commercial competitiveness of OPV technology is also limited by lifetime: on a fundamental level, organic semiconductors are prone to light- and oxygen-induced degradation in ambient conditions, which can result in substantial performance losses [22]. For large-area OPV modules, and particularly with flexible OPV which uses thin plastic substrates/encapsulation materials, the diffusion of water and oxygen gas through these layers, as well as the mechanical stresses experienced by the devices in outdoor conditions, can and has been shown to result in rapid electrical and mechanical failure [23,24]. Due to these challenges, large-area OPV modules have only entered the commercial market in the past 5–10 years. Coinciding with this development, only recently have experimental studies testing large-area OPV modules for greenhouse applications emerged.
Friman-Peretz et al. [25] analyzed large-area, R2R-printed, semi-transparent OPV modules in the context of their potential to function as a greenhouse cover material. While having relatively low transmittance (~20%) in the photosynthetically active radiation (PAR) range, which is the radiation energy that primary drives photosynthesis in plants and included wavelengths between 400–700 nm, the OPV modules, which were laminated in PET plastic foil, had a U-value of 6.0 W m−2 K−1, which is comparable to the typical U-values for glass or polyethylene film greenhouse cover materials. It was also determined that, despite the low power conversion efficiency (PCE) measured in the OPV devices (1–2%), a 1 ha greenhouse entirely covered by OPV with this efficiency would provide approximately 2.4 × 10⁵ kWh annually (2.4 kWh m−2 year−1), more than compensating for the electricity required to operate a greenhouse with a mechanical ventilation system. The authors cited cost and device lifetime as limiting factors for the commercial applications of OPV to greenhouses.
The outdoor electrical performance of OPV installed on a polytunnel greenhouse in a Mediterranean climate was evaluated by Magadley et al. [26], in which three OPV panels, each ~1 m2 in size, were monitored for 12 weeks from October to January. The effects of different solar irradiance conditions, incidence angles, and temperature on OPV device performance were analyzed, in addition to monitoring the degradation of the OPV panels over the course of the measurement period. It was found that high incident irradiance resulted in lower fill factors and efficiency performance in the OPV panels. The OPV panel at the top ridge of the greenhouse roof, which received the highest cumulative solar energy, had the highest energy output of all panels monitored. However, the authors noted that positioning OPV panels at different locations on the greenhouse roof, thus resulting in varied solar radiation exposure over the course of the day, would be a design advantage for more distributed diurnal power production.
The mechanical flexibility of OPV allows for conformity onto any curved/irregular structure, including building facades, textiles, vehicles, and greenhouses. This key technical feature of OPV also can be an advantage in terms of solar energy collection; it has been demonstrated that curved PV surfaces are able to capture more solar energy on the same two-dimensional footprint compared to planar surfaces [27]. However, several challenges have been identified with non-planar PV systems. These include the differences in photocurrent generated in cells with varying solar irradiance exposures along curved PV modules/strings/arrays, which can result in electrical mismatch across the system, and consequently a reduction in energy harvest. This problem is especially critical for building-integrated PV (BIPV) systems, in which the façade geometries can be quite complex, and neighboring buildings can create significant shading on different portions of the PV surface [28]. To address these challenges, recent studies have proposed methods for parameterized simulations of flexible BIPV installations on arbitrarily curved surfaces, considering shading and reflection effects introduced by neighboring buildings, in order to determine optimal module arrangements and electrical design configurations [29].
For applications of flexible PV on curved greenhouse structures, several of the challenges involved in BIPV system modeling are irrelevant. First, greenhouses are located in open spaces with unobstructed view of the sun, and therefore shading of the PV system by neighboring structures is not an issue, as it is in urban BIPV scenarios. Moreover, although the design of greenhouse structures can differ significantly [30], curvature generally only rotates around a single-axis and is symmetrical, which simplifies modeling of the greenhouse surface, and, by extension, the flexible PV modules that are conformed to it.
Given the growing interest in the integration of flexible PV, and particularly OPV, with greenhouse structures, there is a need for practical tools that can used to assess the performance of these technologies and find optimal design strategies. For large-scale greenhouse-integrated OPV installations, the modules will be connected together in strings/arrays for energy harvest. Hirata et al. [31] used model-scale (40 cm by 60 cm) greenhouses oriented north-south with transparent serially connected OPV modules (30 cm by 21 cm) installed in different arrangements: north-south orientation, east-west orientation, and a horizontal plane for reference. The study compared the relative output of OPV modules in these orientations and found that the output of the east-west modules was almost the same as the output of the module arranged on the horizontal plane, while the north-south modules had a smaller relative output, due to effects on the I-V curve of the north-south modules caused by shading. Despite the growing body of research evaluating OPV technology for greenhouse applications, there is an absence of data on the performance of greenhouse-integrated OPV devices that extend beyond the module scale. In part, this is due to the challenges in specifying irradiance conditions on a curved PV surface and relating these to electrical measurements of the connected PV device at a high temporal resolution. It is critical that evaluations of OPV modules in operational conditions continue, in order to better understand the nuances involved in electrical performance in varying environmental conditions and associated degradation mechanisms. However, with rapidly advancing commercialization of OPV technology, the road is now paved for large-scale applications, including greenhouse integration, in which string and array-level performance will become an increasingly relevant concern.
In this study, we present a practical method for modeling the solar irradiance conditions on curved, greenhouse-integrated OPV surfaces utilizing open-source solar modeling software. The modeled incident irradiance is then related to electrical data measured over a 5-month period (October–February) of large-area, semi-transparent OPV arrays deployed on a gothic-arch greenhouse in an arid climate (Tucson, Arizona). In doing so, the outdoor performance of the curved OPV arrays deployed on a greenhouse, primarily considering the effect of incident irradiance, was assessed.

2. Materials and Methods

This section begins with a description of the physical and electrical aspects of the OPV arrays that were used in this study (Section 2.1), followed by a description of the greenhouse onto which the OPV arrays were installed (Section 2.2), and the data collection system used for OPV electrical monitoring (Section 2.3). We then present the 3-D surface modeling of the curved OPV arrays on the study greenhouse (Section 2.4). The surface properties of the OPV rolls, along with measured solar irradiance data coinciding with current-voltage (I-V) measurements of the OPV rolls, are inputs for the solar modeling program, which is used to calculate the solar irradiance incident on the curved OPV surface (Section 2.5).

2.1. OPV Device Characterization

The study devices were flexible, R2R-printed, semi-transparent OPV cells (PBTZT-stat-BDTT-8 active layer) (ARMOR Solar Films, Germany). Berny et al. [32] discuss the material architecture and operational principles of the OPV devices in detail. In each 0.8 × 1 m OPV panel there were 4 serially connected OPV module strings, each containing 10, 0.0125 m × 0.066 m serially connected cells of photoactive organic film separated by 0.0025 mm gaps, or ‘dead area’ (Figure 1). The ratio of active area to dead area in each OPV panel is 75.8%; this quantity is known as the geometric fill factor (GFF).
Each OPV array was comprised of eight OPV panels connected in parallel to form measures 6.4 × 1.0 × 0.006 m and weighs approximately 6 kg (Figure 2). Thus, for each OPV array, there are 8 panels, 32 modules, and 320 cells. The technical specifications and nominal ratings for the OPV array are provided in Table 1.

2.2. Study Greenhouse

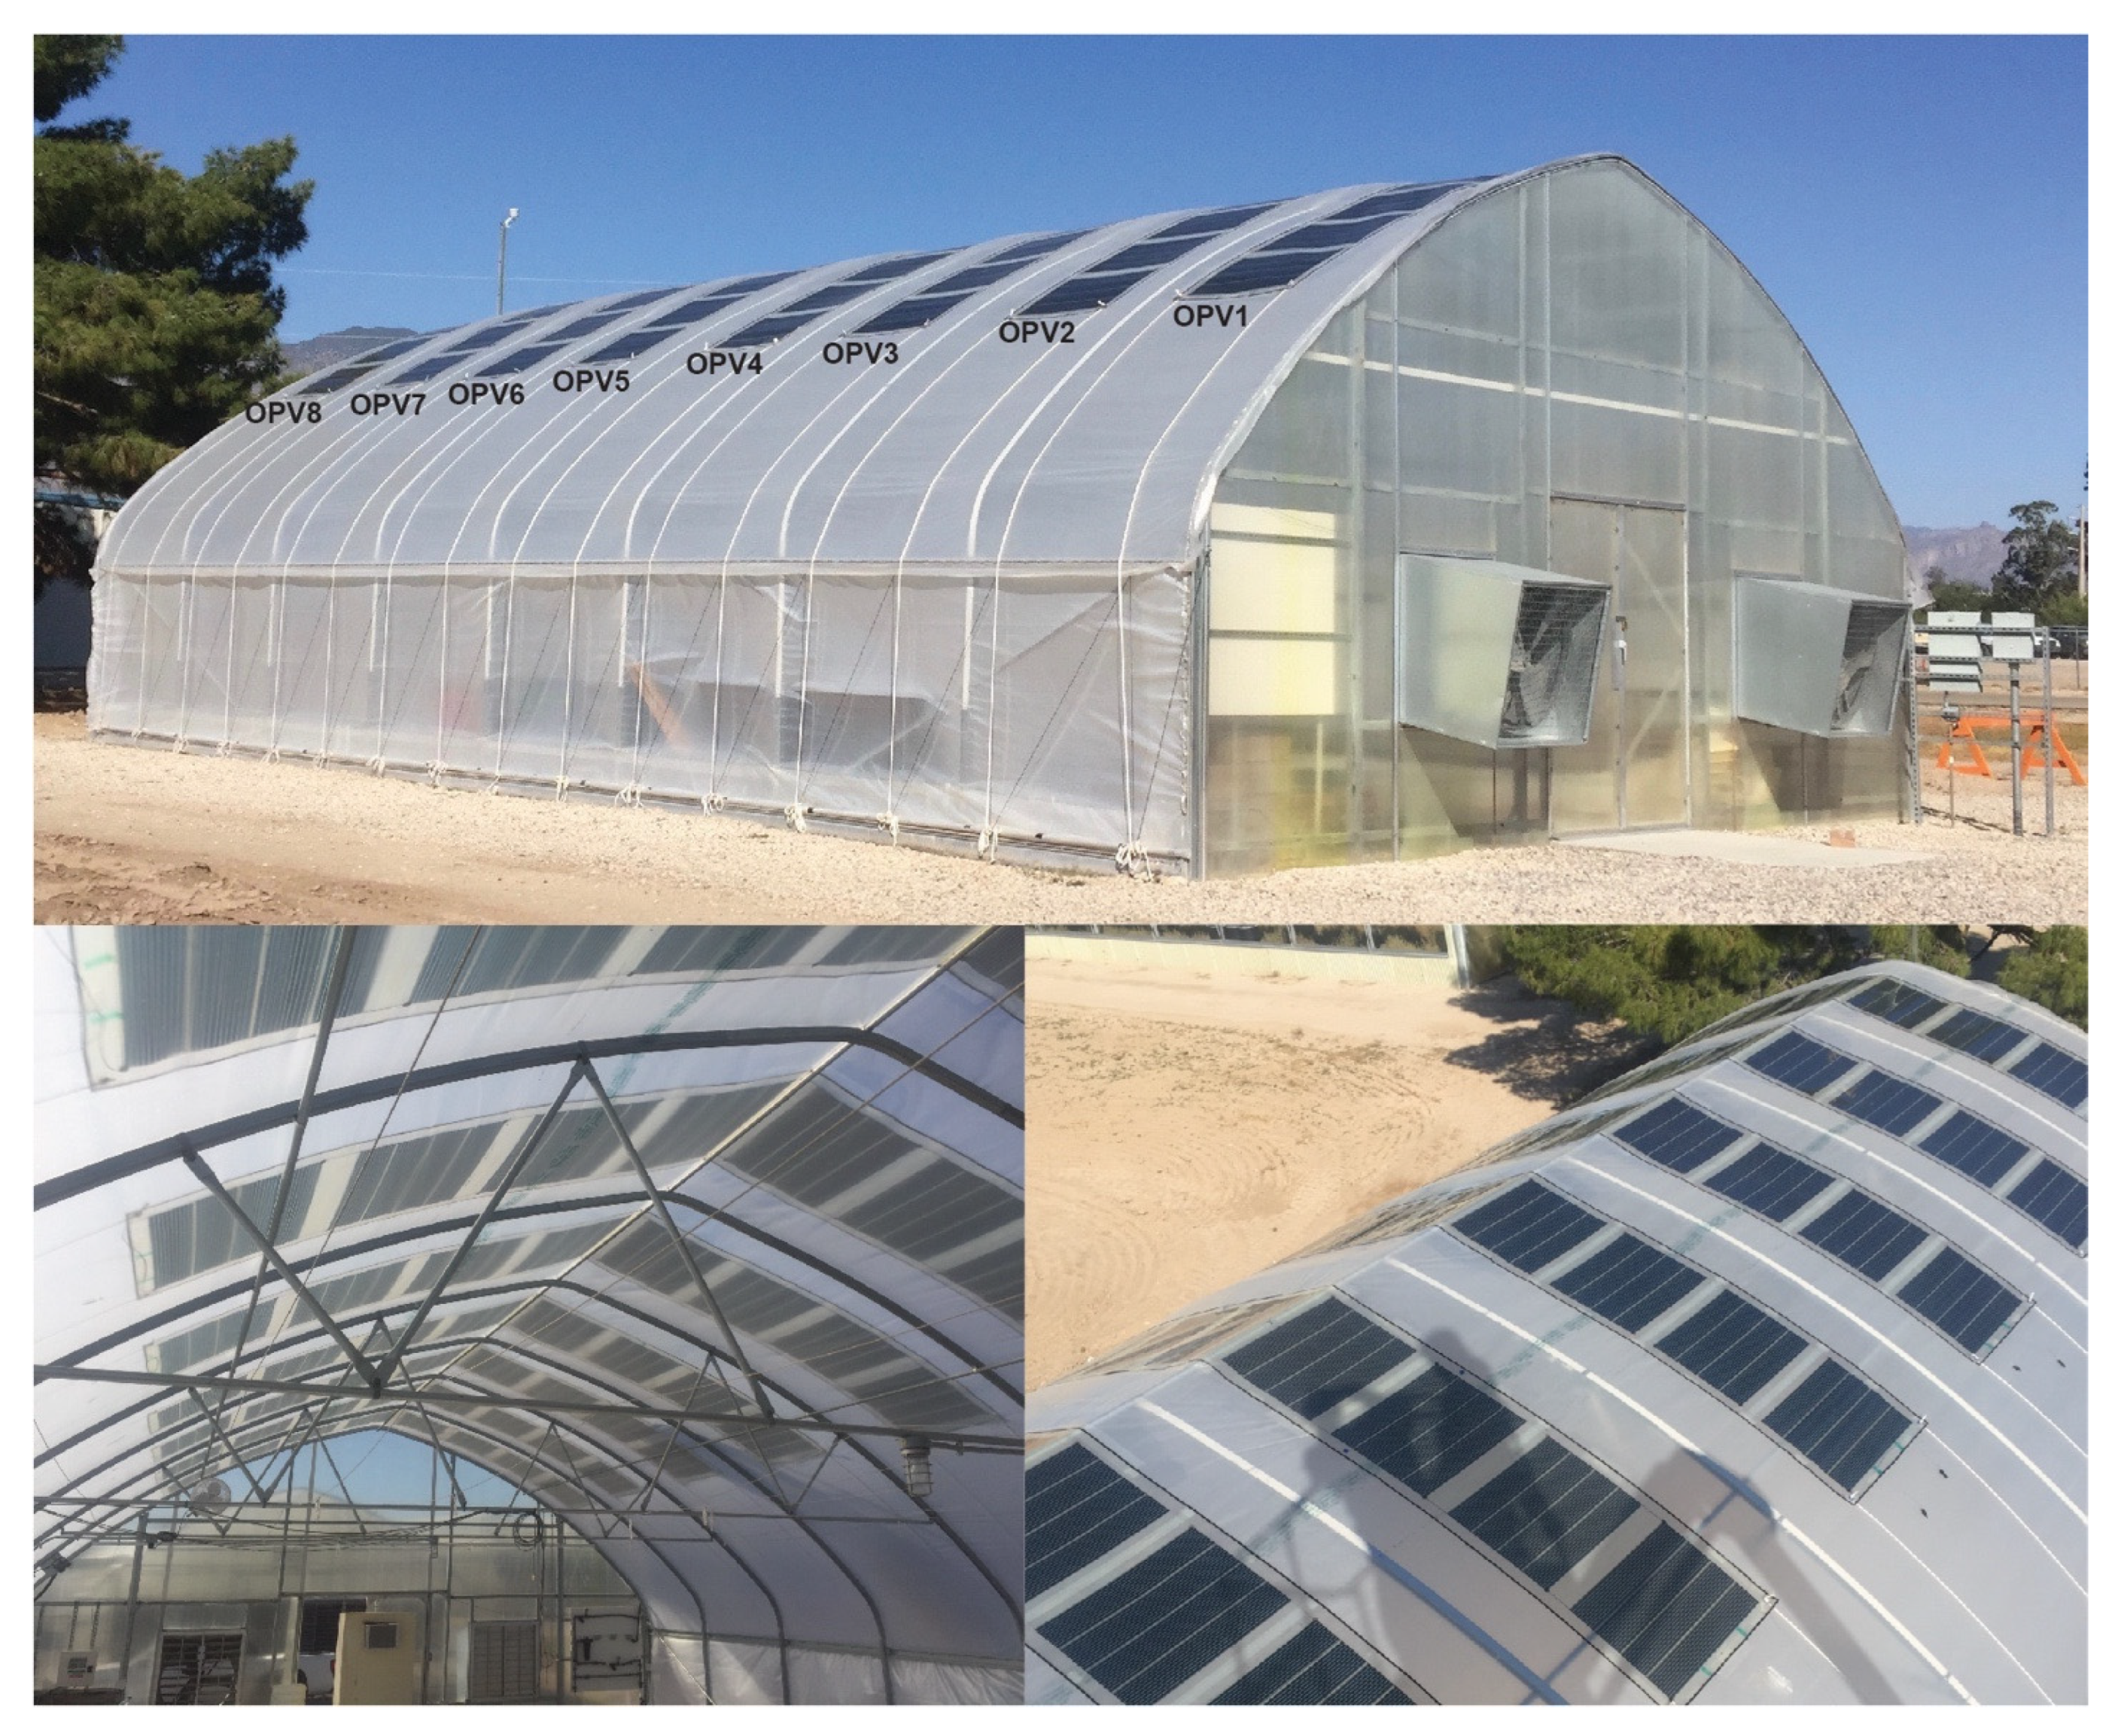
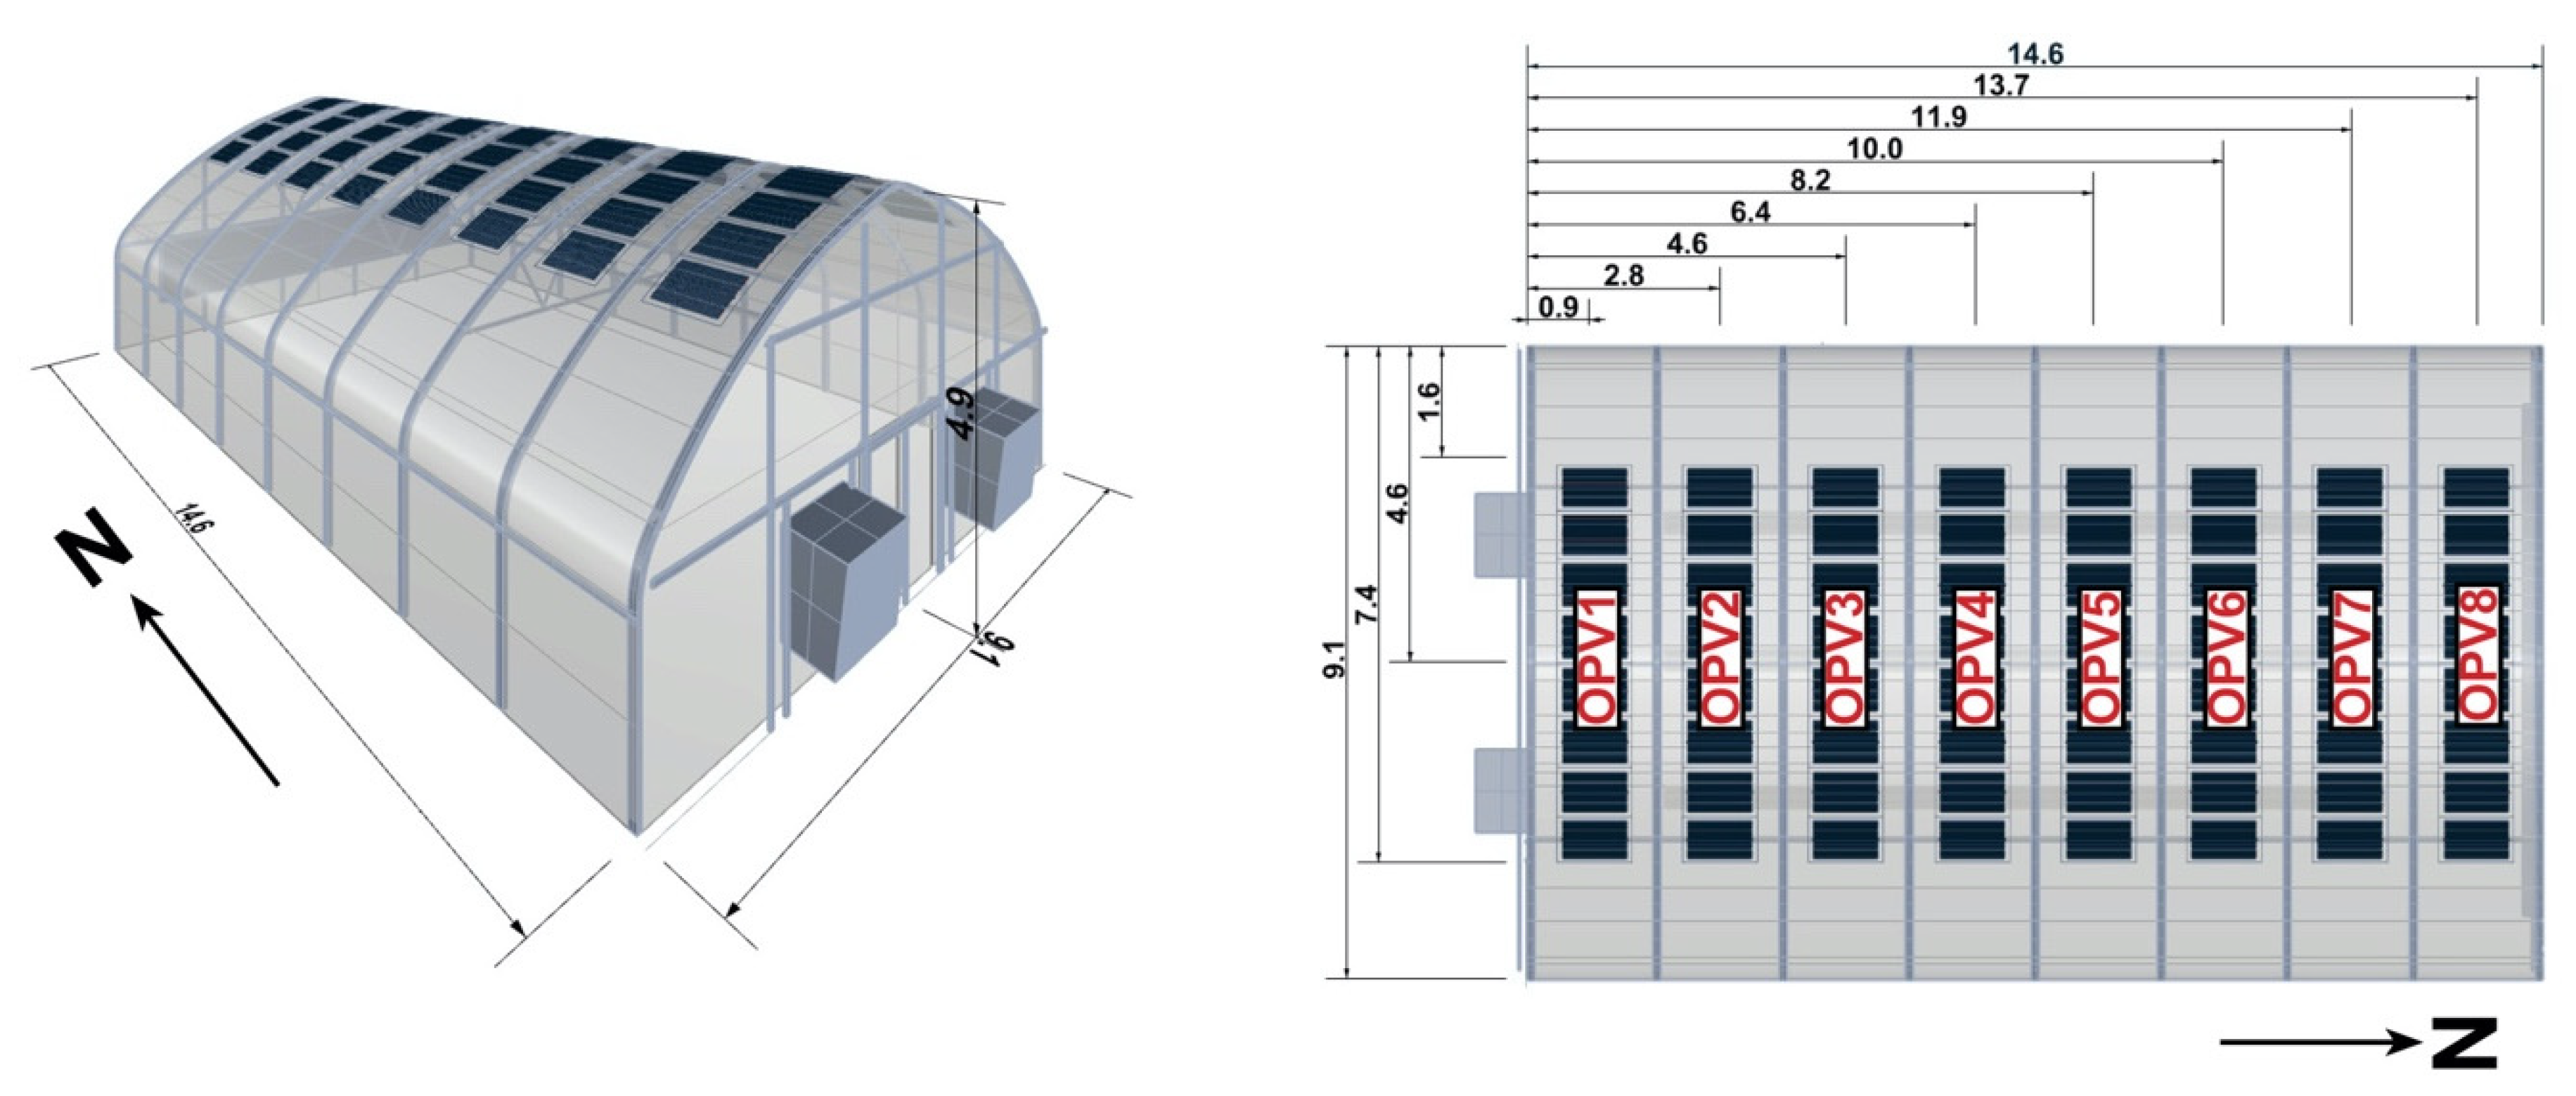
Figure 3 shows the high tunnel greenhouse used in this study, located at Controlled Environment Agriculture Center at the University of Arizona, Tucson, Arizona (latitude: 32°16′ N, longitude: 110°56′ W, altitude: 728 m) with true north-south orientation. The structure was 9.1 × 14.6 m, gothic-arch roof profile, with 1.8 m sidewalls and 4.9 m height at the roof apex (Golden Pacific Structures, Cincinnati, OH, USA). The greenhouse roof material was a double-layer, air-inflated 8mm polyethylene plastic film. Eight OPV arrays were installed and secured on the greenhouse roof using LDPE tape and nylon cord tie-downs. Each OPV array was centered on the apex of the greenhouse roof, positioned equidistantly along the length of the greenhouse, four panels per array (or 16 modules, or 160 cells) on the east pitch of the roof, and four panels on the west pitch of the roof. The true east-west orientation of the OPV arrays meant that the east-facing and west-facing active areas were receiving largely the same incident irradiance exposure before and after solar noon on days in which sky conditions (i.e., presence/extent of cloud cover) did not change significantly between morning and afternoon periods. The electrical leads for each OPV array were located on the east side of the greenhouse. The OPV3 and OPV8 arrays had either erratic electrical behavior or malfunctioning and thus were not considered in performance evaluation.

2.2.1. Environmental Data

A climate station located on the greenhouse roof apex measured relative humidity and ambient air temperature (HMP60, Vaisala, Vantaa, Finland), and horizontal shortwave irradiance with a pyranometer (SP-510, Apogee Instruments, Logan, UT, USA).

2.2.2. Solar Irradiance Data

The solar modeling work presented in this study utilized several components of solar radiation: direct normal irradiance (IDNI), diffuse horizontal irradiance (IDHI), and global horizontal irradiance (IGHI). A proximal climate station (University of Arizona OASIS, latitude: 32°23′ N, longitude: 110°96′ W) was used for solar irradiance data in this study [33]. IDNI is measured with a pyroheliometer (CHP1, Kipp & Zonen B.V., Delft, The Netherlands) mounted to a sun tracker (SOLYS2, Kipp & Zonen B.V., Delft, The Netherlands); IDHI with a pyranometer (Eppley Black & White, Eppley Laboratory, Inc., Newport, RI, USA) mounted under a shading ball attached to another sun tracker; IGHI with a pyranometer (CMP22, Kipp & Zonen B.V., Delft, The Netherlands). The climate station data has up to 1-min temporal resolution, and these data were inputs for the solar modeling program used to calculate the incident solar irradiance on the OPV array devices.

2.3. OPV Array Electrical Data Collection

2.3.1. I-V Curve Measurement System

An automated current-voltage (I-V) curve measurement system was designed and programmed in the Python programming language. This system used serial communication between a laptop PC and a DC programmable electronic load device (8542B, BK Precision, Yorba Linda, CA, USA). The electronic load measured the I-V curve of the connected OPV array every 10 min during daylight hours (6:00–18:00h). The I-V curve measurements of the OPV arrays enable the determination of the maximum power point (Pmax, in W) of the device, which occurs at the point in the I-V curve when the product of I and V (which equals P) is at a maximum. Knowing the open-circuit voltage (VOC), short-circuit current (ISC), and Pmax, the fill factor (FF) of a PV device can be calculated using the following equation:
FF =   P max V OC   ×   I SC
The FF of a PV device describes how closely the maximum power production comes to the boundaries of power production, which is set by the VOC and ISC; a high FF is desirable. A key performance metric for a PV device is the power conversion efficiency (PCE, in %), which is:
PCE = P max I T   ×   A c
where IT is the total incident irradiance (in W m−2), and AC is the area of the collector (in m2). For the OPV arrays used in this study, AC is equal to the active area (3.4 m2). IT is typically measured using solar radiation sensors in the same plane of array (POA) as the PV module; determining IT for curved PV modules, such as the OPV arrays used in this study, requires a different approach, which will be described in the subsequent sections. The electronic load device was capable of measuring one OPV array at a time, holding the connected array at Voc in between measurements. The OPV4 array was deployed on the greenhouse beginning 2 October 2019 and was continuously monitored until the remaining seven OPV arrays were deployed (28 October 2019). On this day, initial I-V curve measurements were taken around midday (IGHI: 771 ± 24 W m−2) of the OPV arrays by sequentially connecting/disconnecting each OPV array to the I-V curve measurement system. After this, each OPV array was connected to the I-V curve system for 1–3 days of measurement and then disconnected. The measurement period concluded on 19 February 2020. Individual I-V curve measurements of each OPV array were also taken around midday on 16 February 2020 (IGHI: 759 ± 25 W m−2). The normalized PCE (PCEn) of a PV device is used to evaluate its performance and stability over time, and can be calculated using the following equation:
PCE n = PCE measured PCE initial   ×   100
where PCEmeasured is the measured efficiency of a device, calculated using Equation (2), and PCEinitial represents initial efficiency of the device when first deployed. Thus, for all OPV arrays except OPV4, the I-V curve measurements taken on 28 October 2019 represent the initial PCEn (PCEn,initial, which is always equal to 1.0); the I-V curve measurements taken on 16 February 2020 represent the final PCEn (PCEn,final). The difference between PCEn,initial and PCEn,final gives a general idea of the degradation that occurred in the OPV arrays during the measurement period. More detailed analysis is provided on the stability and degradation behavior of OPV4, since it was monitored continuously for the first 25 days of its deployment, and then intermittently monitored for the following 18 weeks (totaling over 3300 h of exposure). In the analysis the OPV4 array performance is reported for the 1 November 2019–9 February 2020 measurement period unless otherwise indicated. For this measurement period, 14 days of data collection are reported for each OPV array, totaling 84 days of data collection for all OPV arrays.

2.4. Modeling of Curved OPV Arrays on Greenhouse

Figure 4 shows a 3-D model of the study greenhouse with eight OPV arrays installed on the roof. The model was developed in a Rhinoceros CAD/Grasshopper environment, based on scaled drawings of the greenhouse structure provided by the manufacturer, and the OPV array schematic shown in Figure 2.
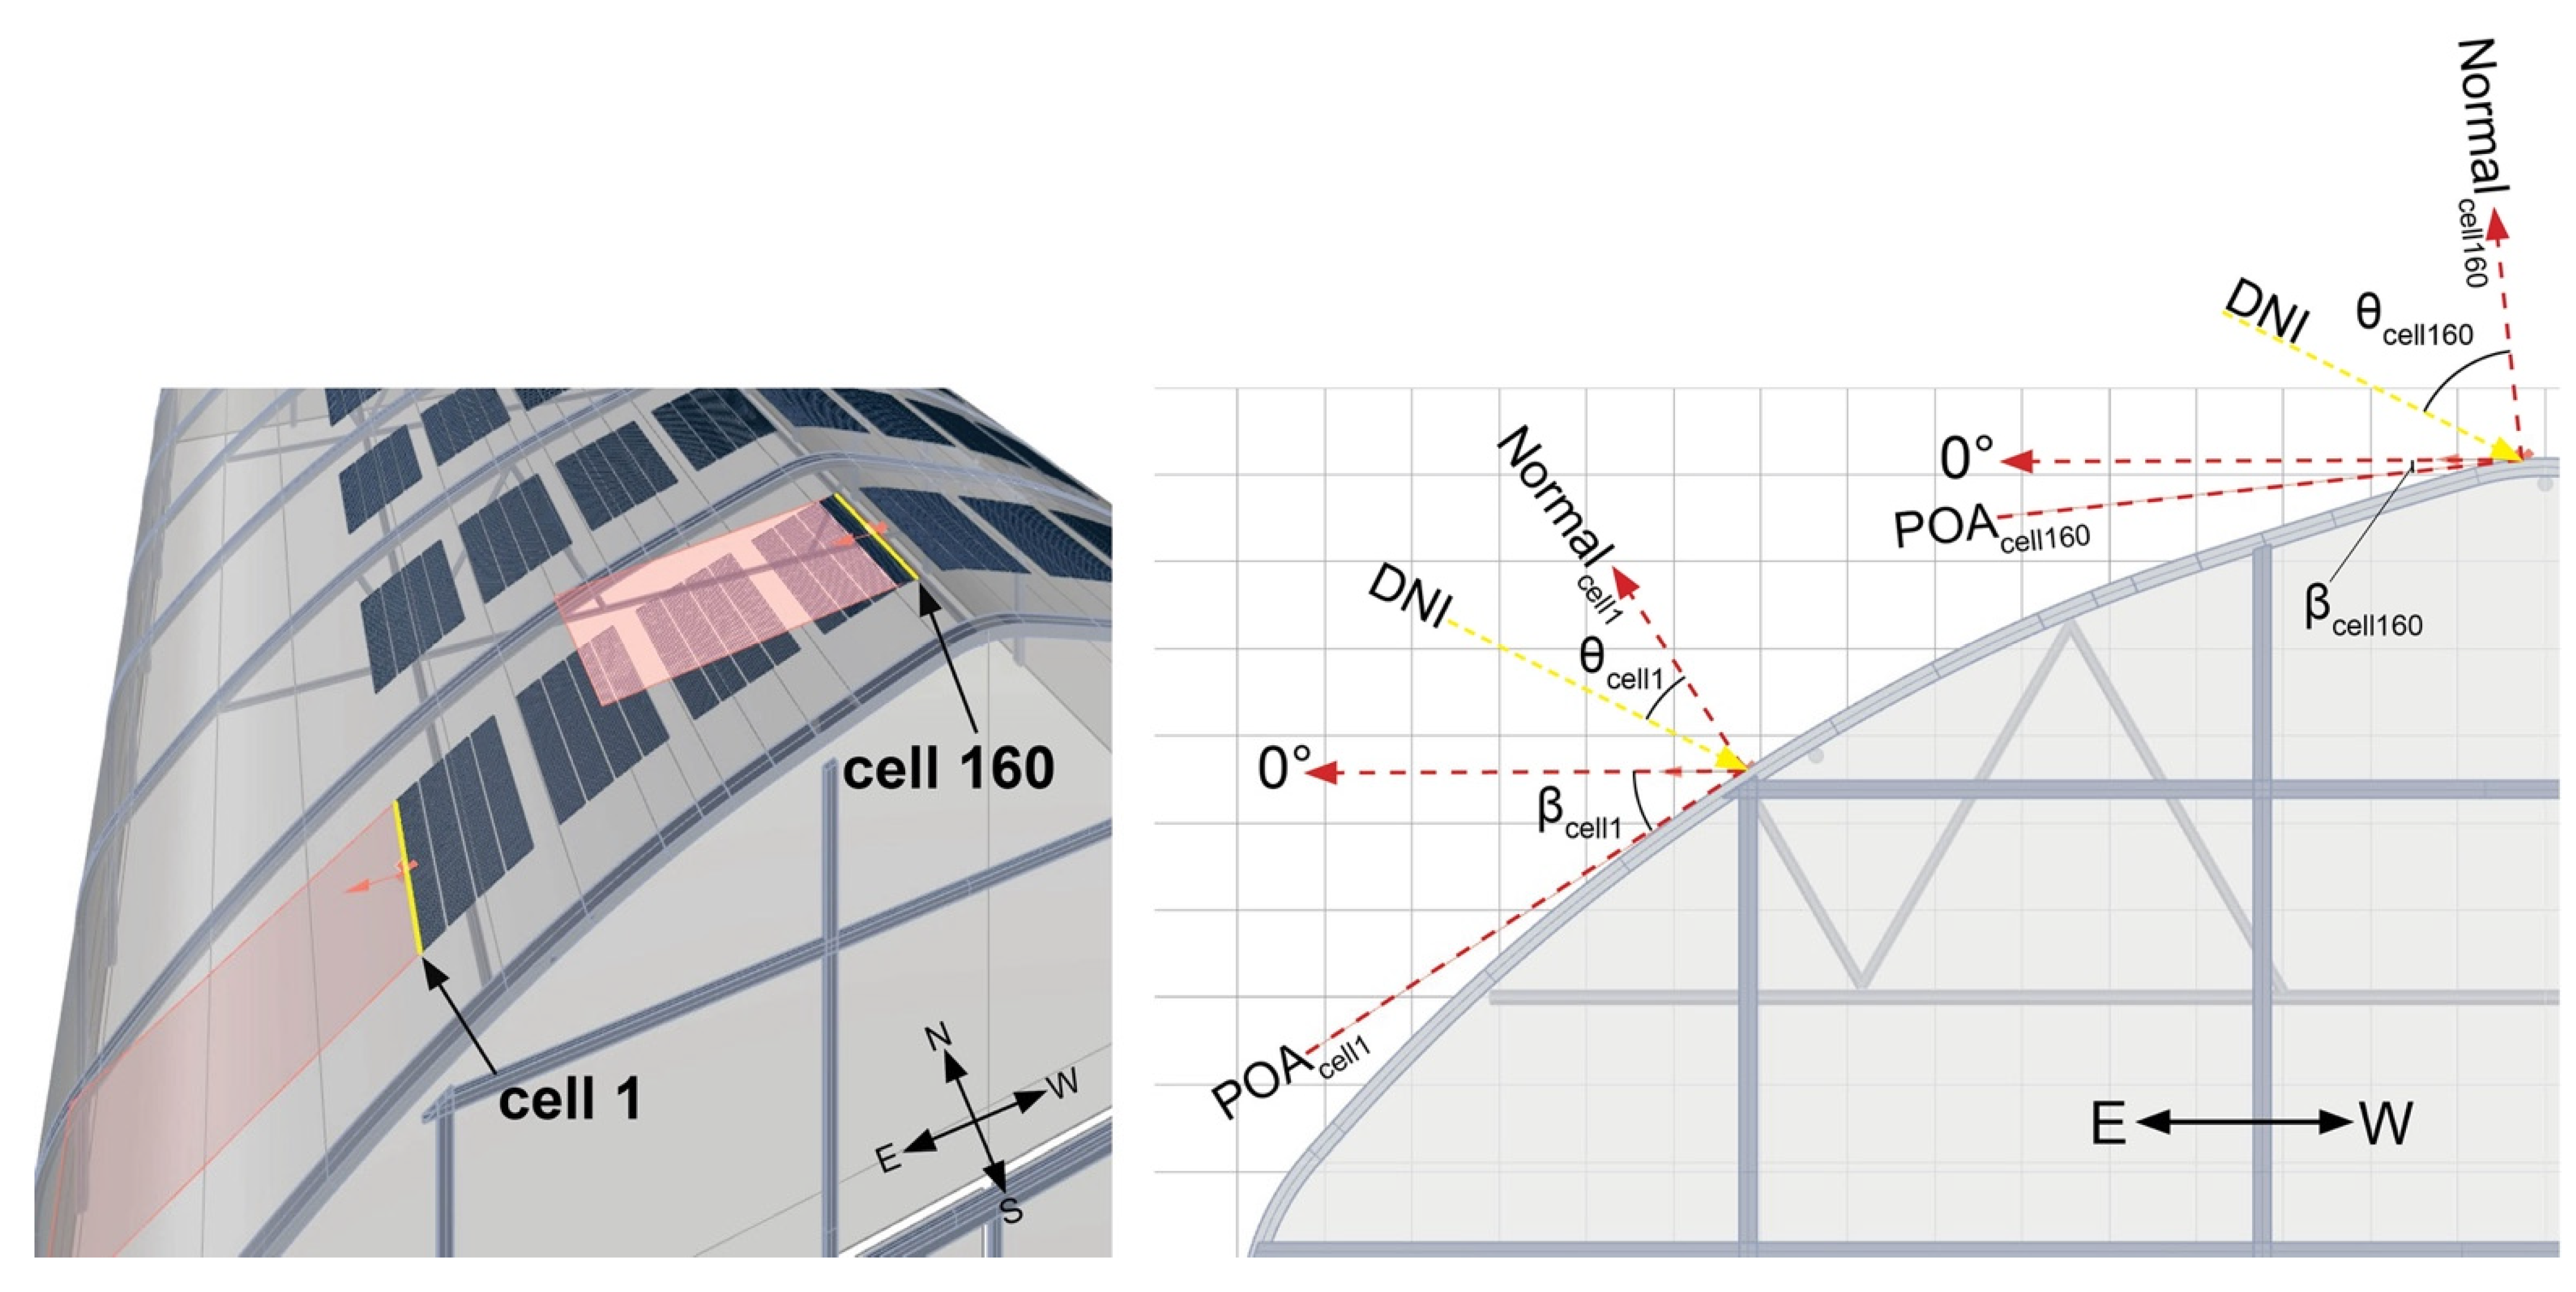
The angle of incidence ( θ ) is the angle between the direct radiation on a surface and the normal to that surface and must be determined in order to calculate the irradiance incident on a surface. The equation used for calculating θ considers the surface angle, position, and solar position:
cos θ = cos θ z cos β + sin θ z sin β cos ( γ s -   γ )
where θ z is solar zenith angle, β is the surface tilt angle (from the horizontal), γ s is the surface azimuth angle, and γ is the solar azimuth angle. For a planar surface, determining θ is straightforward, due to there only being a singular plane of array (POA), and thus singular values for all variables in Equation (4). For a surface with curvature, there are varying angles of β and γ s which must be accounted for. This can be accomplished by partitioning the surface into smaller sub-sections with assumed local planarity [34] and then finding β and γ s for each sub-section. Differential methods can be used to segment the curved surface into an arbitrary number of sub-sections, with the idea that decreasing the size of each subsection area results in a better approximation of the surface. However, since the cell is the smallest functional component of a PV device, restricting the area of these subsections to approximate the size of individual cells has been demonstrated as a practical approach for modeling curved PV surfaces [27,28,29,35]. Therefore, the curved OPV array surface was partitioned into 320 planar subsections, which correspond to the area (equal to 82.5 cm2) and position of the 320 OPV cells in the array.
The planar subsections, hereafter referred to as ‘cells’, of the OPV array were defined in the Grasshopper programming environment as a set of multiple planar Surface Objects. Using the Area Properties and Evaluate Surface functions, β and γ s were then determined for each planar cell surface. Note that due to the symmetry of the greenhouse roof profile, the values of β are mirrored along the longitudinal axis of the greenhouse. Due to the true-north south orientation of the greenhouse, and the east-west orientation of the OPV arrays, the values of γ s were either 90° (for east-facing cells) or 270° (for west-facing cells). Values for β along either side of the greenhouse roof differed by as much as 26.5° (6.2° for the cell nearest the roof apex, and 32.7° for the cell nearest the ground), shown in Figure 5. The surface properties, which included the cell identifier (‘1’ corresponding to the eastern-most cell, and ‘320’ corresponding to the western-most cell) and its corresponding β , and γ s values were outputted into a .csv file. For PV modeling and performance assessment purposes, each of these cells can be considered as a distinct POA, with a corresponding β and γ s .

2.5. Modeling Incident Solar Irradiance on the Curved OPV Array Surface

The pvlib-python© library is an open-source set of documented functions for solar modeling and simulation of PV system performance [36]. The solarposition.py and irradiance.py modules within pvlib-python were used for modeling solar irradiance conditions on the curved surface of the OPV arrays deployed on the greenhouse; the methodology for the process is described in Figure 6.
The solar position—specifically, θ z and γ —for the time (minute) of each I-V curve measurement taken on any OPV array was calculated using the get_solar_position function in the solarposition.py module. The angle of incidence, θ , was then calculated for each cell surface. Then, using the get_total_irradiance function from the irradiance.py module, the total (IT), direct (i.e., ‘beam’, IB), diffuse (ID), and reflected (IR) irradiance components incident on each cell were calculated to give IT,cell, IB,cell, ID,cell, and IR,cell. Due to the discontinuity of the solar model beyond θ = 90°, for any OPV cell surface at which θ > 90° (which means the sun is positioned behind the surface) during an I-V curve measurement, the incident irradiance was assumed to be negligible, relative to the irradiance incident on the front side of the OPV array surface [37].
The values of each irradiance component for each cell were then summed to determine the irradiance incident on the entire curved OPV array surface to give IT,array; IB,array; ID,array; and IR,array. The cell identifier also indicates the specific module, or panel, along the OPV array in which a cell is located (e.g., cells 1–40 belong to Panel 1 on the east side of the greenhouse; and cells 280–320 belong to Panel 8 on the west side of the greenhouse), and this enables the calculation of incident irradiance on an individual module; panel; or other specified area basis
In the get_total_irradiance function within the irradiance.py module, the user can specify one of five models to use in estimating the solar irradiance incident on the surface of interest. These models include the isotropic diffuse, (i.e., Lui and Jordan), Klucher, Hay and Davies, Reindl, and Perez models, all described in detail in Loutzenhiser et al. [38]. Each of these methods has been widely used and validated in the literature. In this analysis, the Perez model was utilized [39], which has been shown to be a highly accurate method and validated for short-time step solar energy data, particularly when the measured solar radiation components (IGHI, IDNI, and IDHI) are available for the location of interest [38]. The Perez model estimates total solar irradiance incident on a planar surface by considering the direct, diffuse, and reflected irradiance:
I T = I DNI cos θ + I DHI [   ( 1 -   F 1 ) (   1 + cos β 2   ) + F 1 a b + F 2 sin β   ] + I GHI   ρ g   (   1 - cos β 2   )  
where the first term accounts for the direct component IB. The second term accounts for the diffuse component; F1 and F2 terms as circumsolar and horizon brightness coefficients, respectively, and the a and b terms account for the incidence angle of circumsolar radiation [39]. Perez model coefficients derived specifically for Phoenix, Arizona, which is proximal to the site of the current study, were used. These coefficients are included in the irradiance.py module, among other sets of coefficients for various locations, and a composite set averaging all locations where the model was validated. The third term accounts for the radiation reflected from the ground for a surface tilted at slope β , with (   1 - cos β 2   ) being the view factor to the ground, and ρ g being the ground reflectance ratio (i.e., albedo). For this study, the value of ρ g is assumed to be 0.225, an experimentally determined value for the study site area, which was surrounded by dry dirt [40].
To summarize this approach, in order to evaluate the irradiance conditions on flexible OPV arrays deployed on a curved greenhouse roof surface, CAD tools were used to partition the curved OPV array surface into smaller, planar subsections corresponding to the OPV cell areas. The surface tilt angle and surface azimuth angle for each cell subsection was then determined, which then enabled the calculation of incident irradiance on each cell surface using a solar modeling program, coinciding with the time of each I-V measurement taken on an OPV array. Thus, calculated incident solar irradiance on curved OPV arrays installed on the greenhouse roof was related to measured electrical performance, which allows for the evaluation of the OPV array performance in varying irradiance conditions.

3. Results and Discussion

We begin this section showing the functionality of the proposed modeling methods in characterizing the solar irradiance conditions incident on the curved OPV array surfaces on the greenhouse roof (Section 3.1). We then apply these methods to analyze the measured electrical performance of the six OPV arrays over the course of the five-month measurement period, focusing on the effects of incident irradiance on key electrical performance parameters (Section 3.2). We conclude with a discussion of the degradation and reliability of the OPV arrays. Although the effect of module temperature on OPV array performance is not explicitly investigated in this study, we recognize the major role of this parameter in dictating the dynamic performance of PV devices and highlight its potential effects in the analysis of greenhouse-integrated OPV array performance where it may be relevant.

3.1. Irradiance Model Functionality

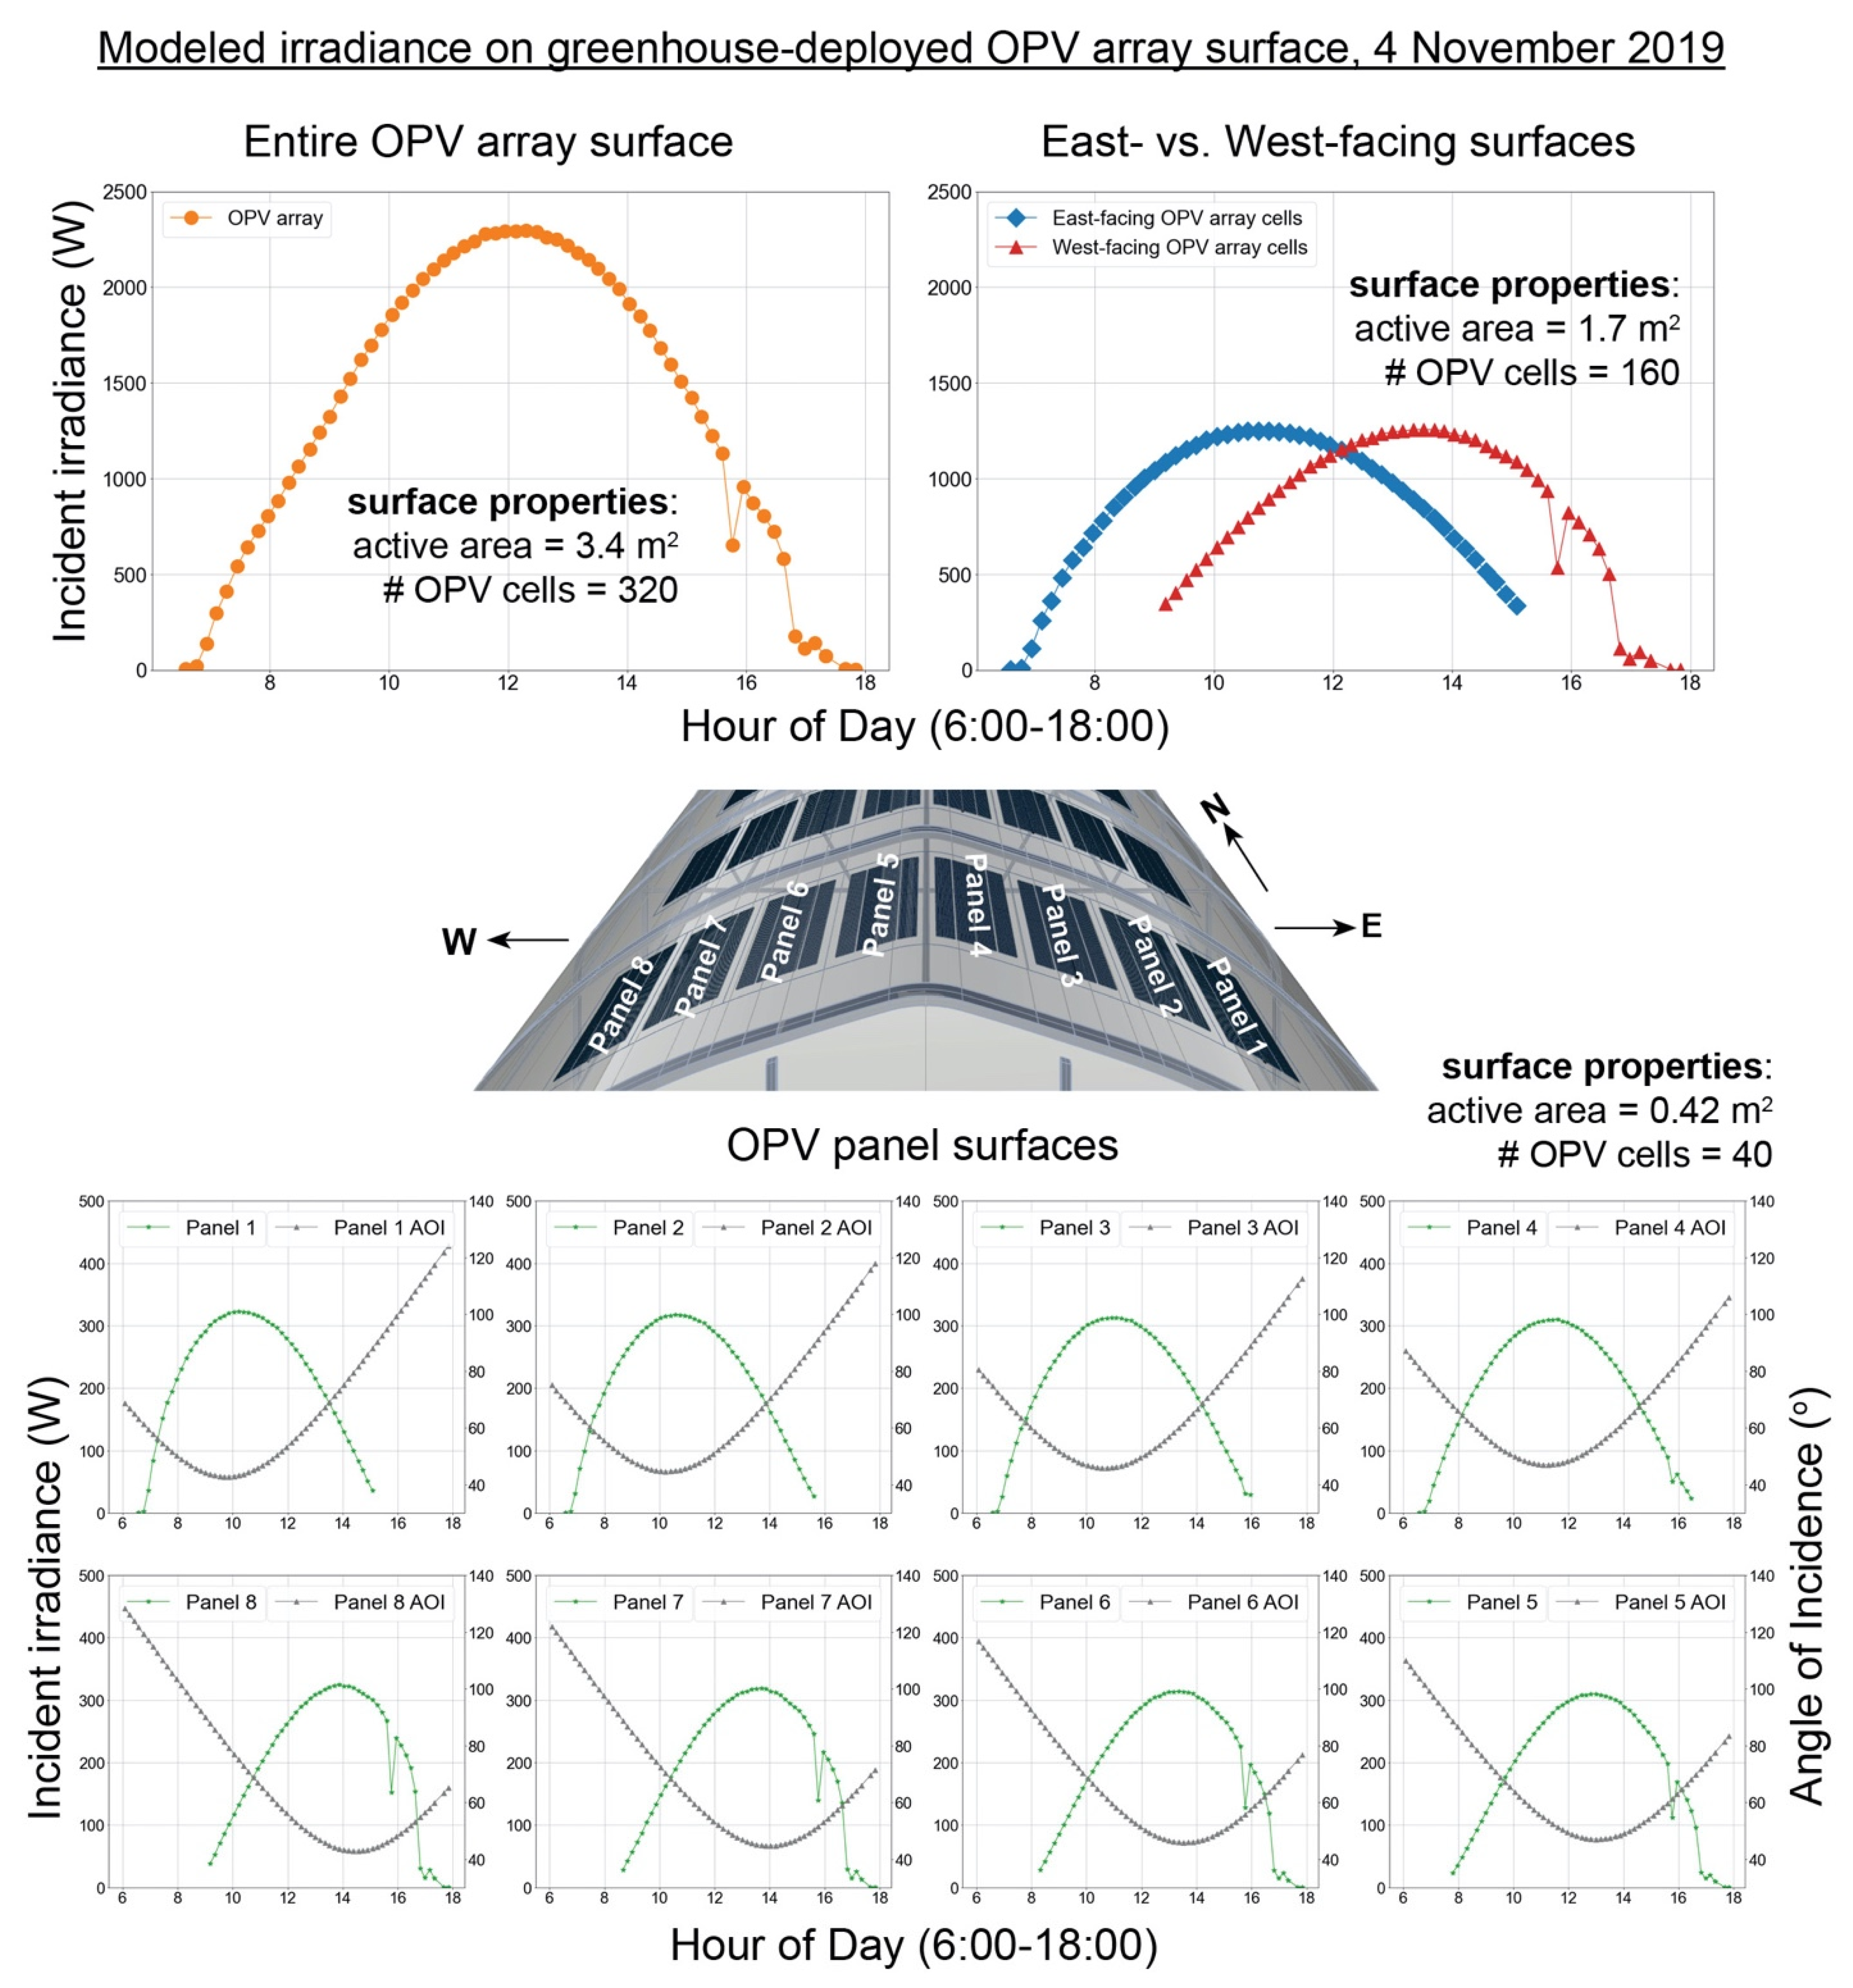
The modeling work developed in this study enabled the estimation of incident solar irradiance on a flexible OPV array deployed on a curved greenhouse roof by calculating the incident irradiance on smaller planar subsections of the OPV array, which correspond to the individual cells in the device. The total irradiance on each cell (IT,cell) can be summed to give the total incident irradiance on the OPV array (IT,array) at any given time. The cells can also be grouped based on their position in the OPV array and/or orientation on the greenhouse roof, which allows for the determination of irradiance conditions on an individual OPV module, panel, or other pre-defined area. Figure 7 illustrates this adaptable spatial resolution functionality, in which the IT over the course of a mostly clear sky day (4 November 2019) is calculated for the entire OPV array surface, for the OPV cells located on the east and west pitches of the greenhouse roof, and for the eight individual OPV panels, showing the changes in angle of incidence over the course of the day for each panel.
The outputs from the solar modeling program include calculations for the individual solar irradiance components—direct, diffuse, and reflected irradiance—that sum to give total irradiance. Knowing the relative amounts of each solar irradiance component incident on the OPV surface is important for assessing electrical behavior in different types of irradiance exposure, specifically direct versus diffuse irradiance. This issue is particularly relevant to OPV technology, which, relative to crystalline silicon PV, has been shown to exhibit quite variable electrical behavior when exposed to different light conditions, depending on the OPV device materials and architecture [41]. For instance, a reversible degradation phenomenon has been observed in several laboratory and outdoor studies of particular OPV devices, which is attributed to high direct irradiance intensities; as a consequence of this degradation mechanism, the performance of outdoor OPV devices is reduced throughout the day, and then recovers overnight [42,43]. There have also been differing reports on the effect of low-light and diffuse-light sky conditions in the outdoor performance of OPV devices with different device architectures [26,44,45]. Thus, performance assessment of large-scale greenhouse-integrated OPV installations stands to benefit from component-specific characterization of incident irradiance.
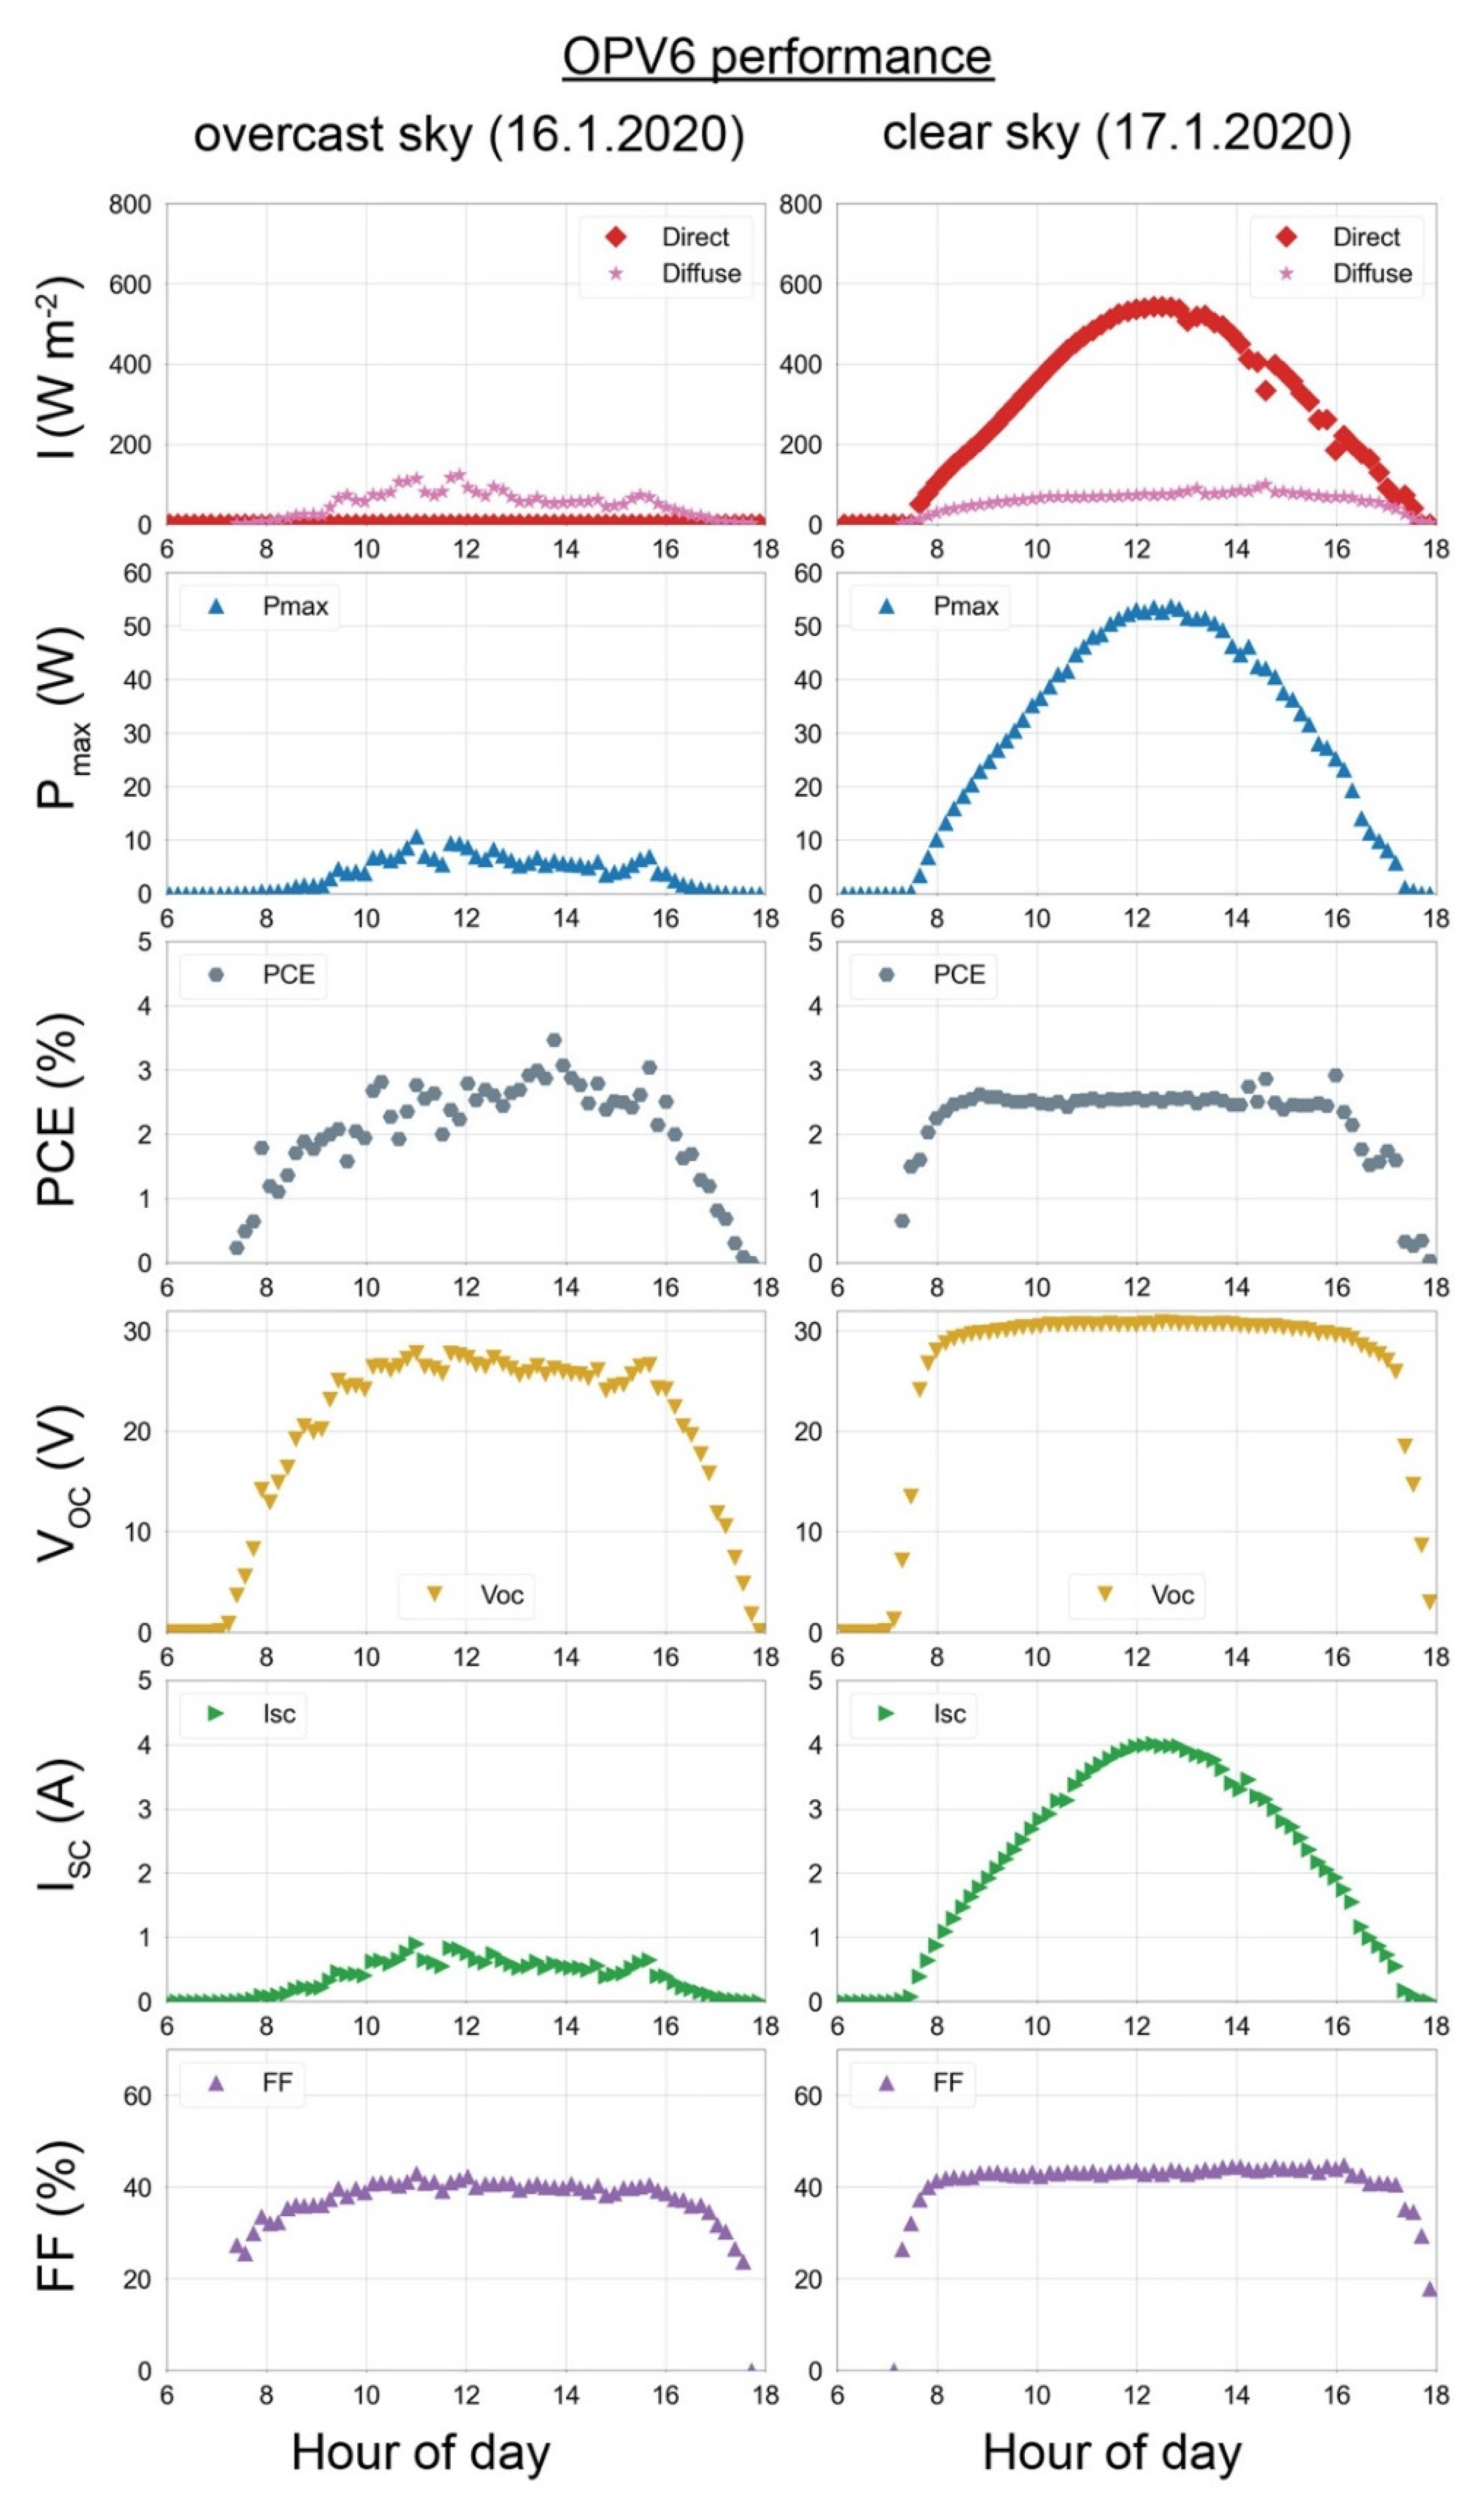
To demonstrate this functionality, Figure 8 shows the calculated IB and ID incident on the OPV6 array for two consecutive days of measurement, one with completely overcast sky (16 January 2020) and the next with clear sky (17 January 2020), alongside concurrent measurements of Pmax, PCE, VOC, JSC, and FF. It can be seen that for both sky conditions, Pmax and Isc had strong dependence on the irradiance intensity.
The PCE values showed wider variation on the overcast day due to cloud cover variation, which affected the irradiance, but the average daily PCE value was virtually the same (~2.5%) on the overcast and clear sky days. The highest PCE values for either day (3–3.5%) were reached on the overcast sky day during the period with the lowest light levels (~50 W m−2), indicating good performance of OPV in low- and diffuse-light conditions; this behavior was also observed in Magadley et al. [26] and Lima and Bagnis [44] for OPV modules.
On the clear sky day, a rapid increase in VOC of the OPV6 array in the early morning (between 7:00–8:00) can be seen; the VOC reached its limiting value (~31 V) during the period of day with highest IB, and then rapidly dropped around sundown (between 17:00–18:00h). The behavior of VOC differed on the overcast sky day, in which there was a more gradual rise in VOC during the morning, as the OPV6 array received increasing amounts of ID. The VOC values fluctuated throughout the day, and the limiting value was never reached (the maximum VOC value was 28.2 V, occurring at midday).
The FF values for the clear sky conditions rose rapidly at sunrise, were quite stable throughout the day (~42%), and then dropped at sundown. On the overcast sky day, the FF rose more gradually, peaked at midday (~41%) when the highest irradiance levels incident on the OPV array surface (~120 W m−2) were calculated, and remained between 39–40% with slight fluctuations, and then gradually declined at the end of the day.

3.2. Electrical Performance of OPV Arrays

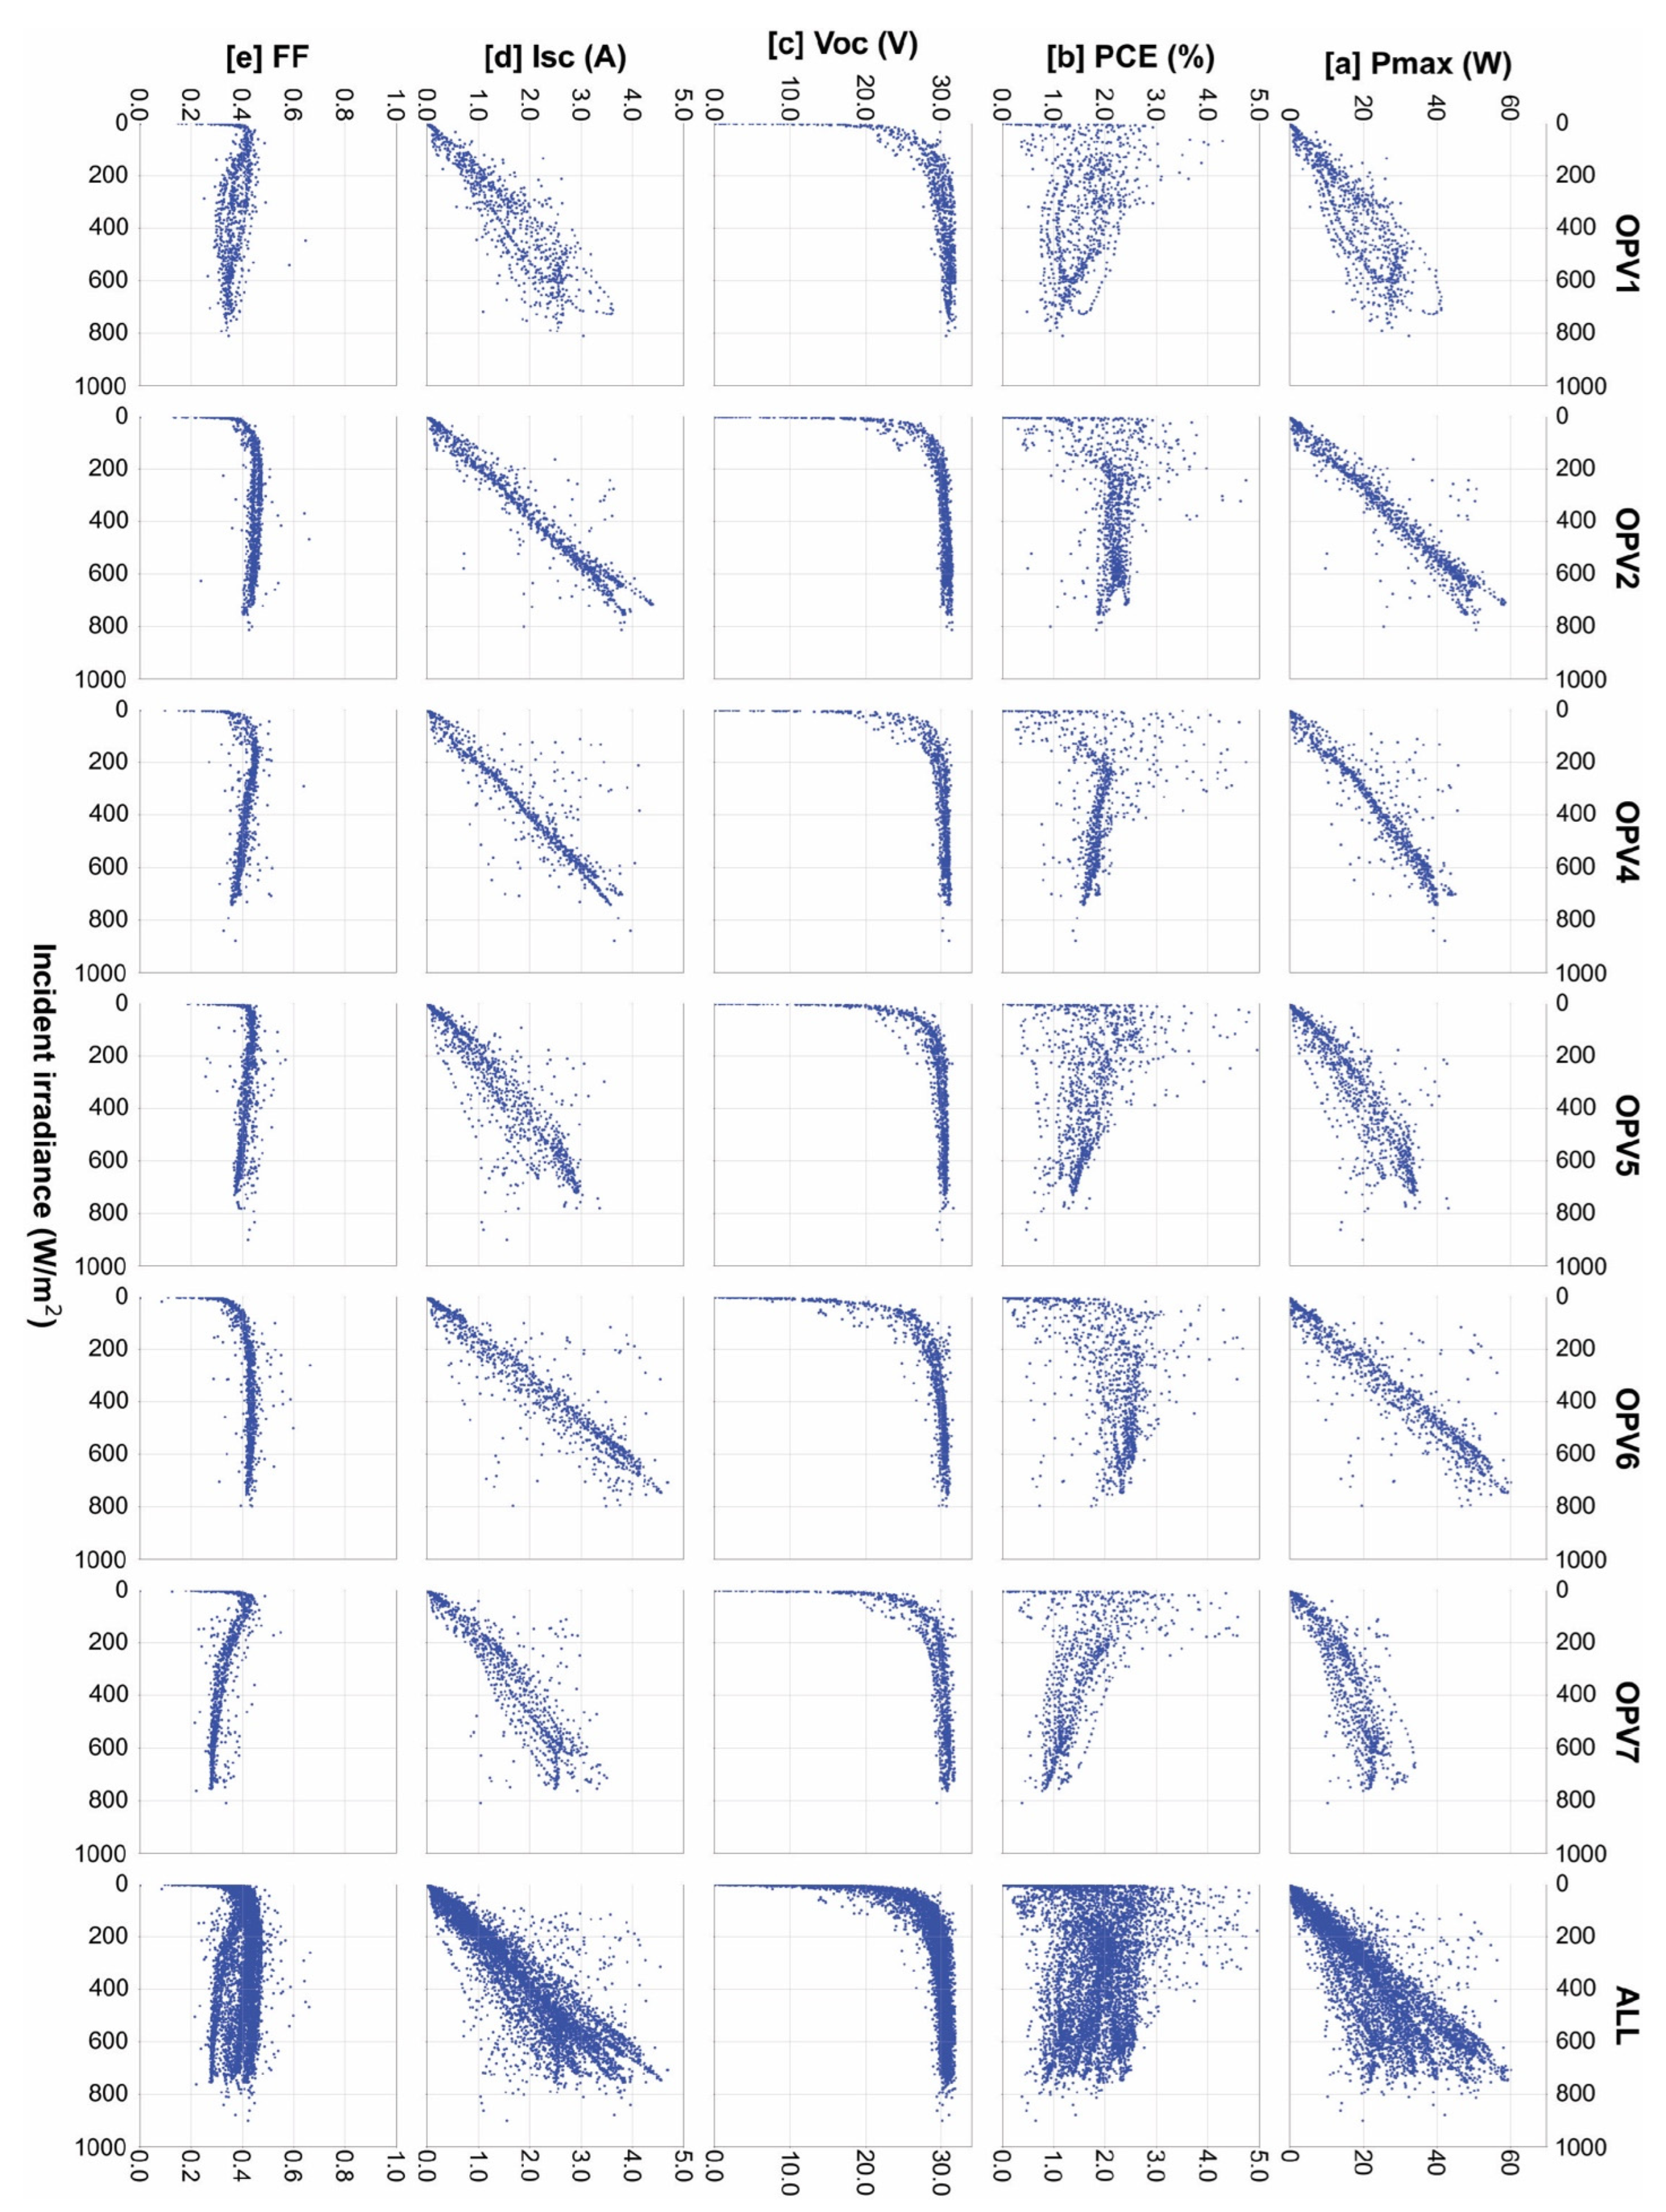
Figure 9 shows the electrical behavior of the OPV arrays at different levels of IT for the measurement period. It can be seen that the power output from the OPV arrays (Figure 9a) generally increased with higher IT, with a stronger linear pattern seen in OPV2 and OPV6 rolls; the other four arrays had proportionately lower output, compared to OPV2 and OPV6 rolls, at higher levels of IT. Although module temperature is affected by a number of climatic factors in addition to irradiance intensity, such as relative humidity, air temperature, wind speed, it can be generally assumed that higher module temperatures coincide with higher irradiance intensities. Despite the positive temperature coefficient for Pmax given by the manufacturer (+ 0.02% K−1, see Table 1), the trend in Pmax for OPV1, OPV4, OPV5, and OPV7 at higher irradiance levels may indicate a negative temperature coefficient for these devices in particular; both Magadley et al. [26] and Chief et al. [46] measured a negative temperature coefficient in outdoor testing at the module-level for this specific OPV device architecture. Often OPVs are assumed to have positive temperature coefficients since the charge carrier transport in OPVs is thermally assisted. This observation points to the importance of long-term outdoor testing for OPV devices, which reveals discrepancies between performance in controlled versus field conditions.
Agreeing with observations of the OPV6 performance in different sky conditions (Figure 8), as well as other outdoor studies [26,46,47], the peak values for PCE (Figure 9b) and FF (Figure 9e) were measured in the lowest irradiance conditions (<200 W m−2). The VOC in all OPV arrays showed logarithmic dependence on increasing light intensities, reaching a limiting value at approximately 200 W m−2 (Figure 9c); this VOC behavior is common to OPV devices, reviewed in detail by Elumalai and Uddin [48]. Again, we note the negative temperature coefficient for the VOC given by the manufacturer (−0.19% K−1, see Table 1): the rapid increase in VOC and subsequent flattening at higher irradiance levels could be attributed to the limiting effect of coincident increased module temperatures. Compared to VOC, the behavior of ISC (Figure 9d) was less consistent between OPV arrays and showed large variation in individual OPV arrays (OPV1, OPV5, and OPV7), likely indicating degradation in these devices. OPV2 and OPV6, to a lesser extent OPV4, demonstrated strongly linear interaction between ISC and IT. On the other hand, OPV1, OPV5 and OPV7 show a dampened ISC at higher IT; this may be attributed to higher photo-generated charge carrier recombination losses occurring at higher irradiance levels [49]. It can also be seen that the FF for the OPV1, OPV5, OPV7 decreased in higher irradiance conditions, indicating reduced Pmax, and specifically Imax, in these conditions.
Figure 10 shows the diurnal performance of all OPV arrays over the course of the measurement period. We reiterate that the OPV arrays were deployed on the greenhouse with true east-west orientation, thereby receiving equal irradiance exposure on both the east-facing and west-facing active areas (at least for days in which sky conditions did not change significantly before/after solar noon). Theoretically, if only incident irradiance explained electrical behavior in the OPV devices, it would be expected that diurnal trends in all performance parameters would be largely symmetrical, rising to peak values at peak irradiance levels, usually occurring at midday, and then declining with decreasing irradiance levels. Figure 10 illustrates this is not the case for several of the OPV arrays, signaling that other factors beyond IT (e.g., device temperature, a reversible degradation phenomenon described in Section 3.1, irreversible degradation, or other defects etc.) are influencing the performance.
With this said, we observe the relatively symmetrical diurnal power output (Figure 10b) in OPV2, OPV4, and OPV6. This not only indicates good performance of these arrays throughout the day, but also the design advantage in arranging greenhouse roof-installed OPV with both east and west orientations, thus capturing solar energy throughout the daylight hours for greenhouse usage, or grid-feeding. However, it can be seen that for the lowest performing arrays—OPV1 and OPV7—the dominant trend in Pmax shows disproportionate decline relative to the incident irradiance (Figure 10a) during the afternoon periods. This is also evident in the dominant trends for PCE behavior (Figure 10c) of OPV1 and OPV7, and to a lesser degree OPV5, which show highest PCE values reached earlier in the day and then gradual declines from midday onward. In contrast, the daily PCE values for OPV2, OPV4, and OPV6 were relatively stable between 9:00–16:00h. The VOC behavior was largely consistent between the OPV arrays, increasing rapidly between 8:00–10:00h to its maximum value and then declining slightly between 12:00–16:00h; once again, this may be explained by the nominal negative temperature coefficient (Table 1). The dominant trend for ISC (Figure 10e) is similar to Pmax; note the asymmetrical dips in ISC the afternoon period in OPV1 and OPV7. The trends in FF (Figure 10f) for OPV2 and OPV6 are relatively constant throughout the midday period, while the remaining arrays had dips in FF during midday periods, coinciding with the highest irradiance intensities. While there were no physical defects observed in the OPV arrays at installation, the variability in electrical performance observed between the OPV arrays points to the importance of improving fabrication methods to ensure high-quality and reliable commercial OPV devices.
Table 2 summarizes the efficiencies of the OPV arrays at different times of the day and over the course of the measurement period. With the exception of OPV4, which was deployed 1 month earlier than the other OPV arrays, all OPV arrays received the same solar radiation and environmental exposure; despite this, average performance varied. All OPV arrays had the lowest efficiencies in the afternoon. Comparing average efficiencies for the morning and midday periods is less consistent, with three arrays (OPV2, OPV4 and OPV6) achieving relatively higher midday efficiencies, corresponding with higher IT, and the other three (OPV1, OPV5, OPV7) having relatively higher morning efficiencies. Averaging performance for all OPV rolls, it can be seen that morning and midday efficiencies were virtually equal. Lower performance in the afternoon period may indicate the reversible degradation phenomenon found in other outdoor studies of OPV, in which the light-induced material degradation over the course of the day reduces performance, followed by a recovery period overnight [42,43].
Today’s commercial crystalline silicon PV panels typically achieve FFs around 80% in outdoor conditions [50]; the FF of the OPV arrays measured in this study ranged between 33.1% (OPV7) and 43.3% (OPV2). While lower FF values are common for large-area OPV technology (Wang et al. 2019), we note that even the highest average FF value of 43.3% was still 14.2% below the nominal FF value from the manufacturer (57.5%), which was calculated from the VOC, ISC, and Pmax in Table 1. The loss in normalized efficiency, calculated as the difference between the PCEn,initial and PCEn,final (see Section 2.3.1 for measurement details) ranged between 31.5–50.6%. The highest efficiency losses were seen in OPV1 and OPV7, which also had the lowest overall performance during the measurement period (Figure 9 and Figure 10), indicating that these devices likely experienced significant degradation in the initial period of their deployment.
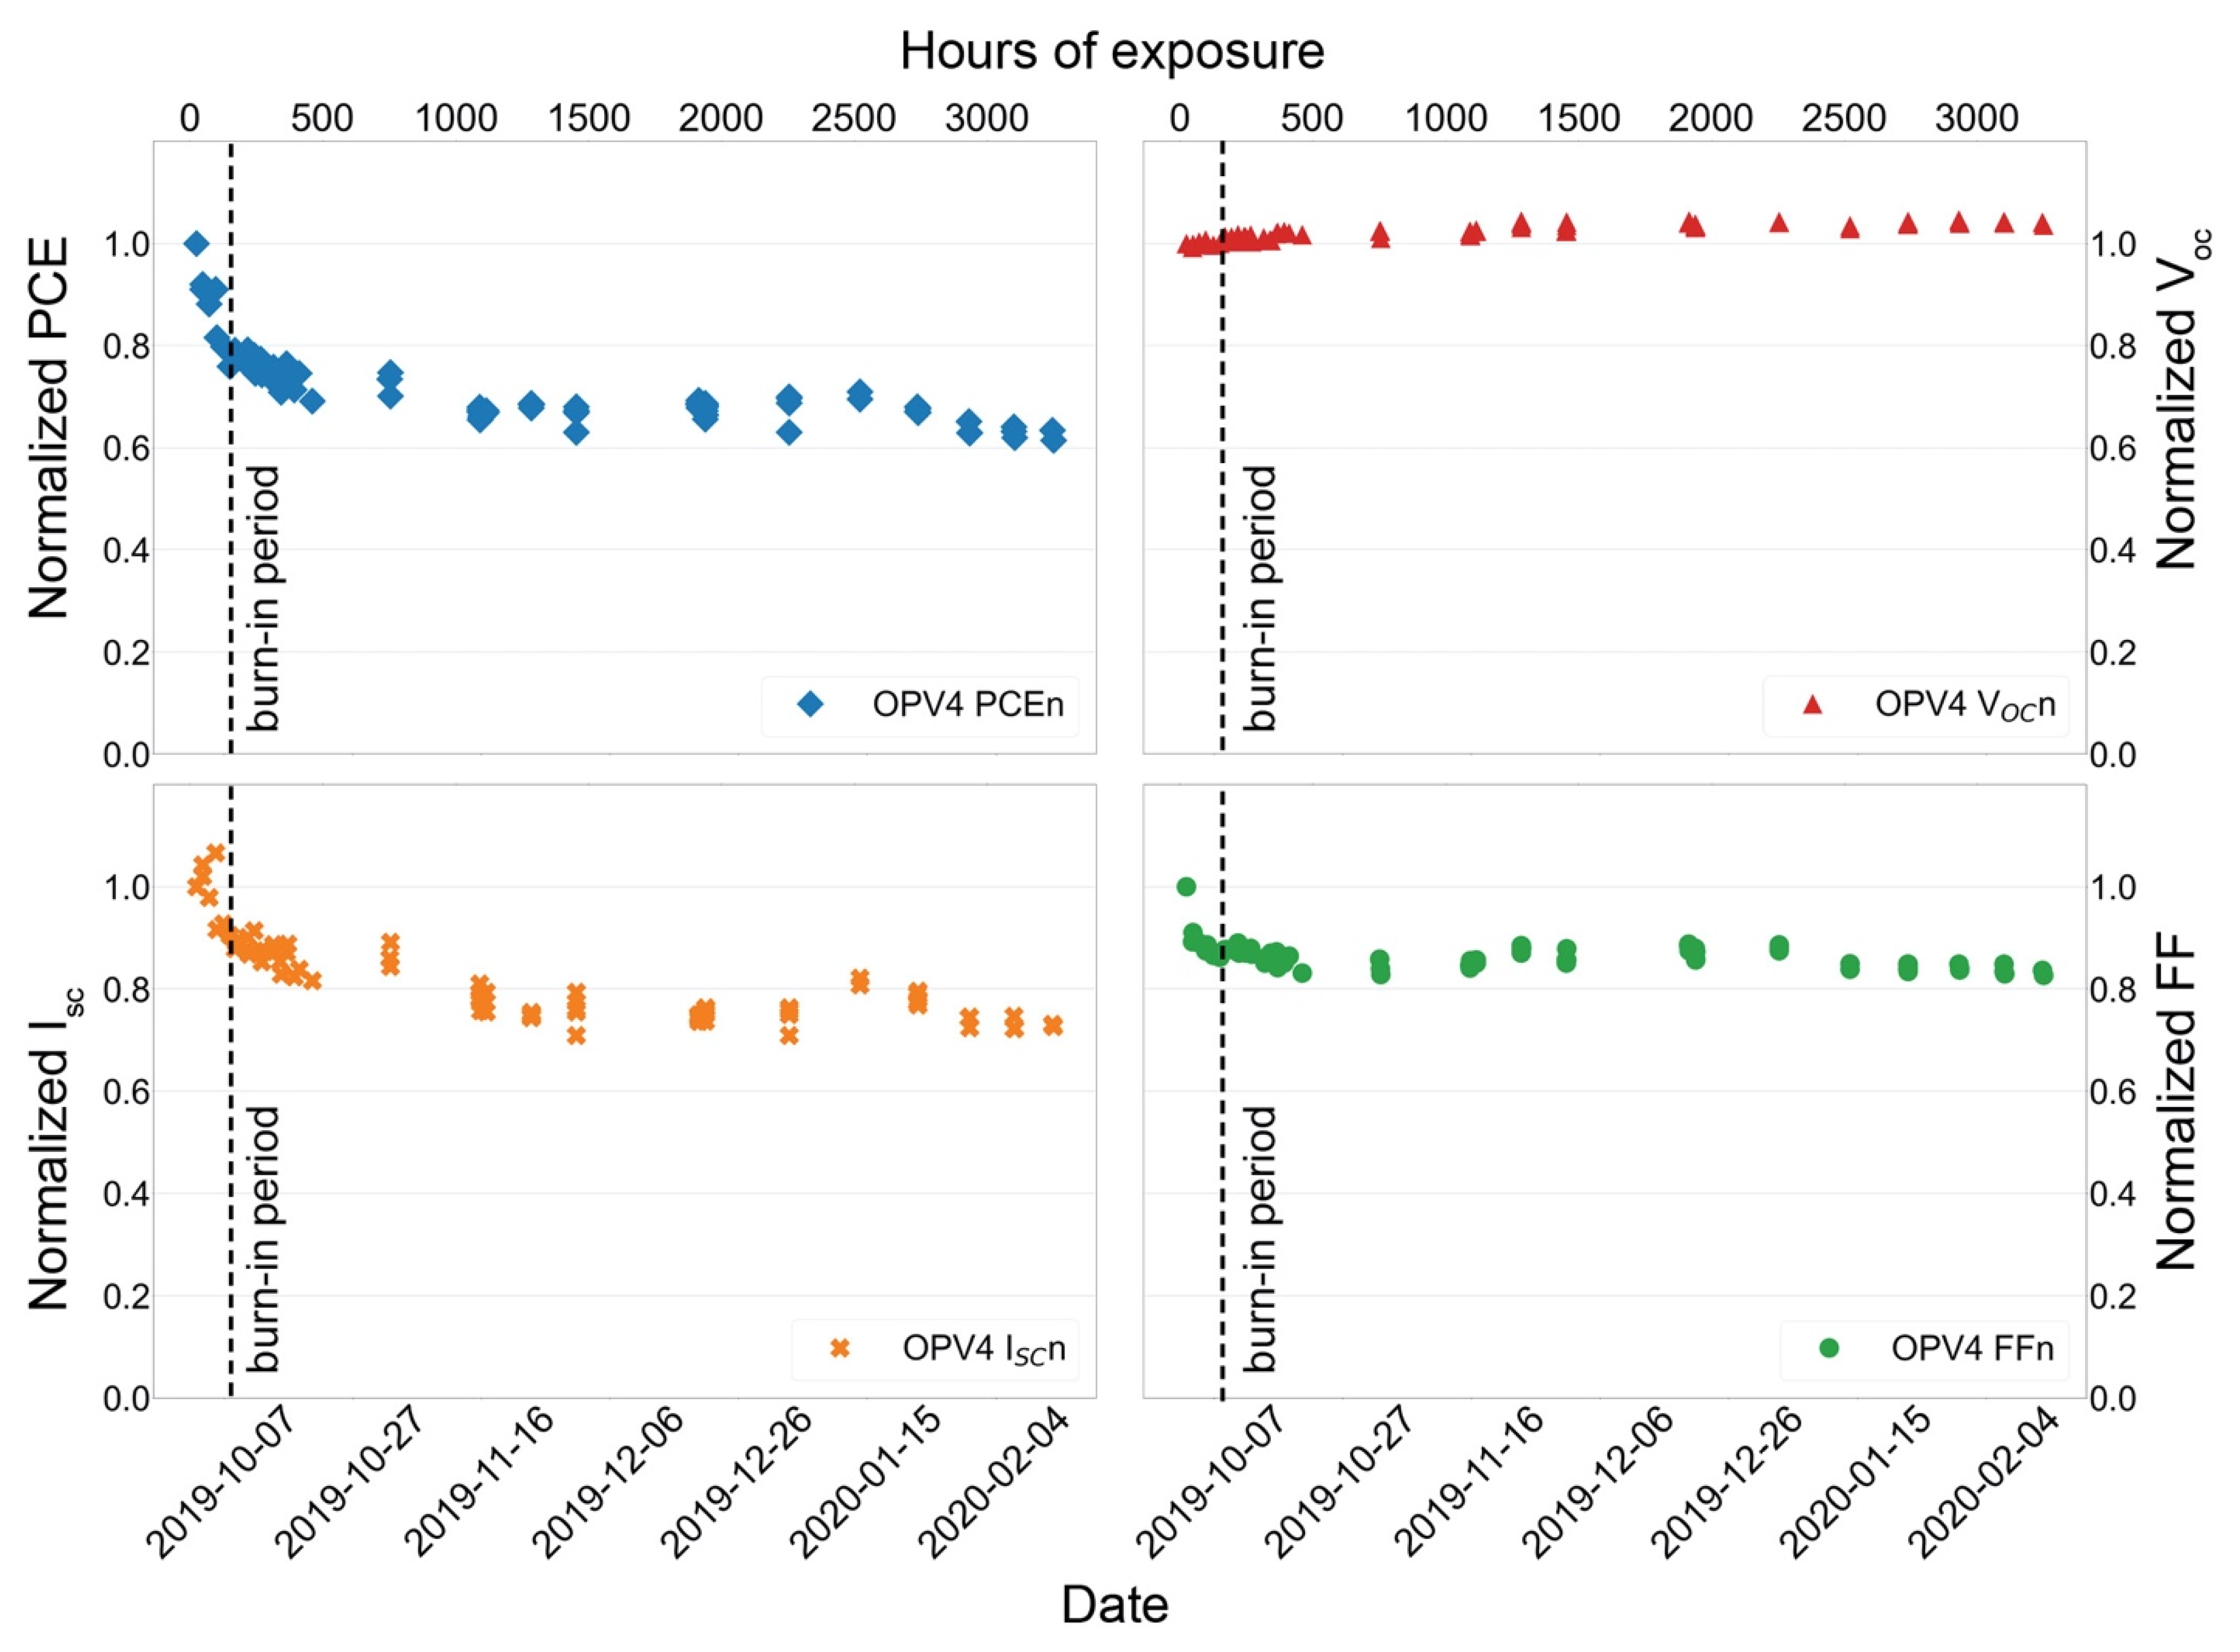
The normalized PCE, VOC, ISC, and FF values for the OPV4 array between 2 October 2019–16 February 2019 are shown in Figure 11. The lowest daily maximum incident irradiance on OPV4 during the measurement period was 590 W m−2, which occurred on 21 December 2019. For this reason, PCEn values were filtered for total incident irradiance on the OPV4 array for a 600 ± 15 W m−2 range, occurring between 10:00–14:00h. As already discussed, stability and lifetime are critical challenges for scaling up OPV technology [51]. The time after initial deployment of a PV device at which its PCE decays to 80% of its initial value is T80, and this parameter is widely used to evaluate the lifetime of PV devices. However, OPV devices are known to have relatively short T80, experiencing exponential decay in efficiency in the first ~100 h of deployment. The time at which PCE decay changes from exponential to linear marks the ‘burn-in’ period for a PV device; a 10–50% loss in OPV device efficiency during the burn-in period can occur [52]. Following the burn-in period, PCE generally stabilizes. Due to the severe effects of the burn-in period on OPV performance, it is generally recommended to evaluate the OPV lifetime based on its post-burn-in performance. For this purpose, Ts80 represents the time after the initial burn-in period for PCE to decay by 20% and is commonly seen as a better indication of OPV device lifetime, compared to T80. It can be seen in the normalized PCE plot in Figure 11 that the end of the burn-in period and T80 coincide at approximately 124 h (5 days after deployment). The Ts80 was never reached during the measurement period; the final recorded PCEn equal to 61.4%. The normalized VOC values slightly increased over the measurement period, while the normalized ISC values showed gradual decline after the burn-in period, similar to the PCE trend. Normalized FF was relatively stable after the burn-in period. It has been estimated that the operational lifetime of OPV devices (Ts80) must extend to 10 years in order to be commercially competitive with silicon PV. Based on the observed linear degradation in PCEn of OPV4 shown in Figure 11, decaying nearly 19% from its post-burn-in efficiency in 135 days (19 weeks), the operational lifetime of OPV4 is more on the order of seasons rather than years. However, this observation should be viewed in the context of recent and very promising gains seen in both the performance and stability of OPV devices which utilize non-fullerene acceptor molecules in the photoactive layer(s) instead of ‘traditional’ fullerene derivatives (e.g., PC60BM, which was the acceptor molecule in the bulk heterojunction layers of the OPV devices used in this study) [53]. With these advances and trends continuing upward, OPV is projected to show strong commercial viability in the near-term, particularly for niche markets in BIPV and greenhouse applications [51].

4. Conclusions

The remarkable improvements in the performance of organic photovoltaics (OPV) seen just in the past five years indicate the rapid and ongoing evolution of OPV technology; novel material systems and device architectures are continuously being developed and introduced. Given that agricultural greenhouses have been identified as a uniquely suitable candidate for OPV applications, it is important that modeling and analytical tools are developed which can facilitate more effective design strategies and assessment of greenhouse-integrated OPV systems. For large-scale OPV applications to greenhouses, these devices will be electrically connected in strings/arrays, and thus an evaluation of performance will be needed at this larger scale. Many greenhouse designs feature roof curvature, especially greenhouses covered by flexible plastic films (for which the direct integration of OPV cells is of particular interest). Knowing the solar irradiance conditions incident on a PV device is of critical importance for performance assessment; this parameter becomes challenging to measure for flexible PV installed on curved surfaces.
Therefore, in this study a method to estimate incident solar irradiance (total, direct, and diffuse components) on a curved greenhouse roof surface was developed using Rhinoceros/Grasshopper CAD software and the open-source solar modeling program pvlib-python©, which was then applied to assess the performance of six flexible, semi-transparent, roll-to-roll printed OPV arrays (each comprised of 32 OPV module strings, 3.4 m2 total active area), which were installed on a high tunnel greenhouse (gothic-arch roof profile) in Tucson, Arizona and electrically monitored between October 2019–February 2020. With this method and results, we present the first outdoor performance assessment for greenhouse-deployed OPV devices evaluated at this (array) scale.
The OPV arrays showed better power conversion efficiencies (PCE) at low incident irradiance levels, and in the morning and midday periods compared to the afternoon period. The average PCE for the six OPV arrays measured was 1.82%. Maximum power point (Pmax) and short-circuit current (ISC) showed strong dependence on incident irradiance, and direct irradiance in particular, although at the highest irradiance intensities there was a clear dampening effect seen in both parameters for three of the OPV arrays. VOC reached limiting values around 200 W m−2, occurring in the initial daylight hours, and then showed slight decline in afternoon periods. Fill factor (FF) values also peaked around 200 W m−2; for three of the OPV arrays, FF showed slight decline at higher irradiance levels, while for the remaining three arrays it was relatively unaffected. Average daily FF values for the arrays were low, ranging between 33.1–43.3%. On average, the OPV arrays had a 38.6% loss in overall PCE over the measurement period, ranging between 31.6–50.1%.
The method presented in this study for calculating irradiance conditions on a curved greenhouse roof surface is quite modular, meaning that it can easily be applied to different greenhouse structural designs, OPV (and other flexible PV) designs and installation schemes, for both performance assessment and, with some modification (but the same foundational features), energy yield prediction for greenhouse-integrated PV systems. Recognizing the absence of measured direct and/or diffuse irradiance data at many agricultural meteorological stations, we note that alternative solar models which require only horizontal irradiance measurements and are generally less computationally intensive can be substituted for the Perez anisotropic sky method that was used in this study; these options are included in the pvlib-python© suite.
Side-by-side comparisons of the performance and degradation behavior of curved vs. planar greenhouse OPV installations would be interesting for future work. Furthermore, the effect of temperature on the performance of large-scale OPV strings/arrays deployed on greenhouse structures should be incorporated in future assessment studies—there are modeling tools available for this purpose within the pvlib-python library. As the integration of OPV into greenhouse structures gains momentum in both research and industry, this study demonstrates a practical approach for assessing the performance of flexible large-scale OPV (and other PV) installations deployed on non-planar greenhouse shapes.

Author Contributions

Conceptualization, R.W. and M.K.; Data curation, R.W.; Formal analysis, R.W.; Funding acquisition, M.K.; Investigation, R.W.; Methodology, R.W.; Project administration, M.K.; Supervision, M.K.; Writing—original draft, R.W.; Writing—review & editing, M.K., E.M., M.T. and I.Y. All authors have read and agreed to the published version of the manuscript.

Funding

This research was supported by Research Grant No. US-4885-16 from BARD, United States—Israel Binational Agricultural Research and by the National Science Foundation Grant No. DGE1735173 Indigenous Food, Energy, Water Security & Sovereignty project.

Data Availability Statement

Data available upon request.

Conflicts of Interest

The authors declare no conflict of interest.

References

  1. Dupraz, C.; Marrou, H.; Talbot, G.; Dufour, L.; Nogier, A.; Ferard, Y. Combining solar photovoltaic panels and food crops for optimising land use: Towards new agrivoltaic schemes. Renew. Energy 2011, 36, 2725–2732. [Google Scholar] [CrossRef]
  2. Barbosa, G.; Gadelha, F.; Kublik, N.; Proctor, A.; Reichelm, L.; Weissinger, E.; Wohlleb, G.; Halden, R. Comparison of Land, Water, and Energy Requirements of Lettuce Grown Using Hydroponic vs. Conventional Agricultural Methods. Int. J. Environ. Res. Public Health 2015, 12, 6879–6891. [Google Scholar] [CrossRef] [PubMed] [Green Version]
  3. Cook, R.L.; Calvin, L. Greenhouse Tomatoes Change the Dynamics of the North American Fresh Tomato Industry; U.S. Department of Agriculture Economic Research Service: Washington, DC, USA, 2005.
  4. Yano, A.; Cossu, M. Energy sustainable greenhouse crop cultivation using photovoltaic technologies. Renew. Sust. Energy Rev. 2019, 109, 116–137. [Google Scholar] [CrossRef]
  5. Al-Ibrahim, A.; Al-Abbadi, N.; Al-Helal, I. PV greenhouse system—System description, performance and lesson learned. Acta Hortic. 2006, 710, 251–264. [Google Scholar] [CrossRef]
  6. Juang, P.; Kacira, M. System dynamics of a photovoltaic integrated greenhouse. Acta Hortic. 2014, 1037, 107–112. [Google Scholar] [CrossRef]
  7. Cossu, M.; Murgia, L.; Ledda, L.; Deligios, P.A.; Sirigu, A.; Chessa, F.; Pazzona, A. Solar radiation distribution inside a greenhouse with south-oriented photovoltaic roofs and effects on crop productivity. Appl. Energy 2014, 133, 89–100. [Google Scholar] [CrossRef]
  8. Kavga, A.; Strati, I.F.; Sinanoglou, V.J.; Fotakis, C.; Sotiroudis, G.; Christodoulou, P.; Zoumpoulakis, P. Evaluating the experimental cultivation of peppers in low-energy-demand greenhouses. An interdisciplinary study. J. Sci. Food Agric. 2019, 99, 781–789. [Google Scholar] [CrossRef] [PubMed]
  9. Bulgari, R.; Cola, G.; Ferrante, A.; Franzoni, G.; Mariani, L.; Martinetti, L. Micrometeorological environment in traditional and photovoltaic greenhouses and effects on growth and quality of tomato (Solanum lycopersicum L.). Ital. J. Agrometeorol. 2015, 20, 27–38. [Google Scholar]
  10. Bambara, J.; Athienitis, A.K. Energy and economic analysis for the design of greenhouses with semi-transparent photovoltaic cladding. Renew. Energy 2019, 131, 1274–1287. [Google Scholar] [CrossRef]
  11. Cossu, M.; Yano, A.; Li, Z.; Onoe, M.; Nakamura, H.; Matsumoto, T.; Nakata, J. Advances on the semi-transparent modules based on micro solar cells: First integration in a greenhouse system. Appl. Energy 2016, 162, 1042–1051. [Google Scholar] [CrossRef] [Green Version]
  12. Hassanien, R.H.E.; Li, M.; Yin, F. The integration of semi-transparent photovoltaics on greenhouse roof for energy and plant production. Renew. Energy 2018, 121, 377–388. [Google Scholar] [CrossRef]
  13. Ntinas, G.K.; Kadoglidou, K.; Tsivelika, N.; Krommydas, K.; Kalivas, A.; Ralli, P.; Irakli, M. Performance and Hydroponic Tomato Crop Quality Characteristics in a Novel Greenhouse Using Dye-Sensitized Solar Cell Technology for Covering Material. Horticulturae 2019, 5, 42. [Google Scholar] [CrossRef] [Green Version]
  14. Corrado, C.; Leow, S.W.; Osborn, M.; Carbone, I.; Hellier, K.; Short, M.; Alers, G.; Carter, S.A. Power generation study of luminescent solar concentrator greenhouse. J. Renew. Sustain. Energy 2016, 8, 043502. [Google Scholar] [CrossRef] [Green Version]
  15. Shi, H.; Xia, R.; Zhang, G.; Yip, H.-L.; Cao, Y. Spectral Engineering of Semitransparent Polymer Solar Cells for Greenhouse Applications. Adv. Energy Mater. 2019, 9, 1803438. [Google Scholar] [CrossRef]
  16. Lizin, S.; van Passel, S.; de Schepper, E.; Maes, W.; Lutsen, L.; Manca, J.; Vanderzande, D. Life cycle analyses of organic photovoltaics: A review. Energy Environ. Sci. 2013, 11, 3136–3149. [Google Scholar] [CrossRef] [Green Version]
  17. Muteri, V.; Cellura, M.; Curto, D.; Franzitta, V.; Longo, S.; Mistretta, M.; Parisi, M.L. Review on Life Cycle Assessment of Solar Photovoltaic Panels. Energies 2020, 13, 252. [Google Scholar] [CrossRef] [Green Version]
  18. Okada, K.; Kacira, M.; Teitel, M.; Yehia, I. Crop production and energy generation in a greenhouse integrated with semi-transparent organic photovoltaic film. Acta Hortic. 2018, 1227, 231–240. [Google Scholar]
  19. Ravishankar, E.; Booth, R.E.; Saravitz, C.; Sederoff, H.; Ade, H.W.; O’Connor, B.T. Achieving Net Zero Energy Greenhouses by Integrating Semitransparent Organic Solar Cells. Joule 2020, 4, 490–506. [Google Scholar] [CrossRef]
  20. Hollingsworth, J.A.; Ravishankar, E.; O’Connor, B.; Johnson, J.X.; DeCarolis, J.F. Environmental and economic impacts of solar-powered integrated greenhouses. J. Ind. Ecol. 2020, 24, 234–247. [Google Scholar] [CrossRef] [Green Version]
  21. Galagan, Y.; Fledderus, H.; Gorter, H.; ’tMannetje, H.H.; Shanmugam, S.; Mandamparambil, R.; Bosman, J.; Rubingh, J.E.J.M.; Teunissen, J.P.; Salem, A.; et al. Roll-to-Roll Slot-Die Coated Organic Photovoltaic (OPV) Modules with High Geometrical Fill Factors. Energy Technol.-Ger. 2015, 3, 834–842. [Google Scholar] [CrossRef]
  22. Grossiord, N.; Kroon, J.M.; Andriessen, R.; Blom, P.W.M. Degradation mechanisms in organic photovoltaic devices. Org. Electron. 2012, 13, 432–456. [Google Scholar] [CrossRef] [Green Version]
  23. Krebs, F.C.; Gevorgyan, S.A.; Gholamkhass, B.; Holdcroft, S.; Schlenker, C.; Thompson, M.E.; Thompson, B.C.; Olson, D.; Ginley, D.S.; Shaheen, S.E.; et al. A round robin study of flexible large-area roll-to-roll processed polymer solar cell modules. Sol. Energy Mat. Sol. C 2009, 93, 1968–1977. [Google Scholar] [CrossRef]
  24. Emmott, C.J.M.; Moia, D.; Sandwell, P.; Ekins-Daukes, N.; Hösel, M.; Lukoschek, L.; Amarasinghe, C.; Krebs, F.C.; Nelson, J. In-situ, long-term operational stability of organic photovoltaics for off-grid applications in Africa. Sol. Energy Mat. Sol. C 2016, 149, 284–293. [Google Scholar] [CrossRef] [Green Version]
  25. Friman-Peretz, M.; Geoola, F.; Yehia, I.; Ozer, S.; Levi, A.; Magadley, E.; Brikman, R.; Rosenfeld, L.; Levy, A.; Kacira, M.; et al. Testing organic photovoltaic modules for application as greenhouse cover or shading element. Biosys. Eng. 2019, 184, 24–36. [Google Scholar] [CrossRef]
  26. Magadley, E.; Teitel, M.; Peretz, M.F.; Kacira, M.; Yehia, I. Outdoor behaviour of organic photovoltaics on a greenhouse roof. Sustain. Energy Technol. Assess 2020, 37, 100641. [Google Scholar] [CrossRef]
  27. Zhang, H.; Balog, R.S. Experimental verification of energy harvest from non-planar photovoltaic surfaces. In Proceedings of the 2013 IEEE Energy Conversion Congress and Exposition, ECCE, Denver, CO, USA, 15–19 September 2013; pp. 4481–4487. [Google Scholar] [CrossRef]
  28. Hofer, J.; Nagy, Z.; Schlueter, A. Electrical Design and Layout Optimization of Flexible Thin-Film Photovoltaic Modules. In Proceedings of the 32nd European Photovoltaic Solar Energy Conference and Exhibition, Munich, Germany, 20–24 June 2016; pp. 2481–2485. [Google Scholar] [CrossRef]
  29. Groenewolt, A.; Bakker, J.; Hofer, J.; Nagy, Z.; Schlüter, A. Methods for modelling and analysis of bendable photovoltaic modules on irregularly curved surfaces. Int. J. Energy Environ. Eng. 2016, 7, 261–271. [Google Scholar] [CrossRef] [Green Version]
  30. Teitel, M.; Baeza, E.J.; Montero, J.I. Greenhouse design: Concepts and trends. In Proceedings of the Acta Horticulturae. International Symposium on Advanced Technologies and Management Towards Sustainable Greenhouse Ecosystems: Greensys2011, Athens, Greece, 5 June 2011; pp. 605–620. [Google Scholar] [CrossRef]
  31. Hirata, Y.; Watanabe, Y.; Yachi, T. Evaluation of output of transparent organic photovoltaic modules on curved surfaces depending on azimuth. In Proceedings of the 2018 IEEE 7th World Conference on Photovoltaic Energy Conversion (WCPEC) (A Joint Conference of 45th IEEE PVSC, 28th PVSEC & 34th EU PVSEC), Waikoloa, HI, USA, 10–15 June 2018; pp. 1112–1115. [Google Scholar] [CrossRef]
  32. Berny, S.; Blouin, N.; Distler, A.; Egelhaaf, H.-J.; Krompiec, M.; Lohr, A.; Lozman, O.R.; Morse, G.E.; Nanson, L.; Pron, A.; et al. Solar Trees: First Large-Scale Demonstration of Fully Solution Coated, Semitransparent, Flexible Organic Photovoltaic Modules. Adv. Sci. 2016, 3, 1500342. [Google Scholar] [CrossRef] [PubMed]
  33. Andreas, A.; Wilcox, S. Observed Atmospheric and Solar Information System (OASIS); Tucson, Arizona (Data); NREL Report No. DA-5500-56494; National Renewable Energy Laboratory: Golden, CO, USA, 2010.
  34. Hagan, H. Topics in Surface Modeling; Society for Industrial and Applied Mathematics: Philadelphia, PA, USA, 1992. [Google Scholar]
  35. AlPuerto, L.G. Modeling of Nonplanar Photovoltaic Arrays. Master’s Thesis, Texas A&M University, College Station, TX, USA, 2016. [Google Scholar]
  36. Holmgren, W.; Hansen, C.; Mikofski, M. pvlib python: A python package for modeling solar energy systems. J. Open Source Softw. 2018, 3, 884. [Google Scholar] [CrossRef]
  37. Duffie, J.A.; Beckman, W.A. Solar Engineering of Thermal Processes; Wiley: Hoboken, NJ, USA, 2013. [Google Scholar]
  38. Loutzenhiser, P.G.; Manz, H.; Felsmann, C.; Strachan, P.A.; Frank, T.; Maxwell, G.M. Empirical validation of models to compute solar irradiance on inclined surfaces for building energy simulation. Sol. Energy 2007, 81, 254–267. [Google Scholar] [CrossRef] [Green Version]
  39. Perez, R.; Ineichen, P.; Seals, R.; Michalsky, J.; Stewart, R. Modeling daylight availability and irradiance components from direct and global irradiance. Sol. Energy 1990, 44, 271–289. [Google Scholar] [CrossRef] [Green Version]
  40. Fontes, A.F. Soil Albedo in Relation to Soil Color, Moisture and Roughness. Ph.D. Thesis, University of Arizona, Tucson, AZ, USA, 1996. [Google Scholar]
  41. Wang, G.; Adil, M.A.; Zhang, J.; Wei, Z. Large-Area Organic Solar Cells: Material Requirements, Modular Designs, and Printing Methods. Adv. Mater. 2019, 31, 1805089. [Google Scholar] [CrossRef]
  42. Katz, E.A.; Gevorgyan, S.; Krebs, F.C. Out-door testing and long-term stability of plastic solar cells. Eur. Phys. J. Appl. Phys. 2007, 36, 307–311. [Google Scholar] [CrossRef] [Green Version]
  43. Tromholt, T.; Manor, A.; Katz, E.A.; Krebs, F.C. Reversible degradation of inverted organic solar cells by concentrated sunlight. Nanotechnology 2011, 22, 225401. [Google Scholar] [CrossRef] [PubMed] [Green Version]
  44. Lima, A.; Bagnis, D.; De, G.; Soares, A.; Galindo, A.; Chabanel, M. Lifetime study on multiple organic photovoltaic materials through outdoor tests. In Proceedings of the VII Brazilian Conference of Solar Energy, Gramado, Brazil, 23–25 August 2018. [Google Scholar]
  45. Bristow, N.; Kettle, J. Outdoor performance of organic photovoltaics: Diurnal analysis, dependence on temperature, irradiance, and degradation. J. Renew. Sustain. Energy 2015, 7, 013111. [Google Scholar] [CrossRef]
  46. Chief, M.; Boyer, K.; Simmons-Potter, K. In-situ testing of organic photovoltaic (OPV) modules to examine modes of degradation in an arid-hot climate. In Proceedings of the SPIE Organic Photonics + Electronics, Online Only, CA, USA, 24–28 August 2020. [Google Scholar] [CrossRef]
  47. Soares, G.A.; David, T.W.; Anizelli, H.; Miranda, B.; Rodrigues, J.; Lopes, P.; Martins, J.; Cunha, T.; Vilaça, R.; Kettle, J.; et al. Outdoor performance of organic photovoltaics at two different locations: A comparison of degradation and the effect of condensation. J. Renew. Sustain. Energy 2020, 12, 063502. [Google Scholar] [CrossRef]
  48. Elumalai, N.K.; Uddin, A. Open circuit voltage of organic solar cells: An in-depth review. Energy Environ. Sci. 2016, 9, 391–410. [Google Scholar] [CrossRef]
  49. Riedel, I.; Parisi, J.; Dyakonov, V.; Lutsen, L.; Vanderzande, D.; Hummelen, J.C. Effect of temperature and illumination on the electrical characteristics of polymer-fullerene bulk-heterojunction solar cells. Adv. Funct. Mater. 2004, 14, 38–44. [Google Scholar] [CrossRef]
  50. Green, M.; Dunlop, E.; Hohl-Ebinger, J.; Yoshita, M.; Kopidakis, N.; Hao, X. Solar cell efficiency tables (version 57). Prog. Photovolt. Res. Appl. 2021, 29, 3–15. [Google Scholar] [CrossRef]
  51. Riede, M.; Spoltore, D.; Leo, K. Organic Solar Cells—The Path to Commercial Success. Adv. Energy Mater. 2021, 11, 2002653. [Google Scholar] [CrossRef]
  52. Mateker, W.R.; McGehee, M.D. Progress in Understanding Degradation Mechanisms and Improving Stability in Organic Photovoltaics. Adv. Mater. 2017, 29, 1603940. [Google Scholar] [CrossRef] [PubMed]
  53. Ma, L.; Zhang, S.; Wang, J.; Xu, Y.; Hou, J. Recent advances in non-fullerene organic solar cells: From lab to fab. Chem. Commun. 2020, 56, 14337–14352. [Google Scholar] [CrossRef]
Figure 1. (a) OPV panel schematic with 4 serially connected OPV module strings, each containing 10 blue cells; (b) a close image of the OPV cells; (c) the material architecture of the OPV devices used in the study.
Agriengineering 04 00062 g001
Figure 2. OPV array architecture. Eight parallel-connected OPV panels, with four serially connected module strings per panel, 10 cells per module. Electrical leads are located at the end (left on the image) of the OPV roll.
Agriengineering 04 00062 g002
Figure 3. Eight OPV arrays (labeled in top image) installed on a gothic-arch style greenhouse roof; interior view of greenhouse roof with installed OPV arrays (lower left), and aerial view (lower right).
Agriengineering 04 00062 g003
Figure 4. 3-D model of greenhouse with 8 installed OPV arrays from the southwest view (left) and the top view (right), with the OPV array identifiers labeled.
Agriengineering 04 00062 g004
Figure 5. Calculation of the surface tilt angle ( β ) and angle of incidence (θ) from the direct normal irradiance (DNI) and the normal angle (Normal) to the plane of array (POA) of individual OPV cells on the greenhouse roof; the most horizontal cell surface is located nearest the roof apex and the least horizontal is located nearest the ground.
Agriengineering 04 00062 g005
Figure 6. Flowchart methodology for calculating solar irradiance incident on the curved surface of the OPV arrays deployed on the greenhouse.
Agriengineering 04 00062 g006
Figure 7. Modeled incident irradiance on the curved OPV array surface on the greenhouse for 4 November 2021 for different levels of spatial resolution; the angle of incidence (AOI) shown for the OPV panel surfaces represents the averaged AOI for the 40 cells belonging to each panel.
Agriengineering 04 00062 g007
Figure 8. Modeled diurnal direct and diffuse irradiance incident on the OPV6 array with concurrent electrical measurements for completely overcast sky (16 January 2020) shown on the left panel, and clear sky (17 January 2020) shown on the right panel.
Agriengineering 04 00062 g008
Figure 9. Effect of incident irradiance on OPV array performances between 28 October 2019–19 February 2020. Each point corresponds to a single I-V curve measurement of the connected OPV roll.
Agriengineering 04 00062 g009
Figure 10. Diurnal OPV array performances between 28 October 2019–19 February 2020. Each point corresponds to a single I-V curve measurement of the connected OPV roll.
Agriengineering 04 00062 g010
Figure 11. Normalized performance of OPV4 array at 600 ± 15 W m−2 between 2 October 2019–16 February 2020, with dotted lines indicating the burn-in period.
Agriengineering 04 00062 g011
Table 1. OPV array technical specifications (provided by the manufacturer).
Nominal Power115 Wp
Tolerance10%
Voc25 V
Vmpp19.3 V
Isc8 × 1.0 A
Impp8 × 0.7 A
Max system voltage120 V
Temperature coefficient Voc−0.19%/K
Temperature coefficient Isc+0.08%/K
Temperature coefficient Pmax+0.02%/K
STC cell efficiency3.3%
Table 2. Average PCE (%), FF (%), and normalized PCE loss (PCEn,initial—PCEn,final, %) of the greenhouse-deployed OPV arrays between 28.10.2019 to 19.2.2020. Measurement details for normalized PCE values are provided Section 2.3.1.
OPV1OPV2OPV4OPV5OPV6OPV7ALL
Daily average PCE (%)
(6:00–18:00)
1.532.081.871.692.131.491.82
Morning average PCE (%)
(6:00–10:00)
1.932.041.852.002.071.861.96
Midday average PCE (%)
(10:00–14:00)
1.522.292.031.732.511.451.95
Afternoon average PCE (%)
(14:00–18:00)
1.241.891.731.421.801.251.57
Daily average FF (%)36.743.340.441.340.533.10.39
PCEn,initial–PCEn,final (%)50.631.5--33.133.444.338.6
Publisher’s Note: MDPI stays neutral with regard to jurisdictional claims in published maps and institutional affiliations.