1. Introduction
Nowadays, food waste is considered an interesting feedstock for circular bioeconomy bioprocesses [
1]. First, turning waste into a coproduct improve their image. In turn, it can help social acceptance of discomforts associated with some industrial processes (smell, noise, …). Second, it represents a stable stream of substrate available in large quantities. In 2019, the United Nations Environment Programme evaluated food waste at about 931 Mt worldwide [
2]. This evaluation accounted only for end-of-chain losses (households, retail, and service), disregarding the waste generation occurring during the food production and processing stages. Still, case studies identified those stages as a sizable source of food waste (22–30%—excluding harvest—in Finland [
3], about 75%—including harvest—in South Africa [
4]). Industrial players have developed several approaches to valorize food waste [
5]. The most valuable one is its reuse to formulate feed, as it preserves its nutritional value and does not break carbon or nitrogen cycles. Among the other approaches, one can note biomaterial and biofuel productions, incineration, or landfilling - ranked from the most to the least desirable [
5].
Focusing on feed formulation, the use of unconventional ingredients is a potent lever to reduce the cost of feeding, representing about one-third of the animal farming running expenses [
6,
7]. Nevertheless, these ingredients bear some negative traits such as low protein content, low vitamins availability, and high fiber content. To mitigate them, several treatments exist, such as acid digestion and fermentation [
8]. Fermentation, as a bio-upgrading process, is of note for several reasons. It increases meal palatability, protein content, and vitamin availability, which have demonstrated positive effects on fish, livestock, and poultry [
9,
10]. The magnitude of the impact ranges from improved gastrointestinal tract health, and reduction of pathological bacteria load (by competitive colonization), to faster lean mass production (cattle) or bigger eggs production with harder shells (poultry). Furthermore, these benefits are accessible with very little inclusion of microorganisms in the diet (0.2% mass, in the case of
Saccharomyces cerevisiae [
10]).
In the scope of food waste reuse, potato is a substrate of choice, as it is the most consumed vegetable in developed countries (22.4 kg per capita per year [
11], yearly production of about 370 Mt (2019), +3 Mt/y over the last 30 years [
12]). The generated waste range from peelings and chip-making leftovers to damaged/deformed potatoes discarded for aesthetic reasons. In an extensive production chain analysis, Willersinn et al. were able to quantify losses from field to fork in the Swiss [
13]. Over the whole production chain, the generated waste was evaluated to 67% for fresh potatoes and 40% for processed potatoes. Depending on the process and the operator, 70 to 96% of the waste is recovered, and a large part (about 80%) is valorized as feed. The remaining fraction is either disposed of or valorized through anaerobic digestion. Finally, thanks to the possibility of storing potatoes, this type of food waste is generated at a stable level throughout the year. In summary, potato waste is generated in a high amount, stably, by players capable of recovering them and valorizing them as feed. For all those reasons, it is relevant to think that using potato waste to cultivate microorganisms before including them in the feed could be a viable process to improve feed quality while managing a waste stream.
Potato waste has already been studied mainly in the scope of bioethanol production [
14,
15,
16,
17,
18,
19,
20,
21,
22], pyrolysis [
23,
24], and only very recently in the scope of costs reduction during single-cell protein production [
25,
26]. The bioprocess deployed is similar for both approaches. First, potatoes are deconstructed by acid or enzymatic hydrolysis, in order to split starch into fermentable sugars, then yeasts are inoculated and proliferate. Still, the aims of the two approaches differ. Bioethanol can be considered as a low added value application requiring a high quantity of biomass and a highly efficient (or very low cost) process to be profitable. Yeast production, to serve as fodder or single-cell protein, is a medium added value application that can support a more complex biotechnological process.
In this article, we propose to go one step further and use a food-grade potato waste stream to produce food-grade yeast. Thus, it could be used as fodder, a food supplement for humans, or an ingredient increasing processed food healthiness. This approach would pave the way to added value application for potato food waste. To do so, we used a strain approved as food:
Saccharomyces cerevisiae. The potato processing process we developed starts with a sulfuric acid hydrolysis (GRAS [
27]) stage. This stage is optimized (time, temperature, potato/acid ratio) by design of experiments and response surface methodologies. Then, the pH is normalized, and yeast is inoculated. While most of the previous works studied focus on a set of process outputs (sugar yield, yeast process inhibitors, ethanol yield, or yeast yield), we cover all of them and integrate them into a numerical model. In the last stage of this work, this model is used to compute the productivity of an actual yeast production process in a plant (accounting for workers shifts and process downtime).
2. Materials and Methods
2.1. Materials and Potatoes Processing
The strain used for this study was a budding yeast Saccharomyces cerevisiae bought from Institut Œnologique de Champagne (IOC, Epernay, France). Cells were subcultured using YPD agar stock medium at 25 °C for 5 days and subsequently stored at 4 °C. This solid YPD medium was composed of 20 g/L D-glucose, 10 g/L yeast extract, 20 g/L peptone, and 15 g/L agar. The stock plates were replaced every 3 months.
Yeast cells were pregrown in 500 mL Erlenmeyer flasks filled with 150 mL of liquid YPD medium (20 g/L D-glucose, 10 g/L yeast extract, 20 g/L peptone) at 125 rpm of shaking rate and a temperature of 25 °C.
Potatoes (Solanum tuberosum L. cv. Agata) used to simulate waste for this study came from a single batch, bought from a general store (Aldi, Rethel). Whole potatoes were used to emulate potato waste generated for aesthetic reasons (e.g., black spots) or for not matching the required size in the slicing process, as these two types are the most easily recovered. They were processed together simultaneously to avoid artifacts originating from potato to potato variation or sample aging. Potatoes were cut, mashed, and freeze-dried (Christ alpha 1–2 LD+). The obtained powder was ground to reduce differences further. Finally, the potato powder was sieved (200 μm) and stored in an air-tight container placed at room temperature to avoid condensation.
2.2. Acid Hydrolysis
As potatoes’ carbohydrates are mainly composed of starch, they have to be broken down into smaller units so that yeasts can assimilate them. Sulfuric acid (0.5 M, food-grade) was used to hydrolyze starch. To lead the deconstruction, potato powder was re-hydrated (5 g of powder into 25 mL of water) and mixed with sulfuric acid (0.5 M, 50 mL). The mixture was then placed in a pressure tube (Ace glass tube) and put in an oven. Three parameters were selected to undergo optimization: time, temperature, and re-hydrated potato/acid w/v ratio.
First, a classical cubic design with 4 center-points was used to assess for potentially non-influential parameters. These preliminary results showed the potato/acid ratio had no influence on the outcomes over the tested conditions (
p > 0.6 for ANOVA—Statsmodels Python package [
28], tested ratio 1/2, 1/4, 1/6). The ratio was therefore set to 1/2 to minimize the use of sulfuric acid and neutralization reagent.
Response surface methodology was then used to optimize the two relevant operating parameters (time and temperature). A central composite design with 4 center-points was used to explore the search space. Even though this approach might be considered unnecessarily heavy in some aspects for optimizing two variables, we selected it because of the rigor brought by this framework. Time ranged from 30 to 120 min, temperature from 90 to 120 °C (
Table 1).
Table 2 presents the tested conditions for the response surface construction. The monitored output variables were sugars concentrations (glucose and fructose), yeast growth performances (growth rate), and the concentrations of yeast growth inhibitors (levulinic, acetic, formic acids, furfural, and HydroxyMethylFurfural—HMF hereinafter) [
29] remaining after cell cultivation. Each point was duplicated, resulting in a total of 26 runs.
The response surfaces were generated using a second-order polynomial including cross terms (Equation (
1)). They were interpolated using the Ordinary Least Square method.
where
is Time,
is Time
2,
is Time × Temperature,
is Temperature, and
is Temperature
2,
2.3. Yeast Cultivation
The products for potato waste hydrolysis were centrifuged (10 min, 6600 g) and filtered (0.45 μm) to separate solid remains of the supernatant. The pH of the liquid was adjusted using sodium hydroxide (about 2 mL) to 6.0 to allow cell cultivation. Special care was taken in ensuring axenic conditions. A sample was used to measure the medium optical density at 600 nm before inoculation to serve as a blank. Then, cells were inoculated from a unique subculture (10 mL culture medium, 25 °C, 1/100 passaging). The cultures were monitored three times a day via optical density measurement at 600 nm (proxy of cell density). After stabilization, the supernatant was collected to quantify the remaining sugars. The conversion between culture optical density and dry weight was performed using a standard curve (7 points, R2 = 0.9981). The cultures’ growth rates were calculated by linear regression of the logarithm of the cell concentration during the exponential growth phase.
Additionally, to assess the relevance of nitrogen addition in the medium, cultivation tests were carried out in microwell plates. For all the 26 runs, 200 μL of culture medium was placed in 3 separate 400 μL wells. One of them was supplied with , the second with Yeast Nitrogen Base (final concentrations: 5.0 g/L for ()2SO4 and 6.7 g/L for YNB). The last well served as control. The culture performance was monitored via optical density measurement at 600 nm.
2.4. Hplc Method
In order to quantify acid hydrolysis efficiency and yeast sugars consumption, an HPLC method was used to measure the concentrations of sugars (glucose and fructose) as well as the ones of yeast growth inhibitors (levulinic, acetic, formic acids, furfural, and HMF). Except for furfural and HMF, which were detected with a UV detector, all the other species were detected using a refractive index detector [
30].
For both cell cultures and acid hydrolysis products, samples were centrifuged (10 min, 6600 g) and filtered (PTFE Syringe Filter 0.2 μm, Fisherbrand, Waltham, MA, USA) before being presented to the analyzer. Quantification was carried out using an Ultima 3000 HPLC (Thermo Fisher Scientific, Waltham, MA, USA) coupled with a Refractive Index Detector RI-101 (Shodex, Munich, Germany). Separation was achieved on an Aminex HPX-87H column (300 × 7.8 mm) (Bio-Rad, Hercules, CA, USA). The column temperature was maintained at 30 °C. The mobile phase flow rate of 2 mM sulfuric acid was 0.5 mL/min in isocratic mode, and the injection volume was 10 μL. The total analysis time was 30 min. Molecules were identified by comparison of their retention times with those of standard solutions. A 6-point calibration and linear regression were used. Quantification was achieved using the area of the peak in external calibration, and the range of concentration was 0.2 to 10 g/L. All standards were >98% pure.
2.5. Process Productivity Model
Process productivity was derived from a mathematical model accounting for cell growth and process planning.
The cell growth is predicted using Pham’s model (
Figure 1), which describes yeast aerobic culture [
31]. It is based on the metabolic overflow paradigm: yeasts can only respire a certain amount of sugar per unit of time. Consequently, they ferment the remaining fraction of the sugars they assimilated. Once sugars are exhausted, the cells rely on the ethanol formerly generated to support a second growth phase. In more detail, this model divides the metabolic fluxes into two categories: the ones powering the anabolism and the anabolism itself. It is composed of 18 equations governing the distribution of the sugar fluxes towards respiration or fermentation and anabolism or energy metabolism (more details down below, next to the equations).
Sugar uptake is governed by a classical Monod’s law:
The sugar flux is then split into an oxidative pathway and a fermentative one:
The oxidative pathway itself is divided between two contributions: one to anabolism, the other to energy production (for maintenance and anabolism support):
Anabolism contribution can then be derived from the yeast yield through sugar oxidation (
):
While the energy contribution drives the need for oxygen directed towards sugar oxidation (accounting for potential ethanol inhibition):
Like the oxidative pathway, the fermentative one is divided: anabolism and energy production:
Once again, anabolism contribution is derived from the yeast yield through fermentation this time (
):
Then, the ethanol production originating from sugar fermentation can be computed as:
In a second phase, yeast can uptake ethanol and oxidize it. Here again, this flux is divided into anabolism and energy:
The ethanol oxidation energy contribution being powered by the oxygen uptake:
In overall, the population growth is the sum of all the anabolism contribution:
While of oxygen consumption is driven by sugar and ethanol oxidation:
In terms of differential equations, we obtain a system governing cell growth, sugar and oxygen consumptions, as well as ethanol production and consumption:
In his article, Pham reported or calibrated the required parameters for
Saccharomyces cerevisiae cultivation under aerobic conditions (
Table 3). Thus, we used his parameters to compute the yeast growth. The only exceptions are the growth rate and the initial sugar concentration, which were taken as the value reported during our experiments. Finally, the initial yeast concentration was taken at 2 g/L. The model was implemented in Python with an implicit, fully coupled, timestep adaptive Euler scheme. From this very comprehensive model, we used two output parameters of an industrial process: the time required to lead the yeast culture entirely (stopped when ethanol concentration is below 5 g/L at the end of the second growth phase) and the final yeast concentration.
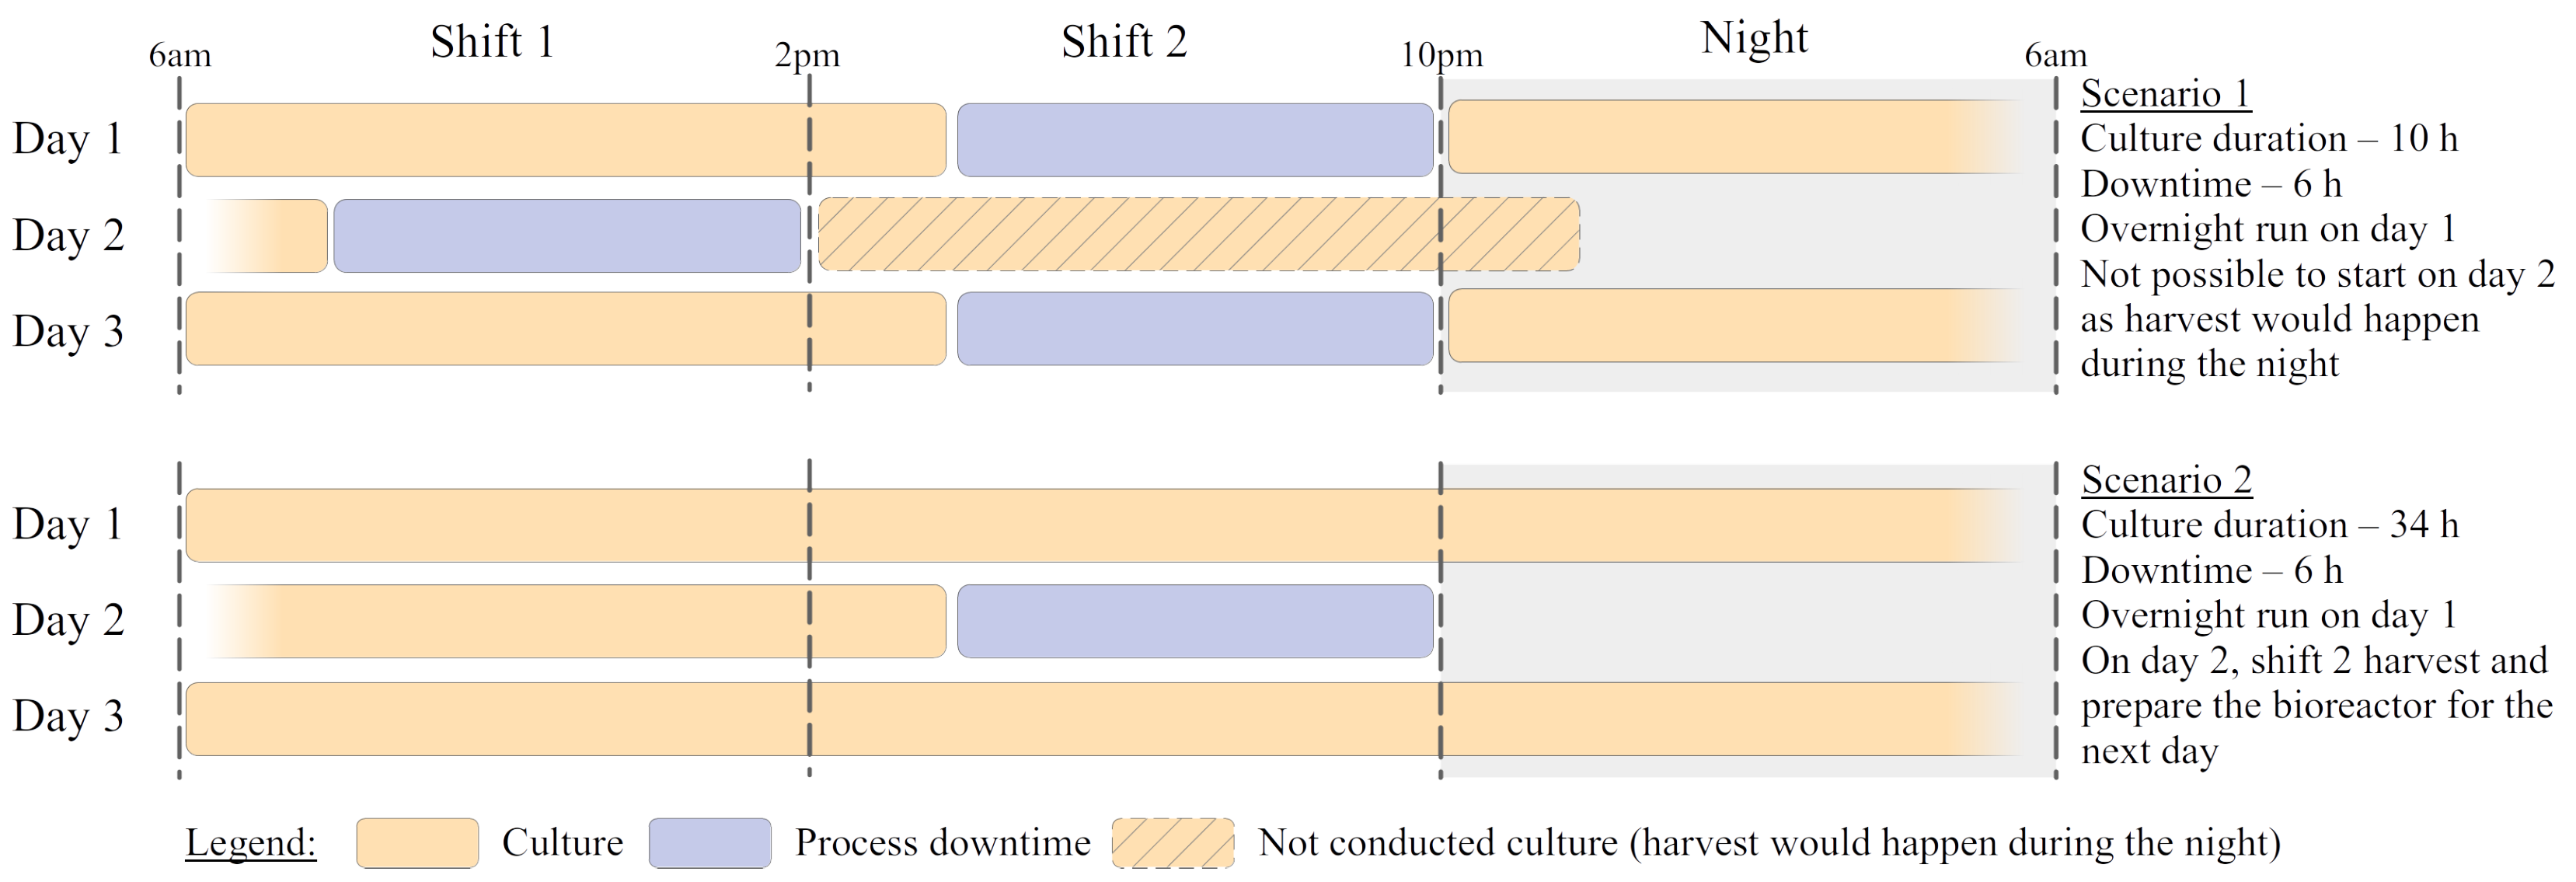
On top of the time required for the culture to grow, industrial processes also have to face technical downtime after the operation (harvesting, cleaning, sterilization, reloading) and operator teams shifts. Here we assumed a 6 h process downtime, as classically reported for yeast cultivation [
32,
33] and a factory operating in two shifts (6–14 h and 14–22 h, 6 days a week). With this additional information, it is possible to compute the number of runs that an actual factory can perform over a week. Knowing the number of run and the final yeast concentration, it is possible to compute the process productivity in g
Yeast/w/L. To illustrate this,
Figure 2 presents two examples of process configuration. The first scenario is a case where the cultivation time is relatively short. In this case, the process downtime is high compared to production time. Furthermore, the need for frequent harvests imposes constraints on the process planning (e.g., on day 2, the production is not possible in the afternoon). All this indeed hinders profitability. On the contrary, extremely long runs (not exemplified) would ease those constraints. Still, they would be achieved because of poor biological performances (low growth rate, mainly) and not be profitable either. Finally, scenario 2 represents an in-between configuration. The cultivation time is long enough to allow for overnight operation. Downtimes match the different worker shifts, making the process easy to plan and the ratio of cultivation and maintenance times acceptable.
2.6. Fed-Batch Operation
Industrial processes are usually run as fed-batches as they achieve higher productivity than batches [
34]. Therefore, we investigated this mode of operation for the best-performing configuration (99 min under 103 °C, see
Section 3.3). Another batch of potato waste was treated following the protocol previously described. The resulting medium was concentrated 2.5 times by evaporation at 60 °C to produce the high-concentration feed. Above this concentration ratio, the formation of crystals was noted. Hence it was set as a limit to keep a homogeneous and well-suspended feed. This process yielded a dark brown water-like medium with a sugar concentration of 99 g/L. As for former experiments, an experimental validation was conducted before numerically evaluating the process’s weekly productivity. Indeed, the medium contains inhibitors that could accumulate and stop cell growth, potentially nullifying the gain of a fed-batch operation.
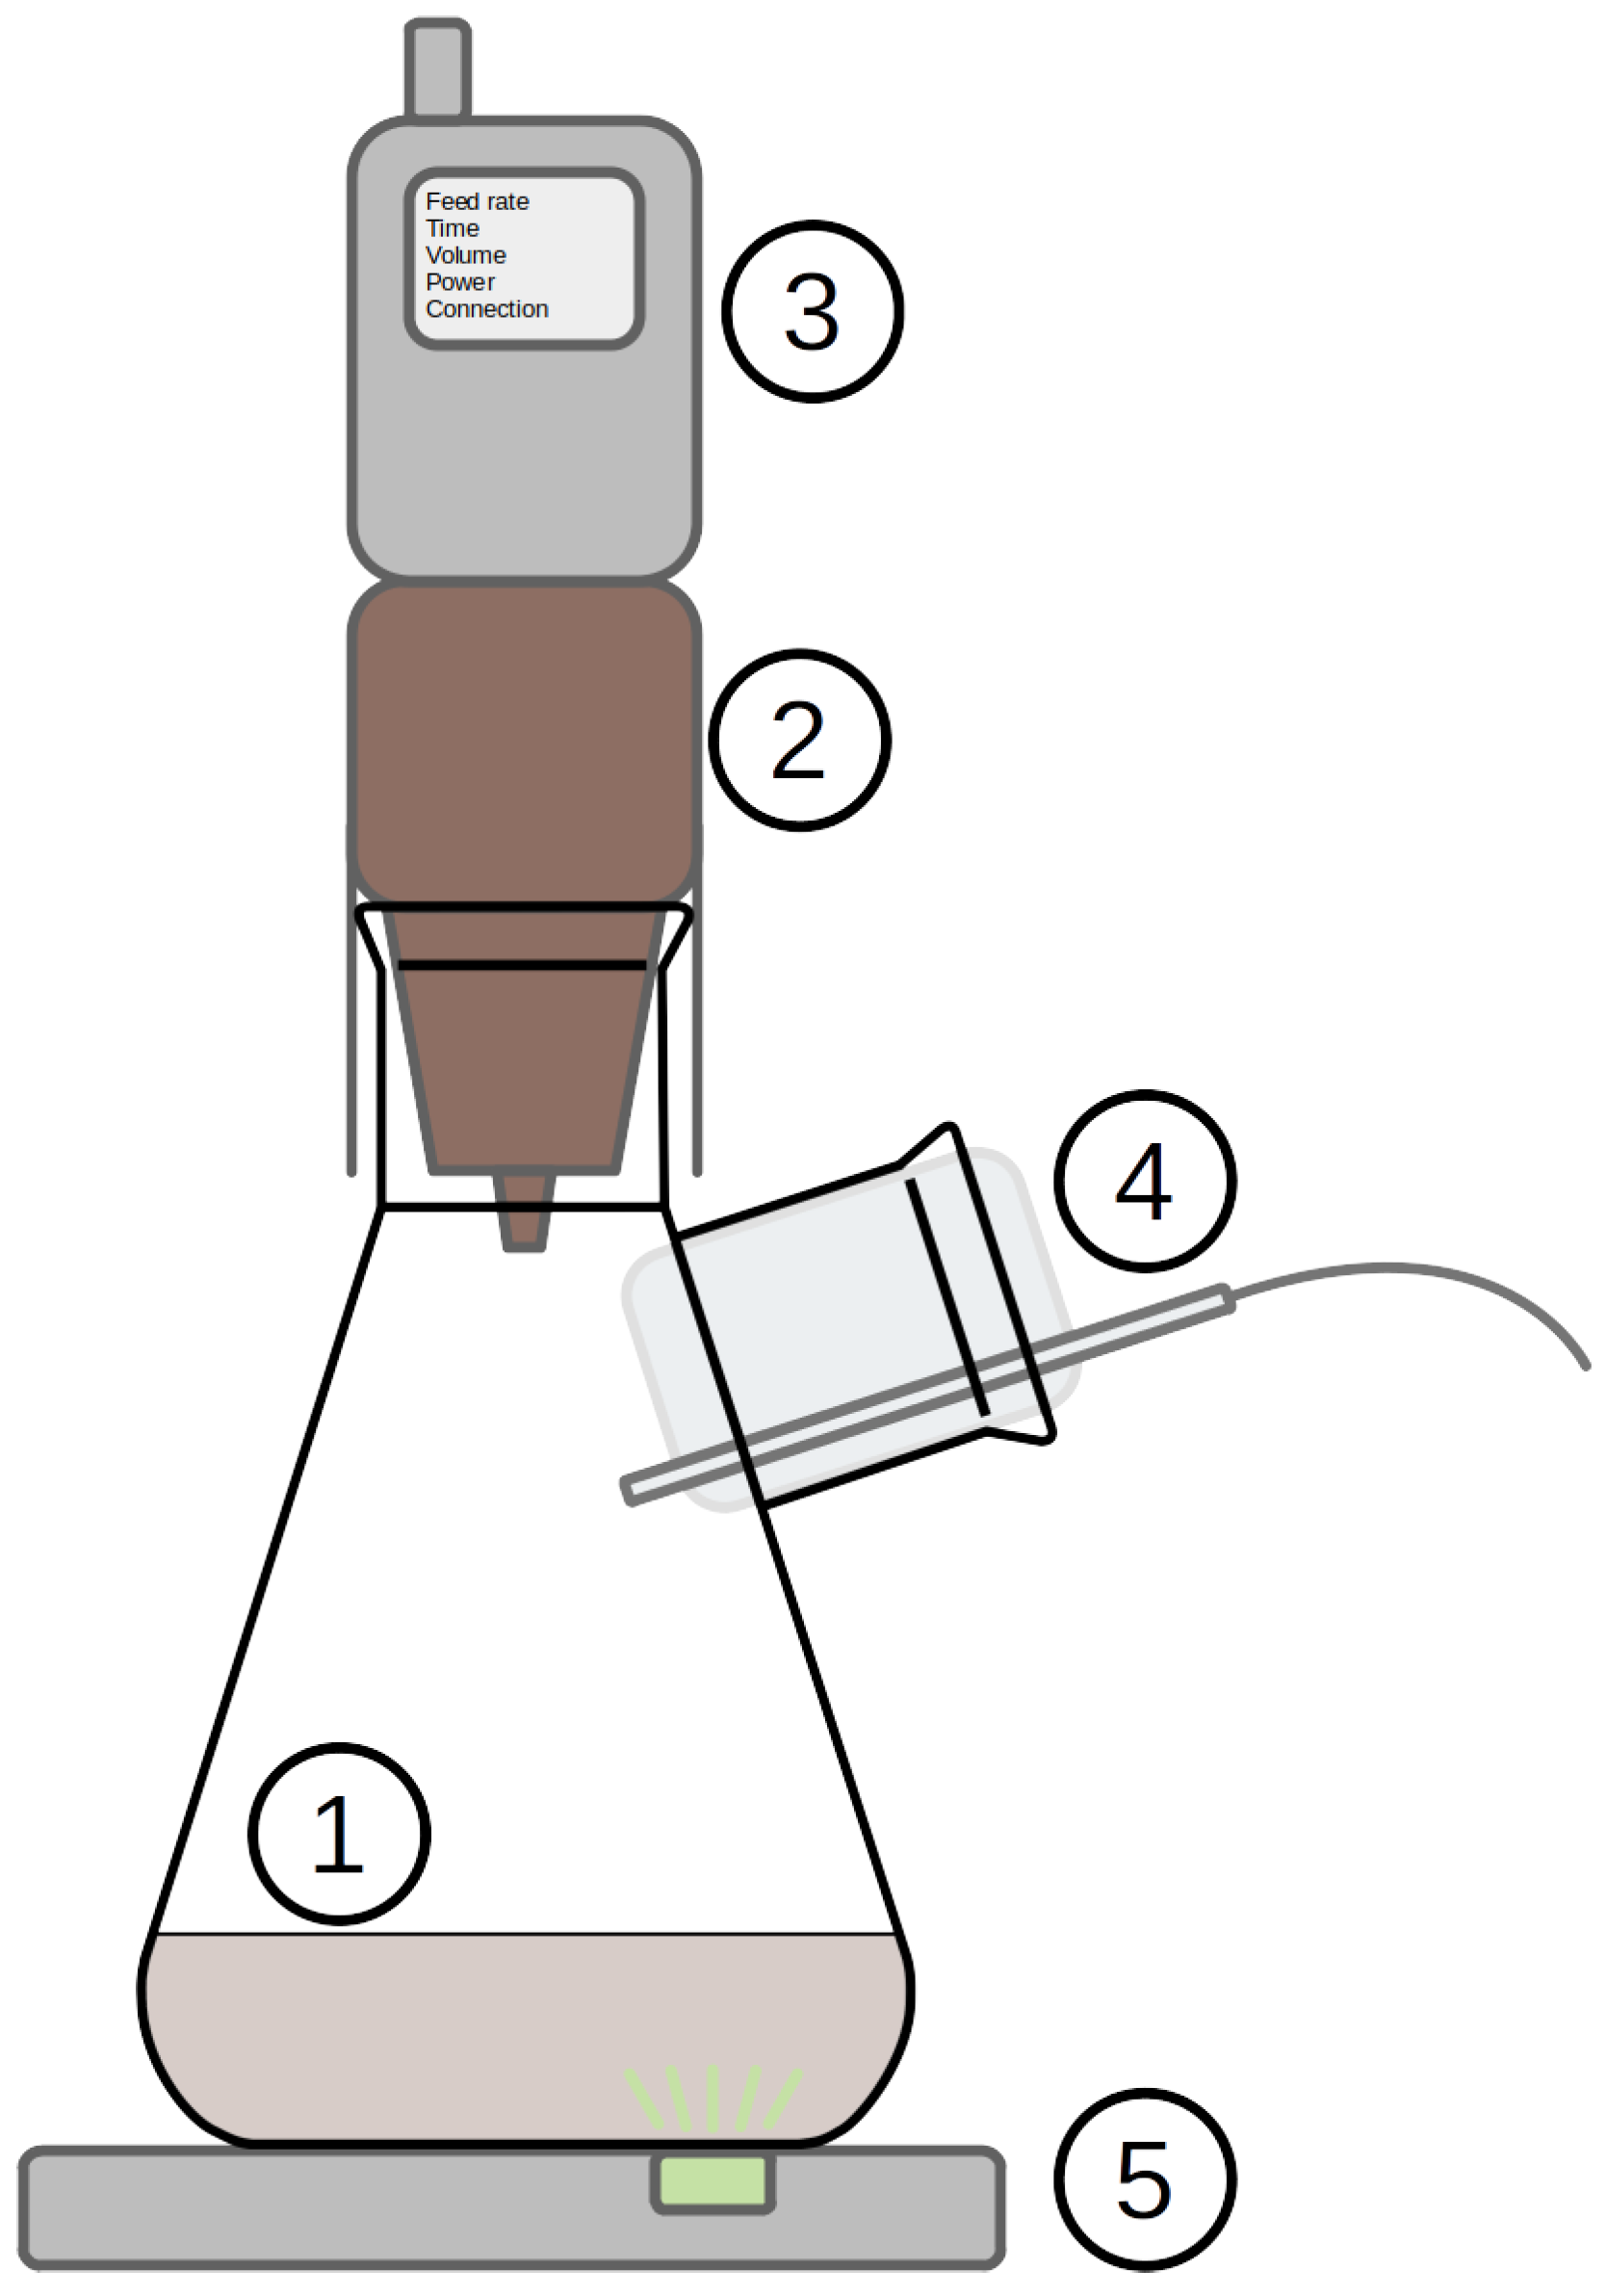
Experiments were conducted using a specifically designed flask feeding system (aquila biolabs, Liquid Injection System—LIS) (
Figure 3). This system is made of two parts that fit on top of a two-neck flask. The first part is a tank containing the concentrated feed. On top of the first, the second part is a pneumatic injection controller. For this test, the flask was initially filled with 50 mL of regular hydrolysis medium. The tank was filled with 20 mL of concentrated hydrolysis medium. The injection was triggered after 20 h on culture and fed 5 mL every 5 h until exhaustion. The side neck was used for sterile air injection as flasks systems are prone to oxygen limitation, essentially in the case of high sugar or fed-batch cultivations. Two batch experiments were conducted as controls in parallel. The cultures were monitored using an inline optical flask monitoring system (Aquila Biolabs, CGQ). This system is made of an LED placed below the flask, which periodically blinks. Next to it is a detector that collects the backscatter signal. Under normal operating conditions, the backscatter signal correlates well with optical density and cell count. In addition, we also acquired optical density (at 600 nm, proxy of cell density) at the end of the culture.
The numerically investigated fed-batch was led assuming a 3 m3 working volume fermenter initially filled with 500 L of regular hydrolysis medium. The medium was inoculated with a concentration of 2 g/L of yeast. A constant feed strategy was chosen as it is easy to operate. The feed flowrate was set at 50 L/h of concentrated hydrolysis medium until a volume of 3 m3 was reached (2.5 m3 of concentrated medium addition).
3. Results and Discussion
Acid hydrolysis and HPLC quantifications were successful for all the runs. Still, two runs (numbers 21 and 23) had their hydrolysis container not properly sealed and thus were not conducted under the same conditions as the other ones. Furthermore, two other runs (numbers 2 and 20) had their pH accidentally over-adjusted, inducing an excessive dilution. All the results (acid hydrolysis, cell growth, and process modeling) are summarized in
Table 4 and
Table 5. Additionally, all the response surfaces coefficients are available in
Table 6.
3.1. Acid Hydrolysis
The first comments on acid hydrolysis results are qualitative. Visually, supernatant color ranged from light yellow (short treatment duration at low temperature) to deep brown (long treatment duration at high temperature). In terms of texture, all the low duration runs (30 min) resulted in a porridge-like mixture. In most cases, this texture prevented the sample filtration in quantity large enough to allow to lead yeast cultivation. Still, it was possible to filter enough matter to lead the HPLC analysis.
Runs 21 and 23 present relatively high sugar concentrations compared to their properly sealed counterparts (+74 and +165% respectively). It is coherent with the presence of a vapor leakage which allowed water to escape the container and sugar concentrations to increase. Furthermore, this effect is all the more pronounced for run 23, which was treated 2.5 times longer than run 21. Finally, this explanation correlates with experimental observation. As a consequence, the two runs were discarded from the analysis.
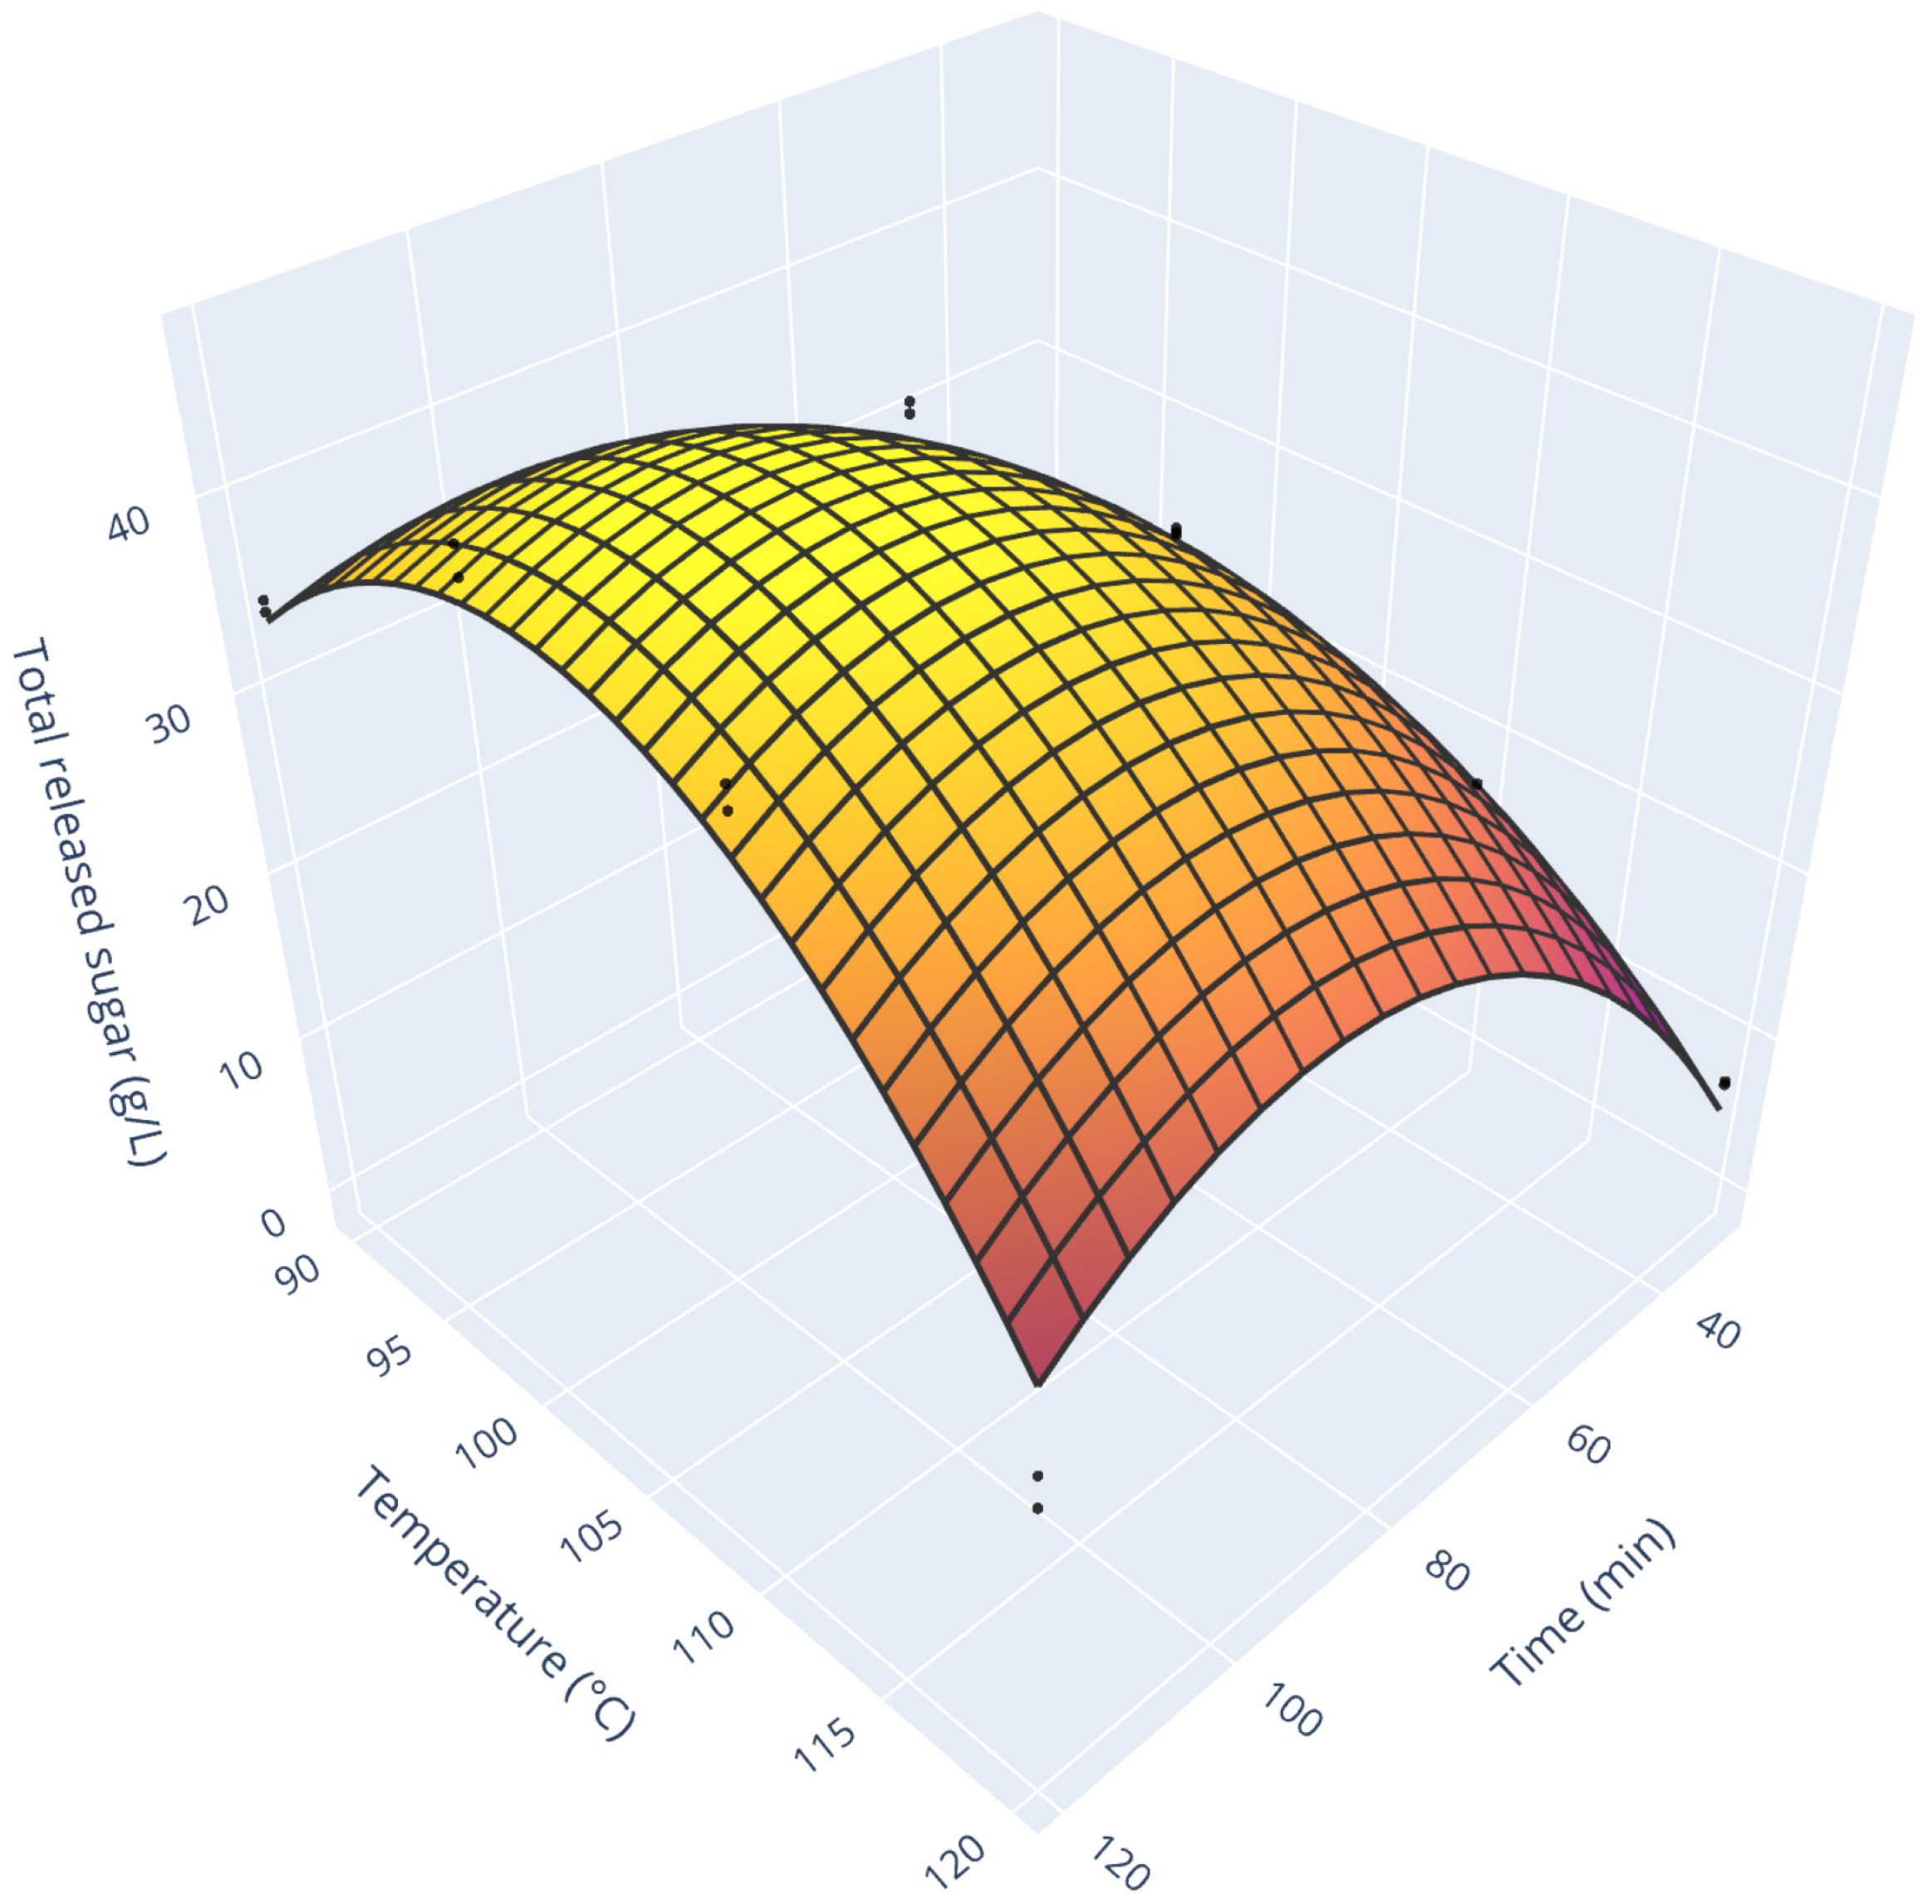
Figure 4 presents the total released sugar concentration as a function of treatment duration and temperature. As one can see, both operating conditions exhibit coupled, non-linear effects. Increasing treatment duration increased the amount of released sugar with a first-order exponential trend at low temperatures. Still, at high temperatures, the trend does not stabilize and decreases. From our visual observation, it corresponds to the darkening of the product. The combination of these two observations points toward the onset of Maillard’s reaction. Over the course of this reaction, reducing sugars (such as glucose and fructose) undergo a multistage transformation in the presence of amine compounds (such as amino acids). The final products of Maillard’s reaction are melanoïdins (dark brown compounds). Furthermore, this reaction appears at moderate temperature (around 100 °C, [
35]), which is exceeded for our most severe conditions. All in all, this reaction would explain both the coloring of the hydrolysis products and the decrease in sugars concentration.
In terms of absolute values of sugar concentrations, our findings (44.4 g/L for 99 min run at 103 °C) agree with the literature. From our literature survey (
Table 7), the reported total sugar concentrations range from 19.37 for potato peel waste to 77.61 g/L for whole potatoes. Still, various substrates and operating conditions have been tested by other authors. This calls for caution when comparing to their results. Furthermore, absolute concentrations of extracted sugars are only a partial indicator of the process performance, as the solid/liquid ratio bears a tremendous weight over it. A complementary indicator is the sugar yield on a dry matter basis (computed in
Table 7). First of all, sugar yields obtained on potato peel waste are consistently lower than those obtained on potato or starch. This can be explained by the nature of the substrate itself. On the contrary, the results reported with potato (pulp or whole) are consistent, with little dispersion around 750 (±25) g/kg. On this scale, too, our process compares well with other reported works.
3.2. Yeast Cultivation
Figure 5 presents the yeast cell growth rate for different tested conditions. A general decrease in cell growth rate with increasing acid hydrolysis duration and temperature can be observed from this response surface. These two effects seems relatively linear and independent, as confirmed by the low values of
,
, and
coefficients compared to
, and
(
Table 6). The combination of both effects (high treatment duration and high temperature) leads to almost zero growth rate.
Furthermore, cells only marginally consumed sugars for the long treatment time (75 and 120 min). These runs correspond to the operating conditions for which the concentration in inhibitor is the highest (
Table 5). Focusing on yeast growth inhibitors concentrations, it can be seen that they are at their peak for the high-temperature runs. On top of temperature, treatment duration increases their quantity even further. This observation correlates well with the consensus that Maillard’s reaction can have a dual effect. If properly conducted, it can increase the antioxidant content of the product, while, if too harsh, it releases harmful compounds [
35]. This highlights even further the fact that hydrolysis performances cannot only be quantified with chemical analysis and reinforces the need for biological assays. Finally, for the harshest runs, the final HMF concentration is around 200 mg/L, which is close to the 50% Inhibition Concentration (200 < IC
50 < 400 mg/L) of
Saccharomyces cerevisiae growth rate [
36], which underlines even more than the growth unfolded under adverse conditions.
The reported growth rates are lower than those of previous work we led with the same strain, even for low inhibitor concentrations configurations. Using classical YPD medium (8 g/L D-glucose, 10 g/L yeast extract, 20 g/L peptone), we obtained growth rate around 0.2 1/h [
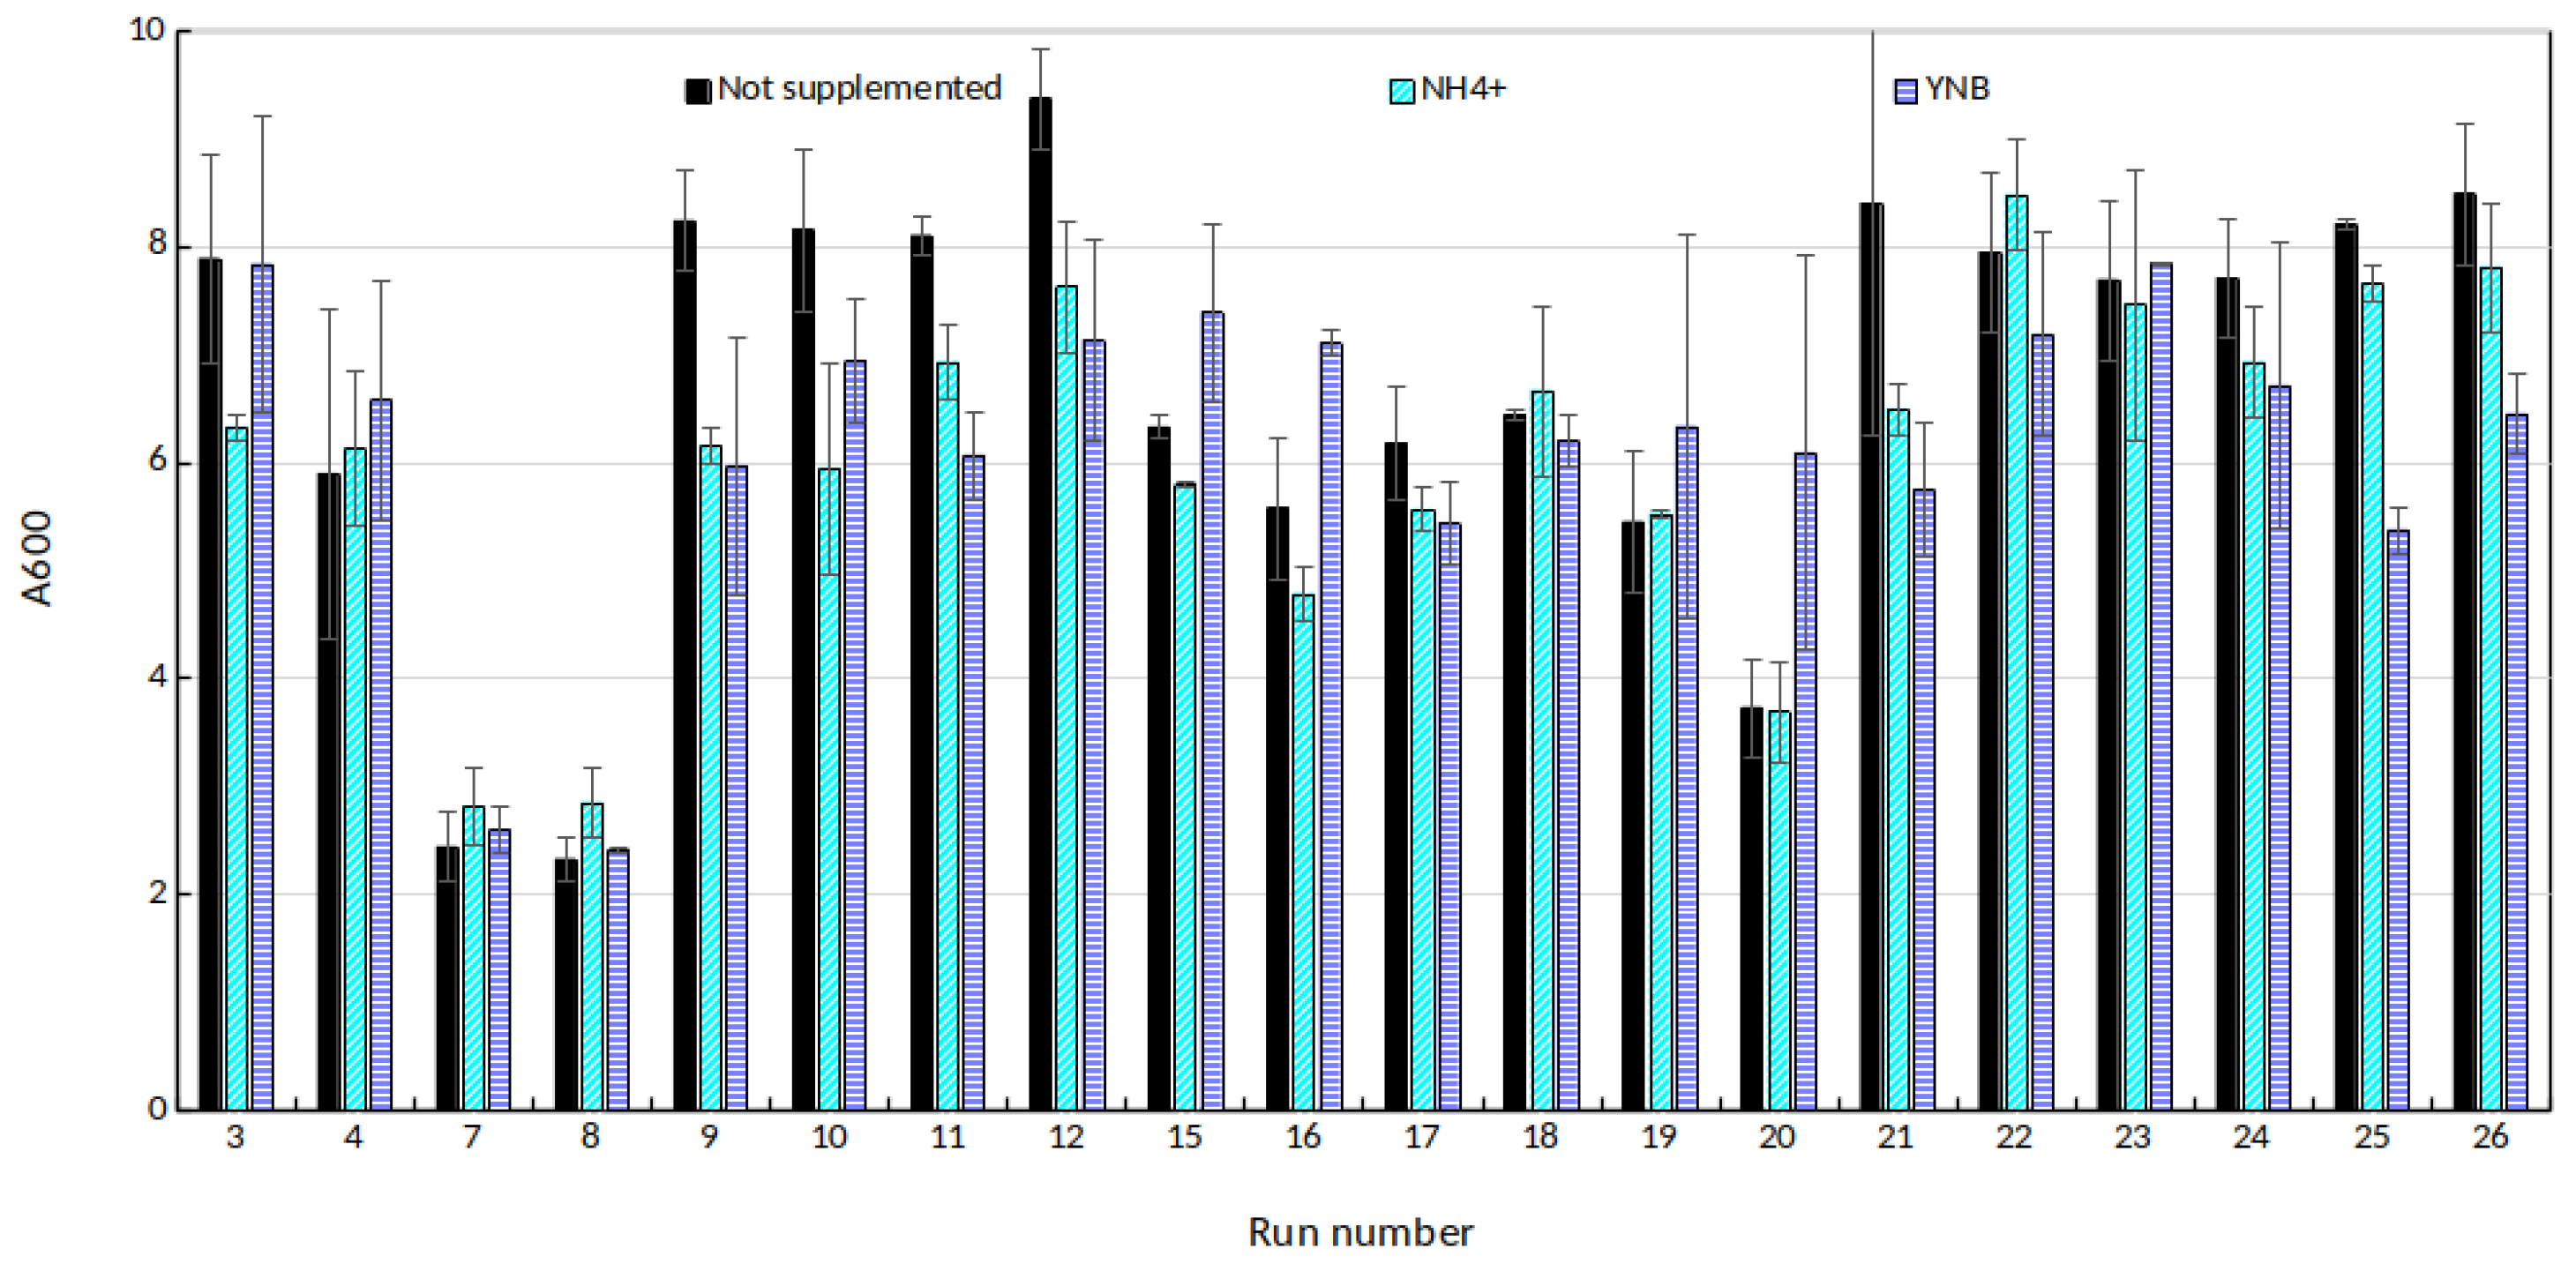
37]. This could suggest a limitation. The obvious candidate would be nitrogen, as potatoes cannot be considered as a nitrogen-rich substrate. However, the tests conducted on microwell plates to assess the relevance of nitrogen supplementation (
Figure A1) showed that neither
nor Yeast Nitrogen Base addition had a significant impact on cell yield (
p = 0.237). Substrate inhibition can also be ruled out as the maximum sugar concentration is 41.39 g/L which is far too little to inhibit
Saccharomyces cerevisiae. A possible explanation lies with the growth inhibitors generated through acid hydrolysis. While they are easily detected for the harshest runs, they could also be present in trace amounts for all the runs. Their content would increase with treatment duration and temperature, explaining the observed decreasing trend.
3.3. Process Productivity
From a process perspective, we can see that the optimal condition in terms of sugar release (
Figure 4) does not coincide with the maximum cell growth rate (
Figure 5). Therefore, the exploration of the combination of both sugar release and cell ability to thrive on the substrate is a complex coupled problem. Addressing it is no simple task. Thus a model was deployed to assess for process productivity. Using the data reported experimentally (sugar concentration and cell growth rate), it was capable of planning the production of a plant (
Figure 2). From this, it was possible to assess process productivity in realistic conditions (e.g., accounting for downtime and workers’ shifts).
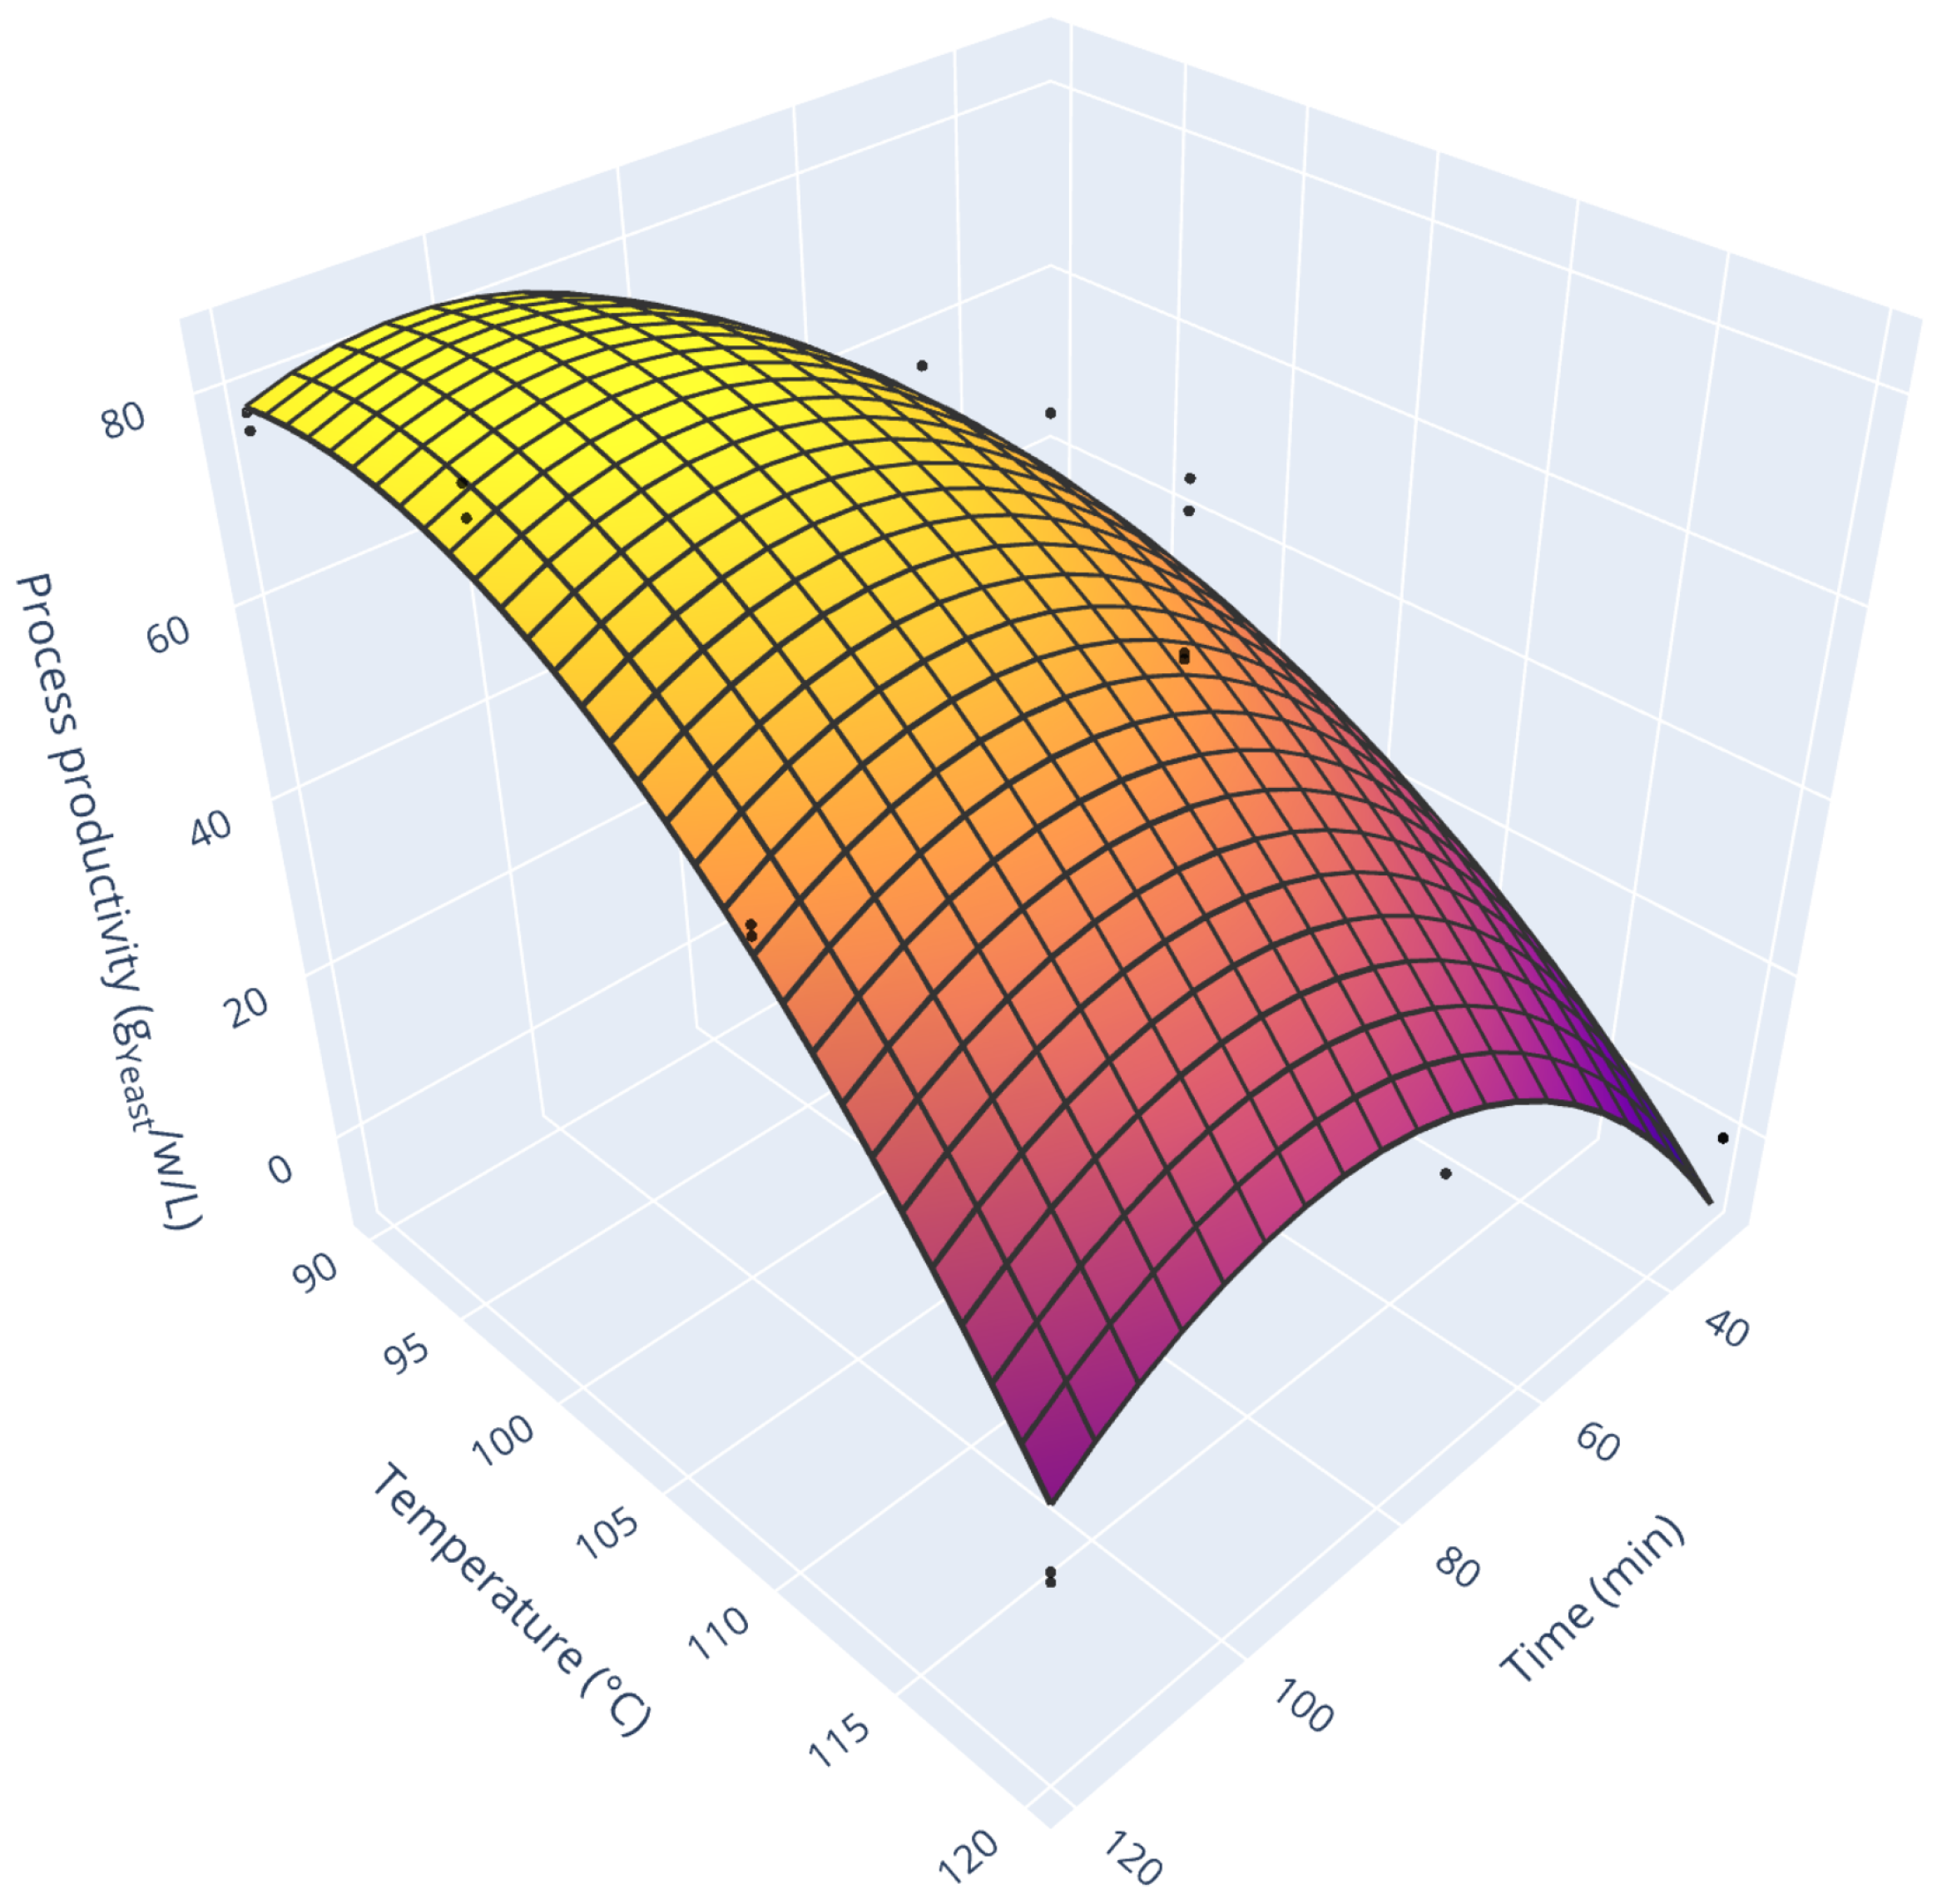
Figure 6 displays the process productivity for all the tested conditions. As one can see, this response surface resembles the one for total sugar release. Still, it is modulated by the growth rate (e.g., very low process productivity for high treatment duration and high temperature). Two comments can be drawn from this graph. While low treatment time and low temperature allow the fastest yeast growth, they also release a relatively low amount of sugars. Consequently, the cultivation time is short (3 h cultivation time for the run 22, fast growth with little substrate), and process productivity is hindered by numerous downtimes (scenario 1 on
Figure 2). On the opposite, high treatment duration and high-temperature results in very long cultivation runs (63 h cultivation time for the run 19, slow growth with a moderate amount of substrate). In this case, the poor biological performances undermine profitability. The maximum process productivity lies in-between those two extremes at 82.8 g
Yeast/w/L for acid hydrolysis of 103 min at 94 °C. Furthermore, this maximum is relatively stable. Indeed, to get a 10% productivity decrease, one should either lower process time by 26 min (keeping the temperature at 94 °C) or lower temperature by 11 °C (keeping process time constant). This stability ensures robust process operation.
3.4. Fed-Batch Operation
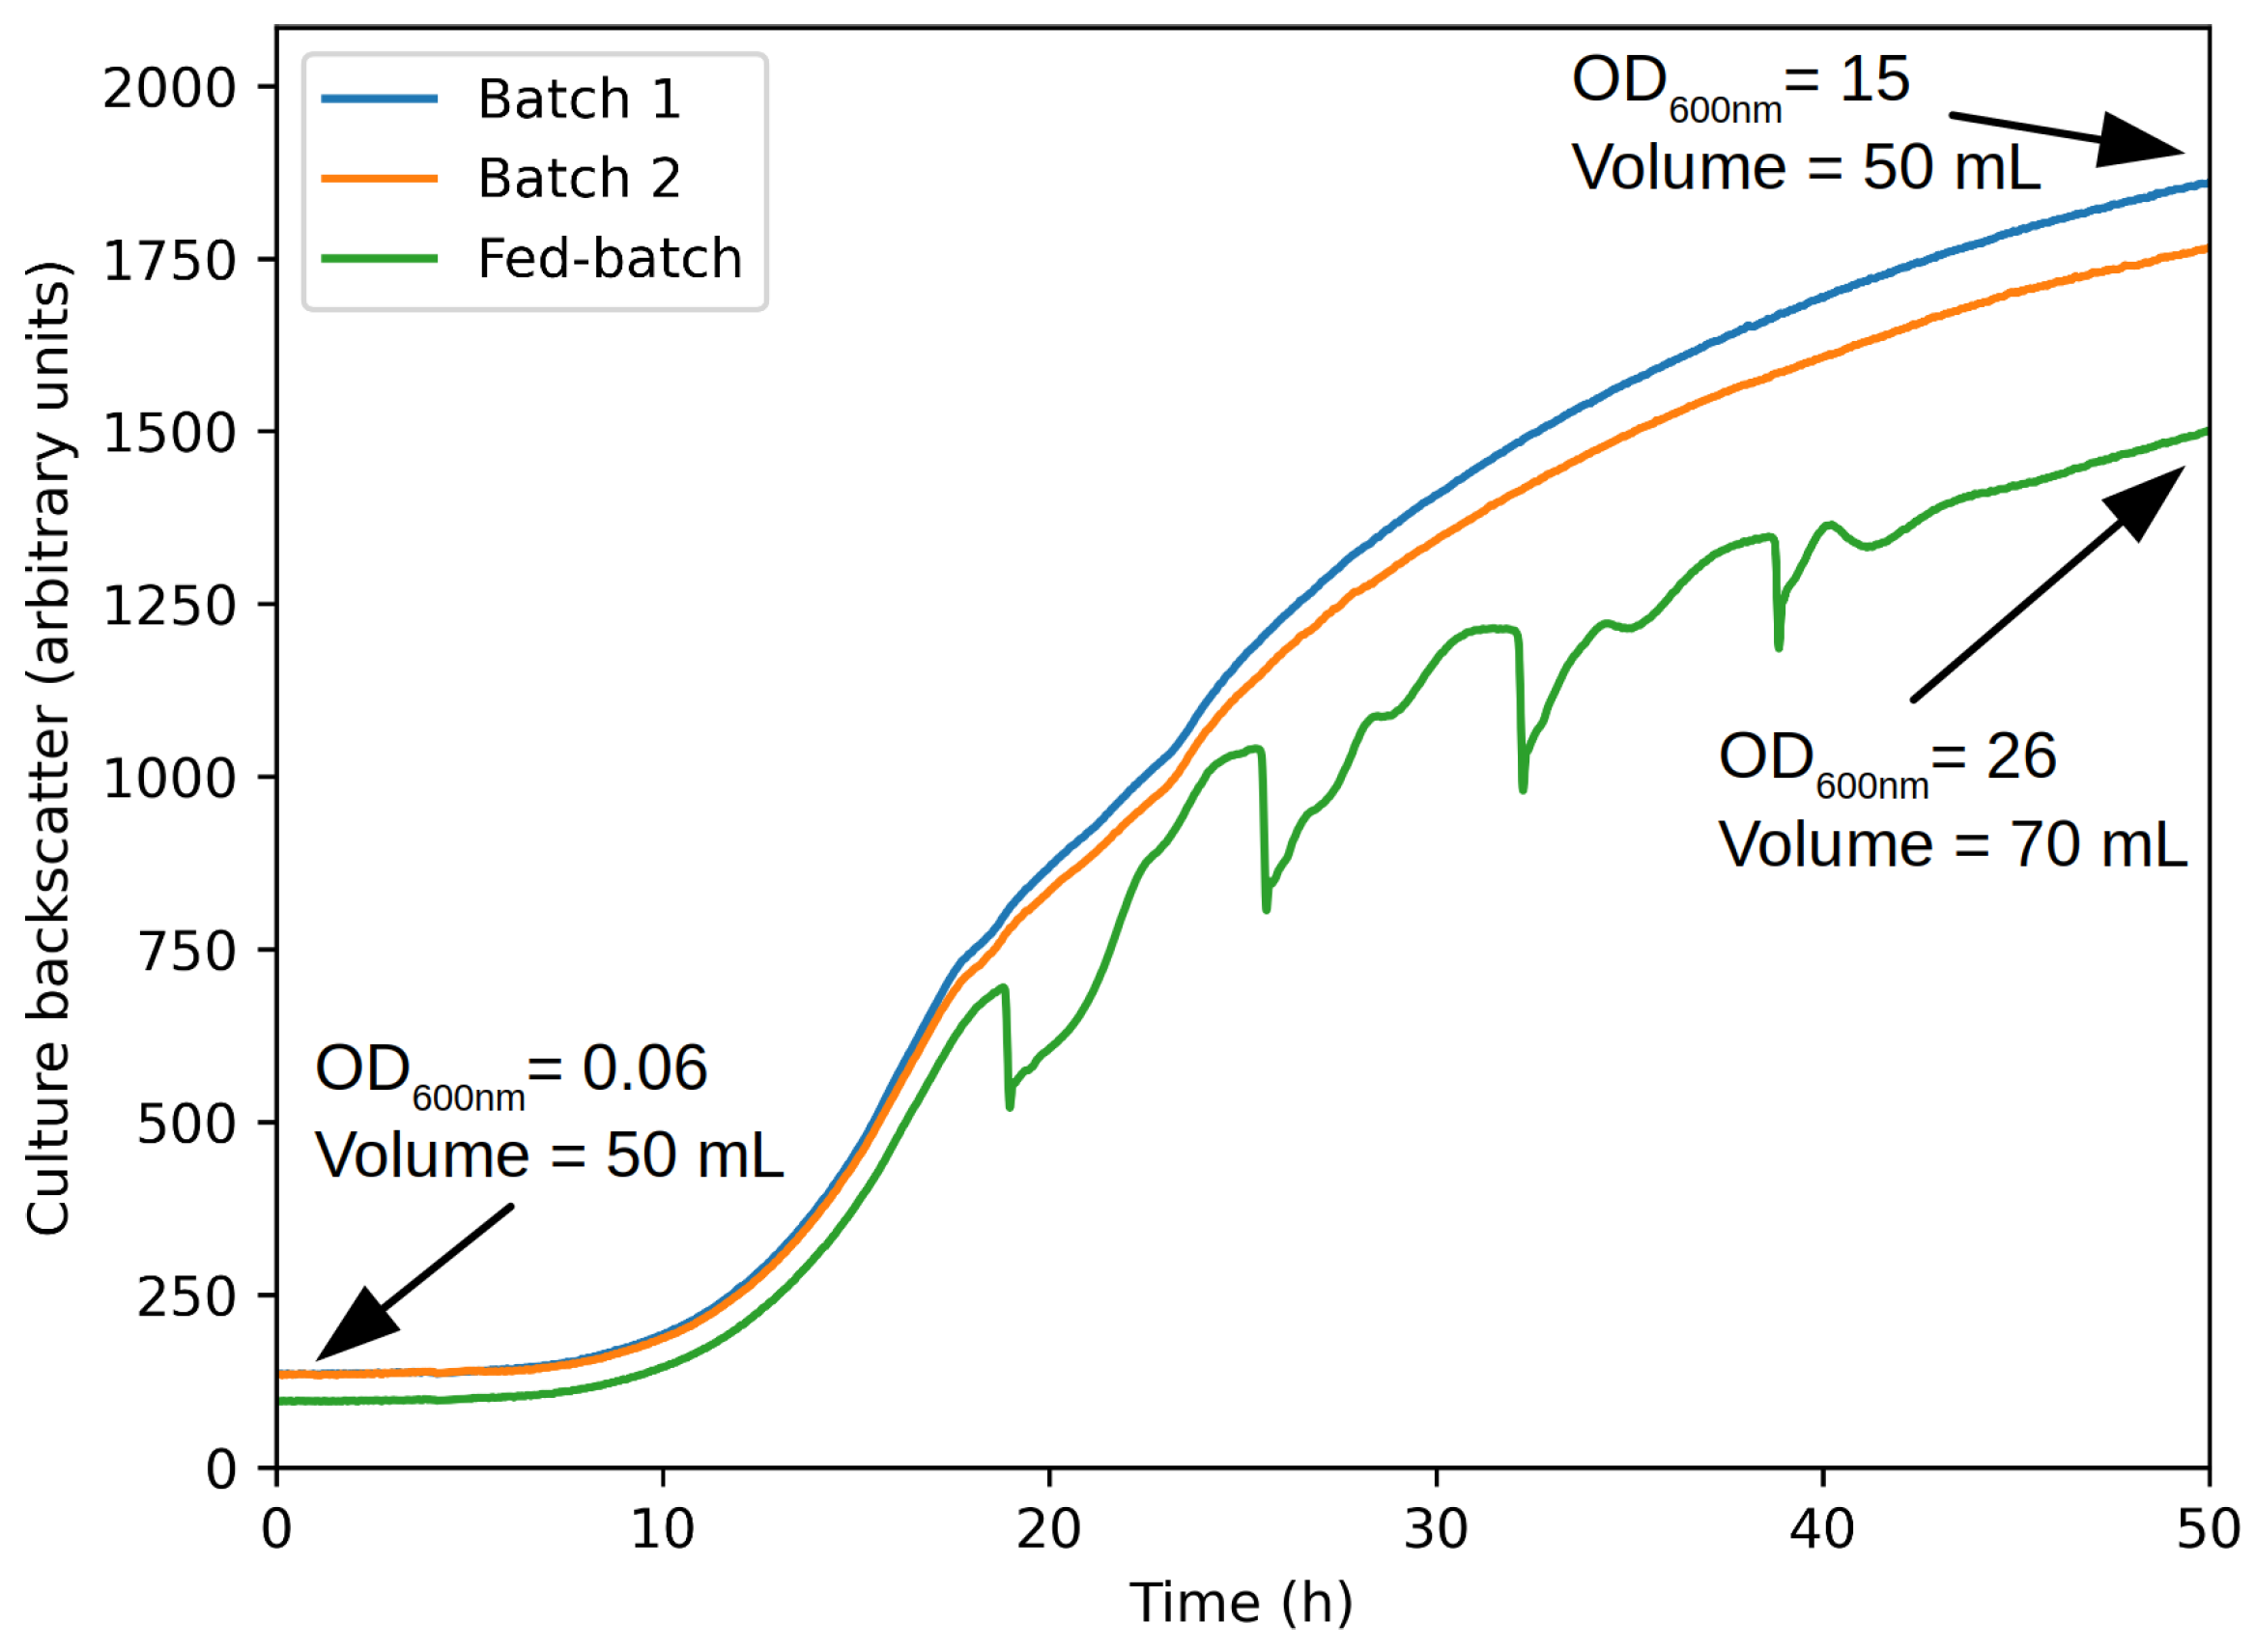
Figure 7 presents the raw backscatter signal from the fed-batch and batch cultures. As one can see, they behave similarly until feed injection. Afterward, the fed-batch signal surprisingly deviates from the two others. While it is normal that dilution originating from the feed induces an immediate decrease in cell concentration, hence the backscatter signal, this signal should surpass the two others with time. This unexpected deviation is attributed to the special nature of the medium used in this case. Anyway, the signal is still informative. Indeed, one can see that cell growth was not stopped by concentrated hydrolysis medium injection. This was the primary purpose of this test. Going one step further, the final volume and optical density can be used to assess for potential change in the behavior of the culture (lower cell production, for example). Cell final concentration can be evaluated by multiplying the culture optical density and volume (15 × 50 for batch and 26 × 70 for fed-batch). The fed-batch cell concentration is about 118% higher than batch one, which correlates almost perfectly with the sugar supply increase (double for fed-batch). Hence, it can be concluded that fed-batch operation is biologically possible with the concentrated hydrolysis medium.
Consequently, the productivity of an industrial fed-batch process was investigated numerically.
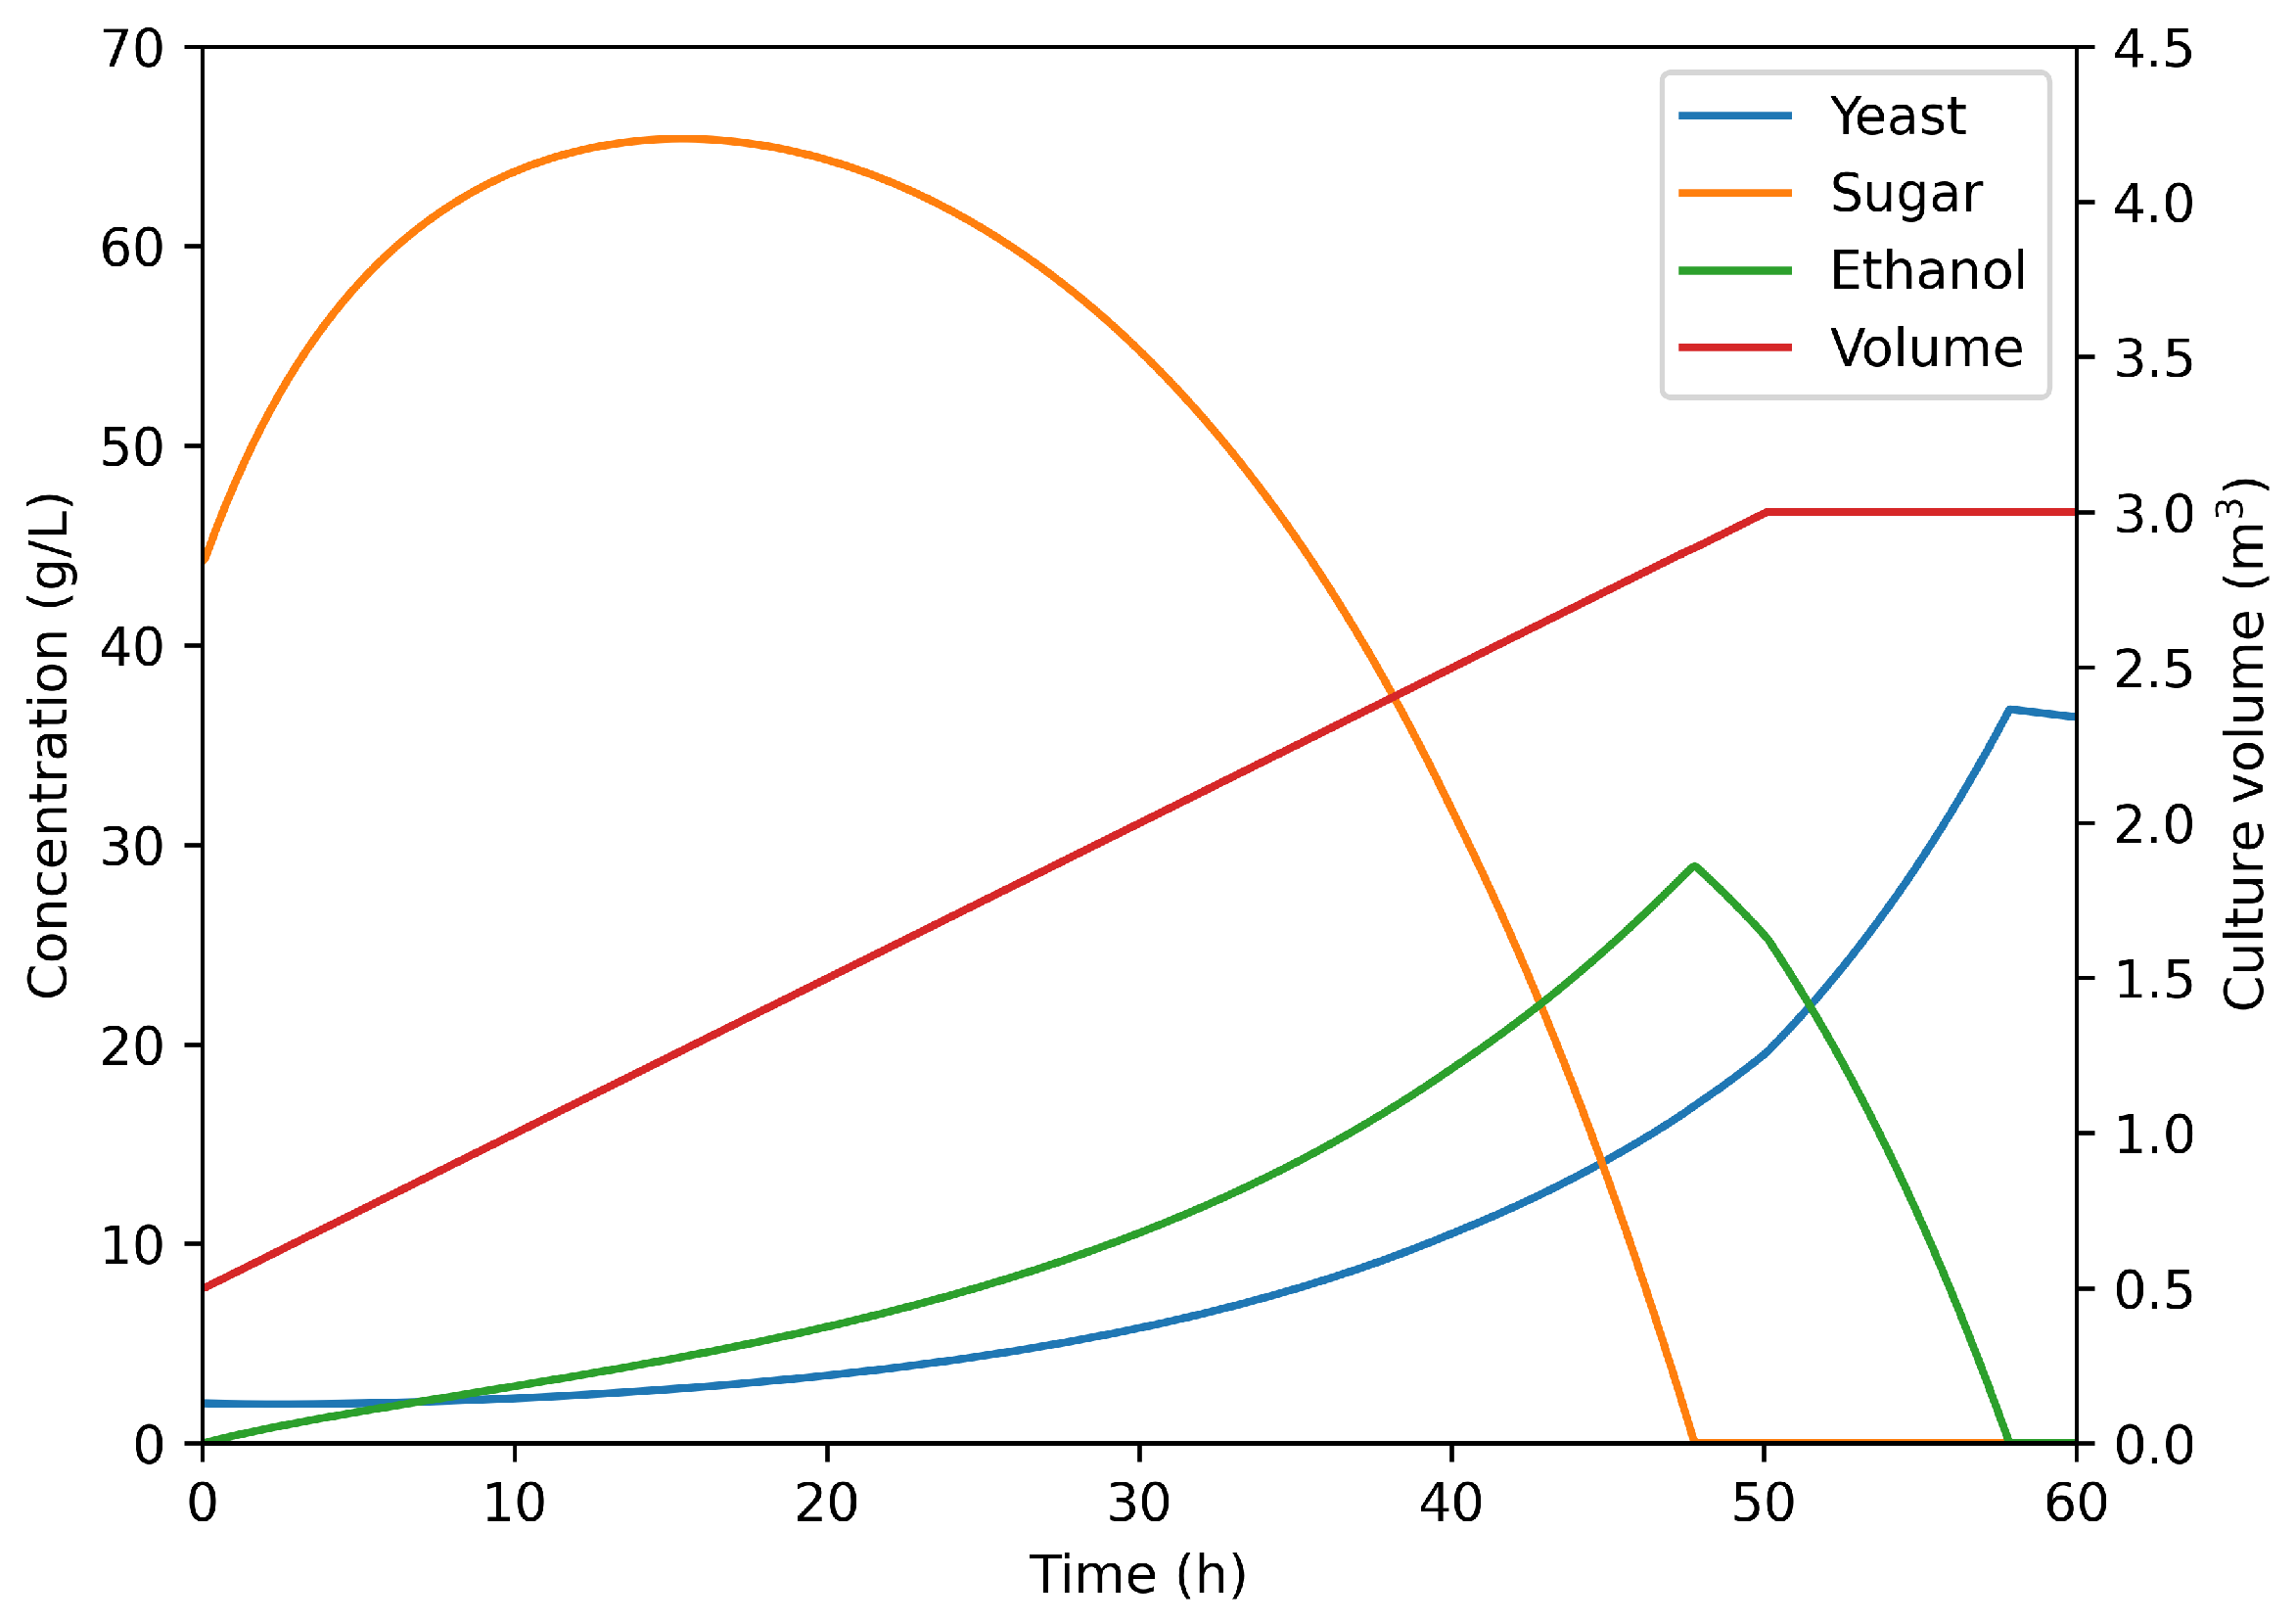
Figure 8 presents the growth prediction for 3 m
3 fermenter operated in linear fed-batch mode (feed: 50 L/h of concentrated hydrolysis medium). As one can see, the run last 58 h and yields a final yeast concentration of 35 g/L. Furthermore, sugar concentration does not reach 70 g/L (the level at which glucose inhibition starts to appear [
38]). In terms of process weekly productivity, accounting for actual worker shifts and downtimes, the fed-batch operation allows to reach 110 g
Yeast/w/L. This represents an increase of 33% over the classical batch operation, confirming its relevance as an industrial strategy to increase profitability.
4. Conclusions
This article presented the production of the yeast Saccharomyces cerevisiae using food-grade potato waste as substrate. The first step was to deconstruct potato starch into fermentable sugars using sulfuric acid hydrolysis. Then, the pH was adjusted by adding sodium hydroxide, and cell growth was monitored. This procedure was led over a large range of temperature (90–120 °C) and operation time (30–120 min) to optimize the results. Results were agglomerated to power various response surfaces (sugar release, cell growth, and process productivity). The maximum sugar release (44.4 g/L) was obtained for 99 min under 103 °C. Longer, of higher temperature, hydrolyses saw the onset of Maillard’s reaction, leading to a decrease in available sugars content and the production of yeast growth inhibitors. The cell growth rate was adversely affected by both parameters. It was, therefore, necessary to find the best compromise between sugar release and cell growth to determine the most efficient process parameters. To do so, a model combining biological performances and process planning was developed. The best process parameters would be achieved for 103 min of treatment under 94 °C and yield a process productivity of 82.8 gYeast/w/L, or even 110 gYeast/w/L if the culture is conducted as fed-batch. Finally, all the different process steps preserved the food-grade quality of the initial substrate. Finally, as pH from the acid hydrolysis has been neutralized, the yeast-enriched material could directly be used in feed formulation.
