1. Introduction
In recent years, the agricultural field has been confronting difficulties such as the aging of farmers, a shortage of workers, and difficulties for new farmers [
1]. These factors have led to labor shortages caused by a decreased working population. To resolve labor shortages, it is necessary to conserve labor resources in agricultural work and to improve the agricultural productivity. Smart agriculture has been emphasized to resolve these difficulties [
2]. Smart agriculture includes the use of drones to monitor field growth [
3,
4], autonomous tractors to save labor [
5], and machine learning to predict crop harvesting times [
6]. This study specifically examines the prediction of crop harvesting times.
The benefits of predicting crop harvesting times are the following. Prediction can determine the number of workers necessary for harvesting work and can be used to allocate suitable human resources in the field. Therefore, effective utilization of human resources, conservation of labor, and reduction of labor costs can be expected. Additionally, quality can be stabilized by optimizing harvesting times and by providing decision-making support for new farmers.
Predicting the harvesting times of crops requires the use of various indexes. For tomatoes, the color change and contents of nutrients are used as indexes to predict the harvesting times of tomatoes [
7]. Predicting the best time to harvest based only on environmental information is often difficult. In actual farming, experienced farmers know the harvesting time from the state of the bunches and can therefore predict the harvesting time. This study specifically examines the prediction of the harvesting time for indoor tomato cultivation. Mask R-CNN is an effective method to detect fruit bunches in agriculture fields. For example, the method can be used to determine the harvestability of fruit bunches, to judge diseases of fruit bunches, and to locate infected parts of fruit bunches [
8,
9]. This paper presents a proposal of a method for predicting tomato harvesting time to save labor in agriculture and to support decision-making for new farmers. Mask R-CNN is used to detect tomato bunches and to remove the calyces, leaves, and branches. Then, only the detected bunch images are used to predict the tomato harvesting time.
2. Conventional Research
Earlier studies can be discussed in terms of the accuracy of tomato harvesting time prediction methods. The prediction of harvesting time using weather information has been described in the literature. A method exists for predicting the harvest time using a regression model based on solar radiation and past shipments [
10]. Higashide et al. found that a correlation exists between shipping volume and solar radiation. Solar radiation is an important factor affecting the prediction of harvesting time. Nevertheless, predicting the harvesting time of individual tomato fruits with a high degree of accuracy is difficult. Contributing to labor-saving and the determination of the appropriate harvesting time is therefore difficult.
In another case, harvesting time prediction was performed using machine learning and fruit bunch images [
11]. First, the harvested tomato bunches were photographed indoors. Next, tomato bunch images were created by segmentation. Tomatoes were classified into three growth stages using a back-propagation neural network. However, because the images were not taken in the field and because post-harvest images were used, this method might not be applicable to pre-harvest tomatoes.
A study of tomato harvesting time prediction used spectral images and machine learning [
12]. The report by Doi et al. used a spectral camera and an RGB camera to photograph tomato fruits directly. From those obtained images, they predicted the harvesting time using a neural network. Consequently, there was an error of about two days with the training data. Predicting the harvesting time of individual tomato fruits with high accuracy using machine learning and fruit bunch images was shown to be difficult.
In addition, harvesting time prediction has been performed using machine learning and weather information [
13,
14]. The reports of Salazar et al. and Movagharnejad et al. predicted the harvesting time by training a neural network with environmental information such as temperature and solar radiation, in addition to past shipment volume. Results indicated solar radiation as an important element for predicting the harvest of tomatoes when using weather information with tomato yields using machine learning. Nevertheless, the highly accurate prediction of the harvesting time of individual tomato fruits is difficulty. Therefore, results of those studies might not contribute greatly to the prediction of crop yields, labor-saving methods, and assistance for new farmers.
Conventional studies are insufficient for prediction for individual tomato fruits. As described herein, we propose a method to detect tomatoes using Mask R-CNN. To improve the prediction accuracy, the tomato bunch images are removed from the calyces, leaves, and branches. The harvest time is predicted using only the tomato bunch images, from which the leaves, branches, and calyces have been removed.
3. Tomato Harvesting Time Prediction
3.1. Proposal System
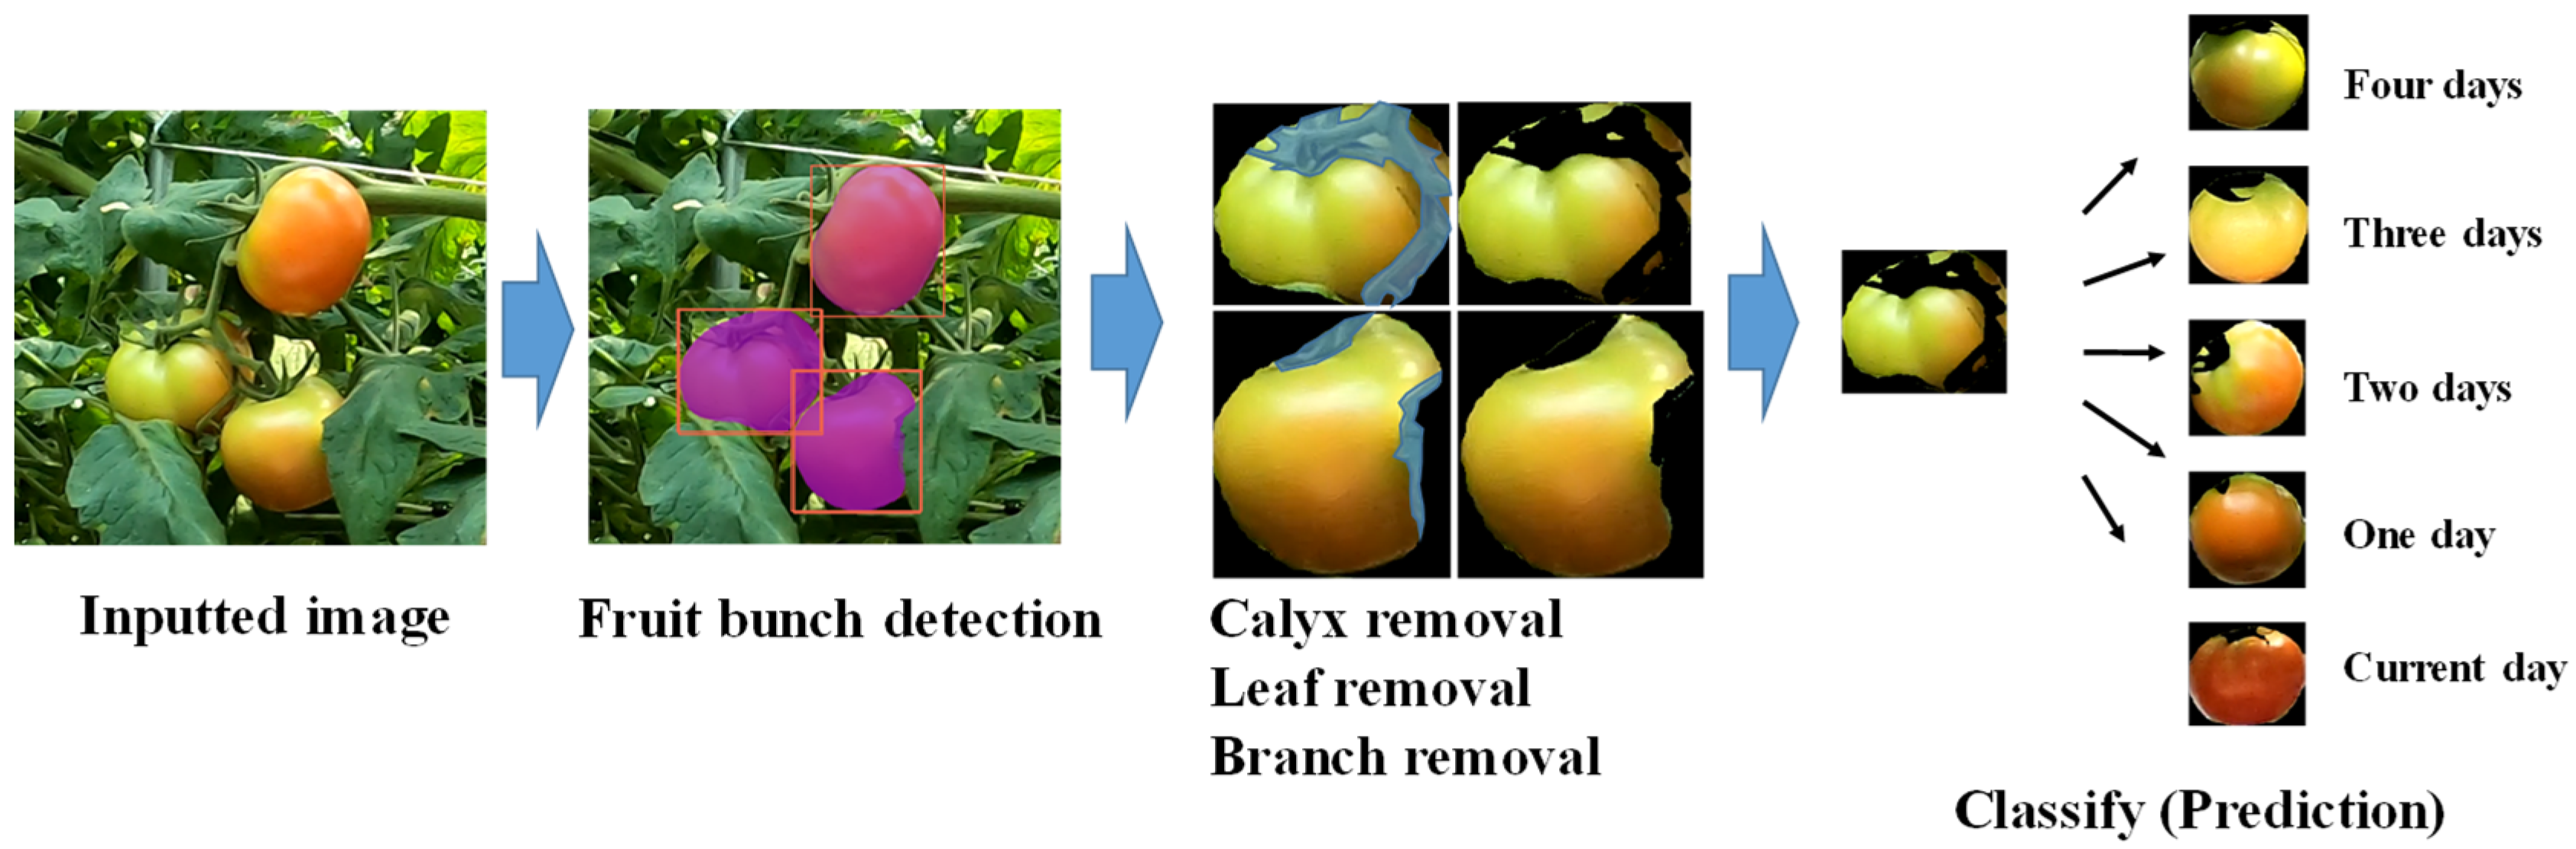
This report describes our study of tomato harvest time prediction. After tomato bunch images were extracted from the input image, the tomato harvesting time was predicted using only the tomato bunch images without the calyces and leaves.
Figure 1 portrays the flow of harvesting time prediction.
First, to create a tomato bunch detector, we have Mask R-CNN [
15] train with the Laboro Tomato dataset [
16] and tomato images taken in the field. Next, tomato bunches are detected in the input image using the tomato bunch detector. Using color information for prediction is difficult because the detected tomato bunch images include calyces, leaves, and branches.
Here, calyx, leaf, and branch images are designated as noise. A noise remover is created by training a Mask R-CNN on the noise in the detected tomato bunch image. A noise-removed tomato bunch image is created from the tomato bunch image using a noise remover.
The tomato bunch ripeness is calculated from the color information of the removed noise images. The harvesting time is classified into five stages. In other words, we predict tomatoes in five stages. For example, four days means that the tomatoes can be harvested after four days. The benefit of this method is that it improves the detection accuracy and processing speed by removing noise from the fruit bunch image after tomato detection.
3.2. Harvesting Time Prediction Method
Here, we describe the method for harvest time prediction. According to a report of an earlier study [
17], tomatoes take 4–5 days from the time the bunches are colored to the time they are ready to be harvested. It was also commented by an experienced expert that about 5 days are necessary to harvest. Based on that knowledge, we used the ripeness of tomatoes to predict the harvesting time of tomatoes in five stages.
We use the fact that the ratio of
R to RGB in the tomato bunch image increases as the tomato nears the harvestable stage. In an actual field, farmers use a color chart to ascertain, based on their color, whether tomatoes can be harvested. For this study, we strove to classify the harvesting time by tomato bunch color using the RGB values of the images [
18].
Finally, we use two methods to ascertain the level of ripeness. One method is to use the ratio of R in the RGB values. It is the ratio of the sum of R in the sum of RGB of the tomato bunch image as shown in the following equation.
The ratio of
R in RGB values:
Therein, M and N represent the height and width of the tomato bunch image, respectively.
The other method uses the average of the differences between the R and G values for each pixel in the tomato bunch image, as shown in Equation (2).
Average of the differences between
R and
G in RGB values:
Therein, M × N represents the sum of the pixels of the tomato bunch image.
The ripeness is calculated using the two methods above with classification into five stages of tomato harvesting time.
4. Basic Experience
4.1. Method of Experiment
In the basic experiment, the results classified by the two harvesting time prediction methods are compared with the results classified by the experienced farmer to decide the threshold for determining ripeness. Images used for the basic study were taken at the Japan Agricultural Co-operative (JA) Yamagata farm by GoProHERO8 [
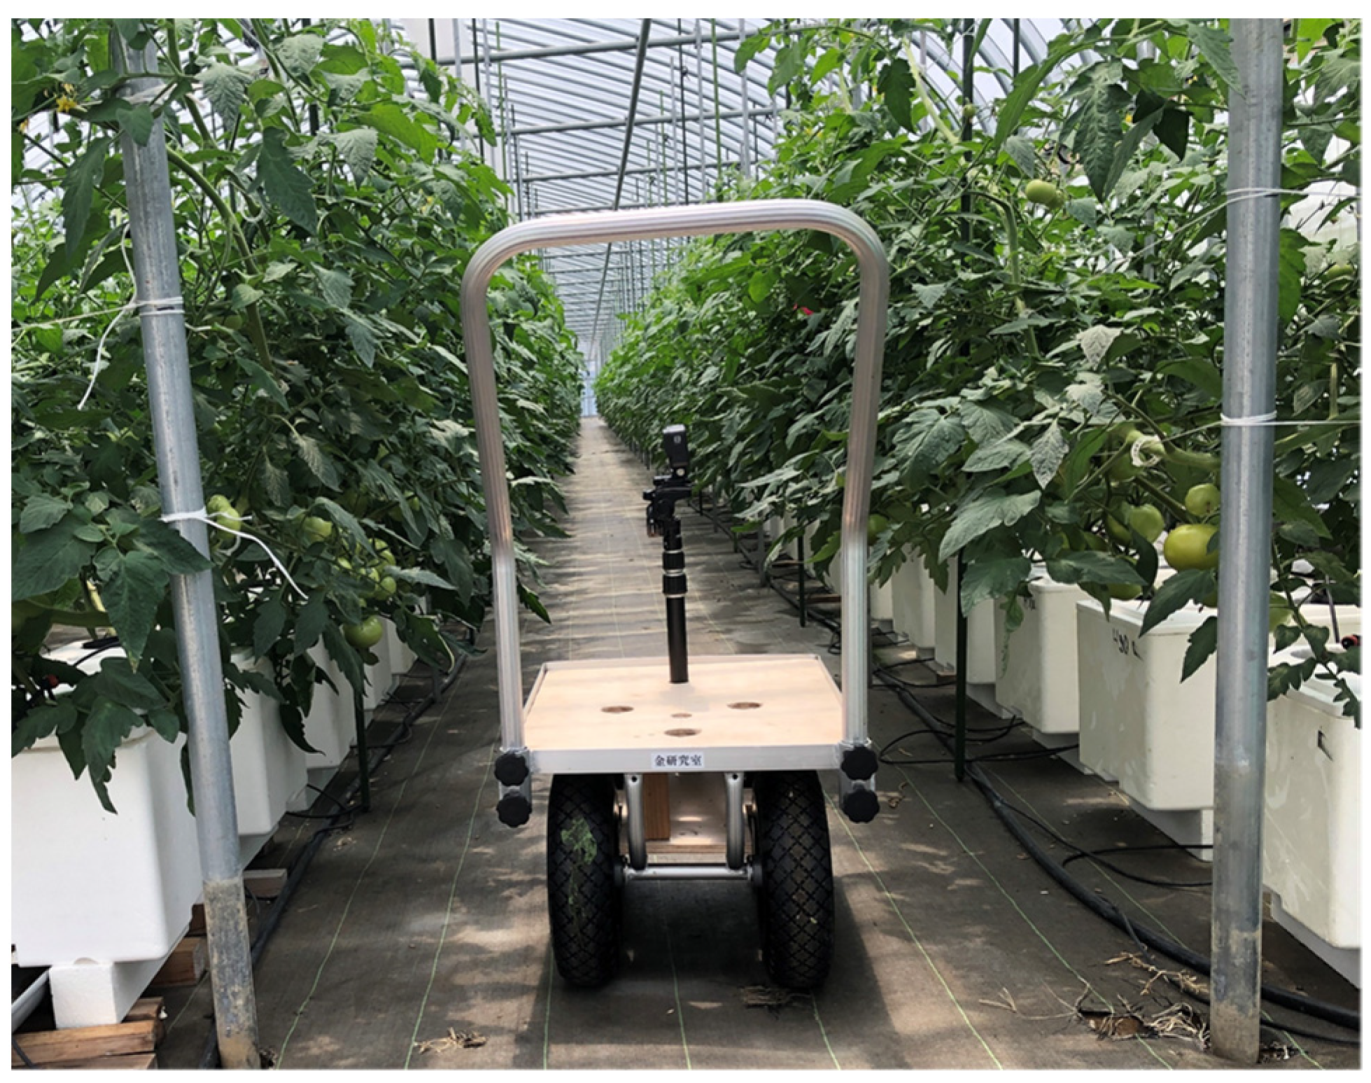
19]. A camera was mounted on a cart to capture images of four rows of tomato plants being planted in greenhouses.
Figure 2 shows the images being taken.
The images used for the basic study were taken on 18, 21 and 25 August 2020, from 10:00 AM. We acquired tomato bunch images from the video using Mask-R-CNN. In all, 884 tomato bunch images were used as threshold determination data and training data. In addition, 126 tomato bunch images from the remaining rows were used as test data.
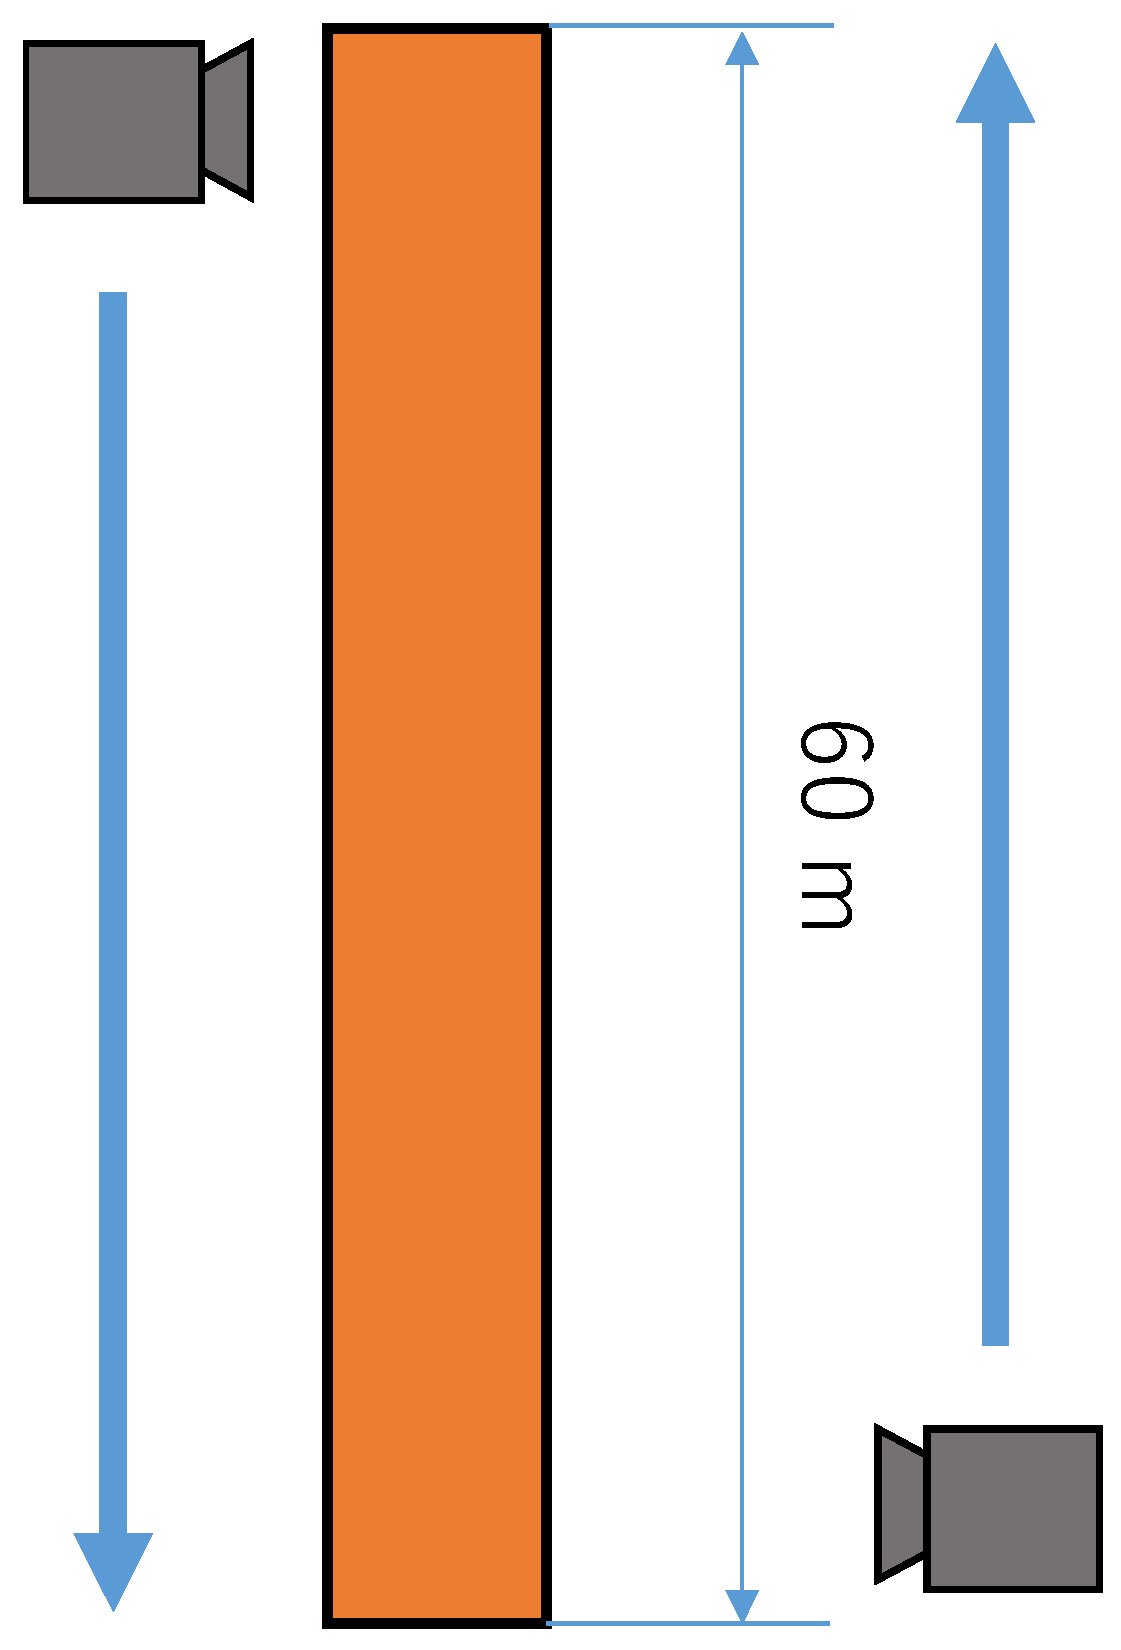
Figure 3 presents the camera position for the rows of plants in the field.
All images were classified visually into five stages by harvesting time by an experienced tomato farmer. The two types of data for these images are training data and test data.
Table 1 presents classification results of training data to determine the threshold and
Table 2 shows classification results of test data to evaluate the performance of this method.
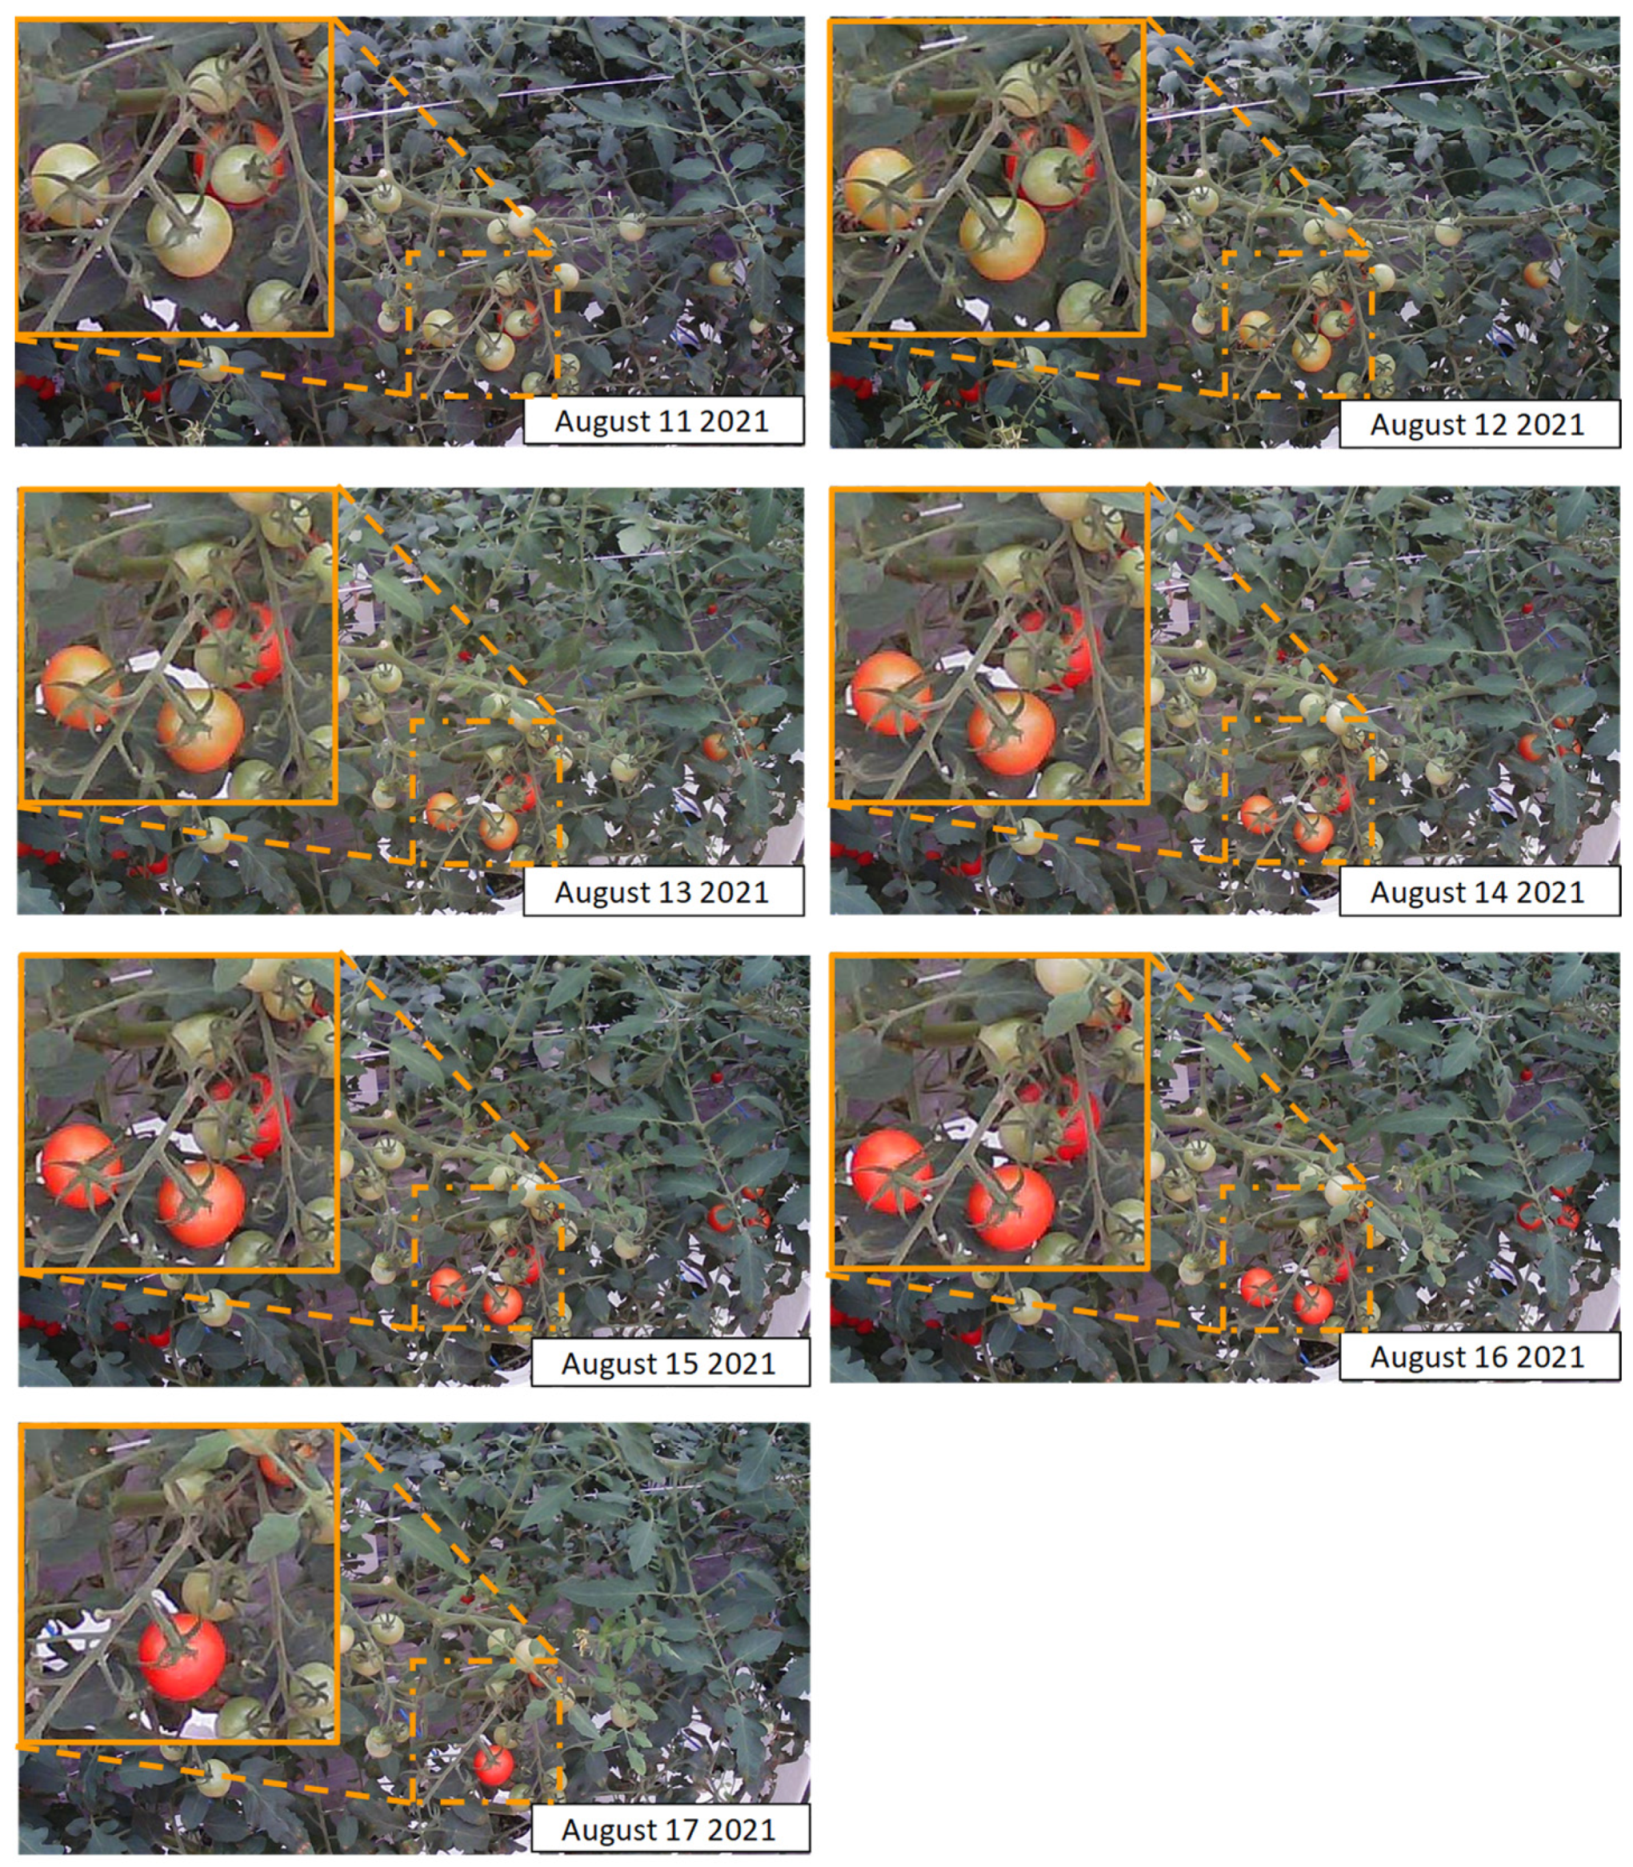
Figure 4 presents an example of a tomato bunch image classified by an experienced tomato farmer. To classify the harvesting time, the ripeness is calculated from the training data. The threshold is determined by the ripeness. The classification results by the two methods of ripeness determination are compared with the results classified by experienced farmers. We set up a fixed-point camera in an actual field and confirmed that tomatoes can be harvested 4–6 days after coloring. Images taken using the fixed-point camera each day are presented below.
Figure 5 shows images obtained from a fixed camera. The tomatoes were harvested on the fifth day after coloring.
4.2. Results
Table 3 and
Table 4 present prediction results obtained using the average of the differences between
R and
G values.
Table 3 shows the predicted results with noise and
Table 4 indicates the predicted results without noise. The vertical axis shows the results of classification by experienced tomato farmers. The horizontal axis shows results of classification by each ripeness determination method. Higher accuracy of the diagonal part yields better results.
Results show that the prediction results based on the average of the difference between R and G in RGB values are more accurate after three or four days of harvesting. Removal of noise from the fruit bunch images improved the prediction accuracy on the current day, one day later, two days later, and three days later.
This method can accurately classify tomatoes that require a few days to harvest. The reason is that the sum of the differences between R and G is large for tomato bunch images that can be harvested in three and four days.
Table 5 and
Table 6 indicate that prediction results based on the ratio of
R in RGB values are more accurate at predicting the number of days close to harvest. By removing the calyces, leaves, and branches from the fruit bunch images, the prediction accuracy at three days was improved.
Results obtained from the basic experiment indicated that the harvest prediction method based on the ratio of R in the RGB of the fruit bunch image was good for harvest time prediction on the current day. However, the method using the average of the differences between green and red gave better prediction accuracy 3 and 4 days later. The ripeness determination method used to make predictions on the day of the event is applicable to the ratio of R in RGB values. The average of the differences between the R and G in RGB values is useful to make predictions for three and four days later.
Because the images used for the test data were taken during the daytime, variations in the lighting environment affected the ripeness discrimination using color information. The accuracy of harvesting time prediction might be improved by taking images at night and by maintaining a constant lighting environment.
5. Demonstration Experiment
5.1. Method of Experiment
Here, two types of ripeness determination methods are used to predict tomato harvest time in the field. Images for the experiment were taken from 19 August 2021–27 August 2021 in the same field as that used for the basic study conducted under the same conditions. The test data were images obtained from a movie taken 20 m from the right side of a row of plants in a greenhouse. Others were used as training data. JA employees harvest twice a week. Therefore, it is impossible to evaluate the harvesting time prediction for each day. The images taken on the day of harvest and one day before the harvest were compared. Then, only the harvested images are used to evaluate the harvesting time prediction. We visually selected the harvested tomatoes from videos taken each day and used 100 tomatoes for the test.
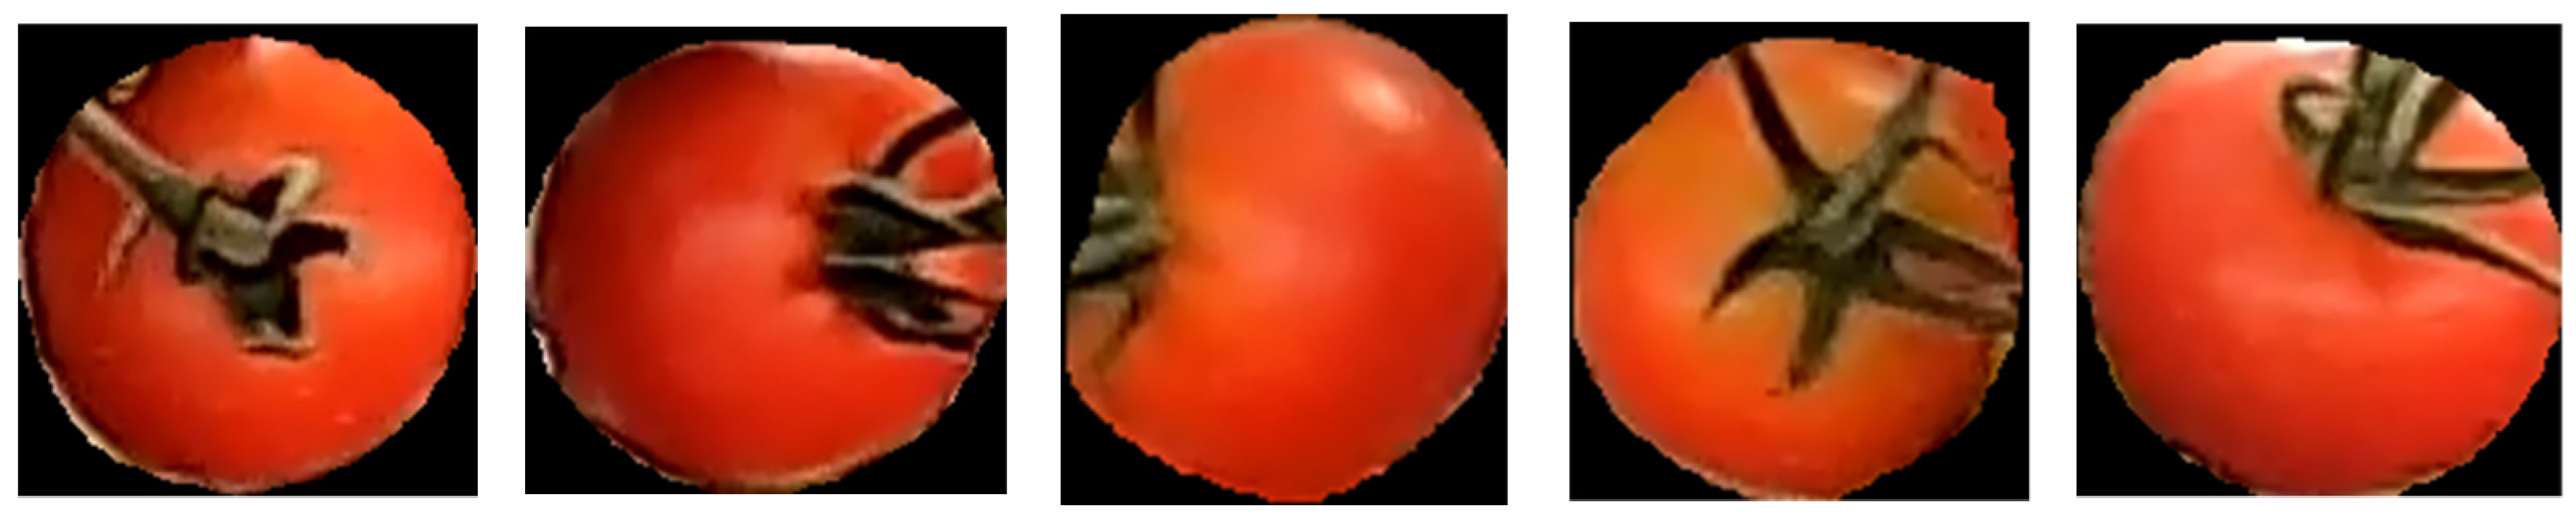
Figure 6 portrays examples of tomato bunch images of a harvested tomato.
We used ripeness determination methods of two types to predict the harvesting time. Here, the same threshold values as those used for the basic study were used.
5.2. Results
Table 7 and
Table 8 present the prediction results obtained using the average of the differences between
R and
G values in both cases with and without noise in the detected tomato bunches. In the case of noise in the tomato bunches, the prediction accuracy on the current day was 80%. When the noise was removed from the tomato bunch image, the prediction accuracy on the current day was 92%. The prediction accuracy was further improved.
Table 9 and
Table 10 present prediction results obtained using the ratio of
R in RGB values. All tomato bunch images were predicted as tomatoes that could be harvested on the current day.
Results obtained from comparison of the method using the ratio of R in RGB values and the method using the average of the differences between R and G in RGB luminance values revealed that the method using the ratio of R in RGB values was more accurate.
5.3. Discussion
Results obtained from comparison of the method using the ratio of R in RGB values and the method using the average of the differences between R and G in RGB luminance values revealed that the method using the ratio of R in RGB values was more accurate.
This proposal method assumes a tomato harvesting robot. The robot uses an RGB-D camera (e.g., Depth Camera D435i) [
20] to detect and locate tomatoes. An RGB-D camera is a sensor capable of acquiring RGB images and Depth image. This method detects tomatoes from input RGB images. For a harvestable tomato, the coordinates on the RGB image are obtained. The 3D position corresponding to these coordinates is then obtained using the Depth image. This tomato location information is transferred to the robot. In the case of tomatoes that are still unripe, this method will predict the tomato harvesting time and inform the farmer of this information.
Furthermore, this method is applicable to fruit kinds for which ripeness can be determined using color change. Examples include apples, mangoes, pineapples, and strawberries. To apply this method to other fruits, it is necessary to determine the number of days required from raw to ripe using a fixed-point camera in advance. The reason is that the number of days required to harvest fruit varies depending on local environmental conditions.
6. Conclusions
As described herein, we proposed a method for predicting tomato harvesting times to conserve agricultural labor resources and to help new farmers ascertain the best harvesting time. This method detected tomato bunches in an image using Mask R-CNN. Then this method used Mask R-CNN to remove leaves and calyces from tomato bunch images. Only tomato bunch images with no noise were used to predict the tomato harvesting times.
In this basic study, the method using the average of the difference between R and G in RGB values had high prediction accuracy three and four days later. The method using the ratio of R in RGB values had high prediction accuracy for the current day. From this demonstration experiment, we concluded that it is better to use the method of the ratio of R in RGB values to predict tomatoes that can be harvested on the current day. This method’s effectiveness was demonstrated by the results presented above.
Future work is expected to include a method of combining environmental information with this proposed method. The images used for the test data were taken during the daytime. Therefore, variations in the ambient light affected the determination of ripeness. For nighttime, because there is less ambient light, the harvesting time prediction accuracy can be improved. This method is also applicable for use with tomato-harvesting robots and with other agricultural crops.
Author Contributions
Conceived and designed the system, J.K. and D.M.; performed the experiments, contributed analysis tools, and analyzed the data, J.K. and D.M.; writing—original draft, review, and editing, D.M. All authors have read and agreed to the published version of the manuscript.
Funding
This research received no external funding.
Institutional Review Board Statement
Not applicable.
Informed Consent Statement
Not applicable.
Data Availability Statement
The data that support the findings of this study are available from the corresponding author, J.K., upon reasonable request.
Acknowledgments
We would also like to take this opportunity to thank staff of Japan Agricultural Cooperatives Zen-Noh Yamagata for years of collaboration and advice.
Conflicts of Interest
The authors declare no conflict of interest.
References
- Census of Agriculture and Forestry. Available online: https://www.maff.go.jp/j/tokei/sihyo/data/08.html (accessed on 31 August 2021). (In Japanese).
- Walter, A.; Finger, R.; Huber, R.; Buchmann, N. Opinion: Smart farming is key to developing sustainable agriculture. Proc. Natl. Acad. Sci. USA 2017, 114, 6148–6150. [Google Scholar] [CrossRef] [PubMed] [Green Version]
- Gómez-Candón, D.; De Castro, A.I.; López-Granados, F. Assessing the accuracy of mosaics from unmanned aerial vehicle (UAV) imagery for precision agriculture purposes in wheat. Precis. Agric. 2014, 15, 44–56. [Google Scholar] [CrossRef] [Green Version]
- Tatsumi, K.; Igarashi, N.; Mengxue, X. Prediction of plant-level tomato biomass and yield using machine learning with unmanned aerial vehicle imagery. Plant Methods 2021, 17, 77. [Google Scholar] [CrossRef] [PubMed]
- Yin, J.; Zhu, D.; Liao, J.; Zhu, G.; Wang, Y.; Zhang, S. Automatic steering control algorithm based on compound fuzzy PID for rice transplanter. Appl. Sci. 2019, 9, 2666. [Google Scholar] [CrossRef] [Green Version]
- Khan, T.; Sherazi, H.; Ali, M.; Letchmunan, S.; Butt, U. Deep Learning-Based Growth Prediction System: A Use Case of China Agriculture. Agronomy 2021, 11, 1551. [Google Scholar] [CrossRef]
- Choi, K.; Lee, G.; Han, Y.J.; Bunn, J.M. Tomato maturity evaluation using color image analysis. Trans. ASAE 1995, 38, 1171–1176. [Google Scholar] [CrossRef]
- Kang, H.; Zhou, H.; Wang, X.; Chen, C. Real-time fruit recognition and grasping estimation for robotic apple harvesting. Sensors 2020, 20, 5670. [Google Scholar] [CrossRef] [PubMed]
- Jia, W.; Tian, Y.; Luo, R.; Zhang, Z.; Lian, J.; Zheng, Y. Detection and segmentation of overlapped fruits based on optimized mask R-CNN application in apple harvesting robot. Comput. Electron. Agric. 2020, 172, 105380. [Google Scholar] [CrossRef]
- Higashide, T. Prediction of tomato yield on the basis of solar radiation before anthesis under warm greenhouse conditions. HortScience 2009, 44, 1874–1878. [Google Scholar] [CrossRef] [Green Version]
- Wan, P.; Toudeshki, A.; Tan, H.; Ehsani, R. A methodology for fresh tomato maturity detection using computer vision. Comput. Electron. Agric. 2018, 146, 43–50. [Google Scholar] [CrossRef]
- Doi, S.; Masuda, T.; Sakagawa, R.; Higashida, M. A Study on Prediction of Harvest Time using Multi-Spectral Imaging and Machine Learning. In Proceedings of the Multimedia, Distributed, Cooperative, and Mobile Symposium (DICOMO 2017), Hokkaido, Japan, 28–30 June 2017; pp. 207–212. [Google Scholar]
- Salazar, R.; López, I.; Rojano, A.; Schmidt, U.; Dannehl, D. Tomato yield prediction in a semi-closed greenhouse. In XXIX International Horticultural Congress on Horticulture: Sustaining Lives, Livelihoods and Landscapes (IHC2014); ISHS: Queensland, Australia, 2014; Volume 1107. [Google Scholar] [CrossRef]
- Movagharnejad, K.; Nikzad, M. Modeling of tomato drying using artificial neural network. Comput. Electron. Agric. 2007, 59, 78–85. [Google Scholar] [CrossRef]
- He, K.; Gkioxari, G.; Dollár, P.; Girshick, R. Mask R-CNN. In Proceedings of the IEEE International Conference on Computer Vision, Venice, Italy, 22–29 October 2017. [Google Scholar] [CrossRef]
- Laboro Tomato. Available online: https://github.com/laboroai/LaboroTomato (accessed on 10 July 2021).
- Maezawa, S.; Yamada, H.; Akimoto, K. Relationship between harvest ripeness and ripening temperature and coloration abnormalities during ripening of tomato Momotaro. J. Jpn. Soc. Hortic. Sci. 1993, 62, 647–653. (In Japanese) [Google Scholar] [CrossRef]
- Operation Manual for Large-Scale Horticultural Production—An Example of Low-Tiered Dense Planting of Tomatoes. Saitama Prefectural Agricultural Technology Research Center, March 2020. Available online: https://www.naro.go.jp/PUBLICITY_REPORT/publication/files/Large-scale_facility_gardening_manual_Saitama.pdf (accessed on 31 August 2021). (In Japanese).
- GoProHERO8 Black. Available online: https://gopro.com/en/us/shop/cameras/hero8-black/CHDHX-801-master.html. (accessed on 10 March 2022).
- Depth Camera D435i, Intel® RealSense™ Technology. Available online: https://www.intelrealsense.com/depth-camera-d435i/ (accessed on 10 March 2022).
| Publisher’s Note: MDPI stays neutral with regard to jurisdictional claims in published maps and institutional affiliations. |
© 2022 by the authors. Licensee MDPI, Basel, Switzerland. This article is an open access article distributed under the terms and conditions of the Creative Commons Attribution (CC BY) license (https://creativecommons.org/licenses/by/4.0/).


