1. Introduction
The classification of mango fruit according to ripeness stage is important for successful marketing because variability in ripeness affects eating quality as well as postharvest shelf life and selling strategies [
1,
2,
3]. Ripe mangoes have a pleasant flavor and aroma. However, they allow the development of numerous diseases [
4]. Overripe mango fruit has lower or even no retail value, resulting in severe profit loss and resource waste. During ripening, the mango fruit undergoes several changes, including the conversion of starch to sugars, an increase in pH, the degradation of the cell wall, the biosynthesis of carotenoids, and the formation of fragrances [
5,
6,
7]. In theory, any of these changes can be used as an indicator of fruit ripening. However, climate, horticultural practices, and cultivars all influence the indicator for fruit ripeness, resulting in variations in the indicator [
8,
9]. Some mango cultivars, such as the “Nam Dok Mai Si Tong” cultivar, lack an obvious indicator, making classification difficult.
The mango cultivar “Nam Dok Mai Si Tong” is grown widely in Thailand and is popular for consumption and is exported to Japan, Korea, Vietnam, China, and Malaysia. This cultivar has a golden yellow skin, like that of a ripe mango, even when it is still on the plant, and the flesh is fragrant, sweet, aromatic, and juicy with no fibrous tissue when ripe [
10]. Most “Nam Dok Mai Si Tong” mango farms manually classify the ripeness stage using external indicators such as size, shape, and skin color as assessed by trained, experienced individuals. This may lead to inaccuracies or inconsistencies [
11,
12]. Studies have shown that the external indicators of mango fruit are often unreliable [
13,
14]. Although fruit internal indicators, such as total soluble solids (TSS) and titratable acidity (TA), are more accurate classifications than measurements of the external characteristics, measurements of these parameters are time-consuming and require the destruction of the fruit sample [
15].
In recent decades, several technologies used for nondestructive assessment of the internal quality features of fruit have been developed and evaluated. These technologies include NIR spectroscopy, magnetic resonance imaging (MRI), hyperspectral imaging (HSI), and acoustic sensors [
12,
14,
16,
17,
18]. However, there are some limitations to these technologies. MRI technologies are integrated with expensive equipment. HSI requires high-performance computing systems because of the vast amount of data used for image processing tasks. With acoustic techniques, it is hard to match the impedance between the sensors and the fruit sample. Compared to other technologies, handheld and portable NIR spectrometers are the most advanced in many aspects, such as miniaturization, software enhancement, and expanding the operating wavelengths into the visible range. A commercial Vis/NIR spectrometer with wavelengths ranging from 310 nm to 1100 nm was recently used to assess the soluble solid concentration, dry matter, and flesh firmness in stone fruits at harvest [
19]. In general, NIR spectral data are analyzed and correlated with fruit traits using multiple linear regression (MLR) and partial least squares regression (PLS). To predict the mango maturity index, the PLS model obtained from portable NIR spectroscopy at wavelengths ranging from 1200 to 2200 nm was found superior to the MLR model [
20]. Updates to NIR spectrometers and the machine learning models used for maturity prediction of various fruits have recently been reviewed [
17].
Recently, there has been an interest in utilizing machine learning (ML) methods to construct models for predicting mango ripeness [
21,
22,
23]. The ML techniques are classified into two types: unsupervised and supervised. Unsupervised ML is typically used for data visualization and clustering within the input data, whereas supervised ML is typically used for predicting a known output from a set of inputs. The k-means algorithm is an unsupervised learning approach for clustering and visualizing nonlinear relationships of data without requiring explicit knowledge of the underlying correlations between the variables [
24]. Various supervised ML classifiers often used for autonomous decision making include support vector machines (SVM) [
25,
26], random forests (RF) [
27], k-nearest neighbors (KNN) [
28], and artificial neural networks [
28], each of which has varied levels of model complexity.
The accuracy of supervised ML classifiers is affected by unbalanced amounts of labeled data for learning, because a lack of data for minority classes may produce biased learning classification in ML classifiers. The class imbalance is typical of many real-world data classifications [
29,
30,
31]. Several methods have been developed to overcome these negative effects, including the synthetic minority oversampling technique (SMOTE) [
32]. The SMOTE approach creates artificial minority samples by interpolating between existing minority samples and their closest minority neighbors. To improve the SMOTE method, the technique employs the Tomek links [
33] method to remove noisy data.
The changes in skin color of ripe mangoes were used as the input to SVM, KNN, Gaussian naïve Bayes (GNB), and back-propagation neural network classifiers to classify mangoes according to their ripening stages with a mean accuracy of greater than 80% [
34,
35,
36,
37,
38]. The changes in skin color of the cultivar used in their experiments were easily noticed by human eyes.
This study presents an approach to assess the ripeness stage of “Nam Dok Mai Si Tong” mango with unsupervised and supervised ML techniques. The skin color of this cultivar is yellow in all ripeness stages (unripe, ripe, and overripe stages). The objective of this study was to develop models for predicting the ripeness stage of mangoes at harvest based on chemical as well as physical (weight, skin color) and electrical (capacitance, voltage) qualities. We used well-known machine learning classifiers to predict the maturity and ripeness of fruits.
2. Materials and Methods
2.1. Mango Samples
Mangoes of the variety “Nam Dok Mai Si Tong”, at a commercial orchard in Nakorn Ratchasima province, Thailand, were tagged in November 2018, when they were approximately 5 mm in diameter. The commercial maturation stage for “Nam Dok Mai Si Tong” for export has been determined to be 85–95 days after fruit set (DAFS) [
10]. From January to February 2019, the mangoes were harvested four times, at 80, 90, 100, and 110 DAFS. Mango samples were brought to a laboratory at Kasetsart University in Bangkok on the same day they were harvested. At each harvesting, we divided mango samples into two groups: one that contained twenty-five samples for evaluation of biochemical, physical, and electrical properties; and one that contained five samples for measurement of only physical and electrical qualities. The mango samples in both groups were measured on days 1, 3, 5, 7, and 9 after harvest. The biochemical examination of mango samples in one group was not carried out so that the same mangoes were tested for 9 days. A total of 120 mango fruits were used in this research.
2.2. Measurement of Properties of Mango
2.2.1. Physical Properties
The mangoes were weighed individually with an electronic balance (DH-2000, Dongguan, Guangdong, China) accurate to 0.01 g.
The CIELab color space has been proven to be better related to maturity in several fruit crops than other color spaces [
39,
40]. The a* value corresponds to the degree of red or green color; the –a* value is green, and the a* value is red. Specifically, a* and hue angle are two good indicators of fruit maturity in peach [
41], nectarine [
42], and most fruits that turn from green to red. CIELab color parameters can be derived from RGB by image processing. The skin colors at the top (near stem), center, and bottom of each fruit on both sides of the mangoes were measured in RGB color space using ColorMax sensors (EMX Industries, CM1000-7-25, Johnston Parkway Cleveland, OH, USA), and the average of RGB color values was calculated.
2.2.2. Biochemical Properties
For biochemical measurements, we selected 5 of 25 mango fruits on day 1 and 5 of 20 mango fruits on day 3 (from those that were left from the previous two days). The process was repeated, and all mangoes were completely measured on day 9.Total soluble solids (TSS) and titratable acidity (TA) were determined from the extracted mango juice using a digital refractometer (ATAGO, PAL-1, Shiba-koen, Minato-ku, Japan) and a pHmeter (HANNA, HI98127, Woonsocket, RI, USA). The extracted mango juice was manually titrated to pH 8.1 with 0.1 mol/L NaOH for TA.
2.2.3. Electrical Properties
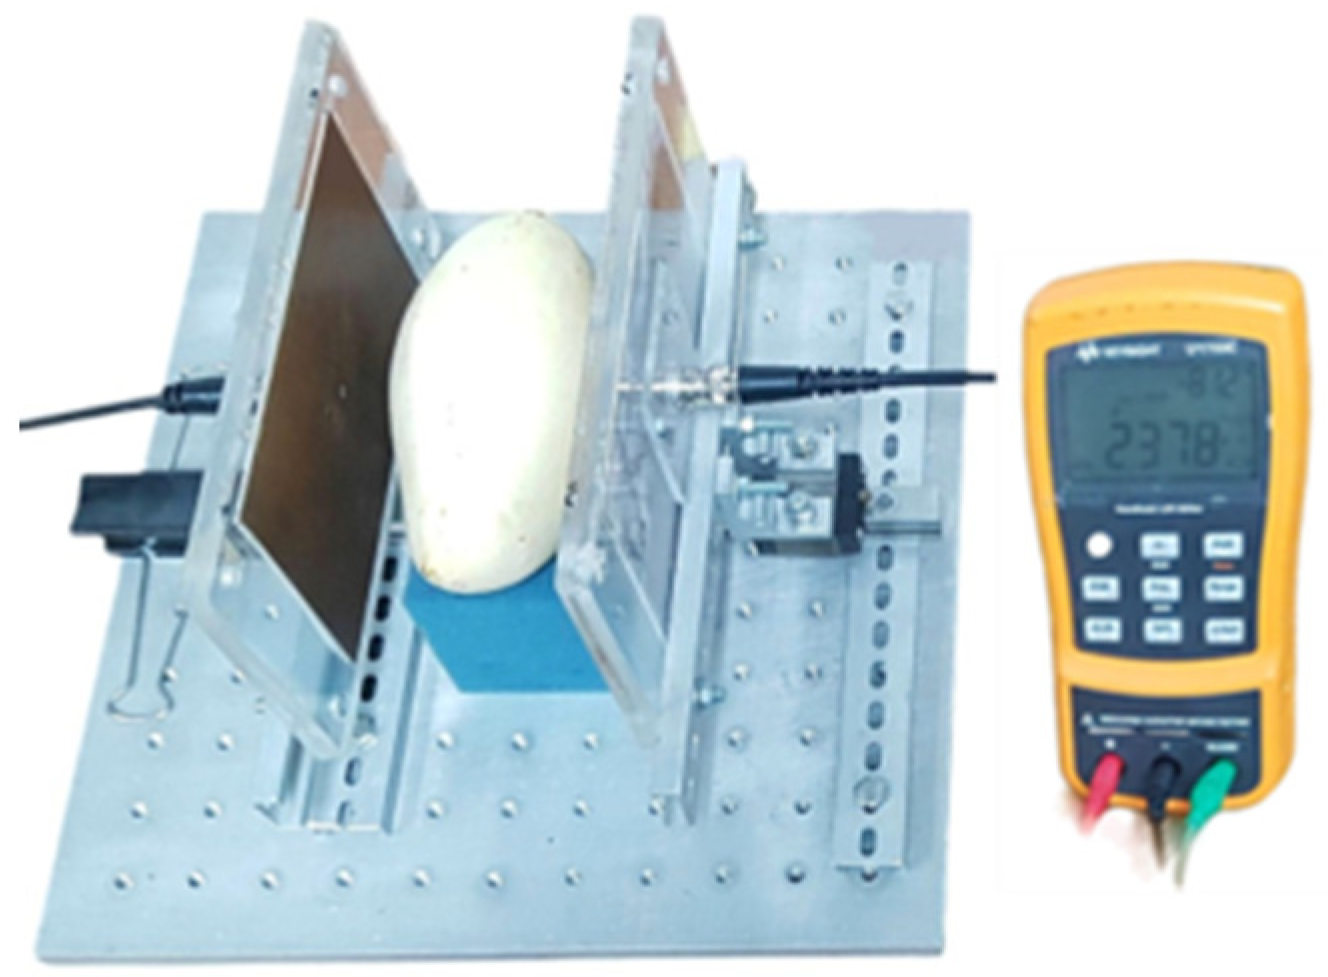
The capacitance of each mango and the voltage across the plates of the parallel-plate capacitor sensor were measured using methods as described in previous works [
43,
44,
45] with a handheld LCR Meter (Keysight, U1733C, Santa Rosa, CA, USA) set to a frequency of 100 kHz (
Figure 1). The parallel-plate capacitor sensor was constructed to measure the capacitance of mangoes. It had two rectangular copper plates, each approximately 0.15 m long, 0.1 m wide, and 0.005 m thick, mounted on the linear guide rails to adjust the spacing between the plates.
2.3. Data
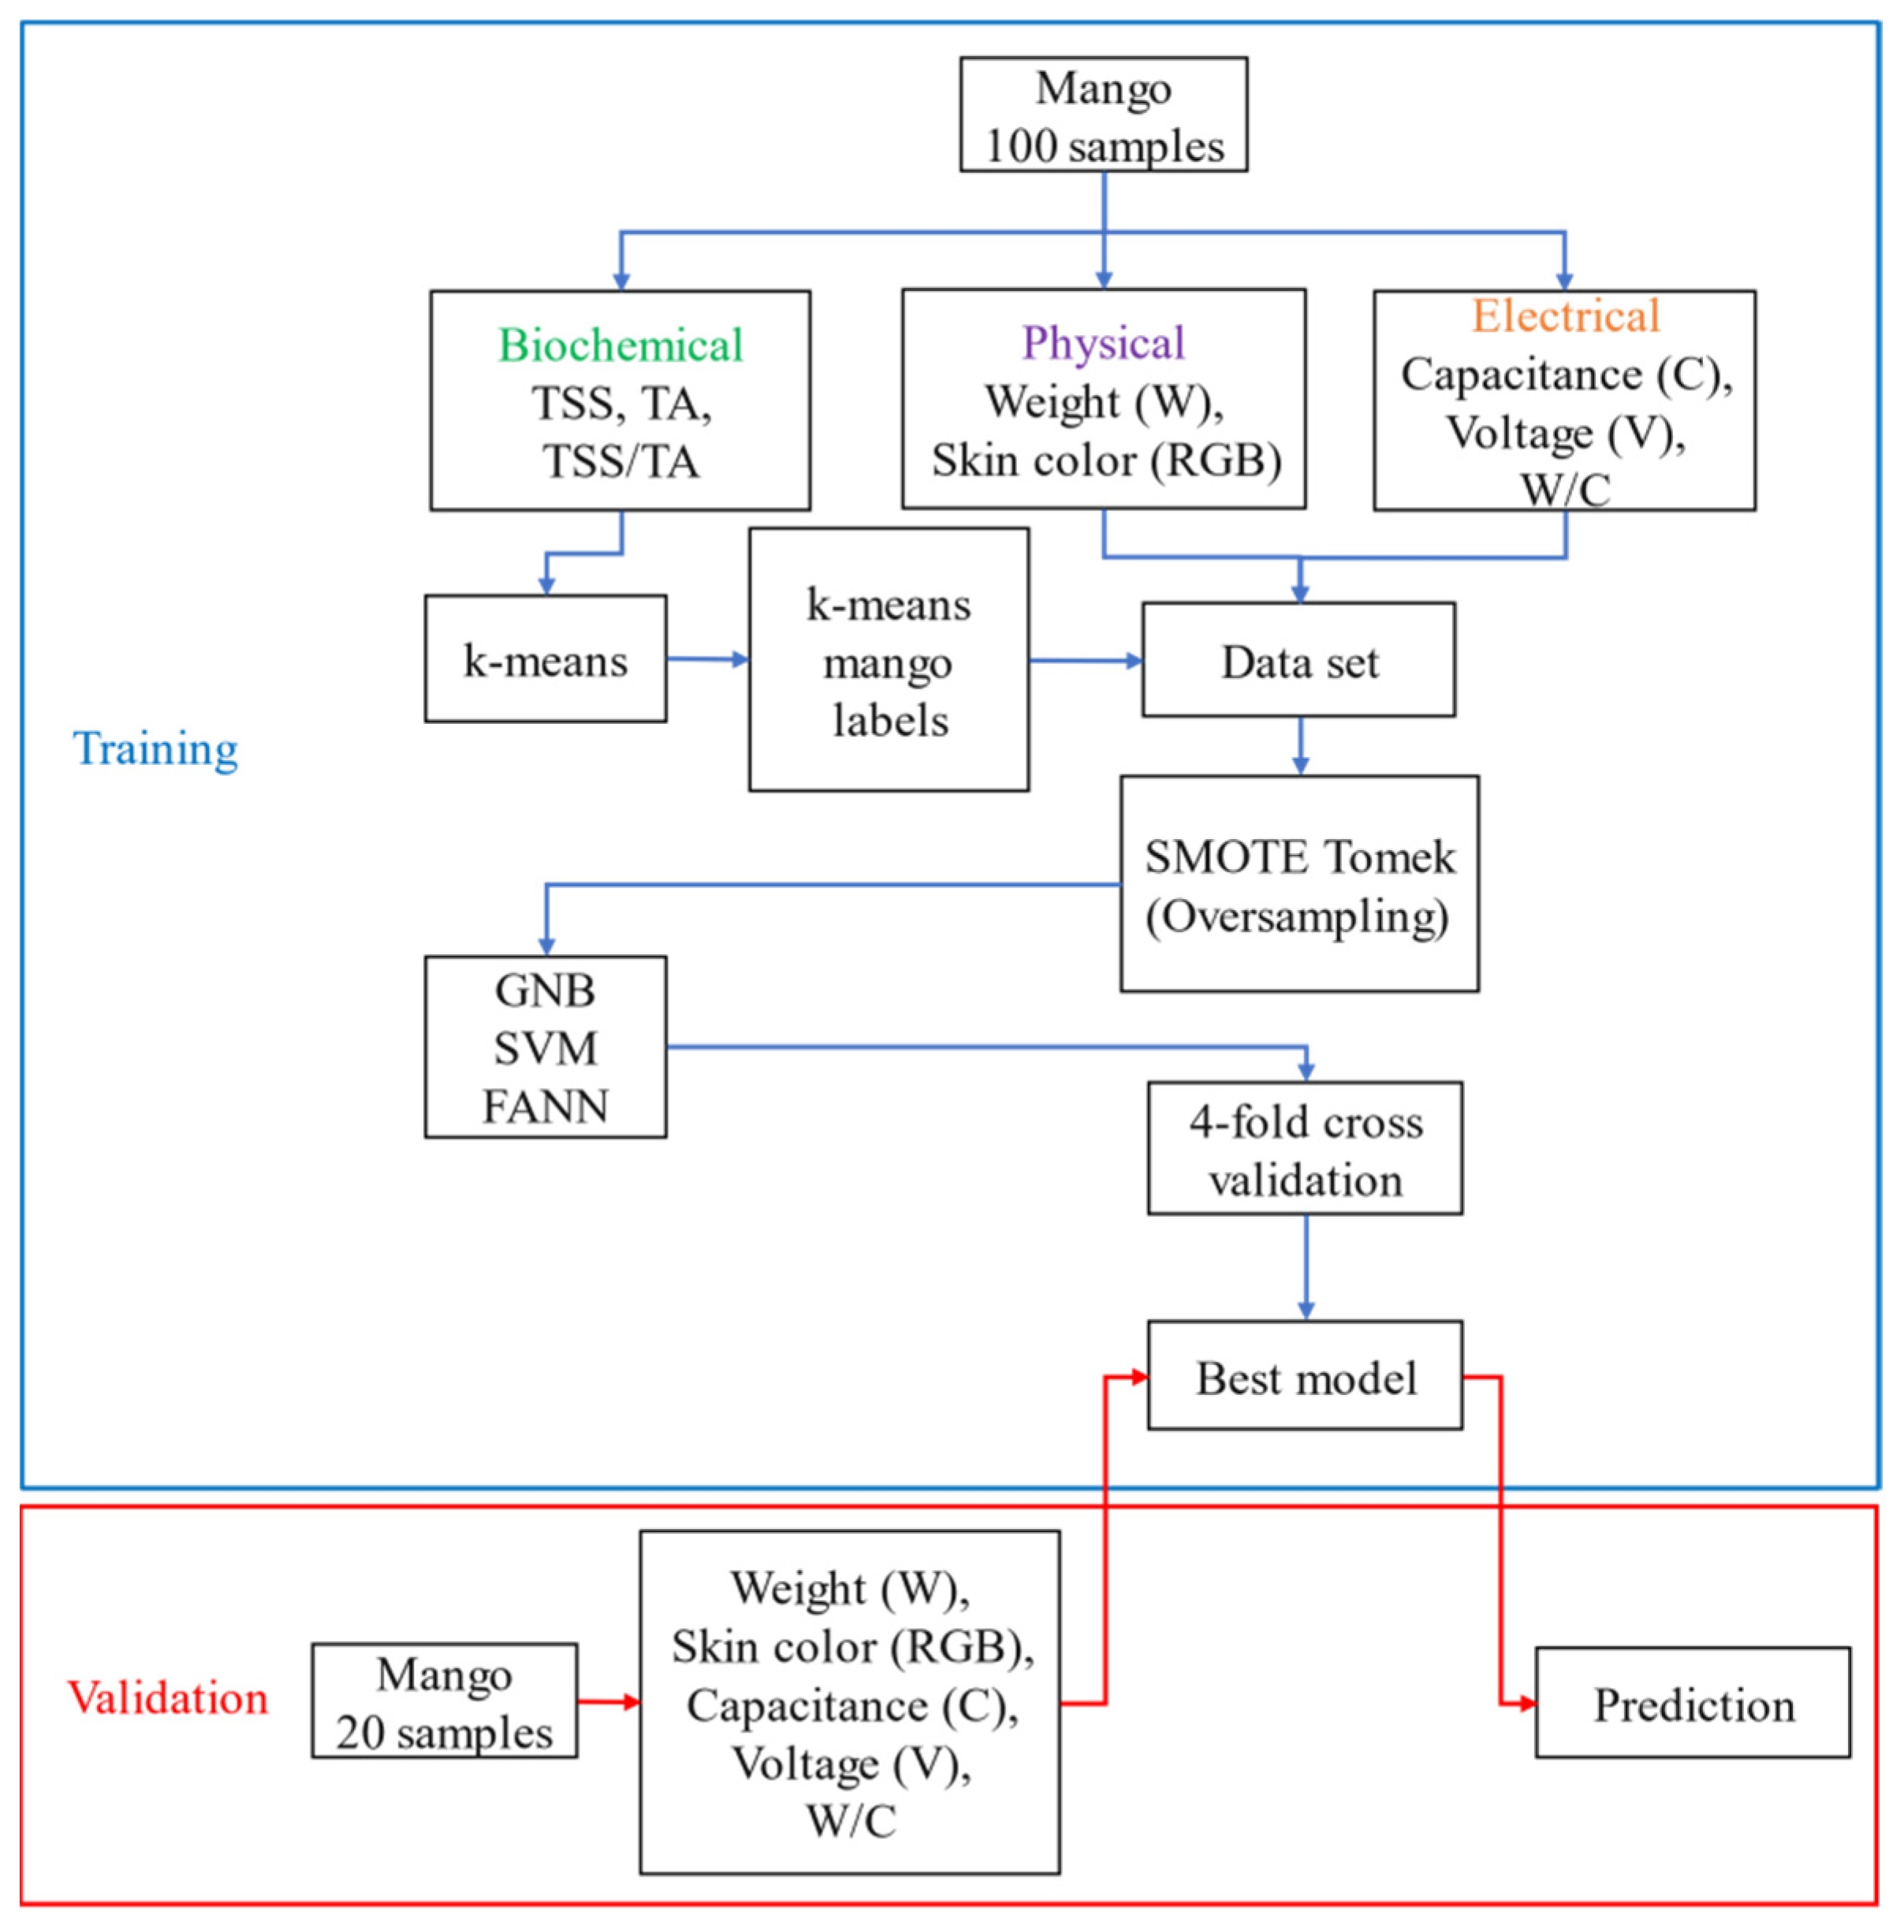
The data measured from mango attributes included 10 variables: weight, red color, green color, blue color, TSS, TA, TSS–TA ratio, capacitance, voltage, and the ratio of capacitance and weight. The biochemical data were used for the k-means method. Since the results of the k-means method revealed class imbalances, the SMOTETomek was applied to generate synthetic data for balancing and cleaning the data of classes. The balanced classes of ripeness stages and physical and electrical data were utilized to train the GNB, SVM, and FANN classifiers; the balanced classes of ripeness stages were employed as the target variables. The data from 100 mango fruits were input to the GNB, SVM, and FANN algorithms for training and for fourfold cross validation. After comparing the performance of GNB, SVM, and FANN algorithms, the best performing ML model was selected and further tested with the data from 20 mangoes.
2.4. Machine Learning Methods
2.4.1. k-Means
k-means is an unsupervised learning algorithm for clustering data objects based on their similarity. The k-means algorithm starts by choosing a number of clusters. Each cluster is identified with its centroid, which is the average of all data points in the cluster. Each data object is then assigned to its nearest centroid while minimizing the distance between objects. The centroid of each cluster is then recomputed. The distance between clusters is calculated, aiming at a minimum total sum of square errors. This procedure is repeated until no data points change the centroids.
2.4.2. Gaussian Naïve Bayes (GNB)
GNB is a probabilistic classifier that employs Bayes’ theorem for computing the conditional probability of the class that the attribute values belong to. The GNB classifier assumes independence, and the Gaussian distribution of attributes. The GNB algorithm starts by calculating the prior probability for given class labels. The likelihood probability for each attribute is then computed for each class. The posterior probability is calculated by inserting the prior and likelihood probability values into the Bayes formula. Finally, the input attribute is determined to the class with the greater probability. To avoid zero probability, we used Laplace’s rule with a smoothing parameter of 0.01.
2.4.3. Support Vector Machine (SVM)
SVM is a binary classifier that finds linear hyperplanes that maximize class separation [
46]. SVM simulates decision boundaries between classes by mapping the data to a higher-dimensional space to find a separable hyperplane between classes. Because SVM is a binary classifier, several classifiers must be built and aggregated to be used for multiclass classifications. We employed the LIBSVM library [
47] in Python. The polynomial kernel was used with the hyperparameters given in
Table 1.
2.4.4. Feed-Forward Artificial Neural Network (FANN)
The final classification technique studied in this paper was the feed-forward artificial neural network (FANN). We implemented the FANN algorithms in Python script using the Keras package [
48]. The architecture of our FANN model was one input layer, two hidden layers, and one output layer (
Figure 2). The input layer had 7 variables, which were the same as those used in the GNB and SVM analysis. The first and the second hidden layers had 64 and 128 neurons, respectively. In the activation layers, the rectified linear unit (ReLU) activation function was utilized. The output layer had either two or three outputs, according to stages obtained from the k-means technique. The FANN model was trained using a back-propagation algorithm with the hyperparameters given in
Table 2.
2.5. Summary of Overall Procedure
According to published literature, taste and skin color are key parameters that influence consumer acceptability and preference [
49]. The total soluble solids (TSS) and titratable acidity (TA) of “Nam Dok Mai Si Tong” mangoes are strongly correlated with the ripeness stage at harvest of mangoes [
10,
50]. This mango has an inherent skin color that attracts consumers. As a result, we decided to classify mangoes into groups using biochemical properties (namely, TSS and TA) and to employ machine learning techniques to transform the correlation between the physical and electrical properties and the biochemical properties into a predictive model. The procedures for predicting the ripeness stage of mangoes are shown in
Figure 3. The process began by separating mangoes into two groups: one for measuring physical, electrical, and biochemical properties of mangoes and one for measuring only physical and electrical properties. The k-means unsupervised learning algorithm was chosen to visualize the data distributions of the biochemical data of mangoes (TSS and TA) and to find outliers.The biochemical data were fed into the k-means algorithm, which was used to label stages for each mango. Fortunately, the k-means algorithm reported no outliers in our biochemical data. However, it disclosed a class imbalance in the number of mango samples, which is common in practice data classifications. Thus, the SMOTETomek technique was used for data oversampling. Three supervised ML techniques, namely GNB, SVM, and FANN, have already been used in literature for classification of the ripeness stage in several fruit crops. We wanted to find the most suitable ML algorithm for predicting the ripeness stage of mangoes. For this reason, we compared the performances of the GNB, SVM, and FANN classifiers using fourfold cross validation on both the unbalanced and balanced datasets of classes by considering the percent of corrected predictions. The results showed that the FANN classifier outperformed the others. We employed datasets of biochemical, physical, and electrical variables (100 data) from 100 mangoes to test the GNB, SVM, and FANN, while datasets of physical and electrical variables (100 data) from 20 mangoes were used as external datasets to validate the FANN model. The ML algorithms were implemented in Python using the scikit-learn and Keras packages.
2.6. The Optimal Number of Clusters
The elbow and silhouette methods were employed to evaluate the optimal number of clusters of ripeness stage of mango fruits [
51].
2.6.1. Elbow Method
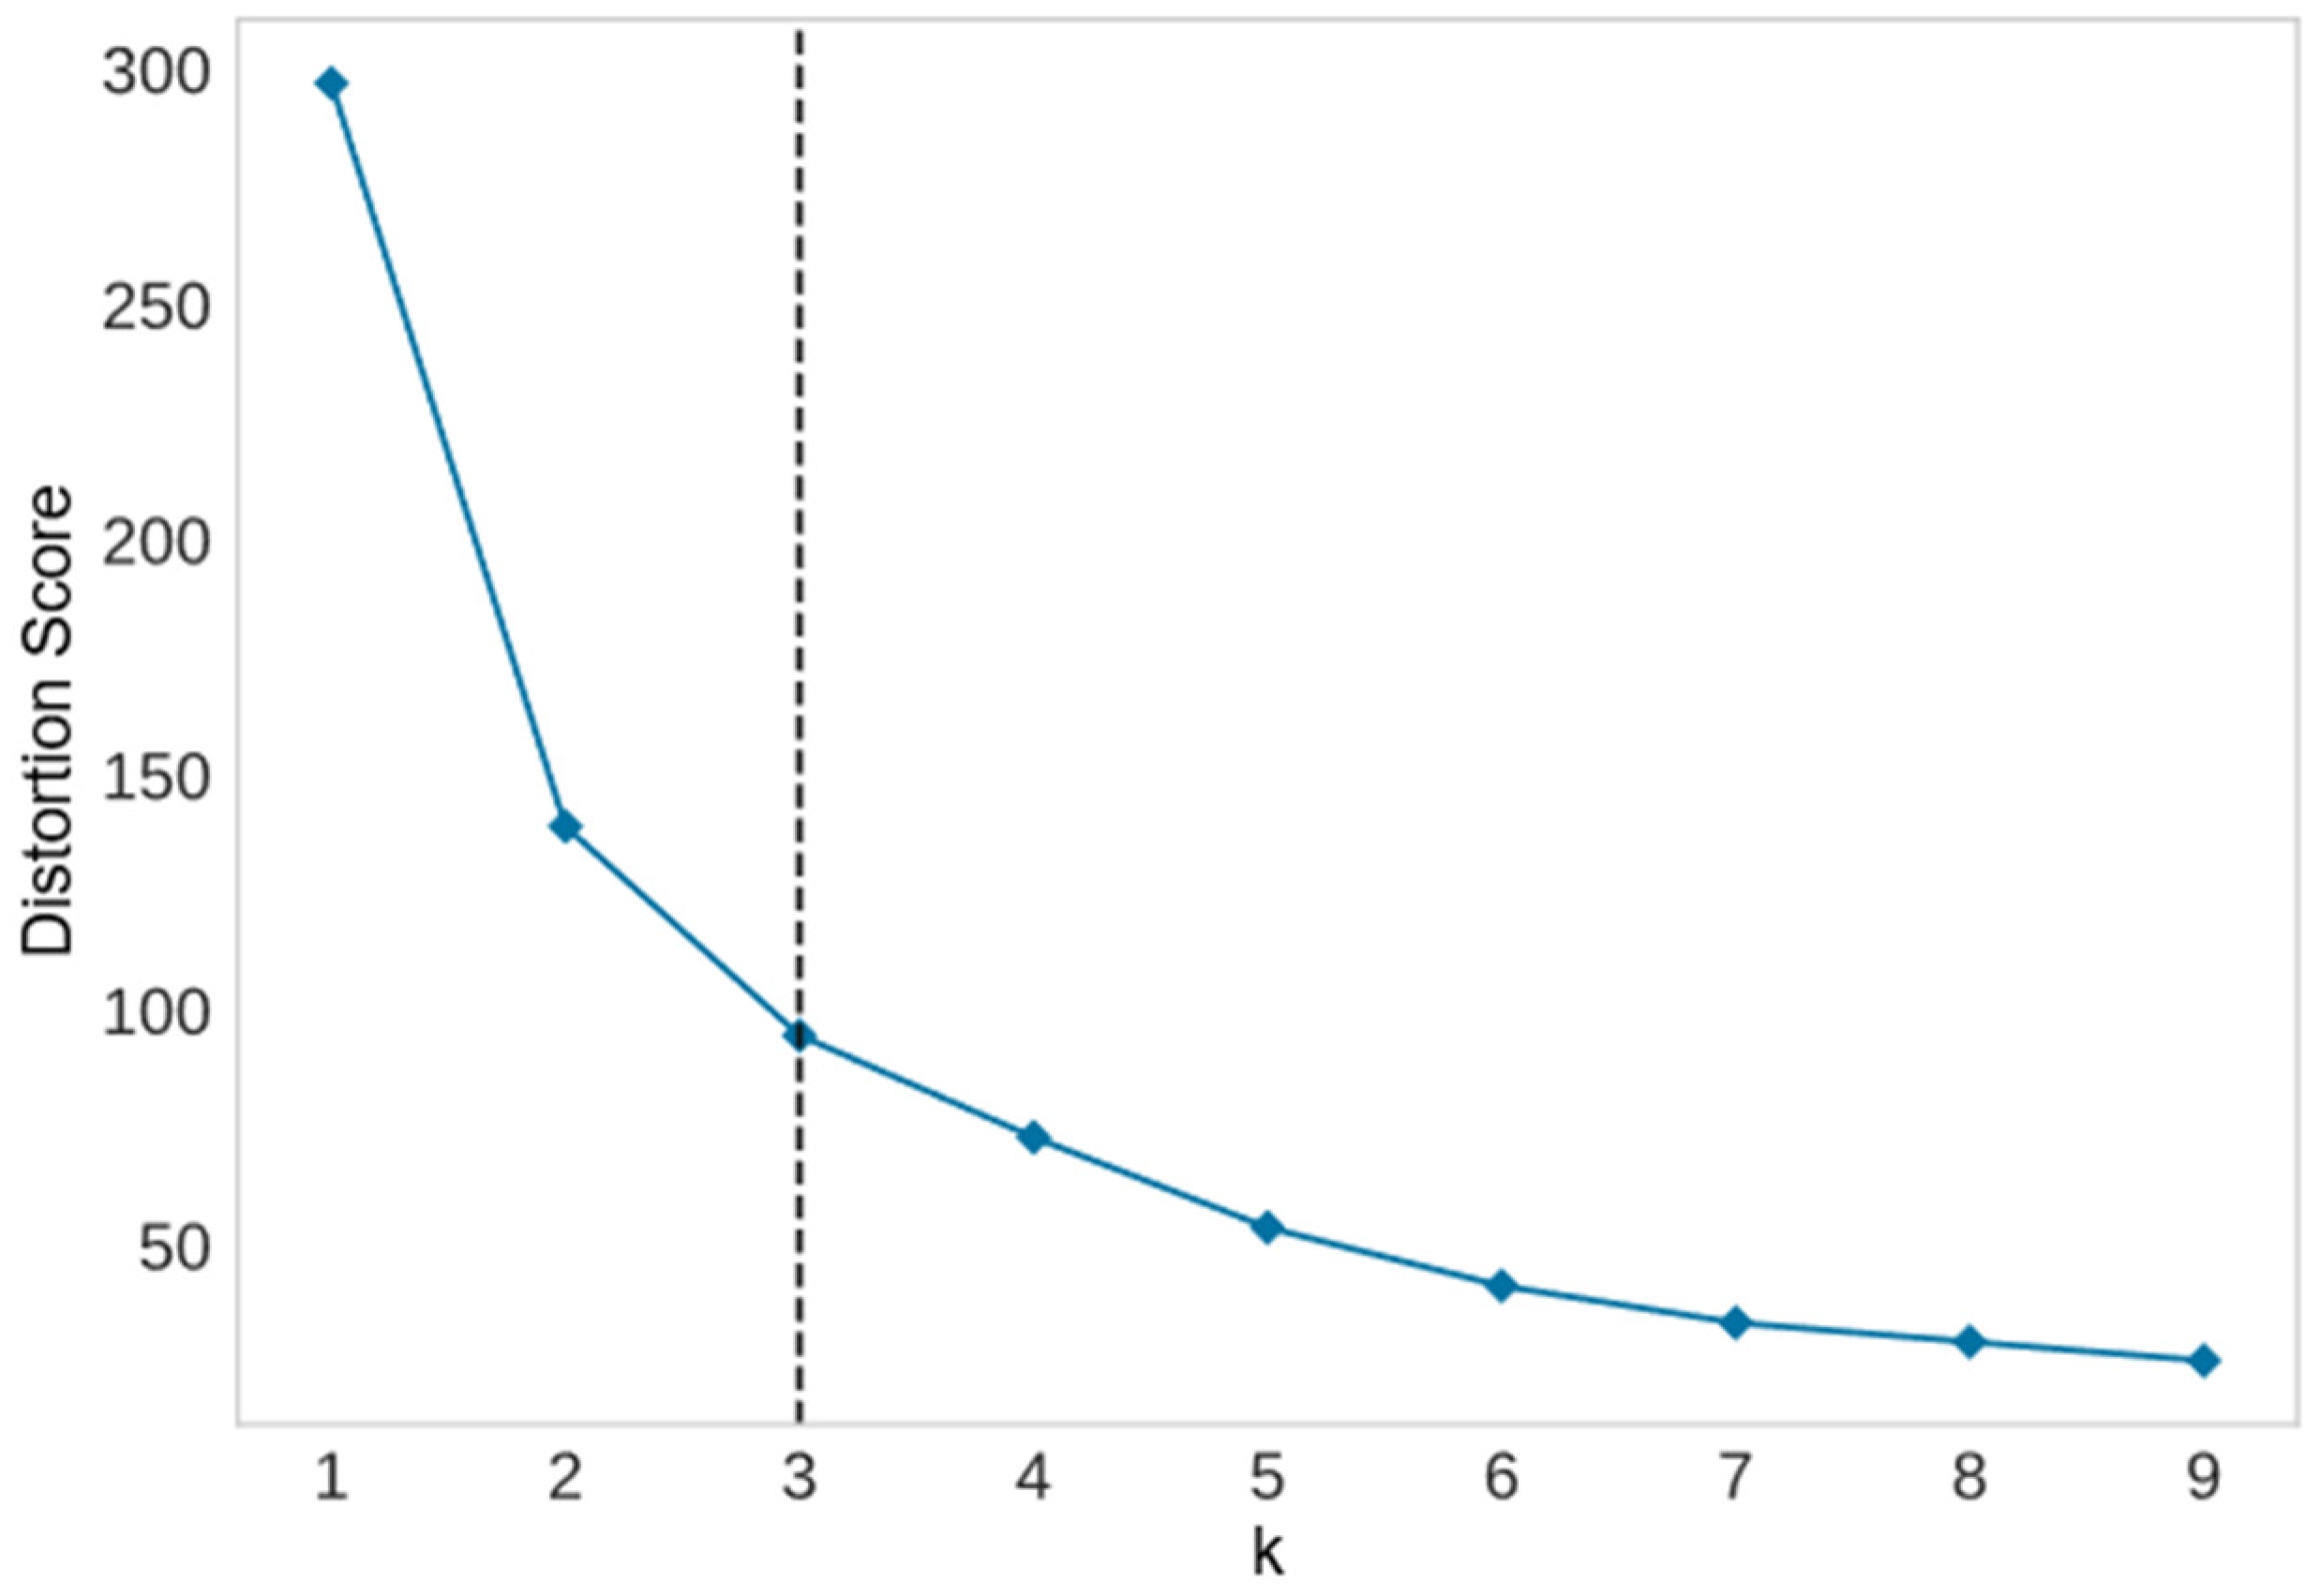
The elbow method calculates the total of squared errors of data points in a cluster and the centroids of clusters, which is known as the distortion score. The number of squared errors decreases, indicating an improvement in clustering quality. When the total of squared errors is plotted against the number of clusters, the optimal number of clusters is revealed as a significant change in slope, which is known as an elbow.
2.6.2. Silhouette Method
The silhouette method determines the proper number of clusters in a dataset by measuring cluster separation distance. The silhouette coefficient (SC) lies between −1 and 1, with negative and positive values indicating that the samples are in the wrong and correct cluster, respectively. Higher SC values indicate better quality of clustering.
2.7. Evaluation of Classifier Performance
The performance of ML classifiers was evaluated using k-fold cross validation. The process starts by choosing a number, k, and partitioning the data into k subsets: k-folds. Next, the data of one of k − 1 folds israndomly chosen for training, while that of another is used to test the classifier. The error rate of the test is then computed. This process was repeated with a different randomly selected training and testing dataset. In this study, the process was repeated 4 times, and an average error rate was computed for these 4 runs, i.e., fourfold cross validation was performed. The accuracy of the ML classifier was computed as the ratio between the sum of the true results and the sum of the true and false results, while the precision was calculated as the ratio of true outcomes to the sum of true and false outcomes.
3. Results
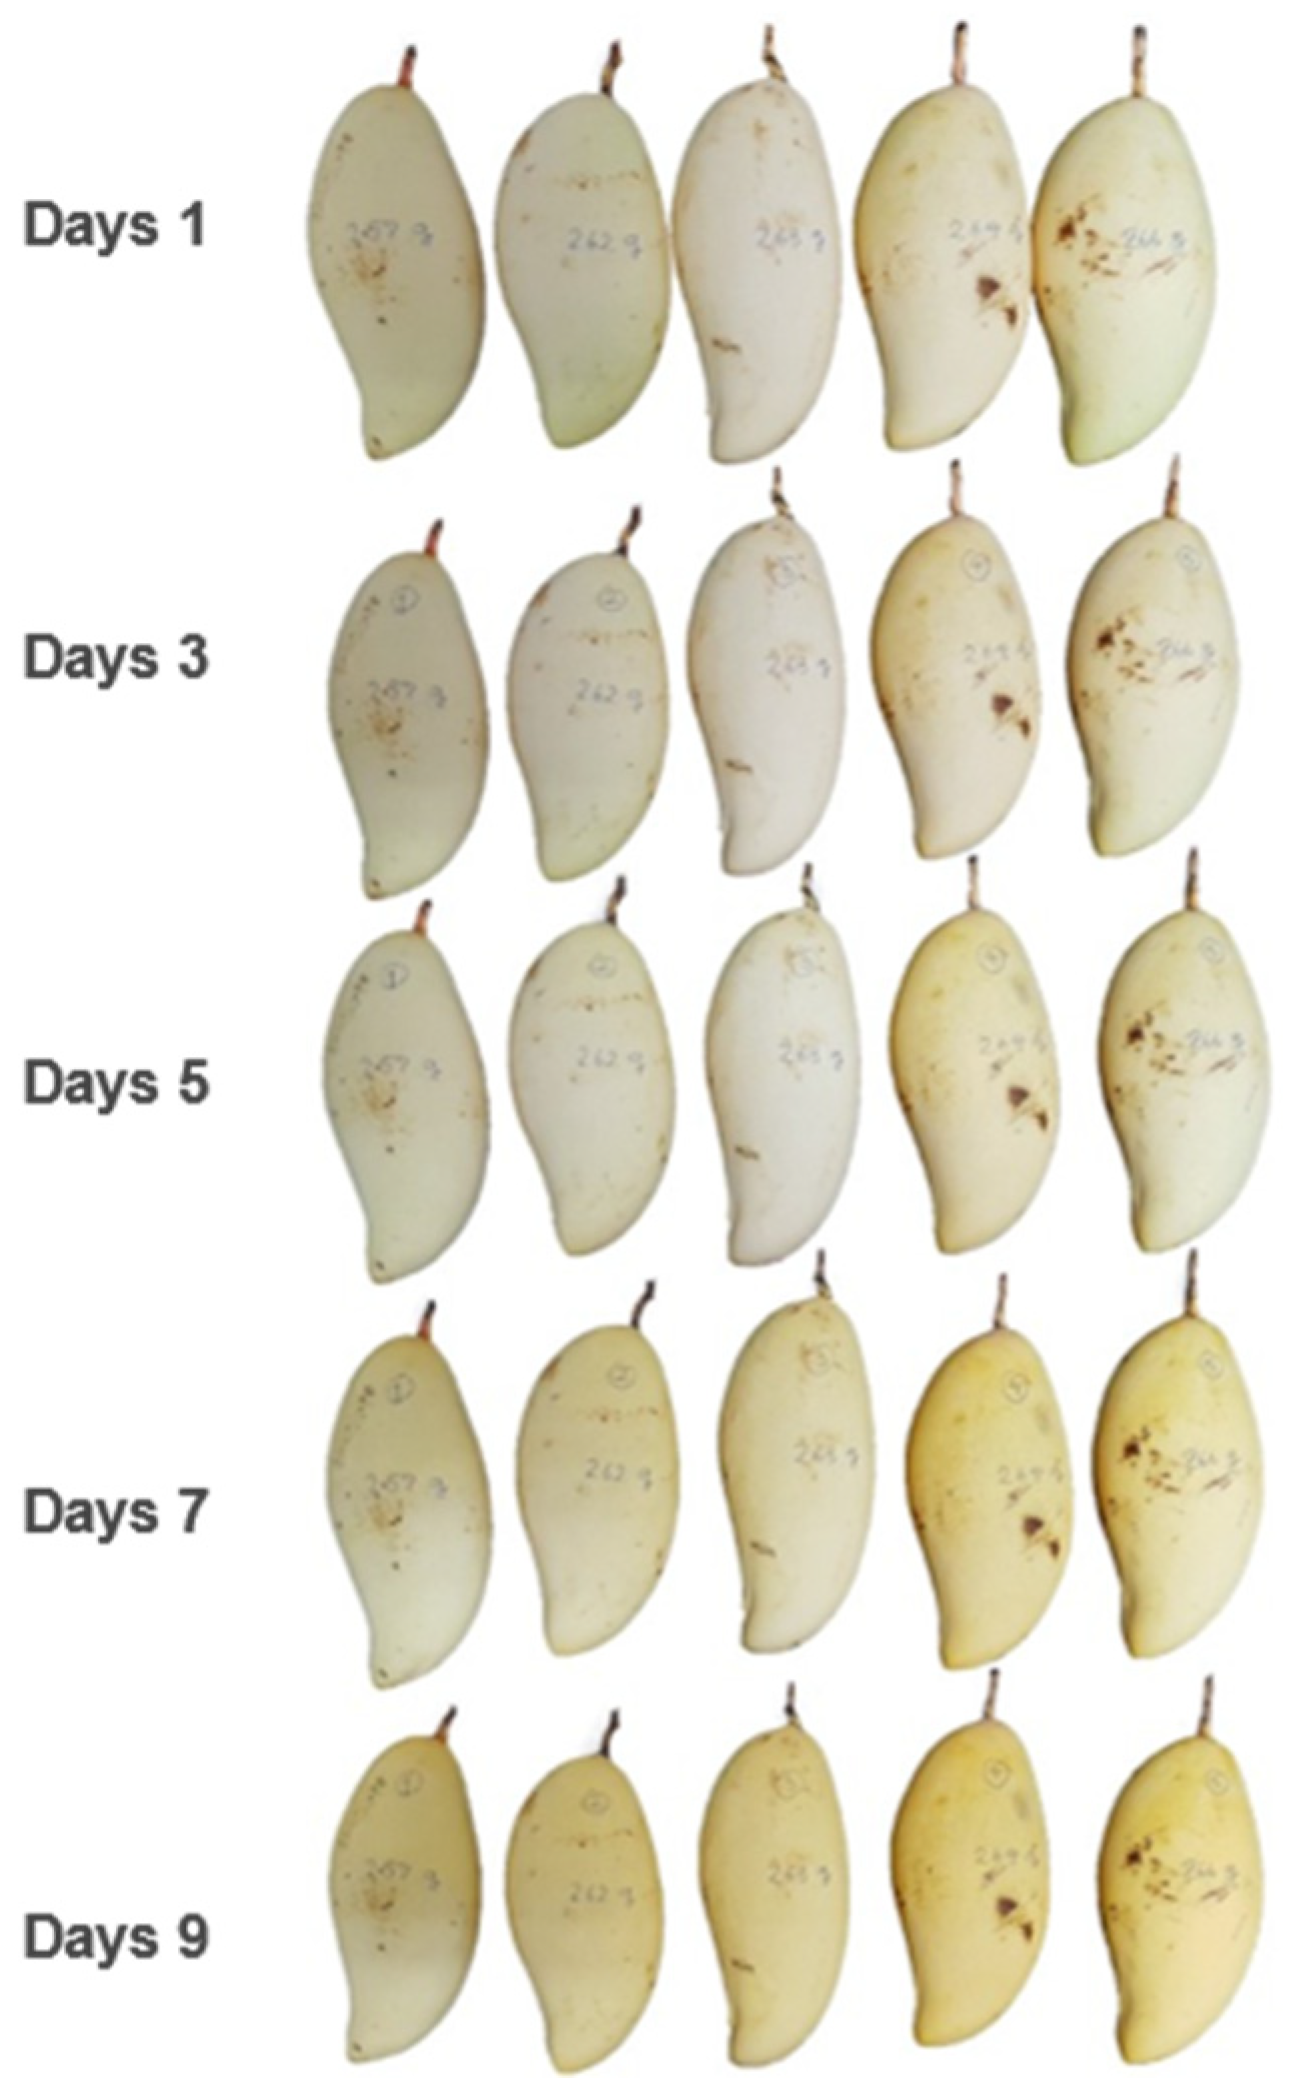
The images of the example mangoes at 80 days old are shown in
Figure 4. Notice that the skin color of these mangoes was similar from day 1 to day 9 after harvest. Therefore, the color attributes used in this study (RGB) were not good indicators for classifying ripeness. We used the pandas library in Python to calculate the data collected as described in the
Section 2.
Table 3 shows the average and standard deviation for the original data of the titratable acidity (TA), total soluble solids (TSS), TSS/TA ratio, weight, voltage, capacitance, weight/capacitance ratio, and red (R), green (G), and blue (B) skin colors of 100 mango samples.
3.1. k-Means Clustering Results
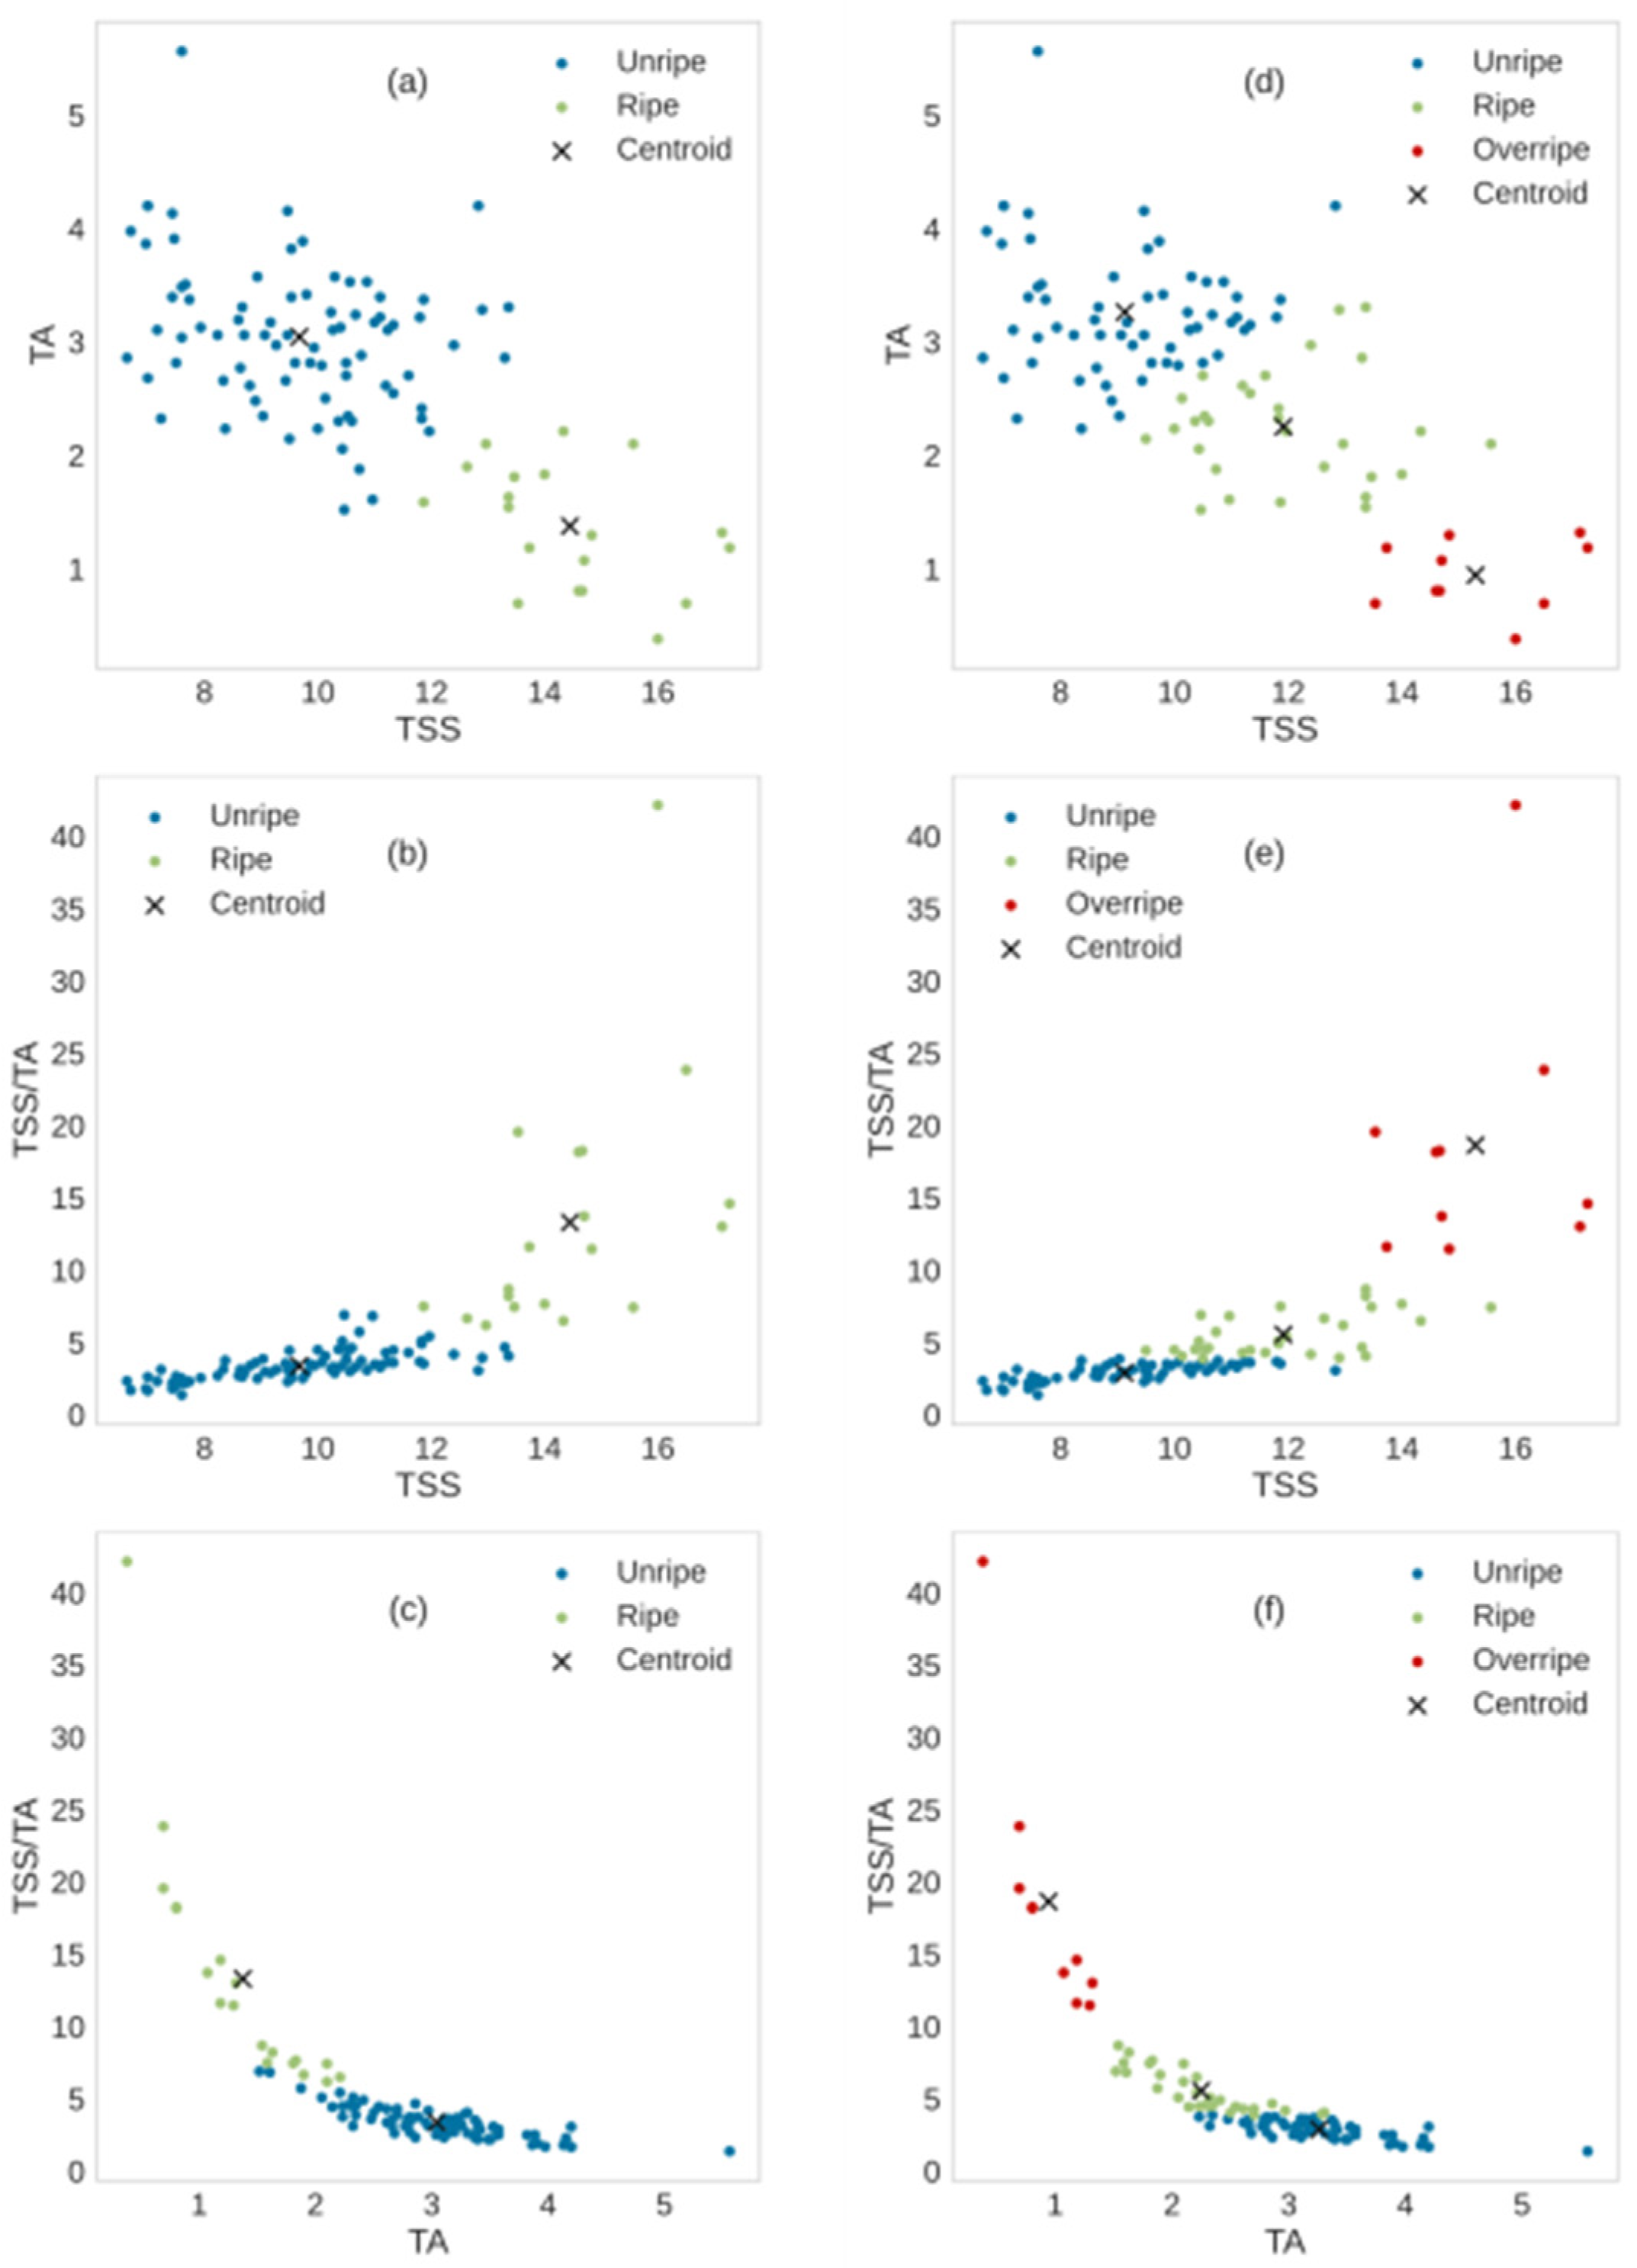
Figure 5 shows scatter plots of biochemical data of 100 mangoes using the k-means clustering with k = 2 clusters (
Figure 5a–c) and k = 3 clusters (
Figure 5d–f). The results from the k-means algorithm showed clear boundaries between clusters, which suggested that the k-means method using TSS, TA, and TSS/TA was adequate to separate the ripening stages of mangoes. For two-ripenessclass clustering, the distribution of data in the unripe cluster was denser than that in the ripe cluster. The numbers of mangoes in the unripe and ripe stages were 81 and 19, respectively (
Table 4). For three-ripeness class clustering, the distribution of data in the unripe cluster was denser than those in the ripe and overripe clusters. The numbers of mangoes in the unripe, ripe, and overripe stages were 60, 30, and 10, respectively (
Table 4). There was some overlap between mango samples within their own clusters. This indicated the similarity of the TSS and TA of mangoes. A negative relation between TSS and TA during the ripening of mangoes was shown, which is consistent with previous studies [
50,
52]. Mangoes in the overripe cluster showed the highest TSS, indicating more ripeness, and were sweeter than mangoes in the unripe and ripe stages.
3.2. The Optimal Number of Clusters
3.2.1. Elbow Method
Figure 6 shows the elbow results versus the number of clusters for the same biochemical data. The elbow method indicated that the optimal number of clusters was three.
3.2.2. Silhouette Method
Figure 7 depicts a plot of the SC value versus the number of clusters for biochemical data of 100 mangoes. The silhouette method showed that the optimal number of clusters was two.
Unfortunately, the results from the silhouette and elbow methods were inconsistent. Even though two clusters was previously thought to match the natural number of ripeness stages, we investigated the performance of three supervised machinelearning classifiers in predicting mango ripeness stages for two and three classes.
3.3. Results of Oversampling Data
Results from the k-means clustering described in
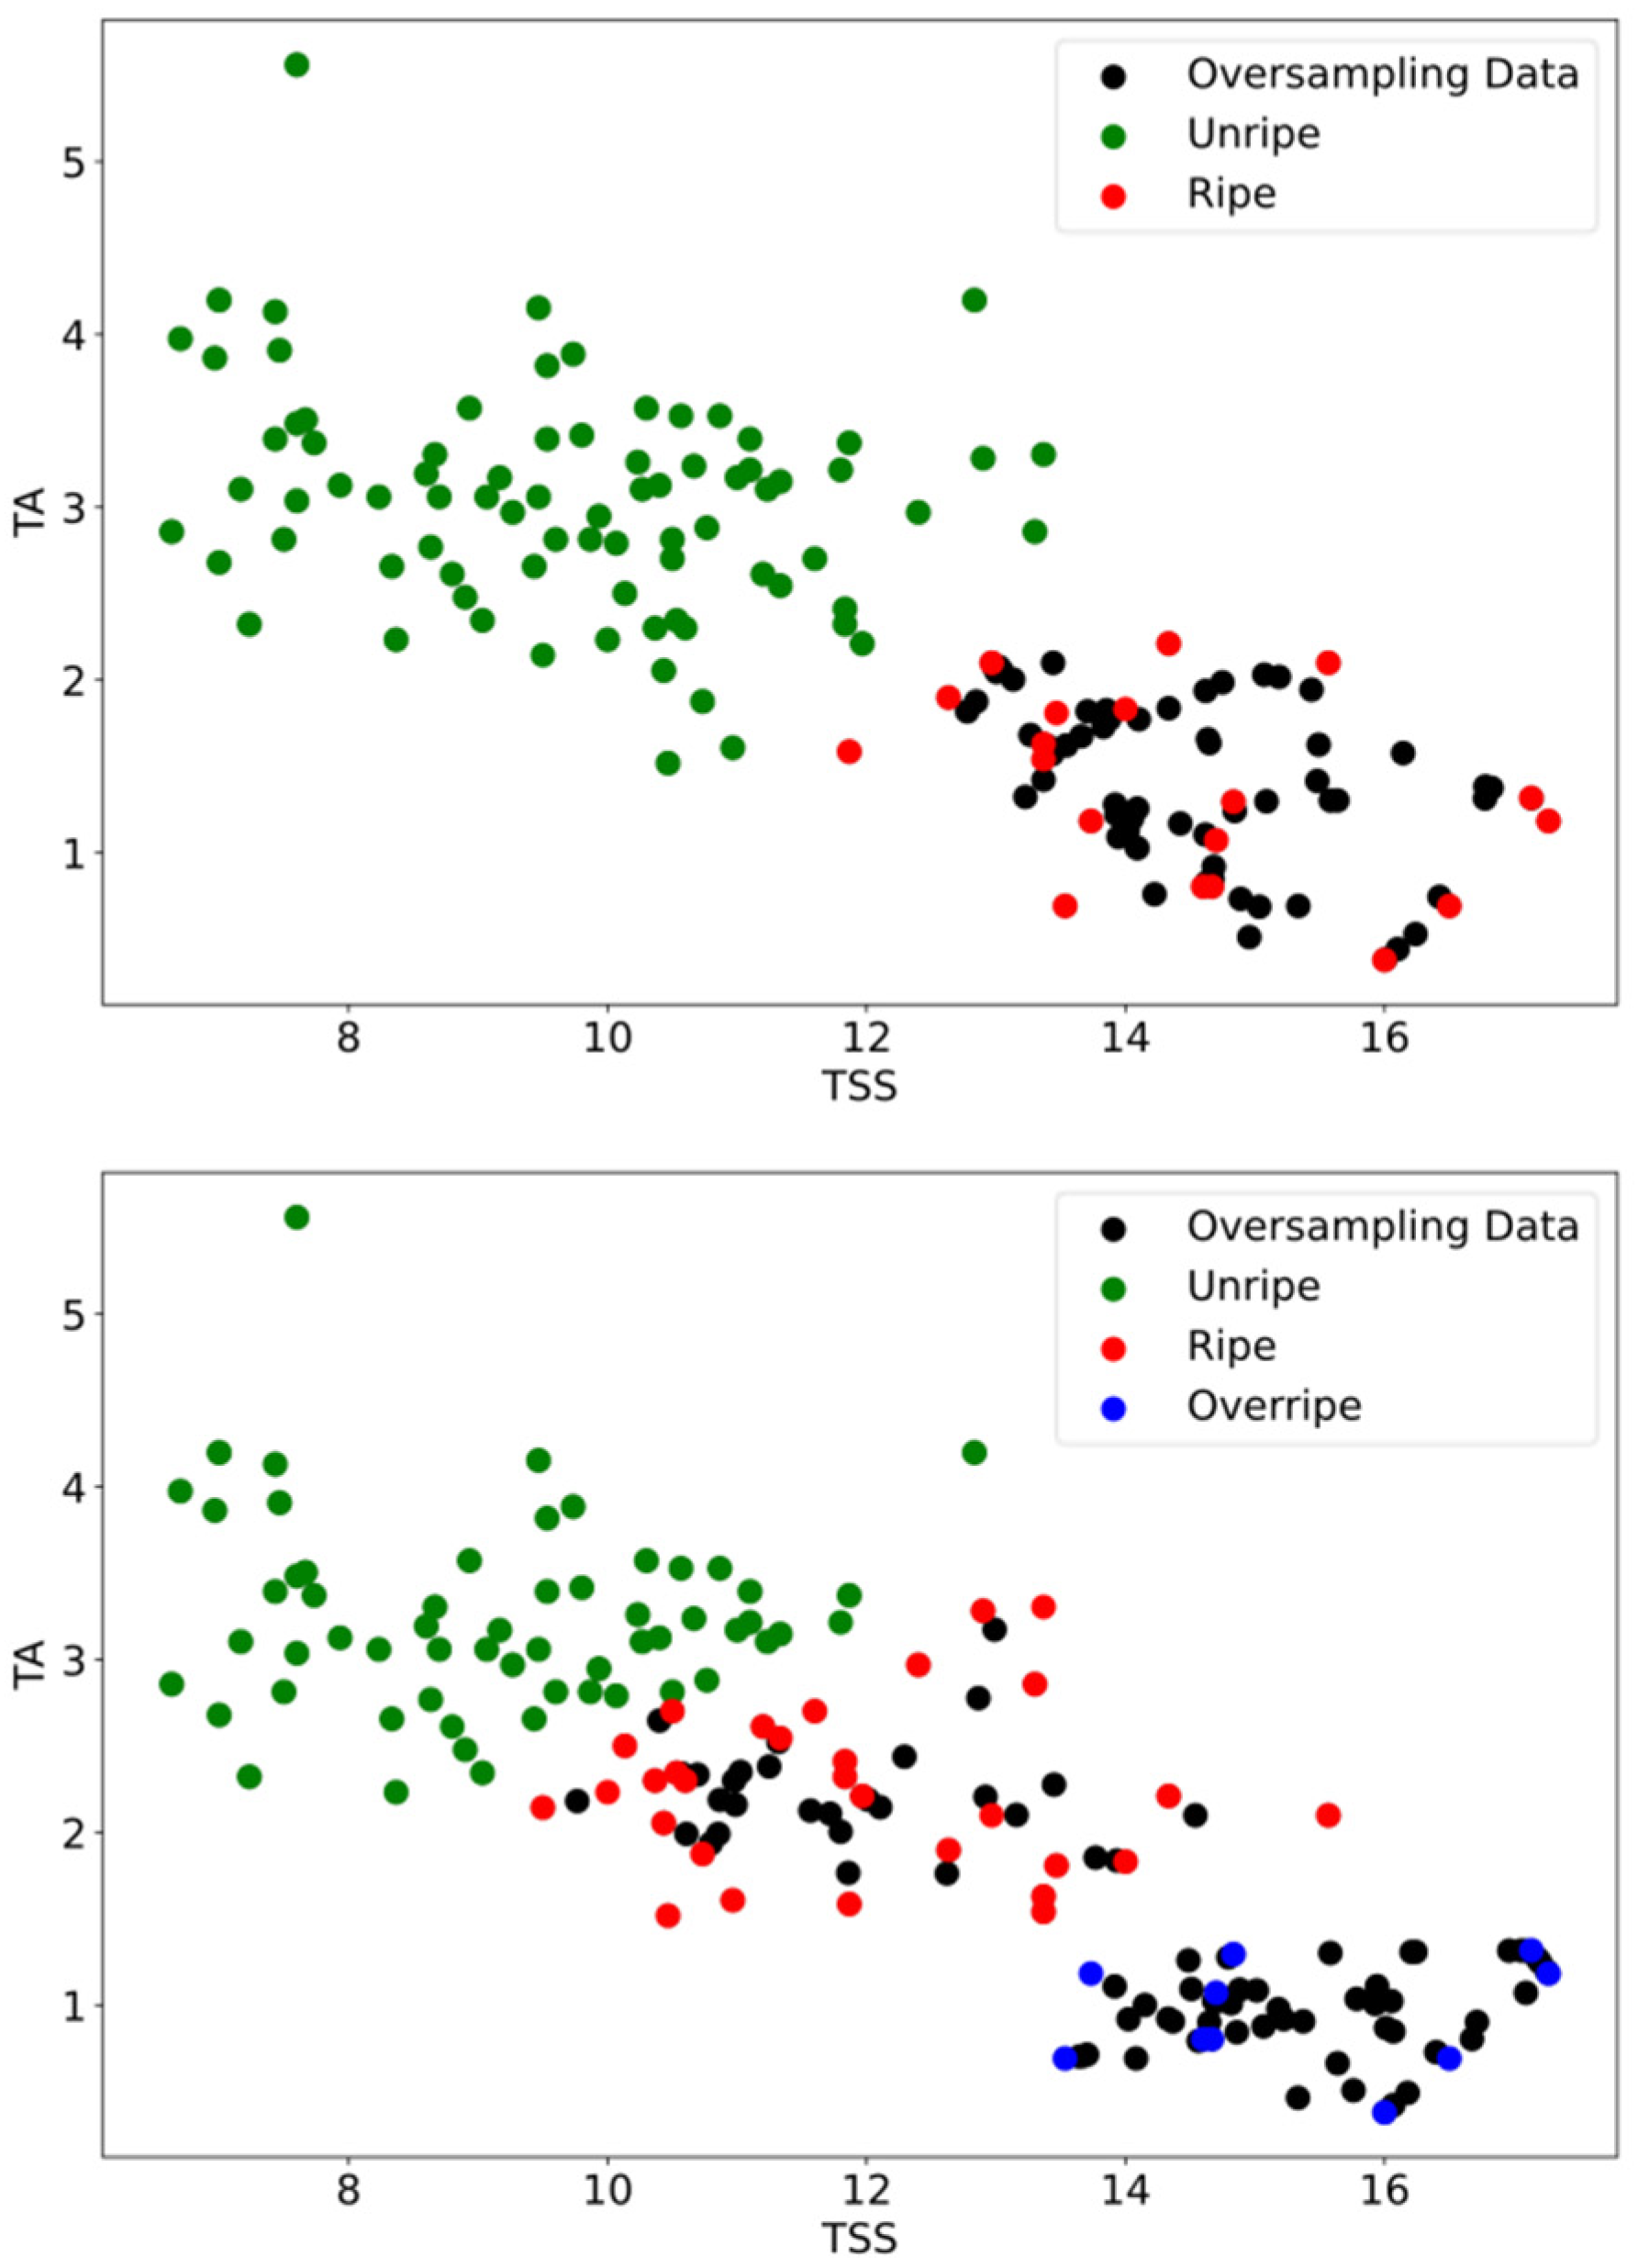
Section 2.5 showed an unequal number of mango samples for both two and three ripeness classes. For two ripeness classifications, the unripe class was the majority mango class, and the ripe class was the minority class. For three ripeness classifications, the unripe class was the majority mango class, and the overripe class was the minority class. We employed the SMOTETomek oversampling algorithm to generate additional training samples to balance the data distribution in minority classes.
Table 4 displays the number of mango samples prior to and following the SMOTETomek technique. The numbers of mangoes in the unripe and ripe classes after oversampling data were 79 and 79, respectively. The numbers of mangoes in the unripe, ripe, and overripe classes after oversampling data were 58, 57, and 59, respectively. The distribution of the amount of data after oversampling with the SMOTETomek algorithm is depicted in
Figure 8.
Table 5 displays that the averages and standard deviations of the oversampling data of 10 variables, the same as those given in
Table 4, from 100 mango samples, were not much different from the statistics regarding the original data. Regarding the two classes (ripe and unripe) and three classes (ripe, unripe, and overripe),
Table 6 shows that no significant difference was found between the averages and standard deviations of the original data and oversampling data for the 10 variables listed in
Table 4 from 100 mango samples.
3.4. Comparison of Machine Learning Models
We classified mango ripeness using GNB, SVM, and FANN classifiers. The data for training the ML classifiers were mango weight, skin color, capacitance, and voltage across parallel-plate sensors. The performance of the classifier models was evaluated using fourfold cross validation.
Table 7 shows the results of the ML models for two-class classification without any data sampling. The GNB, and SVM, and FANN models had average accuracies of 73.0%, 75.0%, and 85.0%, respectively.
Table 8 manifests the results of the ML models for three-class classification using original data. For three-class classification, the average accuracies of the GNB, SVM, and FANN classifiers were 57.0%, 55.0%, and 79.0%, respectively.
The performance data of the three ML models with balanced data that were generated through the SMOTETomek algorithm for two-class and three-class classifications are shown in
Table 9 and
Table 10, respectively.
In the comparison between the results from
Table 7 and
Table 9, and also between the results from
Table 8 and
Table 10, we found that the machine learning models with oversampling data performed significantly better than those without it. Specifically, the performance of the FANN classifier was improved by approximately 8.3% and 10.6% for two-class and three-class classification, respectively, using the SMOTETomek algorithm. According to the findings, the FANN classifier performed better than the GNB and SVM classifiers. We noted that classification accuracy and precision were sufficient for supervised ML classifiers in the categorization classification of mango ripeness into both two and three stages.
3.5. Model Validation and Discussion
In
Section 3.4, we performed fourfold cross validation of the GNB, SVM, and FANN models and compared their accuracies. The results dictated that the FANN model outperformed the others (
Table 7,
Table 8,
Table 9 and
Table 10).
To make certain that our FANN model was an effective model for ripeness stage classifying, we used the external unseen physical and electrical data from 20 mangoes for further validation. The results are shown in
Table 11. “Nam Dok Mai Si Tong” mangoes are generally picked for export on days 85–95 after fruit set. In this work, mangoes were harvested at 80, 90, 100, and 110 days after fruit set (DAFS).
On day 1 following harvest, the FANN model identified mangoes that were 80 DAFS as unripe mangoes and those that were 100 and 110 DAFS as ripe mangoes. These results were as we expected. The 80 DAFS mangoes labeled 1 were predicted by the FANN model as overripe on day 7 after harvest.
The 90 DAFS mangoes labeled 1 and 5 were predicted as ripe on day 1 after harvest; however, they were predicted as unripe from days 2 to 7 after harvest. We thought that these two samples had a total soluble solid (TSS) overlap between unripe and ripe levels. This is naturally possible because there is no clear-cut boundary between unripe and ripe mangoes using biochemical properties as indicators. The 90 DAFS mangoes were indicated by the FANN model as ripe and overripe on day 9 after harvest.
Most of the mangoes at 100 DAFS and 110 DAFS were predicted to be in the ripening stage, as expected, since they were harvested after the commercial export practice. The 100 DAF mangoes labeled 1 and 4 could have been incorrectly predicted by the machine learning model, since they were forecasted as unripe from day 1 to day 9 after harvest. The FANN model wrongly predicted the 110 DAFS mangoes labeled 3, 4, and 5 on day 7 after picking, because these mangoes should have been classified into either the ripe or overripe stage. The predicted ripeness stage of each batch of mangoes altered from day 1 to day 9 after harvest, as expected.
