Article

Research on Biomechanical Properties of Laver (Porphyra yezoensis Ueda) for Mechanical Harvesting and Postharvest Transportation

1
College of Mechanical and Power Engineering, Dalian Ocean University, Dalian 116023, China
2
Marine Fishery Equipment Professional Technology Innovation Center of Liaoning Province, Dalian 116023, China
3
Key Laboratory of Environment Controlled Aquaculture, Ministry of Education, Dalian 116023, China
*
Author to whom correspondence should be addressed.
AgriEngineering 2022, 4(1), 48-66; https://doi.org/10.3390/agriengineering4010004
Submission received: 19 December 2021 / Revised: 13 January 2022 / Accepted: 17 January 2022 / Published: 20 January 2022

Abstract

:
This paper investigates the effect of origin, harvest times and loading rates on the biomechanical properties of laver, aiming to develop laver harvesting and postharvest transportation equipment. The values and changing regular of biomechanical properties were obtained via a combination of morphological and mechanical tests as well as numerical statistics. The correlation between biological and mechanical properties was detected simultaneously. The results show that the biological properties are affected dramatically by origin and harvest times. The values of length, width, thickness and mass of laver from Dalian exceeded those found in Qingdao and Lianyungang. The width, thickness and mass increased, whereas the length-to-width ratio decreased with the increasing harvest time. Meanwhile, the mechanical properties are also influenced significantly by loading rates, origin and harvest times. Tensile and shear strength displayed an overall decreasing trend, whereas adhesive force and adhesiveness in general increased with the increasing loading rate. The tensile and shear strengths were greatest for laver from Qingdao, while the adhesive force and adhesiveness were greatest for laver from Dalian. Tensile strength, adhesive force and adhesiveness increased, and shear strength decreased with the delay of harvest time. In addition, the tensile strength and thickness of the laver at different harvest times were positively correlated. The maximum tensile strength, shear strength, adhesive force and adhesiveness were 3.56 MPa, 4.79 MPa, 0.32 N and 1.01 N·mm, respectively. These results are believed to be able to provide a reference for the design and optimization of machineries such as harvest, postharvest transportation and laver processing.

1. Introduction

Laver (Porphyra yezoensis Ueda) is an important economic alga, consumed as food and an ingredient beneficial to health, mainly distributed in the coastal areas of Asia, such as Japan, Korea and China. With the boosting of human awareness regarding its nutritional and pharmaceutical value, the requirement for laver has increased dramatically [1,2,3,4], which has subsequently driven the rapid development of worldwide laver cultivation, with the world production of laver cultivation reaching up to 2.87 × 10⁶ t in 2018 as per statistics [5]. Harvesting and postharvest transportation is a key link in its production chain, and the level of mechanization directly affects its economic value [6]. Presently, laver is primarily harvested using a roll-type harvester in Japan and South Korea [7,8,9,10]. In terms of postharvest transportation, laver is pumped using laver–seawater two-phase flow technology to realize low loss transportation in Japan [11]. In South Korea, laver is transferred using spiral transportation technology [12,13], reducing labor costs. In recent years, China has been a worldwide leader with regard to the scale of laver cultivation, and the yield was about 2.22 × 10⁵ t in 2020 [14]. However, substantial labor is still required for harvesting and postharvest transportation, which is a major problem in terms of high labor intensity, low production efficiency and poor product quality, hindering the further development of the laver cultivation industry [15,16].
Mechanized harvesting and the postharvest transportation of lavers are closely related to their own biomechanical properties, and these properties vary with the season, temperature and growth environment [17,18]. For instance, the length of laver cultured in Bohai Bay, China, is significantly negatively correlated with temperature and positively correlated with nitrite [19]. Thalli and cell walls of laver thickened under high salinity conditions [20]. In the process of laver harvesting, the roll-type knife produces the force illustrated in Figure 1. Different motion parameters (such as speed ω, advance speed v, cutting angle θ, etc.) cause different proportions of tensile stress and shear stress on the laver. Meanwhile, the mechanical strength of the laver itself also leads to different fracture patterns [10,21,22], thereby affecting the harvesting quality and quantity. Due to the toughness and viscosity of the laver, in the process of mechanized transportation, the laver moving relative to the contact surface will be subjected to strong adhesion resistance, thereby increasing the power consumption and difficulty of transportation. Therefore, the biomechanical properties of the laver are the theoretical basis for the design of harvesting and postharvest transportation equipment. Suppose accurate parameters of biomechanical properties cannot be yielded. In that case, the structural design of the equipment will possess no basis and will fail to achieve the expected harvesting and transportation effect. Hence, there is an urgent need for research on the biomechanical properties of laver.
Studies regarding the biological properties and mechanical properties of algae, stems, stalks and leaves of other plants have been reported. Some studies have reported on the effect of the growing origin on the biomechanical properties of plants. The results of cultivation trials conducted by Shimada on laver strains taken from Kikonai, Hakodate, Esan Promontory and Chiba in Japan showed that the length and the length-to-width ratio of laver had significant differences as the number of days in cultivation increased [23]. Kim et al. [24] studied the morphological characteristics of laver at six main laver origins in Korea, and a significant difference was found in the length, width and mass of laver. India-endemic laver was gradually thickened as the algae matured [25]. Other research showed that origin influenced the mechanical properties of plants, including wheat straw [26] and tobacco leaf [27,28,29]. Researchers believe that the biomechanical properties of plants usually differ between harvest times. Wang et al. [30] reported that the length of the thallus of two strains of Porphyra haitanensis gradually decreased and dry mass increased with the extension of harvest time. Niwa et al. [31] concluded that the width and thickness increased and the length-to-width ratio decreased with the delay of the number of harvests. Similar results were found by Song [32] and Masuda et al. [33]. Pieces of literature [34,35,36,37] all revealed that the thickness of the laver generally increased with harvest time. Furthermore, mechanical properties are influenced by the harvest times as well. Studies [38,39] showed that the shear strength was significantly greater at the first maturity stage than at the second to fourth maturity stage, and adhesive force decreased significantly with the progression of harvesting periods. Numerous studies have also delved into the effect of applied loading rate on the mechanical properties of algae and other plants. Chen [40] tested the tensile properties of kelp at different loading rates, and the results showed that loading rates were positively correlated with the tensile strength of kelp. Meanwhile, several studies have also reported the effect of loading rate on mechanical properties of agricultural crops. The crops included saffron [41], sorghum [42] and lilium [43]. In general, the biomechanical properties of algae, plant stem stalks, and leaves are strongly influenced by factors such as origin and harvest times. As far as we know, few studies have systematically delved into the effects of origin, harvest times and loading rates on the biomechanical properties of laver for mechanized harvesting and postharvest transportation. Moreover, laver is a flexible aquatic plant, somewhat differing from ordinary agricultural material, and yielding accurate biomechanical properties of laver through methods that measure biomechanical properties may be challenging.
Laver with different origins and harvest times were selected as the research objects to address the aforementioned issues. Its biomechanical properties, i.e., geometric morphology, tensile and shear properties, amongst others, were determined. The novel testing method was explored. The mapping relationship between the biological and mechanical properties of laver was analyzed to provide a reference for the design and optimization of commercial laver harvesting and postharvest transportation equipment.

2. Materials and Methods

2.1. Materials

The laver used in this study was harvested from the cultural origins of Xingshu Village, Dalian City, Liaoning Province (39°17′55.9″ N, 122°09′26.6″ E), Chanshan Village, Qingdao City, Shandong Province (36°23′41.5″ N, 120°52′34.1″ E) and Gaogongdao Village, Lianyungang City, Jiangsu Province (34°42′ 14.8″ N, 119°28′59.9″ E), depicted in Figure 2, and the harvest times were Dalian, Qingdao and Lianyungang for the first harvest (early December 2020, namely D1, Q1 and L1), Lianyungang for the second harvest (late December 2020, namely L2) and Lianyungang for the third harvest (mid-January 2020, namely L3) of laver. They were immediately refrigerated (0.5 °C) after harvesting to retain their freshness.

2.2. Equipment and Methods

2.2.1. Biological Properties Tests

Thirty samples of D1, Q1, L1, L2 and L3 were selected. Before measurement, the morphologically intact laver samples were unfolded in a 1000 mL beaker filled with seawater and then laid flat on a wooden board. The length, width and thickness of each laver were measured using a digital vernier caliper (Deli, model DL91300, Deli Group Co. LTD, Ningbo, Zhejiang, China, accuracy of ±0.03 mm) and an electronic thickness gauge (SYNTEK, model 59CHQF, Deqing Shengtaixin Electronic Technology Co., LTD, Zhejiang, China, accuracy of 0.001 mm), respectively. The length is the longest distance from the base to the edge [23], the width and thickness are the mean value of the midpoint between the base and middle, the middle, and the midpoint between the middle and the tip, respectively [25,44,45], and the length-to-width ratio is the ratio of the length to the mean width. The mass of each laver was determined using an electronic balance (Mettler Toledo, model ME104E/02, Instrument Shanghai Co., LTD, Shanghai, China, accuracy of 0.1 mg). The mean value and standard deviation of each test index were subsequently calculated.

2.2.2. Mechanical Properties Tests

The mechanical tests were performed on a Texture Analyzer (TMS-PRO type, Food Technology Co., LTD, Sterling, VA, USA) attached to a load cell (range of 1000 N, accuracy of 0.015%). The samples for the mechanical properties tests were shaped and sized according to GB/T1040.3-2006 and cut into dumbbell shapes [40]. Tensile and shear samples of laver were prepared as illustrated in Figure 3; 20 g of laver was weighed on a balance (BT1500, Shanghai Sound Weighing Instrument Co., LTD, Shanghai, China, accuracy of 0.1 g) each time for the adhesive force and adhesiveness tests. Three variables were selected: loading rate, harvest time and origin; two of these variables were fixed, and the other variable (Table 1) was varied for tensile tests, shear, adhesive force and adhesiveness tests, with each set of tests being repeated 30 times. The mean value and standard deviation were subsequently calculated.

Tensile Test

To ensure that the laver remained intact from the rigid jaw and could be effectively clamped during the tensile test, a latex pad was wrapped around the jaw of the texture analyzer. The range of the load cell was set to 25 N, and the pre-test speed was set to 50 mm/min. The test speeds were set to 10 mm/min, 20 mm/min, 30 mm/min, 40 mm/min and 50 mm/min, the post-test speed was set to 100 mm/min, the trigger force was set to 0.1 N, the tensile distance was set to 50 mm and the probe retraction height was set to 20 mm. The tensile force and displacement curves were recorded and displayed on a computer during the test. The force at fracture was recorded as the maximum tensile force of the laver. The width and thickness of the sample at the fracture were measured to calculate the cross-sectional area of the sample. The tensile strength of laver was calculated as shown in Equation (1):
σ = F 1 A 1
where σ denotes the tensile strength (MPa), F1 represents the maximum tensile force (N) and A1 is the cross-sectional area at the tensile fracture of the laver sample (mm2).

Shear Test

The sample was placed on the test platform of the texture analyzer, and to prevent the laver from moving during knife shearing, a self-made shear clamp, as illustrated in Figure 4, was used for clamping and fixing. Latex pads were placed on both ends of the sample to ensure that the laver was not crushed by the clamp during the shear test and could be reliably clamped. The shear test was carried out using a standard straight shear probe. The range of the load cell, trigger force, test speed and post-test speed was identical to those set in the tensile test. The probe retraction height was set to 40mm. During the test, the shear force and displacement curve were recorded and displayed on a computer. The force at fracture was recorded as the maximum shear force of the laver. The width and thickness of the sample at the fracture were measured to calculate the cross-sectional area of the sample. The shear strength of laver was calculated as in Equation (2):
τ = F 2 A 2
where τ denotes the shear strength (MPa), F2 represents the maximum shear force (N) and A2 is the cross-sectional area at the shear fracture of the laver sample (mm2).

Adhesive Force and Adhesiveness Test

A cylindrical probe with a diameter of 25.4 mm and a height of 35 mm was used for the adhesive force and adhesiveness test. The range of the load cell was set to 25 N, the height of the probe back up to the surface of the sample was set to 40 mm, the deformation percentage was set to 50% and the test speed was set to 10 mm/min, 20 mm/min, 30 mm/min, 40 mm/min and 50 mm/min, respectively, and the trigger force was set at 0.1 N.

2.3. Statistical Analysis

One-way analysis of variance (ANOVA) and Pearson correlation analysis were performed using SPSS 26.0 statistical software (SPSS Inc., Chicago, IL, USA), and multiple comparisons of mean values were performed based on Duncan’s method, with p < 0.05 denoting a statistically significant difference and p < 0.01 representing an extremely significant difference.

3. Results

3.1. Biological Properties of Laver

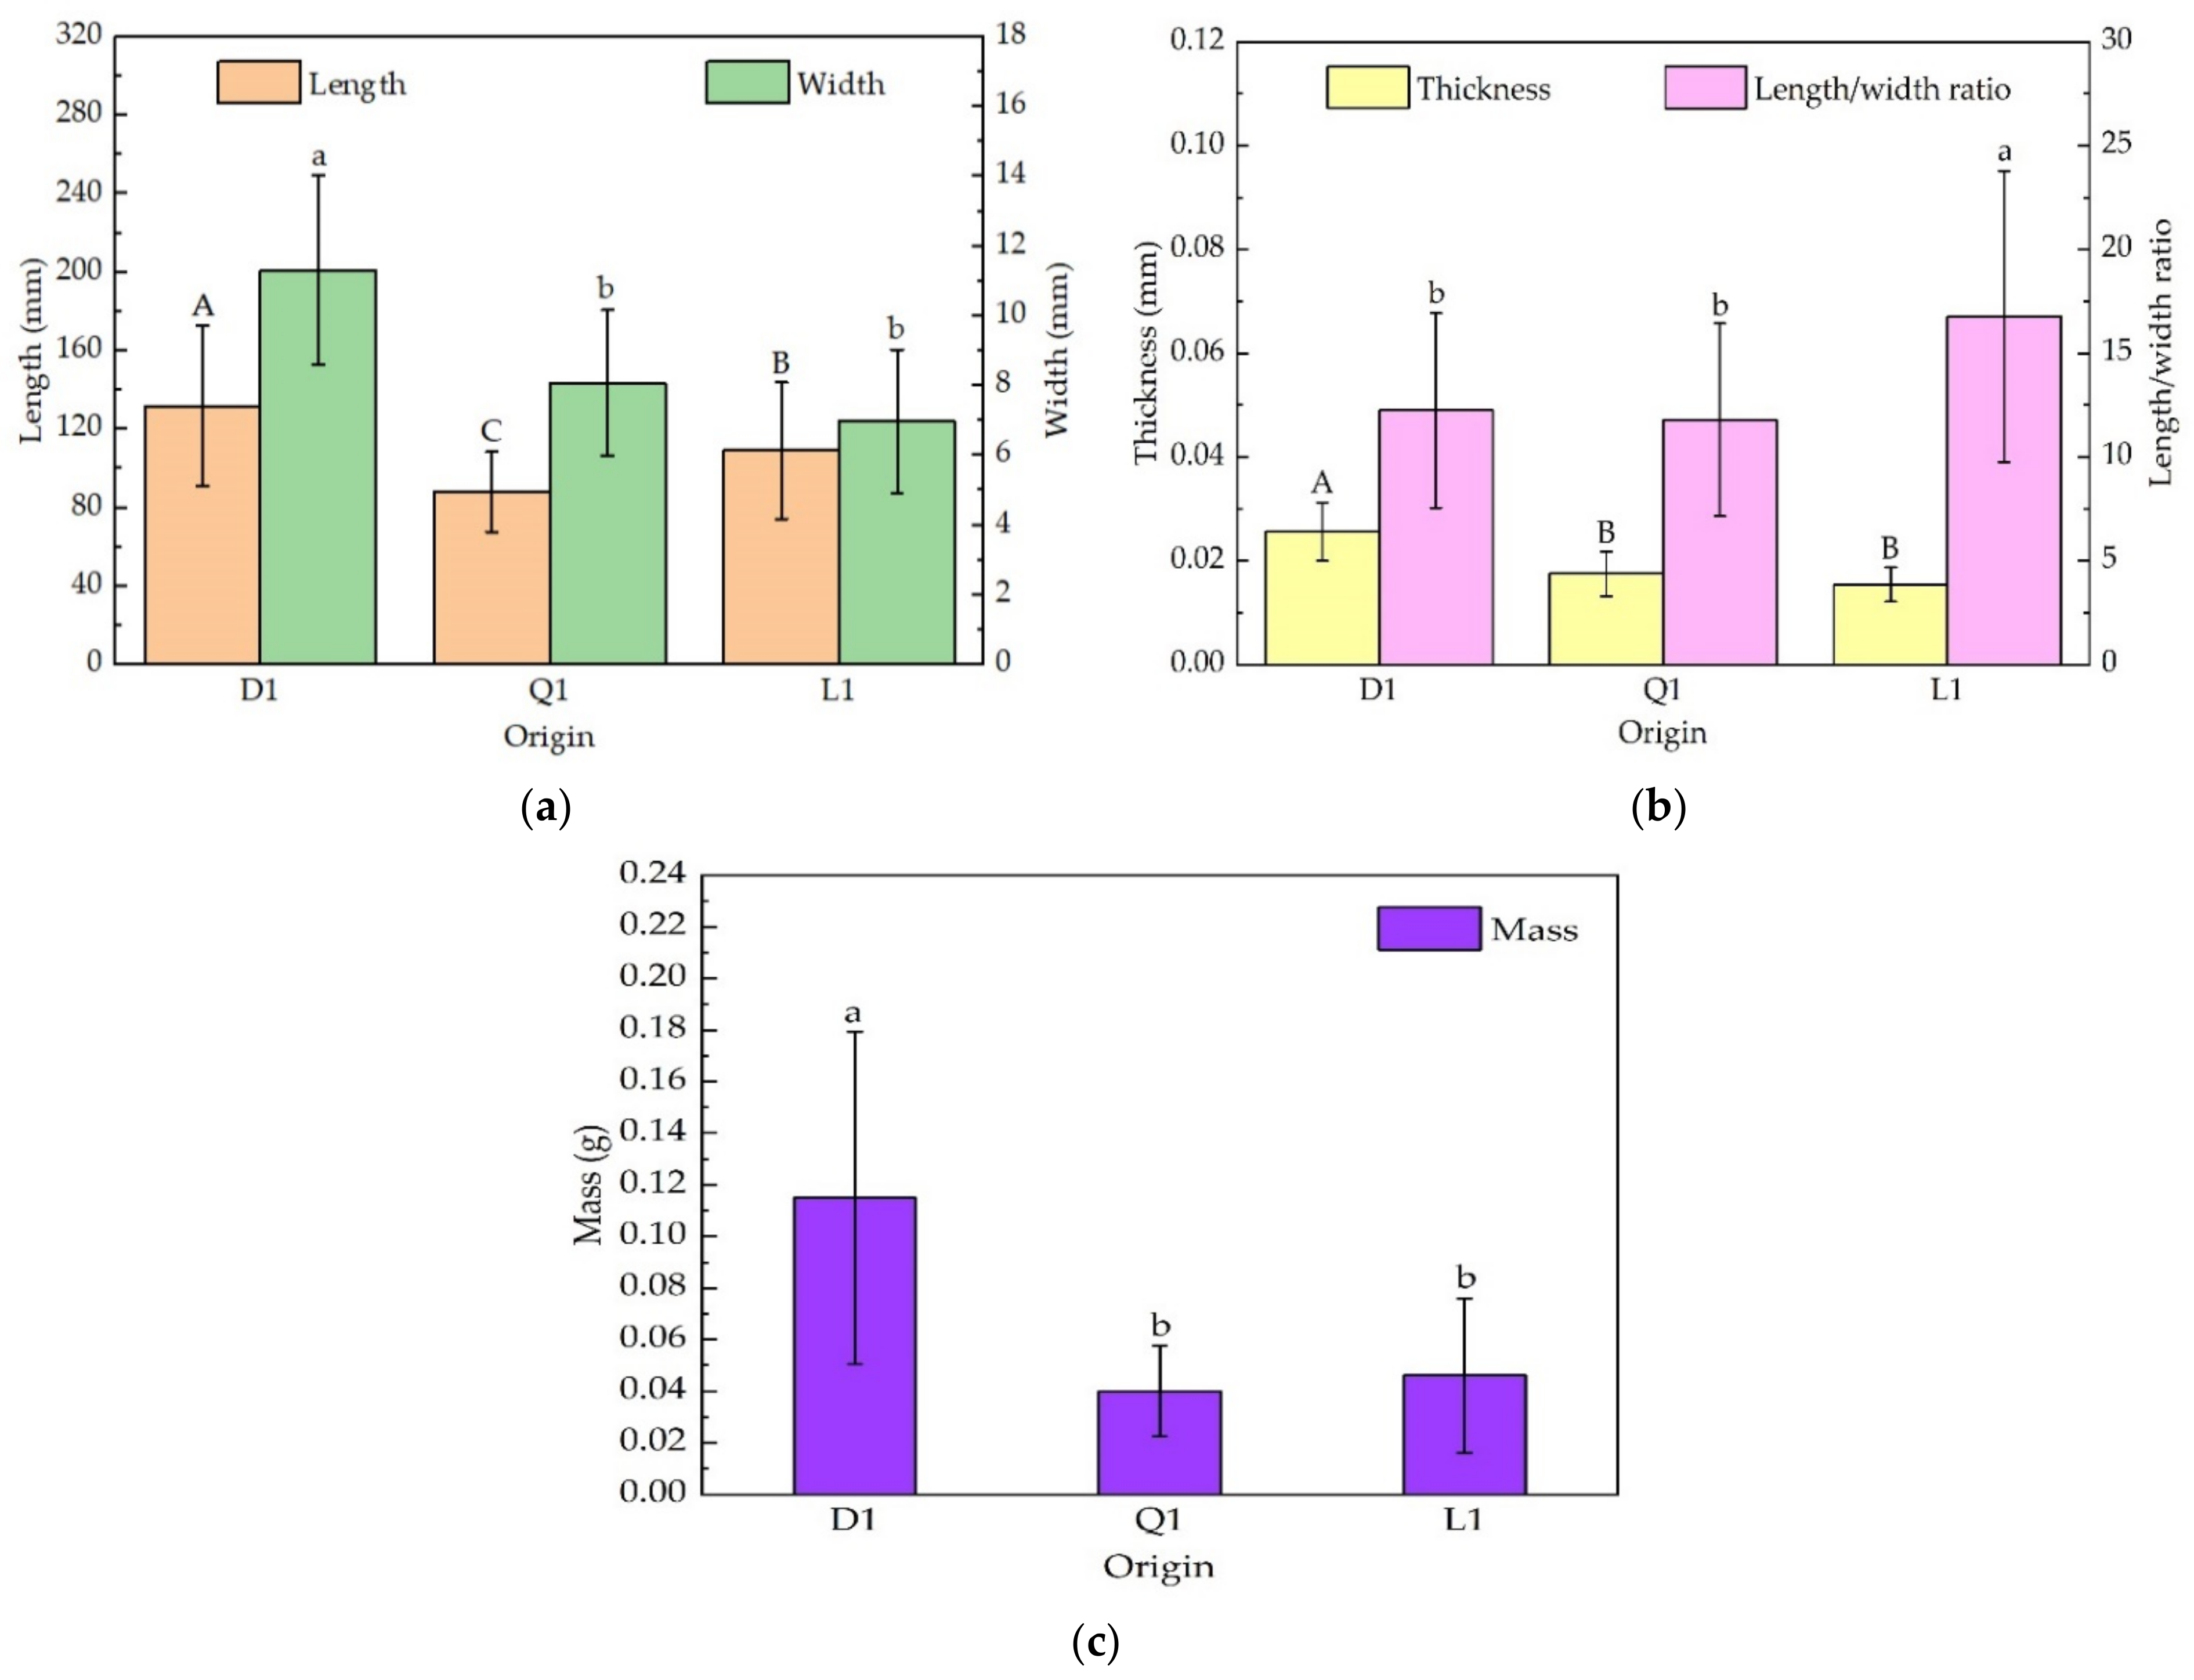
3.1.1. Biological Properties of Laver from Different Origins

The length, width, thickness, length-to-width ratio and mass properties of D1, Q1 and L1 laver are illustrated in Figure 5. A significant difference (p < 0.01) was noted in the length of the laver among the three origins: the Q1 laver was shortest at 88.05 mm, and the D1 laver was longest at 131.75 mm, which was 1.50 times longer than the Q1 laver. From Figure 5a,b, the width and thickness of the D1 laver were significantly greater than those of the Q1 and L1 laver (p < 0.05), while the width and thickness of the Q1 laver were not significantly different from those of the L1 laver (p > 0.05); the width of the D1 laver was the widest at 11.31 mm, which was 1.62 times that of the narrowest L1 laver at 6.97 mm. The thickness of the D1 laver was thickest at 0.026 mm, 1.44 and 1.73 times that of the Q1 and L1 laver, respectively. In terms of length-to-width ratio, there was a significant difference (p < 0.05) between the D1, Q1 and L1 laver at 12.25, 11.79 and 16.77, respectively, while no significant difference was noted (p > 0.05) between D1 and Q1. As inferred from Figure 5c, there was a significant difference (p < 0.01) in the mass of laver between the D1, Q1 and L1 laver, and the mass of the D1 laver was the largest at 0.115 g, 2.87 and 2.50 times that of the Q1 and L1 laver, respectively.
The above result shows that there were differences in the biological properties of laver with three different origins, with the D1 laver having superior biological properties.

3.1.2. Biological Properties of Laver from Different Harvest Times

The length, width, thickness, length-to-width ratio and mass of the L1, L2 and L3 laver are depicted in Figure 6. The variation of length with the harvest time is shown in Figure 6a. The length of the laver first increased and then decreased with harvest time. The length of the L2 laver was largest at 150.84 mm, denoted by an increase of 38.03% compared with the L1 laver, and the length of the L3 laver was smallest at 85.34 mm, which decreased by 43.42% compared to the L2 laver. There was an extremely significant difference (p < 0.01) in the length of the lavers during harvest times. From Figure 6a–c, it can be inferred that the width, thickness and mass of laver increased with the increase in harvest time, and there was a significant difference (p < 0.01), and the ranges were 8.06~30.78 mm, 0.015~0.031 mm and 0.046~0.295 g, respectively. The width of the L1 and L2 laver was 26.19% and 47.63% of the L3 laver, respectively. The L2 and L3 laver thickness increased by 40% and 106.67%, respectively, compared to the L1 laver. As seen in Figure 6b, there was also a significant difference (p < 0.01) between the length-to-width ratio among the three harvest times, with the length-to-width ratio of the L1, L2, and L3 laver decreasing as the harvest time increased, and the range was 3.20~14.38. The length-to-width ratio of the L3 laver was the smallest. The mass of the L2 laver showed the greatest increase of 273.91% compared to the previous harvest time.
Therefore, there were significant differences in the biological properties of laver between harvest times. The length and length-to-width ratio decreased as a whole with increasing harvest time, and width, thickness and mass increased with increasing harvest time.

3.2. Mechanical Properties of Laver

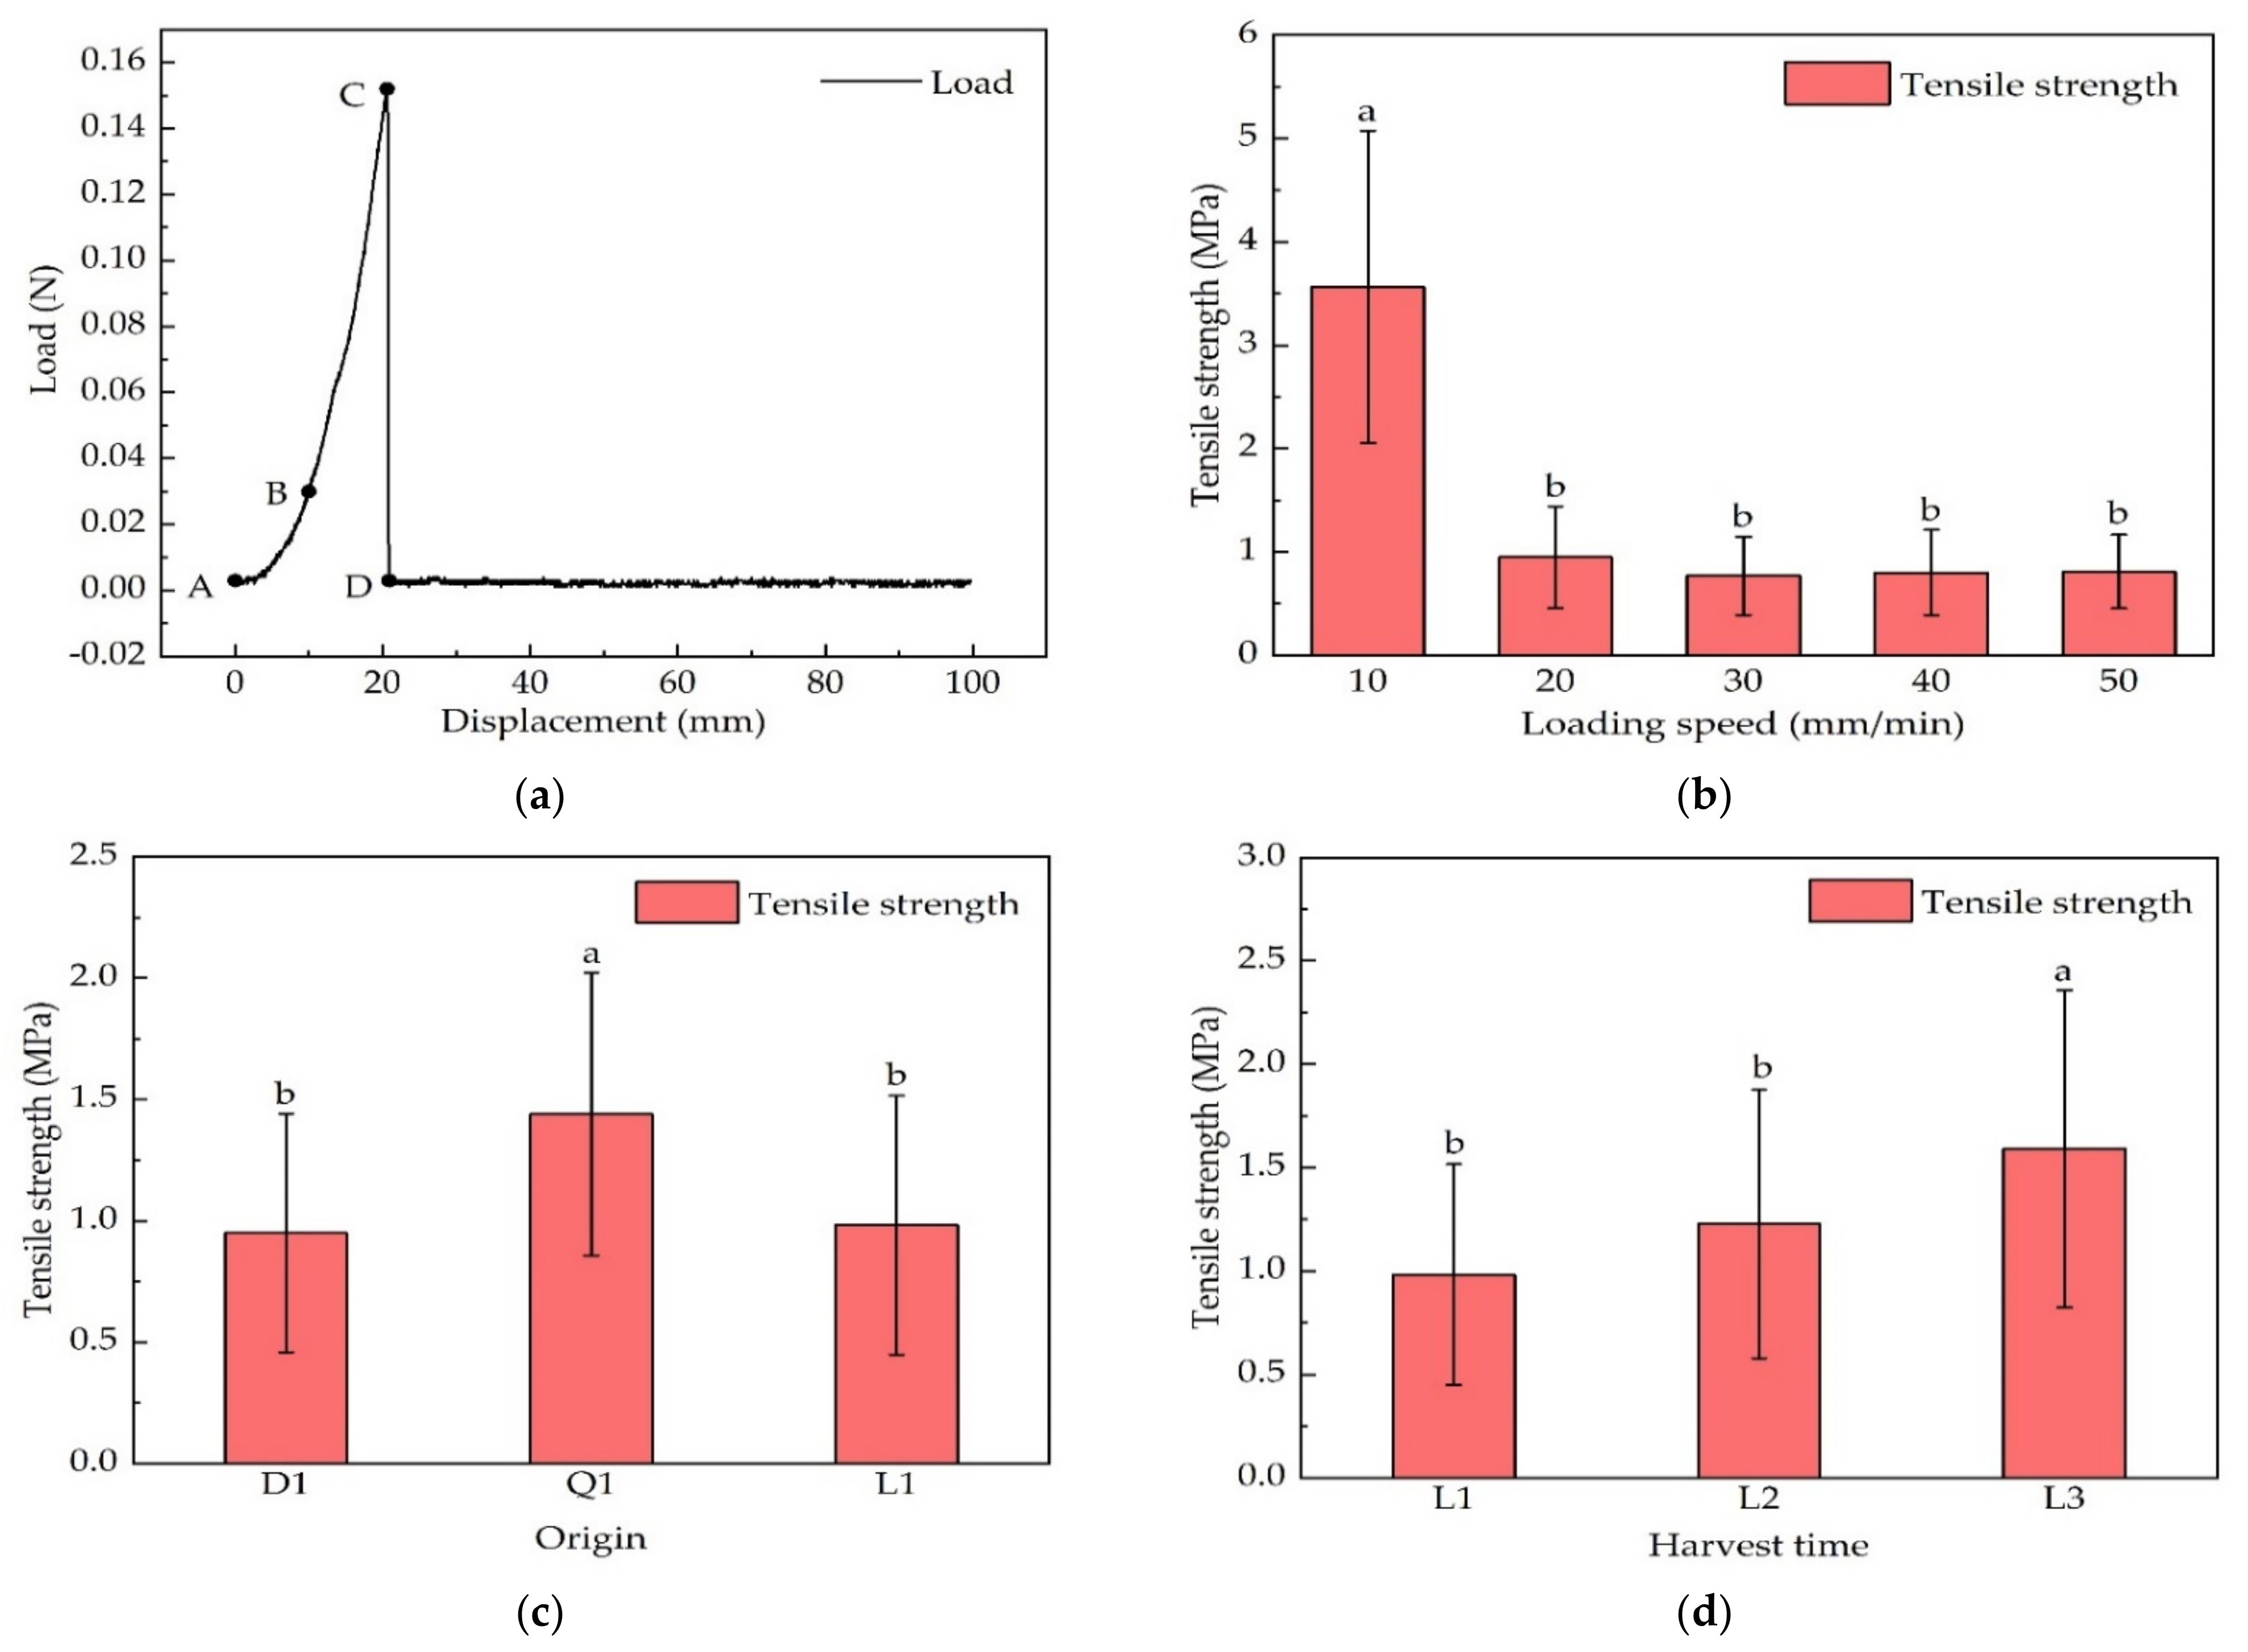
3.2.1. Tensile Properties

The typical tensile curve of the laver (Figure 7a) consisted of two main stages. The first stage is a non-linear section, where the load increased with displacement in the initial stretching stage. As laver is a flexible aquatic plant, it has inherently good ductility and produces a large deformation under a small force (section AB in Figure 7a). In the second stage, before the displacement reached fracture point C, the load and displacement curves were basically linear (section BC in Figure 7a), indicating that this stage is the elastic deformation stage of laver. Its deformation characteristics adhere to Hook’s law, and the slope of the line section BC is the elastic modulus of laver. The laver then continued to be subjected to tensile forces, but instead of showing yielding characteristics, it fractured instantly, and the tensile forces rapidly plummeted (section CD in Figure 7a) until they gradually decreased to 0 [40,46].
The effect of loading rate on the tensile strength of the laver is illustrated in Figure 7b. The tensile strength of the laver showed an overall decreasing trend with increasing loading rate, with the maximum tensile strength of 3.56 MPa when the loading rate was 10 mm/min. The minimum tensile strength was 0.77 MPa when the loading rate was 30 mm/min. The greatest decrease in tensile strength was noted when the loading rate was 20 mm/min, a decrease of 73.34% compared to the previous loading rate. The tensile strengths at loading rates of 20 mm/min, 30 mm/min, 40 mm/min, 50 mm/min and 10 mm/min differed markedly (p < 0.05), while there was no significant difference between loading rates of 20 mm/min to 50 mm/min (p > 0.05). The effect of different origins on the tensile strength of the laver is depicted in Figure 7c. The tensile strength of the Q1 laver was the largest at 1.44 MPa, while the tensile strength of the D1 laver was the smallest at 0.95 MPa. The tensile strength of the Q1 laver was 1.52 and 1.47 times higher than that of the D1 and L1 laver, respectively, and the tensile strength of the Q1 laver was significantly different from that of the D1 and L1 laver (p < 0.05). The effect of harvest time on the tensile strength of the laver is shown in Figure 7d. The tensile strength increased alongside the increase in harvest time. The tensile strength of the L1 laver was the smallest at 0.98 MPa, and the tensile strength of the L3 laver was the largest at 1.59 MPa, which significantly exceeded that of the L1 and L2 laver (p < 0.05) and increased by 61.98% and 29.52% compared with the L1 and L2 laver, respectively, while no significant difference was noted between the tensile strength of the L1 and L2 laver (p > 0.05).
Generally, the maximum mean values of tensile strength of laver for different loading rates, origins and harvest times were 3.56 MPa, 1.44 MPa and 1.59 MPa, respectively.

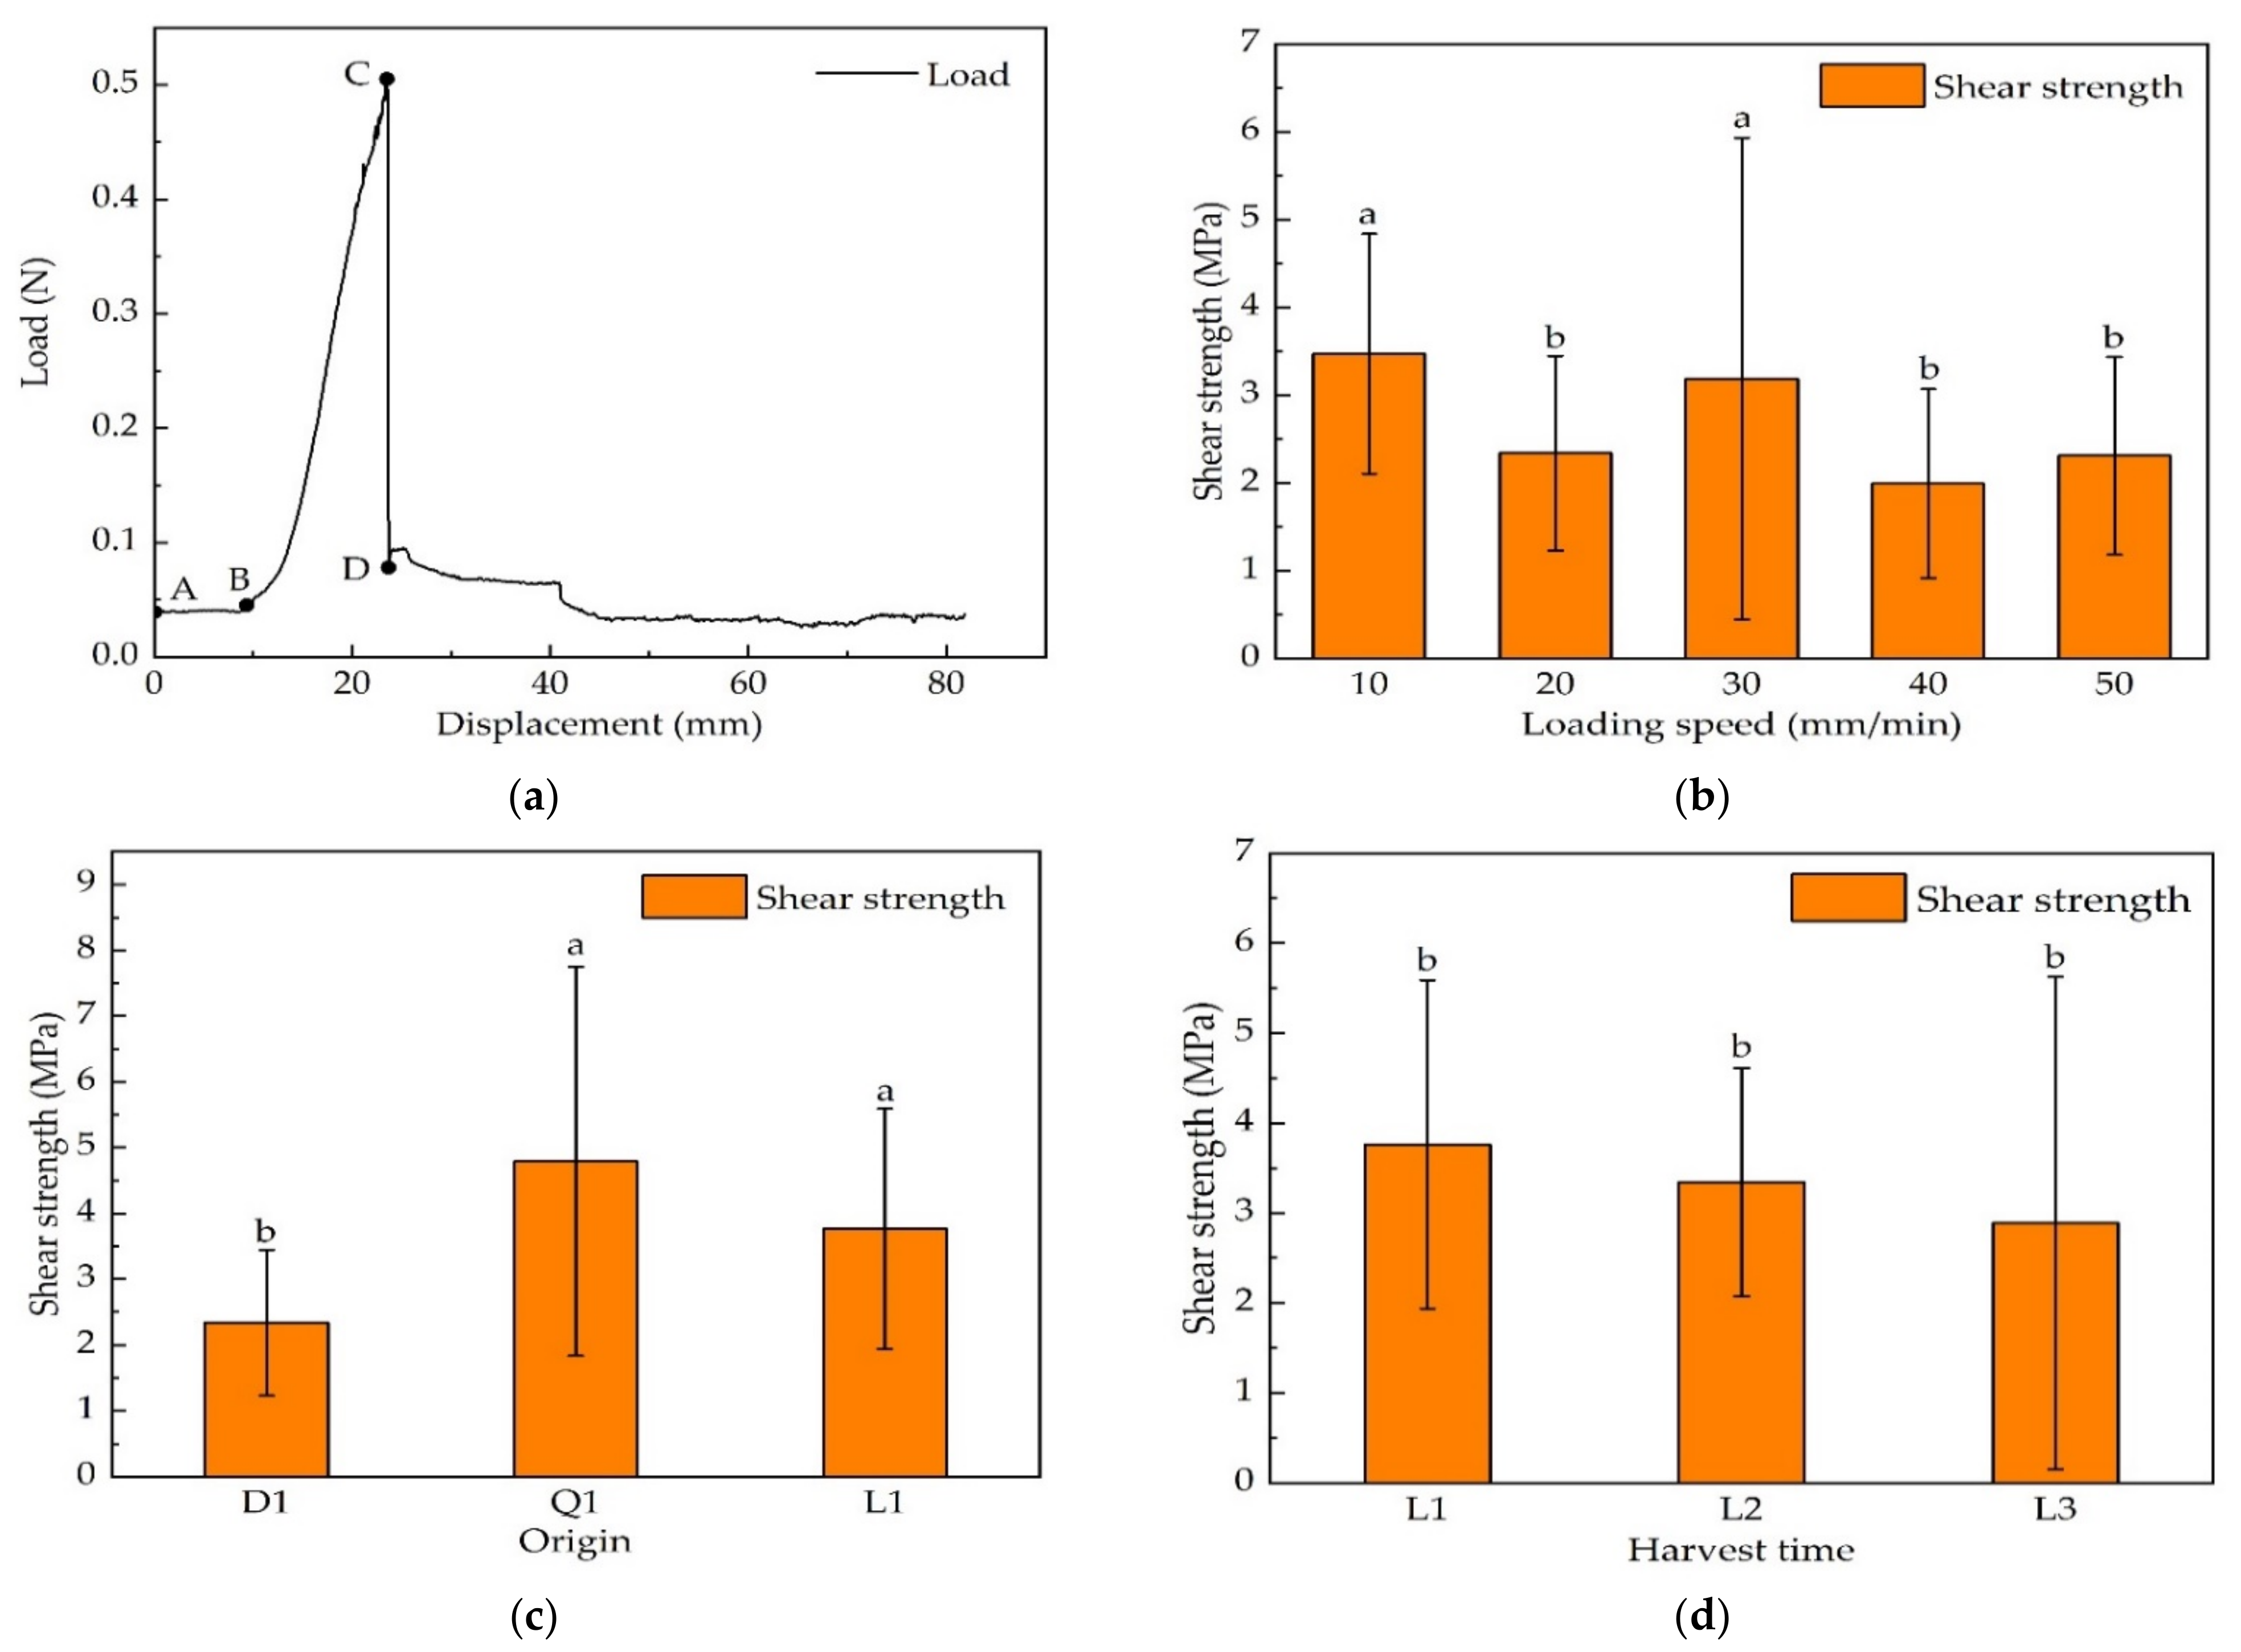
3.2.2. Shear Properties

A typical shear load–displacement curve for the laver is illustrated in Figure 8a. It can be inferred that point A represents the starting point of shear during the entire cutting process, and point D represents the displacement of the probe. The shearing process of the laver consisted of roughly three stages: (1) the no-load stage (AB), during which the shear force increased slowly as the probe gradually approached the laver sample. (2) in the elastic–plastic deformation stage (BC), firstly, the shear force increased rapidly with the increase in displacement, and when the probe cut into the laver, the laver produced local plastic deformation, while the shear force increased significantly. (3) in the laver fracture stage (CD), the laver was sheared into two parts, and then, the shear force decreased rapidly until it decreased to close to 0 [47,48].
The effect of loading rate on the shear strength of the laver is depicted in Figure 8b. The shear strength of the laver showed an overall decreasing trend with the loading rate. The larger shear strength of laver was present at 10 mm/min and 30 mm/min, and the shear strengths were significantly smaller at 20 mm/min, 40 mm/min and 50 mm/min (p < 0.05); the maximum shear strength was 3.47 MPa for laver at a loading rate of 10 mm/min. The effect of origin on the shear strength of the laver is illustrated in Figure 8c. The shear strength of the Q1 laver was largest at 4.79 MPa, 2.05 times that of the D1 laver, and there was a significant difference (p < 0.05) between Q1, L1 and D1, while the shear strength of the Q1 laver did not show any significant differences from L1 (p > 0.05). The effect of harvest time on the shear strength of the laver is illustrated in Figure 8d. The shear strength decreased with the increase in harvest time; the shear strength of the L1 laver was largest at 3.77 MPa, but no significant difference (p > 0.05) was noted in the shear strength of laver between the three harvest times.
In summary, the maximum mean shear strength of the laver was 3.47 MPa, 4.79 MPa and 3.77 MPa for different loading rates, origins and harvest times, respectively.

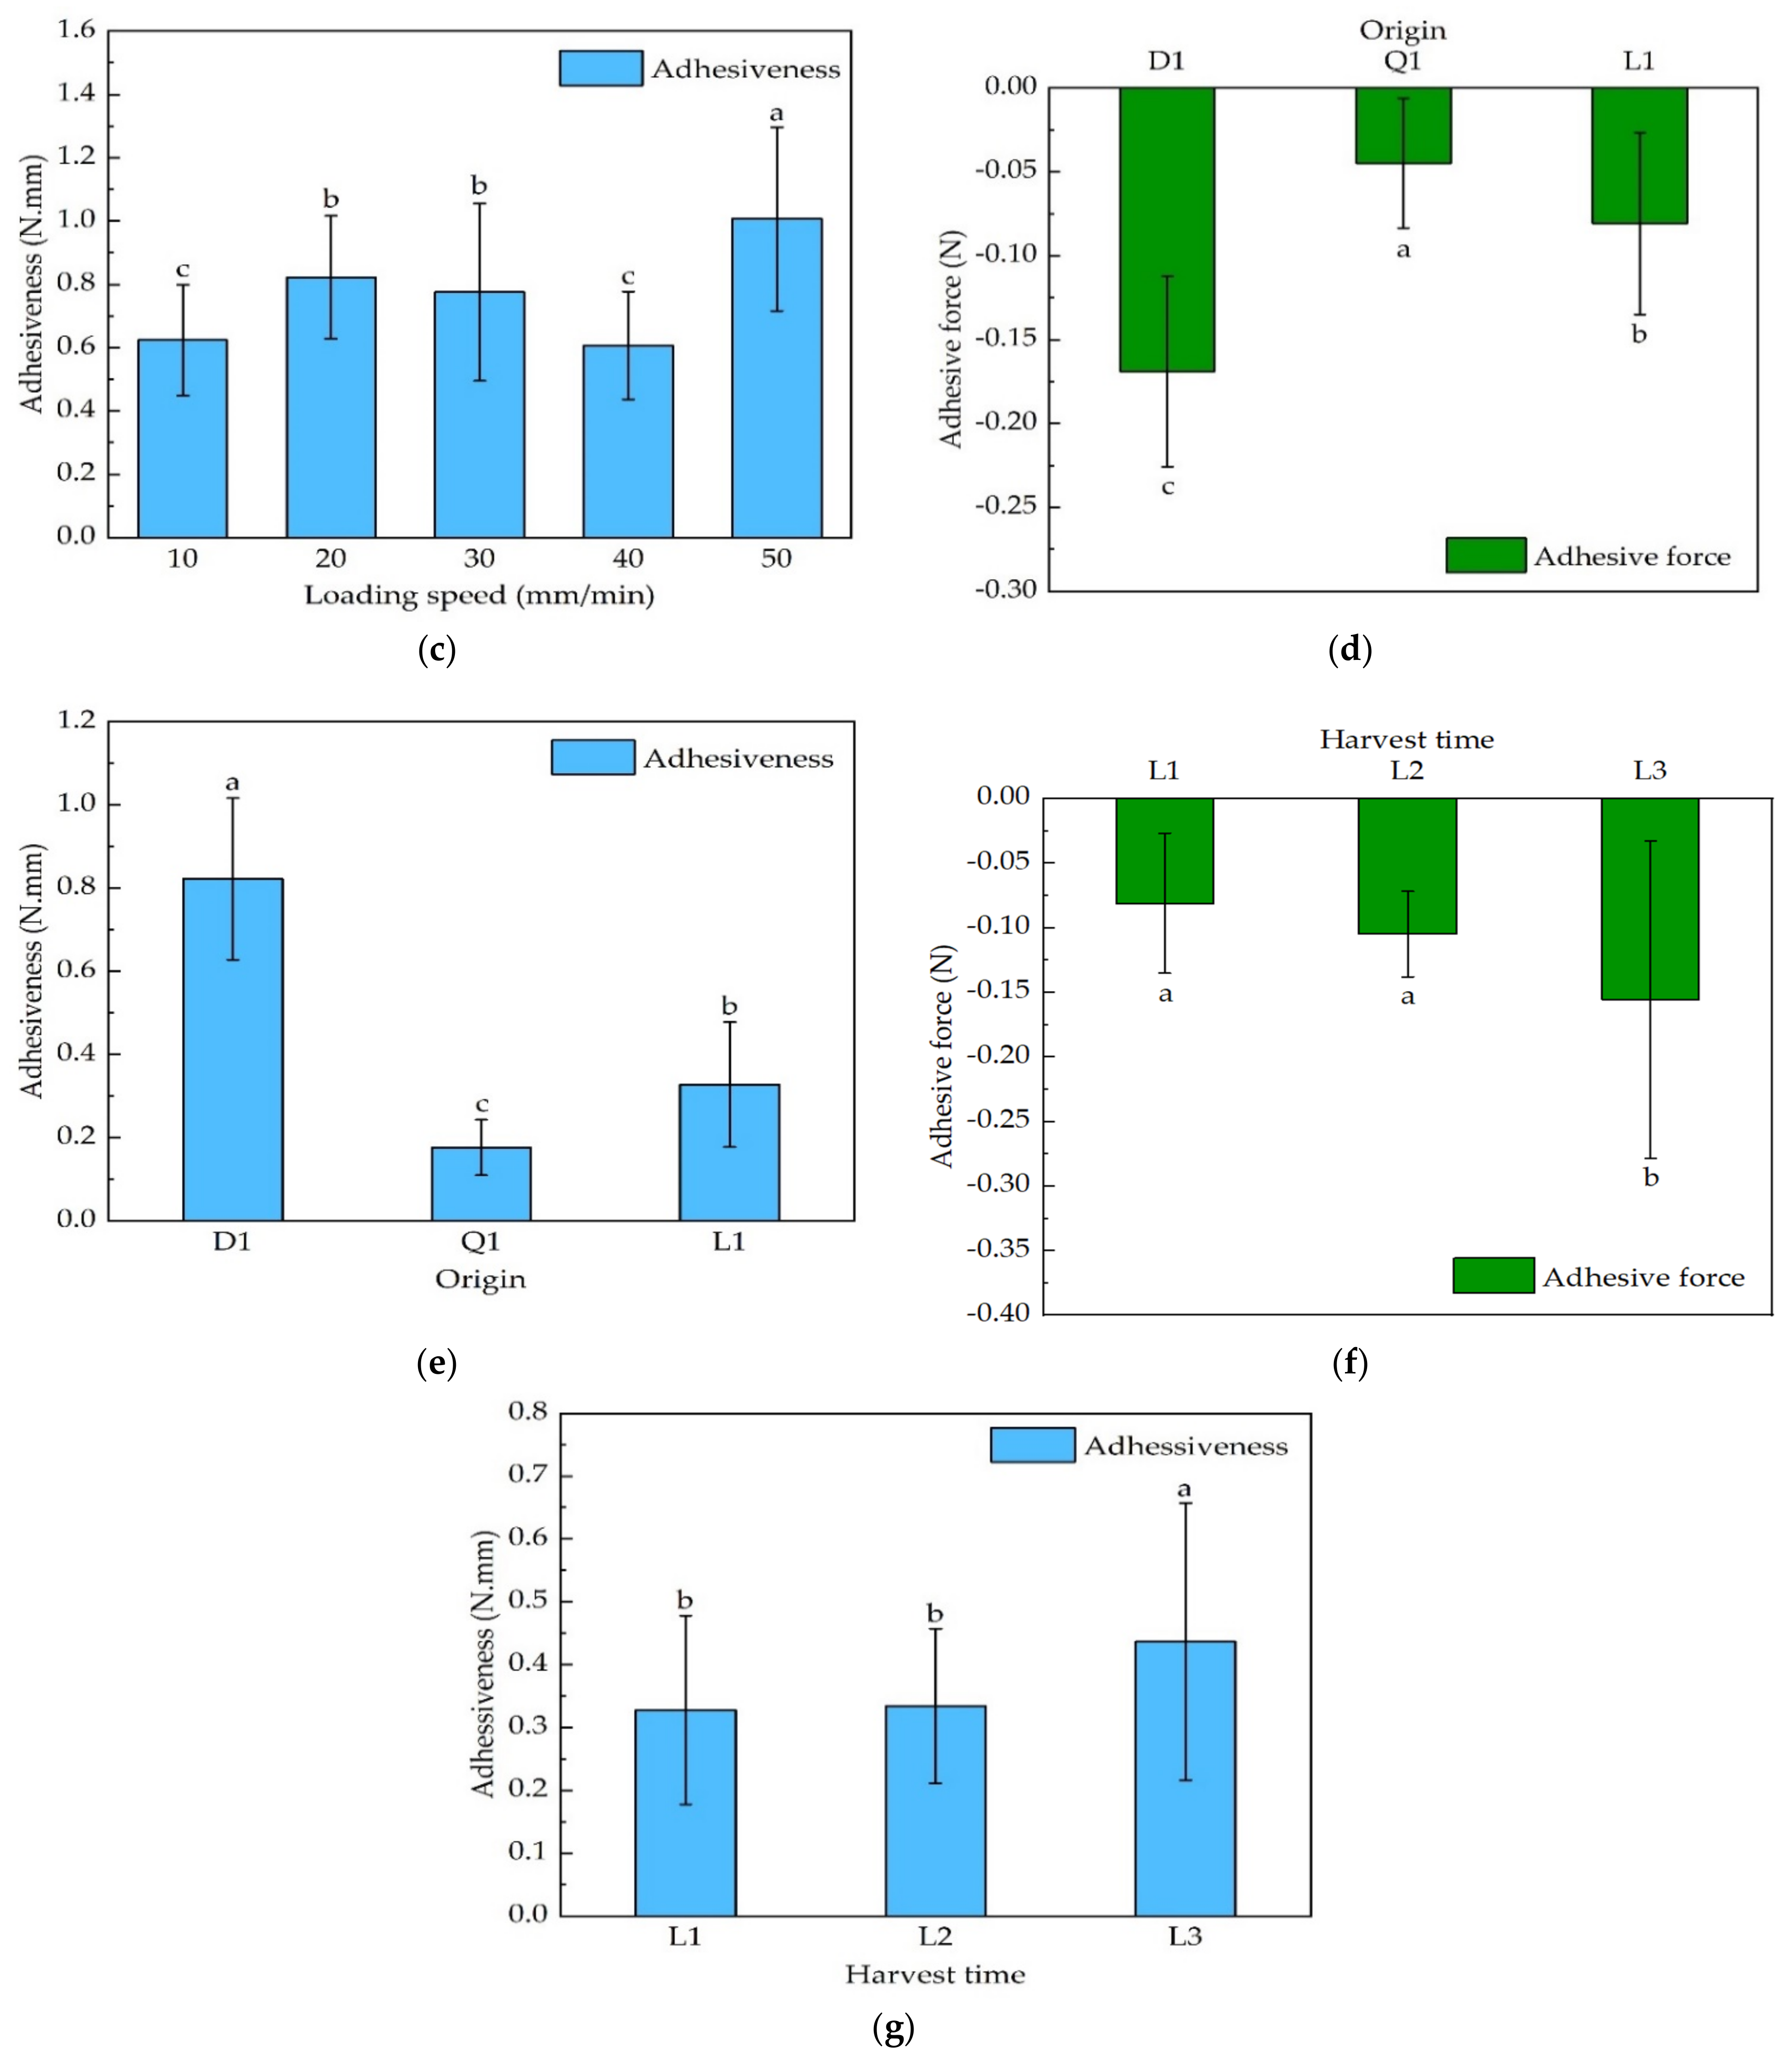
3.2.3. Adhesive Force and Adhesiveness Properties

The adhesive force and adhesiveness curve for the laver is shown in Figure 9a. The whole curve consists of two compressions, each of which consists of the probe compressing the sample and the probe returning. At the beginning of the downstroke, the probe compressed the sample, and the probe was simultaneously subjected to a reaction force from the compressed sample, which gradually increased as the probe continued to compress downwards. During the upstroke of the probe, the viscosity of the laver could impede the upward movement of the probe; the maximum negative force generated during the first compression of the sample by the probe upward was the adhesive force of the laver, depicted in Figure 9a as the absolute value of the stress against point A. The work performed by the sample to disengage from the probe during the first compression was the adhesiveness of the laver and is represented in Figure 9a as the area of the negative force B [49,50].
The effect of loading rate on the adhesive force and adhesiveness of the laver is shown in Figure 9b,c. The adhesive force and adhesiveness generally increased with increasing loading rate, and the mean values of adhesive force and adhesiveness at 50 mm/min were 0.32 N and 1.01 N·mm, respectively, and significantly greater than those at the remaining loading rates (p < 0.05). The effect of origin on the adhesive force and adhesiveness of the laver is depicted in Figure 9d,e. The adhesive force and adhesiveness of the D1 laver were 0.17 N and 0.82 N·mm, respectively, significantly higher than those of Q1 and L1 (p < 0.05), 3.76 and 4.65 times higher than those of the smallest Q1 laver at 0.04 N and 0.18 N·mm, respectively. The effect of harvest times on the adhesive force and adhesiveness of the laver is shown in Figure 9f,g. The adhesive force and adhesiveness of the L1 and L2 laver were significantly different from L3 (p < 0.05), largest at 0.16 N and 0.44 N·mm, respectively, while no significant difference was noted between L1 and L2 (p > 0.05). The adhesive force of the L3 laver increased by 92.33% and 48.42% compared to the L1 and L2 laver, respectively.
Therefore, the maximum mean values for the adhesive force of laver at different loading rates, origins and harvest times were 0.32 N, 0.17 N and 0.16 N, respectively, and the maximum mean values for adhesiveness were 1.01 N·mm, 0.82 N·mm and 0.44 N·mm, respectively.

3.3. The Relationship between Biological and Mechanical Properties

It can be inferred from Table 2 that the shear strength of laver of different origins was significantly negatively correlated with length (p < 0.05), the adhesive force was significantly negatively correlated with length, width, thickness and mass (p < 0.01), while adhesiveness was significantly positively correlated with length, width, thickness and mass (p < 0.01).
The laver at different harvest times showed significant positive correlations of width and mass (p < 0.05), significant positive correlations of thickness (p < 0.01), negative correlations of length-to-width ratio (p < 0.05) with tensile strength and negative correlations of width with shear strength (p < 0.05). There were negative correlations between adhesive force and width, thickness and mass (p < 0.01), and positive correlations with length-to-width ratio (p < 0.01). Significant positive (p < 0.05) correlations were detected between width, thickness and adhesiveness. Significant positive (p < 0.01) and negative (p < 0.05) correlations were found between mass, length-to-width ratio and adhesiveness, respectively. The correlation between the rest of the parameters did not remain insignificant (p > 0.05). Therefore, the biological properties of the laver exerted some influence over the mechanical properties between the different origins and harvest times.

4. Discussion

4.1. Effect of Harvest Time on Width, Thickness, Length-to-Width Ratio and Tensile Strength of Laver

In this study, there was a significant difference between the effect of harvest time on the width, thickness and length-to-width ratio of laver, with the width and thickness of laver increasing and the length-to-width ratio decreasing with harvest time. Studies in the literature [25,34,35,36,37] demonstrated that the thickness of the laver generally increased with the harvest time. A study by Song [32] showed that in three strains of Porphyra haitanensis, width increased, and the length-to-width ratio decreased with the number of harvests. The results of these studies are identical to the present study and may be due to the gradual aging of the laver thallus as the harvest time increases so that the width and thickness of the thallus increase and the length-to-width ratio decreases. The same changes and results were reported by Niwa for two laver (HG-4 and HG-5) thalli [31]. The results of Masuda et al. [33] on the width and thickness of laver thallus at different harvest times during the autumn seedling net and refrigerated net periods also proved that thallus width and thickness increased with increasing harvest time. Moreover, some plant leaves showed a trend of decreasing width and thickness and increasing length-to-width ratio with increasing harvest time [23,51], which may be related to the immediate surroundings of the plants. Morikawa and Mine [20] found that thalli and cell walls of laver thicken under conditions of high salinity and could potentially be related to the use of the cut harvesting method for laver [31].
The tensile strength of the laver is the maximum force per unit area of the laver required to resist fracture in tension, and it is an important mechanical parameter of the laver [52]. In this study, the tensile strength of laver increased with increasing harvest time, and the same results were yielded by Li when they studied the third bract of two corn species [51], probably because both laver and corn bract is in the form of striped leaves, and as the growth period increases, the tensile strength increases due to increasing amounts of fibers, yielding similar test results. Benvenutti et al. [53] showed that the neutral detergent fiber and acid detergent fiber content of five grass stems were positively correlated with tensile strength. Liu et al. [54] found that the tensile strength of hemp fibers harvested at the early flowering stage decreased with the delayed harvesting. This study resulted in the maturity stage chosen for harvesting hemp being at the early flowering stage, whereas the maturity stage chosen for harvesting laver in this study was at first, second and third harvests. Therefore, the inconsistent test results could arise from the fact that tensile strength is influenced by maturity stage and generally increases with maturity stage [55].

4.2. Effect of Origin on Length, Width, Thickness, Length-to-Width Ratio, Mass and Adhesive Force of Laver

In this study, there were significant differences in origin on the length, width, thickness, length-to-width ratio and mass of laver thallus. Zhang et al. [56] determined the morphological characteristics indexes of Phyllostachys edulis in Huoshan in Anhui province, Guanyang in Guangxi province and Anji in Zhejiang province of China and showcased numerous significant differences in the length, width and the length-to-width ratio of Phyllostachys edulis leaves in the three origins. Guo et al. [57] reported significant differences in the thickness of Camellia vietnamensis leaves in eight different origins, and Chang [58] reported significant differences in the leaf weights of Leymus chinensis in five origins, consistent with the results of this study, probably because the natural conditions in the different origins resulted in significantly different degrees of growth and development of crops such as laver and Phyllostachys edulis leaves [59]. Lee et al. [60] found that leaf length, width and stalk length of Ilex crenata varied according to disparities in growth environment factors. Lee et al. [61] reported that the fresh weight of onion bulbs was significantly affected by differences in growing origins. There was no significant difference in the length, width and length-to-width ratio of Nitraria tangutorum Bobr. Leaves [62], the single fruit mass of Ziziphus jujub [63] and the thickness of Armeniacaholosericea fruit [64] among different origins were studied. The results of these tests differ from those of this paper, probably because the differences in environmental conditions in the tested origins were not significantly different, resulting in insignificant changes in morphological characteristics indicators [65].
The adhesive force of the laver is the maximum force with which it can overcome its attraction to an object in contact [66,67,68,69]. In this study, there were extremely significant differences in the adhesive force of laver from different origins. The adhesive force of the D1 laver was the largest, followed by that of the L1 laver, and that of the Q1 laver was the smallest. Differences were found by Lou for the adhesive force of tobacco leaves from three cultivation origins, with the greatest adhesive force in Xuchang and slightly greater adhesive force in Bijie and Sanming [27]. The study is consistent with the results of the experiments conducted in this paper that concluded that origin affects adhesive force, probably because both tobacco leaves and laver are leaf-based agricultural materials, so the adhesive force of tobacco leaves and laver cultivated in different origins was affected by geographical environment and climatic conditions. Moreover, the results of this study may be related to the fact that the three origins of laver belong to three different latitudes (Dalian, Qingdao and Lianyungang) and have different seawater temperatures. Zhang et al. [28] studied the effect of temperature on the adhesive force of tobacco leaves of grades C3F and B2F in three origins, showing that the adhesive force tended to increase and then decrease with increasing temperature. Yu et al. [29] studied the adhesive force of flue-cured tobacco leaves cultivated in three close counties in Bijie City of China, and obtained insignificant differences, which were not consistent with this experiment, probably due to the fact that the three origins are located in close geographical proximity and have similar geographical and climatic conditions [70].

4.3. Effect of Loading Rate on Shear Strength and Adhesiveness of Laver

The shear strength of the laver is the maximum force per unit area of the laver required to resist shearing during the shearing process, and it is also an important mechanical parameter of the laver. In this study, the results of the laver shear test showed that the shear strength of the laver generally tended to decrease with increasing loading rate. Heidari and Chegini [71] tested the shear strength of rose flower stems and found that the shear strength decreased with increasing loading rate. The findings of this study are consistent with the results of the present study, probably because both laver and rose flower stems are biomaterials that are inherently viscoelastic. The laver and rose flower stems were compressed at low cutting rates while resisting shearing by the knife. However, at high cutting rates, the elastic walls of the cells did not have enough time to transmit shear forces to the viscous fluid inside the cells, resulting in a decrease in shear strength [42,43]. The same findings were also reported by Hassan-Beygi for the shear strength of saffron stalks [41]. Tavakoli et al. [72] and Kamandar et al. [73] studied the effect of loading rate on the shear strength of barley straw and privet stem, which increased with increasing loading rate. The results of this test are contrary to the results of this study and it may be that as the shear rate increases, the shortening of extrusion deformation distance of two stalks before cutting leads to a reduction in the required cutting force. In a study of the effect of average cutting speed on the maximum cutting force per unit diameter of cotton stalk, the same conclusion was obtained by Song et al. [74].
The adhesiveness of laver is the work done by laver to detach from the object it is in contact with [66,67,68,69]. In this study, the adhesiveness of the laver showed an overall increasing trend with loading rate. Wang et al. [75] studied the effect of test speed on the adhesiveness of noodles and also concluded that adhesiveness generally tended to increase with loading rate; the results are consistent with the trend in this study, which may be because when the probe is detached from the sample, it exerts a pull on the laver and noodles, and as the loading rate increases, it still requires a large amount of energy to separate the probe from the sample; hence, the adhesiveness increases. Li et al. [76] showed that the adhesiveness of peach pulp was positively correlated with the rate of compression. Xu et al. [77] studied the effect of different test rates on the adhesiveness of set yogurt, and the adhesiveness generally decreased as the test speed increased. The difference with the test results of this study may be because laver and set yogurt are substances that exist in different states and that as the test rate increases, the time of interaction with set yogurt decreases during the rise of the probe and the corresponding negative area on the texture curve decreases, thus reducing the adhesiveness. The same conclusion was reported by Wang et al. [78] and Lang et al. [79].

4.4. The Correlation between Thickness and Tensile Strength of Laver

In this study, the results of the correlation between the biological and mechanical properties of laver at different harvest times showed a positive correlation between laver thickness and tensile strength. Chen [40] reported that the thickness and tensile strength of kelp were also positively correlated, which was consistent with the results of this paper. The reason may be that laver was composed of single-layer cells [18], and as the size of the cells increases, the thickness of the algal body increases correspondingly. The ability to resist external loads becomes stronger, while kelp endothelial cells also become more resistant to external forces as their number increases [40]. Guo et al. [80] tested eight groups of polyester films of different thicknesses, and the results showed that the tensile strength of the films was proportional to the thickness. The same conclusion was reached as the thickness of the films was close to that of the laver, and both were flexible. Li et al. [51] reported no significant effect of the thickness of the two corn bracts on tensile strength under the same harvest period, which is inconsistent with the results of this experiment, probably because the smaller range of variation in moisture content of the samples led to smaller variation in tensile strength as well [81].

5. Conclusions

The biomechanical properties of the laver were investigated through morphological and mechanical tests. The main conclusions are as follows:
(1)
The length, width, thickness and mass of D1 laver were greater than the other two origins. The width, thickness and mass of laver increased and the length-to-width ratio decreased with increasing harvest time. The thickness and tensile strength at different harvest times were positively correlated, and the length and shear strength at different origins were negatively correlated.
(2)
The tensile and shear strengths of the laver decreased, and adhesive force and adhesiveness showed the opposite rule with increasing loading rate. The tensile and shear strengths of the Q1 laver and the adhesive force and adhesiveness of the D1 laver were greater than the other two origins. The harvest time was positively proportional to tensile strength, adhesive force and adhesiveness and inversely proportional to shear strength.
(3)
It is recommended that the tensile strength of the D1 (3.56 MPa) and the shear strength of the Q1 (4.79 MPa) laver should be used to design a harvesting knife, since those maximum strengths can be compatible with other strengths. The adhesive force and adhesiveness of the D1 (0.32 N,1.01 N·mm) laver are recommended for the design of transportation parts, which could be designed to reduce the contact force and power consumption.

Author Contributions

Conceptualization, G.M., W.L., J.T. and Y.Z.; methodology, G.M., W.L., J.T., S.N. and Q.Z.; investigation, G.M., W.L., J.T., S.N. and H.Z.; writing—original draft preparation, W.L.; writing—review and editing, G.M., X.L. and W.L.; supervision, G.Z. and G.M.; funding acquisition, X.L. and G.M. All authors have read and agreed to the published version of the manuscript.

Funding

This research was funded by the National Key R&D Program of China, grant number 2019YFD0900701, the Natural Science Foundation of Liaoning Province, grant number 2020-BS-214 and the Scientific Research Project of Department of Education of Liaoning Province, grant number QL202010.

Institutional Review Board Statement

Not applicable.

Informed Consent Statement

Not applicable.

Data Availability Statement

Not applicable.

Acknowledgments

The authors would like to thank Meng Li and Yongheng Ma from the School of Food Science and Engineering, Dalian Ocean University, for providing equipment and technical support during the experiment. We are also grateful to our other colleagues such as Cheng Zhao, Yurui Wang, Guojie Wang and Zhenyin Sun in the lab for their help during the experiment.

Conflicts of Interest

The authors declare no conflict of interest.

References

  1. Cho, T.J.; Rhee, M.S. Health functionality and quality control of laver (Porphyra, Pyropia): Current issues and future perspectives as an edible seaweed. Mar. Drugs 2020, 18, 14. [Google Scholar] [CrossRef] [Green Version]
  2. Blouin, N.A.; Brodie, J.A.; Grossman, A.C.; Xu, P.; Brawley, S.H. Porphyra: A marine crop shaped by stress. Trends Plant Sci. 2011, 16, 29–37. [Google Scholar] [CrossRef]
  3. Xu, P.; Zhang, X.C.; Wang, S.J.; Zhu, J.Y. Reproduction and Development of Major Economic Marine Algae in China, 1st ed.; China Agriculture Press: Beijing, China, 2013; pp. 101–104. [Google Scholar]
  4. Tian, Y.; Jiang, Y.H.; Guo, Y.Y.; Zhao, Y.F.; Li, N.; Yao, L.; Yin, D.F.; Wang, L.Z. Research progress on nutritional quality and edible value of Porphyra. J. Food Saf. Qual. 2021, 12, 4929–4936. [Google Scholar]
  5. FAO. The State of World Fisheries and Aquaculture 2020. Sustainability in Action; FAO: Rome, Italy, 2020; pp. 31–32. [Google Scholar]
  6. Wang, Y.D. Study on Half-floating Cultivation Laver Harvester & Cold Storage Technology. Master’s Thesis, Shanghai Ocean University, Shanghai, China, 2003. [Google Scholar]
  7. Kim, B.J.; Kim, S.C.; Cho, B.H.; Shin, K.J. Development of automatic harvesting and acidic processing system for under water laver cultivation. Int. J. Curr. Res. 2017, 9, 55659–55664. [Google Scholar]
  8. Nakashio, H. Laver Harvester. J.P. Patent 20,060,000,88A, 5 January 2006. [Google Scholar]
  9. Jo, W. Get Wet Laver Collecting Apparatus. K.R. Patent 20,048,767,5Y1, 19 October 2018. [Google Scholar]
  10. Yada, S.; Chen, J.K.; Toda, M. Analysis of cutting mechanism of the roll type nori harvester. La mer 1996, 34, 25–32. [Google Scholar]
  11. Takenaka, K. Pump for laver transportation. Turbomachinery 2005, 33, 435–438. [Google Scholar]
  12. Jiang, K.S.; Gyu, L.S.; Gu, Y.S.; Hyun, C.B.; Kyoung, P. Laver Automatic Conveying Device. K.R. Patent 201,901,419,70A, 26 December 2019. [Google Scholar]
  13. Jongsik, P.; Kyungja, Y. Laver Transferring Apparatus. K.R. Patent 200,900,066,25U, 1 July 2009. [Google Scholar]
  14. Agriculture and Rural Fisheries Administration. China Fishery Statistical Yearbook; Agriculture Press: Beijing, China, 2021; pp. 1–158. [Google Scholar]
  15. Mu, G.; Tang, J.H.; Li, X.C.; Lu, W.; Zhang, H.B.; Zhang, G.C.; Zhang, Q.; Yang, J.Y.; Li, Y.Q.; Song, Q. Laver Cuts Ship. C.N. Patent 1,115,127,75A, 11 August 2020. [Google Scholar]
  16. Mu, G.; Tang, J.H.; Lu, W.; Zhai, Y.L.; Zhang, H.B.; Chen, Z.; Chang, H.; Song, Q.; Yang, J.Y.; Li, Y.Q.; et al. Laver Cut Device. C.N. Patent 2,125,735,71U, 23 February 2021. [Google Scholar]
  17. He, P.M.; Zhang, Z.Y.; Zhang, X.C.; Ma, J.H. Seaweed Cultivation, 1st ed.; Science Press: Beijing, China, 2018; pp. 174–228. [Google Scholar]
  18. Zhu, J.Y.; Yan, X.H.; Ding, L.P.; Zhang, X.C.; Lu, Q.Q.; Xu, P. Color Atlas of Chinese Laver, 1st ed.; China Agriculture Press: Beijing, China, 2016; pp. 52–131. [Google Scholar]
  19. Zhang, X.; Wang, H.; Fang, E.J.; Gao, Y.; Guo, B.; Liu, K.F.; Xu, X.F.; Chen, W. A Preliminary study on the cultivation of Porphyra yezoensis in Bohai bay. Trans. Oceanol. Limnol. 2019, 147–152. [Google Scholar]
  20. Morikawa, T.; Mine, T. The effect of salinity on the thallus thickness of Pyropia yezoensis. Bull. Saga Prefectural Ariake Fish.Res. Deve. Cent. 2017, 28, 1–3. [Google Scholar]
  21. Levine, I.A.; Sahoo, D. Porphyra: Harvesting Gold from the Sea, 1st ed.; IK International Pvt Ltd.: Bangalore, India, 2010; pp. 1–92. [Google Scholar]
  22. Yada, S.; Chen, J.K.; Toda, M. A study on cutting mechanism of the suction type nori harvester. La mer 1995, 33, 177–184. [Google Scholar]
  23. Shimada, Y. Physiological and morphological characters of the three wild strains of Porphyra yezoensis collected from Hokkaido. Aquac. Sci. 2010, 58, 473–479. [Google Scholar]
  24. Kim, J.B.; Lee, W.C.; Kim, H.C.; Choi, H.G.; Park, J.I.; Cho, Y.; Park, H.H. Photosynthetic characteristics of Porphyra yezoensis Ueda measured in situ by Diving Pulse-Amplitude Modulated (PAM) fluorometry on the southwestern coast of the Korean peninsula. Korean J. Environ. Biol. 2012, 30, 210–218. [Google Scholar]
  25. Zhang, Y.Y.; Yan, X.H. India-endemic Pyropia radi (Bangiales, Rhodophyta): Biology and life history. Ooceanol. Limnol. Sin. 2014, 45, 52–59. [Google Scholar]
  26. Diao, H.M. Study on the Basic Properties of Wheat Straw from Different Areas. Master’s Thesis, Nanjing Agricultural University, Jiangsu, China, 2014. [Google Scholar]
  27. Lou, Y.F.; Yang, Y.B.; Ou, M.Y.; Zhang, Y.H.; Zhang, L.Y.; Pan, J.M.; Zhang, Y.H. Analysis of mechanical and threshing properties about main flue-cured tobacco varieties in partial areas. Guizhou Agric. Sci. 2019, 47, 131–134. [Google Scholar]
  28. Zhang, Y.H.; Wu, Z.W.; Du, Y.G.; Liu, Z.Y.; Wei, H.Q.; Xi, N.S.; Jia, T.; Deng, G.D. Factors influencing adhesive force and ordering efficiency of tobacco leaves. Tob. Sci. Technol. 2014, 17–19. [Google Scholar]
  29. Yu, Q.W.; Du, J.S.; Chen, X.; Liang, W.; Shen, Y.J.; Du, Y.G.; Zhang, Y.H.; Zhang, Y.J. Analysis on mechanical properties of three flue-cured tobacco cultivars in Bijie tobacco growing area. Hunan Agric. Sci. 2018, 78–80+84. [Google Scholar]
  30. Wang, Y.J.; Ying, M.M.; Zhou, Q.H.; Xu, C.L.; Quan, W. Comparison on growth parameters and sequestration efficiency of carbon, nitrogen and phosphorus between two strains of Pyropia haitanensis. J. Shanghai Ocean Univ. 2019, 28, 535–541. [Google Scholar]
  31. Niwa, K.; Furuita, H.; Yamamoto, T. Changes of growth characteristics and free amino acid content of cultivated Porphyra yezoensis Ueda (Bangiales Rhodophyta) blades with the progression of the number of harvests in a nori farm. J. Appl. Phycol. 2008, 20, 687–693. [Google Scholar] [CrossRef]
  32. Song, W.L. Study on hightemperature-resisitance of the new varieties “Shenfu No.1” and “Shenfu No.2” of Porphyra haitanensis by cultivation at sea area. J. Shanghai Ocean Univ. 2016, 25, 522–527. [Google Scholar]
  33. Masuda, Y.; Yamada, H.; Yokoo, K.; Kawamura, Y. Changes of the water content rate and the thickness of cell wall in nori thalli on every harvest. Bull. Saga Prefectural Ariake Fish. Res. Dev. Cent. 2014, 27, 55–59. [Google Scholar]
  34. Chen, C.S.; Liang, Y.; Xu, Y.; Xie, C.T.; Ji, D.H.; Wang, P.H.; Shi, X.Z.; Zhao, L.M. Selective breeding and comparison of economic traits of the new thin-thallus strain Porphyra haitanensis. Prog. Fish. Sci. 2009, 30, 100–105. [Google Scholar]
  35. Li, P.Q.; Liu, W.C.; Zhang, P.; Deng, H.Q. Sea area test of Porphyra haitanensis refrigeration Net. J. Zhejiang Agric. Sci. 2019, 60, 796–800. [Google Scholar]
  36. Kamuwara, T. History and processing of traditional food nori. Jpn. J. Phycol. 2004, 52, 89–92. [Google Scholar]
  37. Zhang, M.R.; Lu, Q.Q.; Chen, S.Y.; Hu, C.M.; Zhou, W.; Jiang, H.X.; Zhu, M.X. Study on e-valuation methods of Porphyra yezoensis. Fish. Sci. Technol. Inf. 2011, 38, 273–283. [Google Scholar]
  38. O’Dogherty, M.J.; Huber, J.A.; Dyson, J.; Marshall, C.J. A study of the physical and mechanical properties of wheat straw. J. Agric. Eng. Res. 1995, 62, 133–142. [Google Scholar] [CrossRef]
  39. Sun, L.X.; Sun, H.; Wang, Y.N.; Zhang, J.D.; Huang, M. The study on bolt quality of rape for oilseed-vegetable-dual-purpose in different picking periods. Qual. Saf. Agro Prod. 2021, 74–79. [Google Scholar]
  40. Chen, T.C. Study on Mechanical Properties of Kelp and Design of Mechanisms for Knotting Kelp. Master’s Thesis, Southeast University, Nanjing, China, 2018. [Google Scholar]
  41. Hassan-Beygi, S.R.; Ghozhdi, H.V.; Khazaei, J. Picking force of saffron flower and shear strength of saffron stalk. Electron. J. Pol. Agric. Univ. 2010, 13, 1–11. [Google Scholar]
  42. Chattopadhyay, P.S.; Pandey, K.P. Mechanical properties of sorghum stalk in relation to quasi-static deformation. J. Agric. Eng. Res. 1999, 73, 199–206. [Google Scholar] [CrossRef]
  43. Heidari, A.; Chegini, G.; Kianmehr, M.H.; Hassan-Beygi, S.R.; Khazaei, J. Influence of knife bevel angle, rate of loading and stalk section on some engineering parameters of lilium stalk. Iran. J. Energy Environ. 2012, 3, 333–340. [Google Scholar] [CrossRef]
  44. Ding, H.C.; Lv, F.; Wu, H.X.; Yan, X.H. Selection and characterization of an improved strain produced by inter-species hybridization between Pyropia sp. from India and Pyropia haitanensis from China. Aquaculture 2018, 491, 177–183. [Google Scholar] [CrossRef]
  45. Mandang, T.; Sinambela, R.; Pandianuraga, N. Physical and mechanical characteristics of oil palm leaf and fruits bunch stalks for bio-mulching. Earth Environ. Sci. IOP Conf. Ser. 2018, 196, 012015. [Google Scholar] [CrossRef]
  46. Ma, Y.H. Agricultural Material Science, 1st ed.; Chemical Industry Press: Beijing, China, 2015; pp. 35–41. [Google Scholar]
  47. Li, L.; Deng, G.R.; Li, G.J.; Zheng, S.; Cui, Z.D. Test and analysis on shearing mechanical properties of fibrous roots of galangal. J. Chin. Agric. Mech. 2020, 41, 116–120. [Google Scholar]
  48. Liu, J.M.; Zhao, D.; Zhao, J. Study of the cutting mechanism of oil tree peony stem. Forests 2020, 11, 760. [Google Scholar] [CrossRef]
  49. Jiang, S.; Wang, H.O. TPA and effect of experimental conditions on TPA test apples slices. Food Sci. 2004, 25, 68–71. [Google Scholar]
  50. Razavi, S.M.; Karazhiyan, H. Rheological and textural characteristics of date paste. Int J. Food Prop. 2012, 15, 281–291. [Google Scholar] [CrossRef]
  51. Li, Z.Y.; Fu, J.; Luo, X.W. Tensile properties and fracture mechanisms of corn bract for corn peeling device design. Agriculture 2021, 11, 796. [Google Scholar] [CrossRef]
  52. Mu, G. Research on Mechanical Properties Tests of Clam and Key Issues of Dredge Machinery. Ph.D. Thesis, Dalian University of Technology, Dalian, China, 2019. [Google Scholar]
  53. Benvenutti, M.A.; Gordon, I.J.; Poppi, D.P.; Crowther, R.; Spinks, W.; Moreno, F.C. The horizontal barrier effect of stems on the foraging behaviour of cattle grazing five tropical grasses. Livest. Sci. 2009, 126, 229–238. [Google Scholar] [CrossRef]
  54. Liu, M.; Fernando, D.; Daniel, G.; Madsen, B.; Meyer, A.S.; Ale, M.T.; Thygesen, A. Effect of harvest time and field retting duration on the chemical composition, morphology and mechanical properties of hemp fibers. Ind. Crop. Prod. 2015, 69, 29–39. [Google Scholar] [CrossRef]
  55. Jacobs, A.A.A.; Scheper, J.A.; Benvenutti, M.A.; Gordon, I.J.; Poppi, D.P.; Elgersma, A. Tensile fracture properties of seven tropical grasses at different phenological stages. Grass Forage Sci. 2011, 66, 551–559. [Google Scholar] [CrossRef]
  56. Zhang, W.B.; Fei, B.H.; Tian, G.L.; Yue, X.H.; Jiang, Z.H. Comparative study on growth and Phenotypic traits of phyllostachys edulis in different areas. J. Northeast For. Univ. 2019, 47, 1–5. [Google Scholar]
  57. Guo, Y.J.; Wang, P.X.; Zhou, K.B.; Chen, J. Effects of producing regions on the cultivation traits differences of Camellia vietnamensis in Hainan Province. J. For. Environ. 2019, 39, 431–437. [Google Scholar]
  58. Chang, C. Comprehensive Evaluation and Distribution Pattern of Agronomic Characters and Quality of Leymus Chinensis Germplasm Resources. Ph.D. Thesis, Inner Mongolia Agricultural University, Hohhot, China, 2020. [Google Scholar]
  59. Eideh, R.A.; Elkarmi, A. Allometric relationships of malva parviflora growing in two different bioclimatic regions. J. Plant Biol. 2005, 48, 319–325. [Google Scholar] [CrossRef]
  60. Lee, D.G.; Kim, Y.S.; Shin, H.T.; Kang, S.K.; Park, S.G. Ilex crenata for. microphylla Rehder’s leaf variations according to different altitudes of east-west slopes of Hallasan. J. Korean Inst. For. Recreat. 2012, 16, 9–14. [Google Scholar]
  61. Lee, J.; Ha, I.; Kim, H.; Choi, S.; Lee, S.; Kang, J.; Boyhan, G.E. Regional differences in onion bulb quality and nutrient content, and the correlation between bulb characteristics and storage loss. Hortic. Sci. Technol. 2016, 34, 807–817. [Google Scholar]
  62. Bai, X.; Li, Y.; Su, S.P.; Zhao, X.X. Response of leaf anatomical characteristics of Nitraria tangutorum bobr. from different populations to habitats. Acta Bot. Boreal. Occident. Sin. 2013, 33, 1986–1993. [Google Scholar]
  63. Ma, Q.H.; Xu, J.R.; Wang, G.X.; Yao, L.X.; Li, Y.Y. Studies on the fruit quality and AFLP markers of Ziziphus jujuba cv. dongzao from Hebei and Shandong province. For. Res. 2009, 22, 48–54. [Google Scholar]
  64. Wu, Y.D.; Liu, H.F.; Guan, F.C.; Zong, X.C.; Lu, X.; Cai, C.P.; Sang, L.Q. Study on variation of phenotypic character of Armeniacaholosericea fruits. J. Southwest Minzu Univ. 2019, 45, 254–258. [Google Scholar]
  65. Yang, H.Q.; Zhou, J.H.; Li, Y.P.; Ma, W.G.; Yang, C.; Duan, F.Y.; Hu, J.J. Analysis of physical characteristics of tobacco leaves from different cultivars and different production areas in Yunnan. Acta Tab. Sin. 2008, 14, 30–36. [Google Scholar]
  66. Adawiyah, D.R.; Sasaki, T.; Kohyama, K. Characterization of arenga starch in comparison with sago starch. Carbohydr. Polym. 2013, 92, 2306–2313. [Google Scholar] [CrossRef]
  67. Bourne, M.C.; Kenny, J.F.; Barnard, J. Computer-assisted readout of data from texture profile analysis curves 1. J. Texture Stud. 1978, 9, 481–494. [Google Scholar] [CrossRef]
  68. Bourne, M.C.; Comstock, S.H. Effect of degree of compression on texture profile parameters. J. Texture Stud. 1981, 12, 201–216. [Google Scholar] [CrossRef]
  69. Zong, X.X.; Yan, Q.Q.; Li, Z.G.; Wang, L.; Li, L.Y.; Bian, Y.F.; Liu, H. Effect of different casein on quality of block processed cheese. Food Res. Dev. 2019, 40, 63–67. [Google Scholar]
  70. Xu, B.; Jiang, H.Y.; Fan, M.D.; Chen, Y.Q.; Wang, R.L.; Du, J.S.; Zhang, Y.H. Threshing and redrying technology based on typical mechanical characteristics of tobacco leaves of cv. “CB-1. Tob. Sci. Technol. 2020, 53, 80–86+106. [Google Scholar]
  71. Heidari, A.; Chegini, G.R. Determining the shear strength and picking force of rose flower. Electron. J. Pol. Agric. Univ. 2011, 14, 13. [Google Scholar]
  72. Tavakoli, H.; Mohtasebi, S.S.; Jafari, A. Effect of moisture content and loading rate on the shearing characteristics of barley straw by internode position. Agric. Eng. Int. CIGR J. 2009, 11, 1176–1186. [Google Scholar]
  73. Kamandar, M.R.; Massah, J.; Khanali, M. Quasi-static and impact cutting behavior definition of privet stem. Agric. Eng. Int. CIGR J. 2018, 20, 70–80. [Google Scholar]
  74. Song, Z.H.; Song, H.L.; Geng, A.J.; Li, Y.D.; Yan, Y.F.; Li, F.D. Experiment on cutting characteristics of cotton stalk with double supports. Trans. Chin. Soc. Agric. Eng. 2015, 31, 37–45. [Google Scholar]
  75. Wang, X.B.; Guo, X.F.; Lou, W.N. Effect of test conditions on the texture properties of noodles. J. Henan Univ. Technol. 2009, 30, 14–17. [Google Scholar]
  76. Li, Y.H.; Chan, R.F.; Zhang, L.S.; Wang, Z.Y.; Chen, H.; Han, J.C.; Liu, G.J. The optimization of texture determination of fresh peach by using texture analyzer TPA. J. Hebei Agric. Sci. 2016, 20, 95–100. [Google Scholar]
  77. Xu, X.; He, J.Y.; Xu, G.X.; Liu, G.Y.; He, J.F. Effects of test conditions on measured texture parameters of set yogurt. Food Sci. 2013, 34, 263–267. [Google Scholar]
  78. Wang, X.B.; Guo, X.F.; Hao, L.P. Influences of testing conditions on texture property measurement results of cooked rice. J. Henan Univ. Technol. 2013, 34, 40–43. [Google Scholar]
  79. Lang, K.H.; Zhou, X.Q.; Zhang, Y.R. Effect of test conditions on the gel properties of rice. Cereal Feed. Ind. 2012, 1–4. [Google Scholar]
  80. Guo, F.; Li, Y.Y.; Zhang, S.B. Demonstration of mechanical properties of polyester films with different thickness. Shanghai Plast. 2018, 1–5. [Google Scholar]
  81. Zhang, B.; Shi, J.A.; Guo, H.L.; Zong, J.Q.; Liu, J.X. Influence of leaf age, irrigation and fertilization on leaf tensile strength of Cynodon dactylon and Zoysia japonica. Grassl. Sci. 2018, 64, 91–99. [Google Scholar] [CrossRef]
Figure 1. The force when roll-type knife cuts laver thalli [10]. P—roll center, O—origin of coordinates, ω—angle velocity, v—advance velocity, θ—cutting angle of revolution, θr—scattering angle of laver thalli, X—advance direction of roll-type knife, Y—dangling direction of laver thalli, Tr—elasticity resistance force of laver thalli, T—resistance when roll-type knife acts on laver thalli, N—cutting force of roll-type knife, Nx—horizontal component force of N, Ny—vertical component force of N, G—weight of laver thalli.
Agriengineering 04 00004 g001
Figure 2. Cultural origins of laver.
Agriengineering 04 00004 g002
Figure 3. Samples used in tensile and shear experiments.
Agriengineering 04 00004 g003
Figure 4. Clamp for the shear test.
Agriengineering 04 00004 g004
Figure 5. Biological properties of laver from different origins: (a) the effect of origin on length and width of laver; (b) the effect of origin on the thickness and length-to-width ratio of laver; (c) the effect of origin on the mass of laver. The different uppercase and lowercase letters indicate a significant difference between groups (p < 0.05), while same uppercase and lowercase letters indicate no significant difference between groups (p > 0.05).
Agriengineering 04 00004 g005
Figure 6. Biological properties of laver from different harvest times: (a) the effect of harvest time on length and width of laver; (b) the effect of harvest time on the thickness and length-to-width ratio of laver; (c) the effect of harvest time on the mass of laver. The different uppercase and lowercase letters indicate a significant difference between groups (p < 0.05), while same uppercase and lowercase letters indicate no significant difference between groups (p > 0.05).
Agriengineering 04 00004 g006
Figure 7. Tensile properties of laver: (a) the load–displacement curve of the tensile test of laver; (b) the effect of loading rate on tensile strength; (c) the effect of origin on tensile strength; (d) the effect of harvest time on tensile strength. The different lowercase letters indicate a significant difference between groups (p < 0.05), while same lowercase letters indicate no significant difference between groups (p > 0.05).
Agriengineering 04 00004 g007
Figure 8. Shear properties of laver: (a) the load–displacement curve of the shear test of laver; (b) the effect of loading rate on shear strength; (c) the effect of origin on shear strength; (d) the effect of harvest time on shear strength. The different lowercase letters indicate a significant difference between groups (p < 0.05), while same lowercase letters indicate no significant difference between groups (p > 0.05).
Agriengineering 04 00004 g008
Figure 9. Adhesive force and adhesiveness properties of laver: (a) the load–displacement curve of the adhesive force and adhesiveness of laver; (b) the effect of loading rate on adhesive force; (c) the effect of loading rate on adhesiveness; (d) the effect of origin on adhesive force; (e) the effect of origin on adhesiveness; (f) the effect of harvest time on adhesive force; (g) the effect of harvest time on adhesiveness. The different lowercase letters indicate a significant difference between groups (p < 0.05), while same lowercase letters indicate no significant difference between groups (p > 0.05).
Agriengineering 04 00004 g009aAgriengineering 04 00004 g009b
Table 1. Factors and levels of mechanical properties experiments.
Experiment No.Fixed VariablesIndependent VariablesDependent Variables
FactorsLevelsFactorsLevels
10 mm/min
OriginD 20 mm/min
1Harvest time1Loading rate30 mm/min
40 mm/minTensile strength
50 mm/minShear strength
Loading rate20 mm/min DAdhesive force
Adhesiveness
2Harvest time1OriginQ
L
OriginL 1
3Loading rate20 mm/minHarvest time2
3
Table 2. Correlation coefficients between biological and mechanical properties.
FactorsVariablesTensile Strength
(MPa)
Shear Strength
(MPa)
Adhesive Force
(N)
Adhesiveness
(N·mm)
OriginLength (mm)−0.145−0.218 *−0.291 **0.415 **
Width (mm)−0.053−0.182−0.359 **0.462 **
Thickness (mm)−0.109−0.148−0.400 **0.596 **
Mass (g)−0.128−0.184−0.381 **0.546 **
Length-to-width ratio−0.058−0.0400.098−0.075
Harvest timeLength (mm)−0.108−0.0020.081−0.076
Width (mm)0.246 *−0.221 *−0.292 **0.248 *
Thickness (mm)0.333 **−0.161−0.273 **0.236 *
Mass (g)0.217 *−0.135−0.386 **0.294 **
Length-to-width ratio−0.258 *0.1090.278 **−0.209 *
* Represents significant correlation, p < 0.05, ** represents extremely significant correlation, p < 0.01.
Publisher’s Note: MDPI stays neutral with regard to jurisdictional claims in published maps and institutional affiliations.

