2.2.1. The Model DAF Sludge Lipid, Carbohydrate and Protein Employed in the Simulation Study
DAF sludge has been assumed to be composed of several triglycerides (TGs) due to the presence of different fatty acid molecules in its mixture as presented in
Table 1. It is therefore necessary to develop a model DAF sludge lipid (DSL) molecule that will enable the approximation of the properties of the DSL. To develop the molecular formula of a model DSL, the fatty acid distribution of the DSL that is presented in
Table 1 was utilized. The molecular formula of the model DSL was determined by employing Espinosa’s method [
13]. Espinosa’s method considers the contribution of the experimentally determined moles of the fatty acids present (in mole fractions) in the DSL extract in providing a ‘condensed’ molecular formula for the model DSL molecule [
13], as follows,
where [
13],
In Equations (2) and (3),
xi represents the mole fraction of the fatty acid
i in DSL,
mi and
ni represent the number of CH=CH and CH
2 functional groups present in the parent TGs of the fatty acids. The mole distributions of the parent TGs are assumed to be similar to the mole distributions of their respective fatty acids, as presented in
Table 1.
Having estimated the condensed molecular formula of the model DSL molecule, it is important to estimate crucial thermophysical properties of the model DSL that will serve as inputs to the simulation software for property abstraction and predictions using in-built correlations in ASPEN plus via the pseudo-component designation in ASPEN plus. A similar methodology was employed in [
14]. These crucial thermophysical properties of the model DSL include its vapour pressure equilibrium relation with temperature, boiling temperature at 1 atm, and molar density-temperature relation. To estimate the aforementioned properties of the model DSL, several aggregation techniques have been reported in the literature. One of such methods is the weighted average approach that considers the properties of a lipid mixture as a weighted average of the properties of the component lipids in the mixture [
15]. Another important approach utilised in estimating the properties of a mixture of lipids is the group contribution method [
15]. The group contribution method is similar to the weighted average approach with the major difference being that the contribution of the functional groups rather than the mass fractions of the individual lipids are considered [
15]. Recent studies have however shown that for improved accuracy it may be more appropriate to estimate some thermophysical properties of lipid mixtures, such as boiling temperature, density, and vapour pressure while using the chemical constituent fragment (CCF) approach [
12]. This is because although the weighted average and group contribution methods cannot be considered to be erroneous, the CCF method has been shown to provide more accurate results when estimating some crucial thermophysical properties of TGs [
11,
12]. The CCF approach will enable the provision of accurate estimates which will form the basis for an optimal level of parameter abstraction for thermodynamic property estimation in simulation studies [
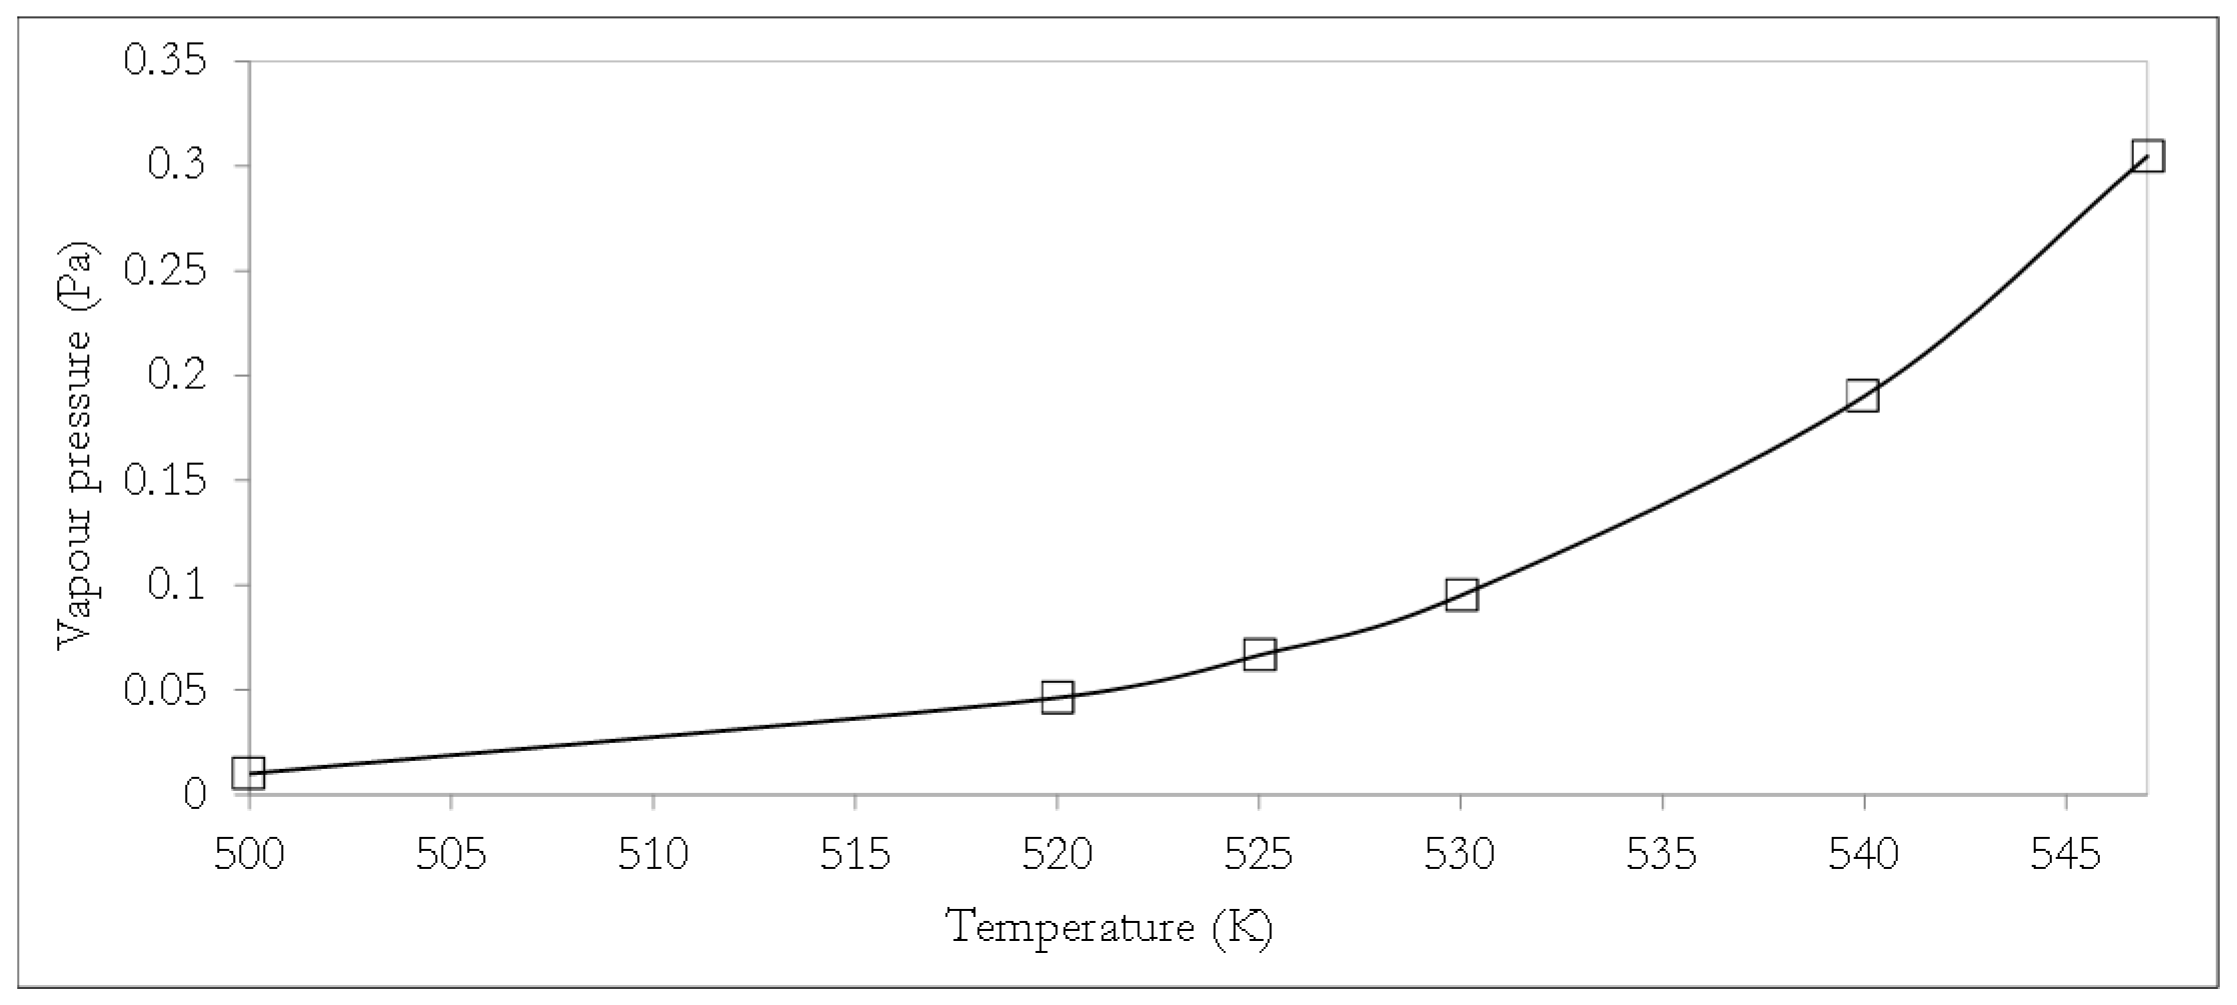
12]. In the CCF approach, the model DSL molecule is considered as being composed of a backbone glycerol fragment plus three fatty acid fragments, such that the attributes of each fragment (specific to a particular thermophysical property) can be combined via established model relations as a basis for thermophysical property estimations. From the condensed model DSL molecular formula (Equation (1)), the model DSL can be characterised by three major fatty acid fragments, which together with the glycerol backbone will enable the estimation of crucial thermophysical properties of the model DSL using CCF methods. In this study, the vapour pressure, boiling temperature, and density of the model DSL molecule were estimated using CCF. The temperature dependence of the vapour pressure of the model DSL was estimated using the Perry’s relationship [
16], with the constant parameters
A and
B calculated as 15.2493 and 8623.732, respectively [
12],
where
pDST is the vapour pressure of the model DSL in Pa and
T represents temperature in K.
The vapour pressure of the model DSL is expected to be very low given that lipids typically exhibit a negligible vapour pressure with lipids, such as tristearin and triolein, presenting vapour pressures as low as 7.2 × 10
−15 Pa and 1.5 × 10
−7 Pa respectively [
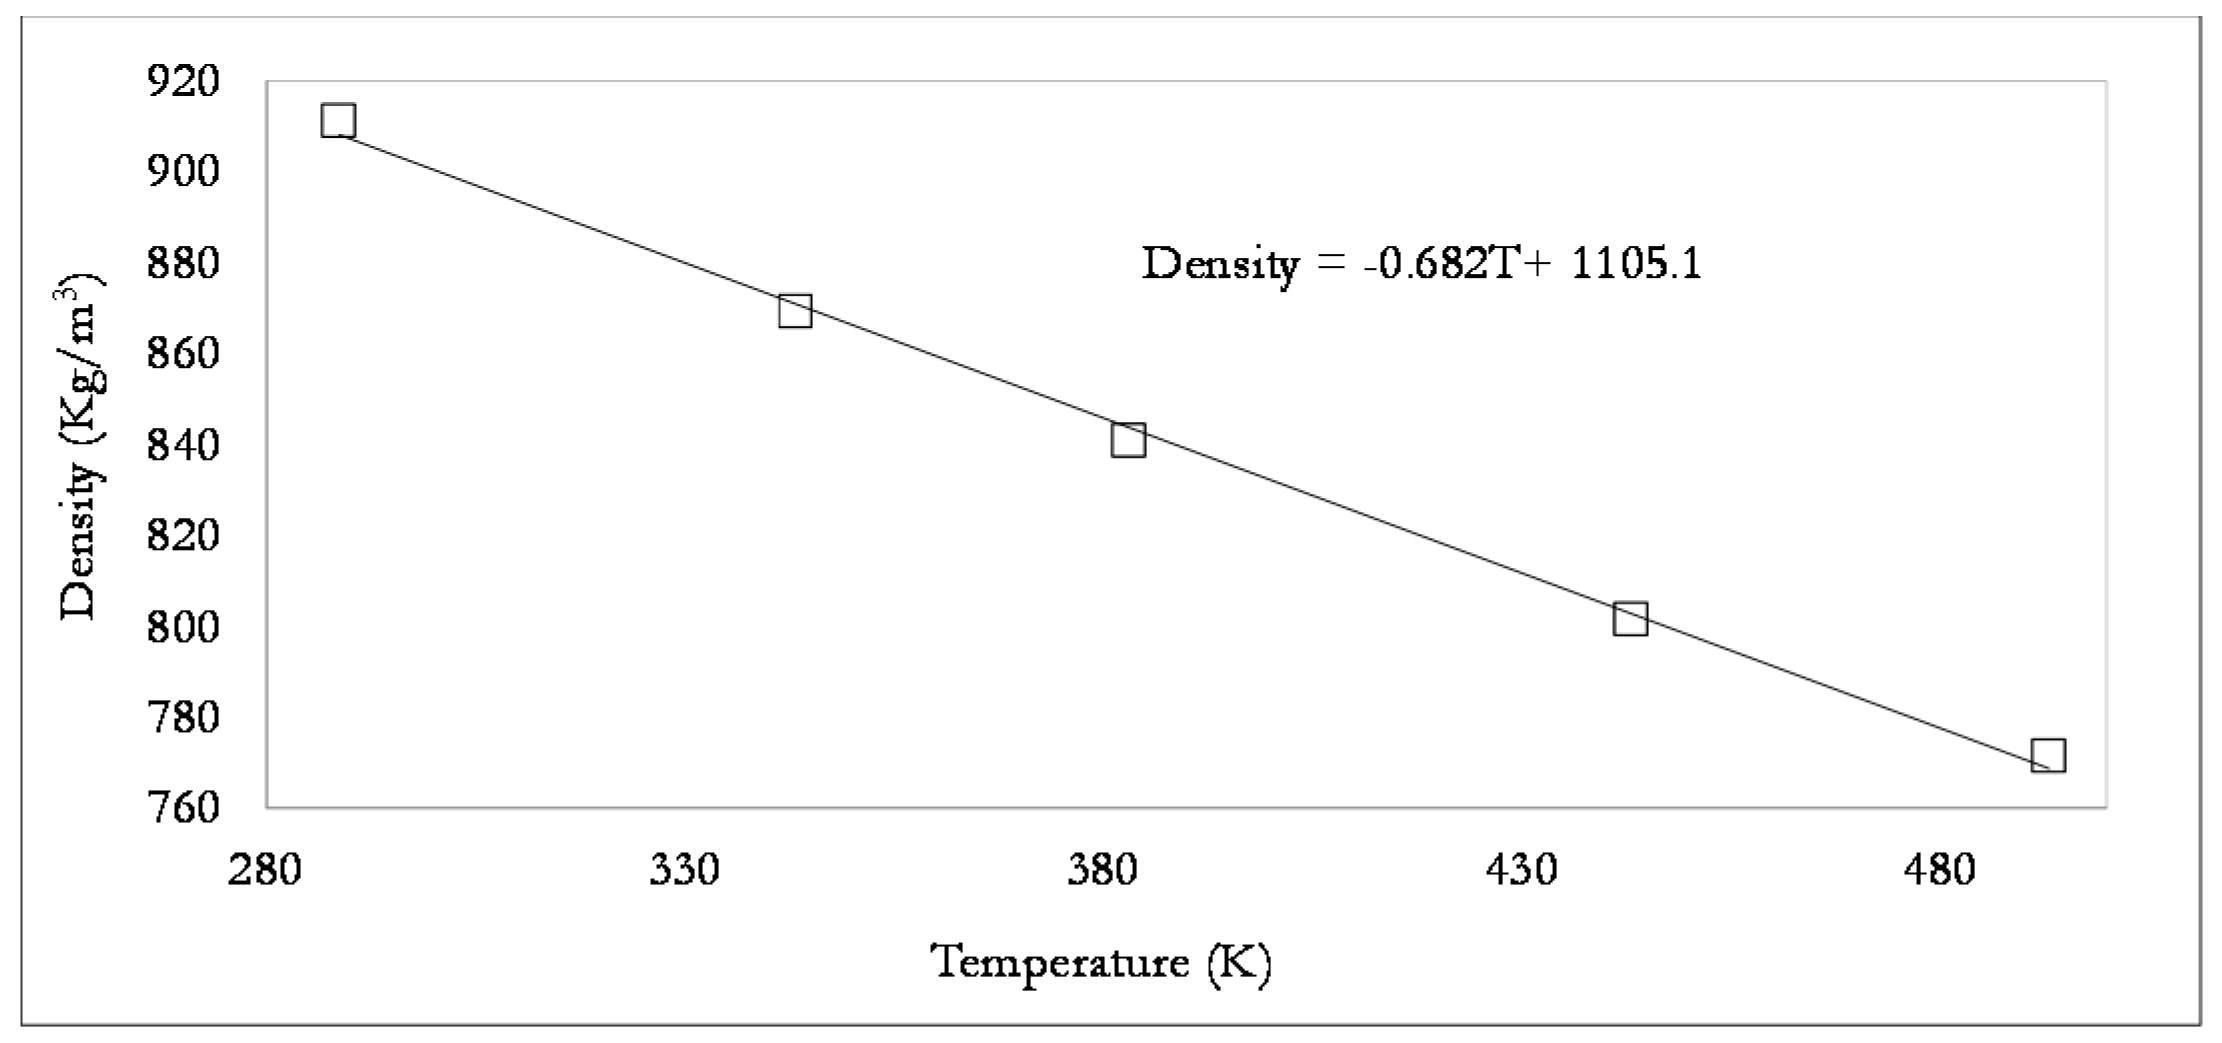
17]. The temperature dependence of the density (
ρDSL) of the model DSL in kg/m
3, was determined from its molar mass (
Mave.), which was approximated to be 853.14 kg/kmol in [
9] and its molar volume (
VDSL) in m
3/kmol of the DSL, as follows [
12],
where [
18],
In Equation (6),
Ni is the number of the
ith fragment in the DSL and
Vi represents the molar volume of the
ith fragment in m
3/kmol, which can be estimated by the following relation [
12],
where
Ci and
Bi represent the temperature-dependent correlation parameters of fragment,
i, of the DSL, measured in K
−1 and kmol/m
3, respectively, and
T represents the temperature in K.
The boiling temperature
Tb,DSL in K of the model DSL at a pressure of 1 atm, was estimated as follows [
11],
where [
11],
In Equations (8) and (9), Tbi represents the boiling temperature of the ith fragment in K at 1 atm of pressure, Ni is the number of the ith fragment present, Hi and Ii represent adjustment parameters for the ith fragment in K, and Nc represents the number of carbon atoms present in the representative DSL molecule.
Using Equations (1)–(3) above, the condensed molecular formula of the model DSL molecule was determined to be [(CH
2COO)
2CHCOO](CH=CH)(CH
2)
44(CH
3)
3, such that the main FA fragments of the model DSL molecule include a stearic acid fragment (CH
3(CH
2)
16CO), oleic acid fragment (CH
3(CH
2)
7CH=CH(CH
2)
7CO), and palmitic acid fragment (CH
3(CH
2)
14CO). The CCF model parameters that were utilised in this study have therefore been presented in
Table 2.
Further simplification of the simulation study was undertaken by modelling the protein content and carbohydrate content of DAF sludge as l-phenylalanine and glucose respectively. L-phenylalanine was selected as an appropriate model protein since it is an essential protein monomer present in food materials like meat; glucose was selected as an appropriate carbohydrate model compound since it is regarded as the most representative carbohydrate form and it is present in both cellulose and starch [
19]. The ash component was modelled in ASPEN Plus using properties such as density, molecular weight, and boiling temperature, as employed in a previous study in the literature [
20]. In a similar manner, the resin catalyst component was modelled using information for its properties, such as density and molecular weight presented in [
10]. The properties of other chemical inputs, such as methanol, water, and glycerol employed in the simulation study were obtained from the databank of the chemical property library in ASPEN plus
® V10.
2.2.2. The Model DAF Fatty Acid Employed in the Simulation Study
Given that the hydrolysis of the lipids present in DAF will generate a mixture of fatty acids (DFAs), it is also necessary to determine the most appropriate model FA molecule that best approximates the DFA mixture, as this will aid simulation result convergence. Two major approaches for modelling a mixture of FAs are acknowledged in the literature. The first approach involves the simple selection of the most abundant FA present in the mixture [
3] and the second approach involves the initial determination of the average properties of the FA mixture based on the contribution of the component FAs in the mixture. The model FA is then subsequently selected after a comparative assessment of the properties of possible model FAs and estimated average properties of the FA mixture [
21,
22]. The present study considers the second approach more comprehensively in determining the model FA best suited to model the DFA mixture, since in my view, the first approach is too simplistic to provide a sufficiently accurate basis for accurate simulations. This is because the first approach, which selects the most abundant FA molecule as the model FA for simulation purposes, conveniently ignores the contribution of the specific properties of other FA constituents present in the mixture. The average properties of the DFA mixture containing FAs, as shown in
Table 1, were therefore estimated by considering the contribution of -CH
3-, -CH
2-, >CH- and -COOH- functional groups of each FA in the mixture. The properties of the DFA mixture were predicted using classic group contribution techniques. The model FA molecule considered to be sufficient to approximately model the DFA mixture was subsequently established by assessing the absolute relative deviations of the property of each possible model FA molecule considered and the estimated (aggregated) properties of the DFA mixture using the following relation,
where
ARD represents the absolute relative deviation,
PDFAs,i represents the average estimated
ith property of the DFA mixture value, and
PFA,i represents the estimated
ith property of the representative FA.
The boiling temperature
Tb in K at 1 atm of pressure, standard heat of formation
Høform in kJ/mol, heat of fusion
Hf in kJ/mol, critical molar volume,
Vc in cm
3/mol, critical temperature
Tc in K, critical pressure
Pc in bar of the aggregated DFA mixture were subsequently obtained using Joback’s group contribution method, as follows [
23],
where
Tb,i in K,
Tm,i in K,
Høform,i in kJ/mol,
Hf,i in kJ/mol,
Vc,i, in cm
3/mol,
Tc,i, in K,
Pc,i in bar represent the
ith group contribution parameters that are associated with the relevant property and with the parameters presented in
Table 3.
Acentric factor,
ω was estimated using Lee-Kesler method, as follows [
24],
where,
Heat of vaporization
Hv in kJ/mole at
Tb was estimated using Reidel’s method, as follows,
The mean density of the DFA mixture was estimated using the so called ‘mixing rule’ represented by the following equation [
25,
26],
where,
ρm represents the mean density of the DFA mixture product,
xi represents the mole fraction of the
ith fatty acid and
ρi represents the density of the
ith fatty acid in the DFA mixture product. The densities of the component fatty acids of myristic, palmitic stearic acid, oleic acid and cis-vaccenic acid have been specified as 862 kg/m
3, 853 kg/m
3, 941 kg/m
3, 887 kg/m
3, and 887 kg/m
3, respectively [
27].
2.2.3. Analysis Tools and Process Flow Description
Initially the proper thermodynamic property method to be utilised in the simulation study was determined. To determine the proper thermodynamic property method, the decision steps outlined by Carlson, [
28] and the guide provided by Aspen tech [
29] were reviewed and employed. The NRTL-Redlich-Kwong property method in ASPEN plus was selected as sufficient in predicting the vapour-liquid equilibria of chemical species in this study, due to its high accuracy level in simulation studies involving complex systems [
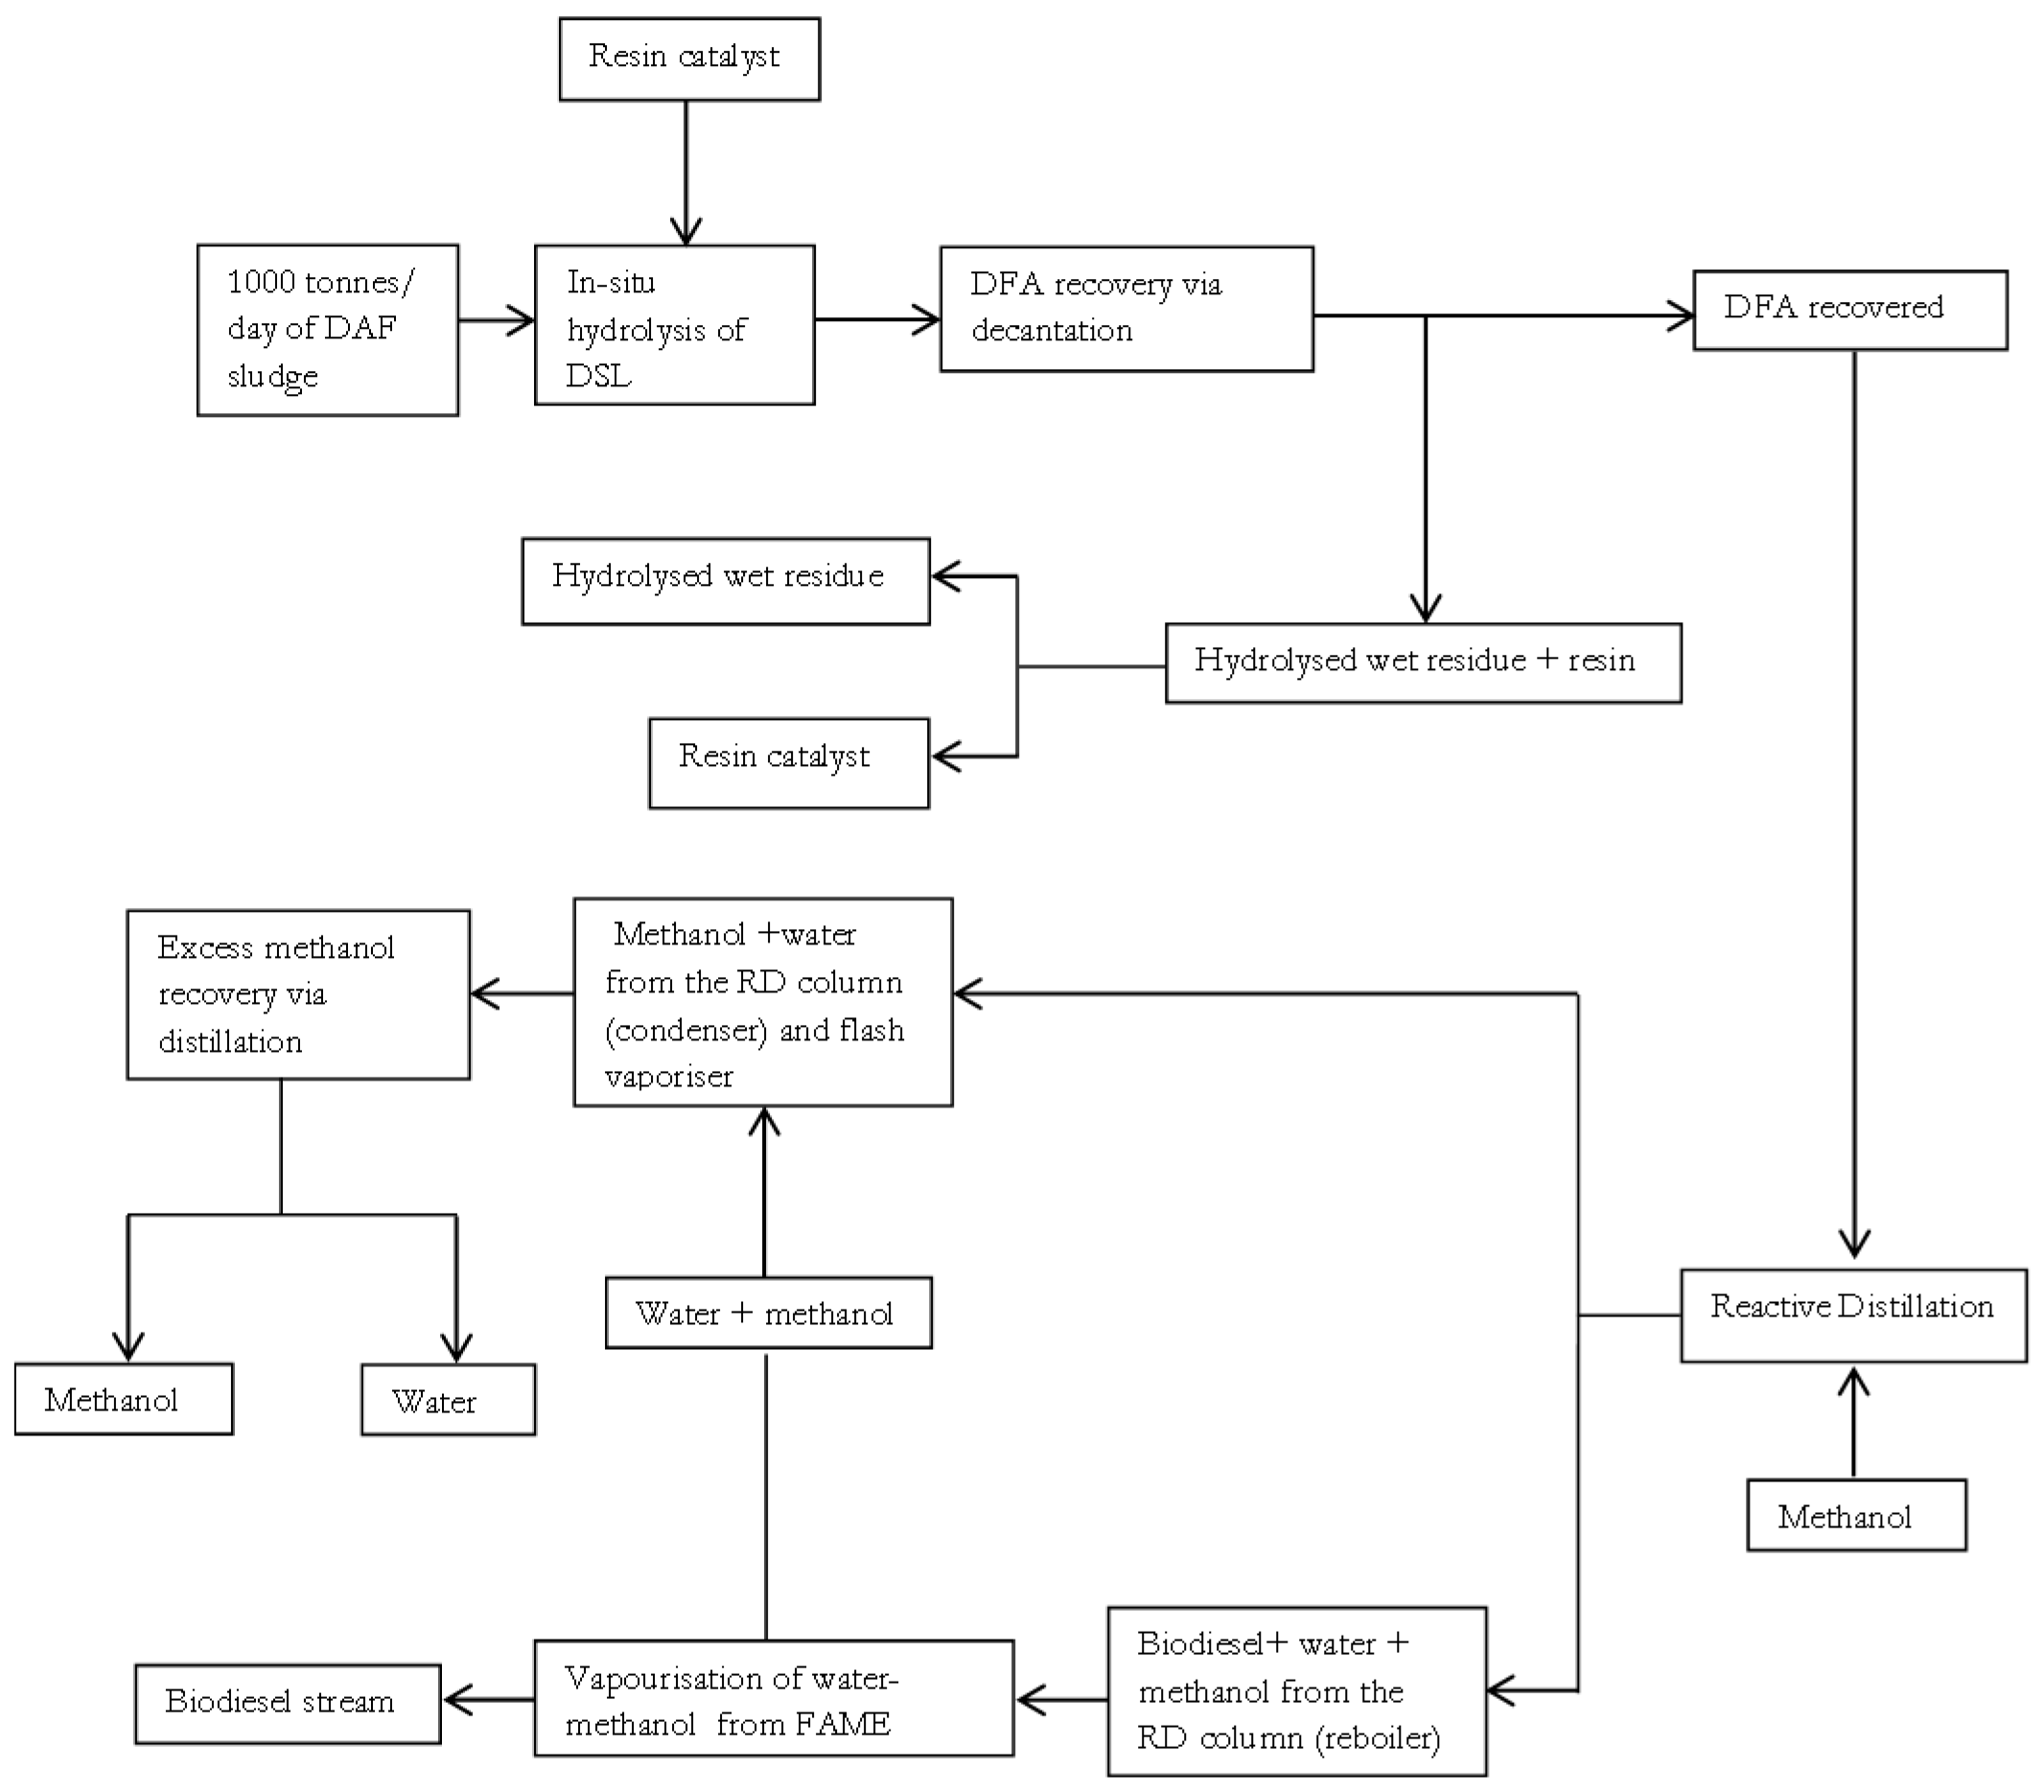
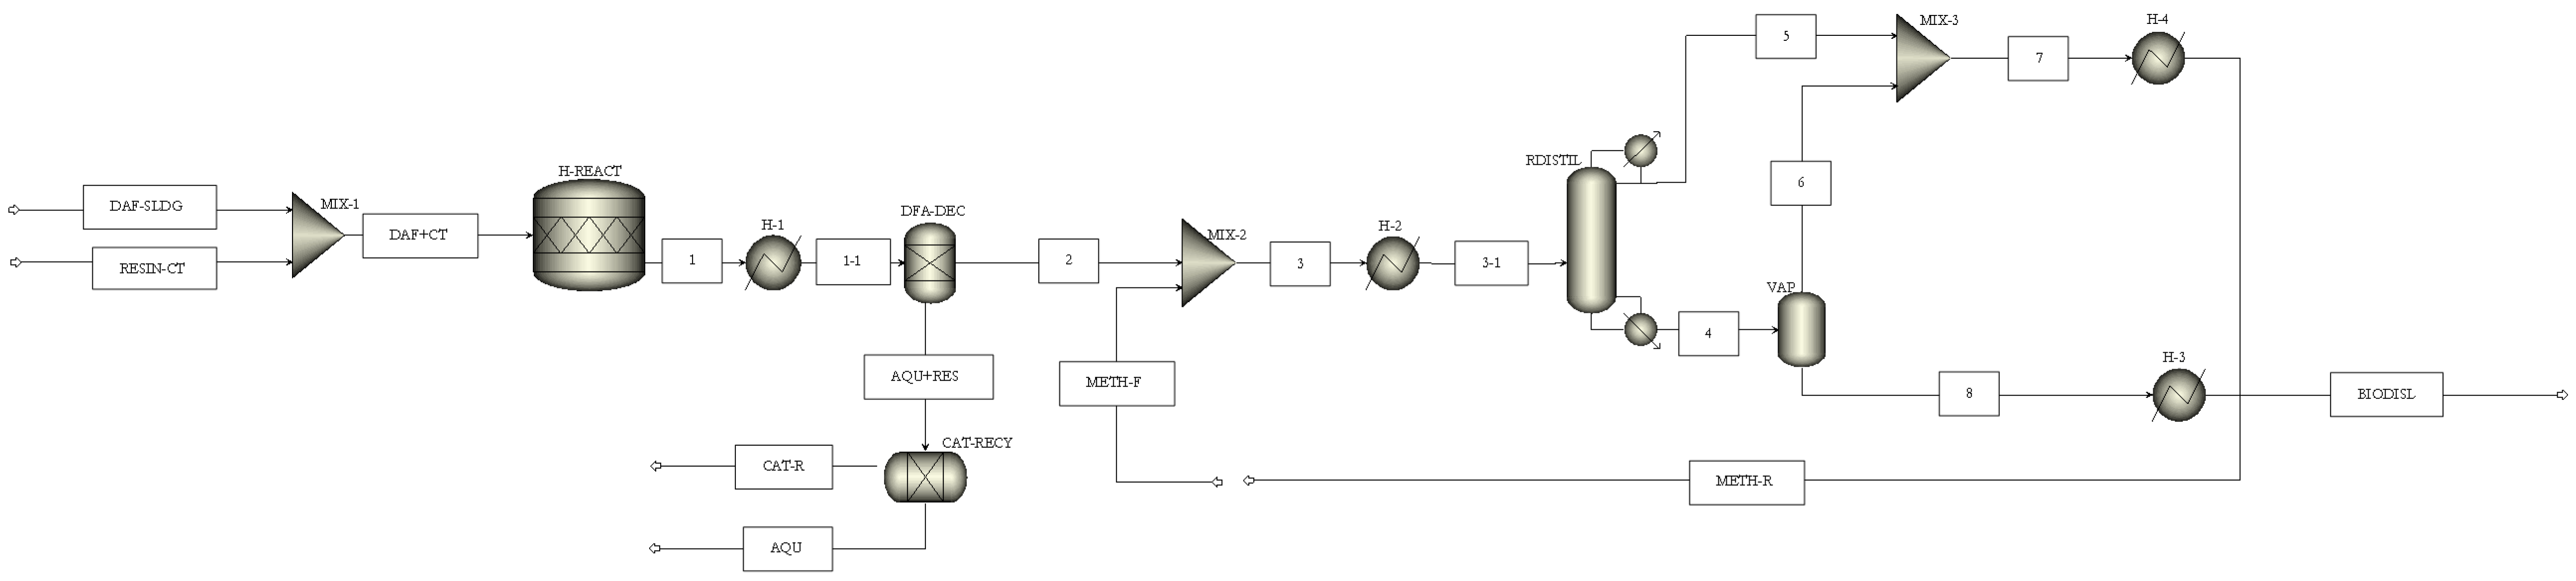
29]. Having selected a property method in ASPEN plus, the block diagram summarising the base case simplified integrated processes of in-situ hydrolysis and esterification for biodiesel production is shown in
Figure 1. The integrated processes of in-situ hydrolysis and esterification may also be referred to as an in-situ hydroesterification process in this study.
In
Figure 1, biodiesel production process is achieved using 1000 tonnes/d of meat processing DAF sludge as the low grade lipid source. A simplified and direct (loop-free) process of
Figure 1, with feed rate of 1000 tonnes/d for the DAF sludge is initially assumed as base case scenario in this preliminary study with the effects of uncertainties in biodiesel productivity on production energetics and economics investigated in
Section 2.3 below.
Figure 1 shows that the fed DAF sludge is initially subjected to an in-situ lipid hydrolysis process that occurs under the reaction conditions: catalyst load of 0.09216 wt of resin/wt of wet fresh DAF sludge, temperature of 92.5 °C, and a moisture content of 92 wt % on a wet basis. These reaction conditions are based on the experimental work presented earlier in [
10]. The hydrolysed product is then subjected to a decantation operation, under ambient conditions of 25 °C and 1 atm, since fatty acids are typically the least dense non-polar component in the mixture and are essentially immiscible with the polar water phase at mild temperatures [
30]. The base case scenario assumes that approximately 99 wt % recovery of DFA is feasible via the decantation operation. The hydrolysed residue is subjected to a separation operation to facilitate resin recovery, under a temperature 25 °C and pressure of 1 atm. The base case scenario also assumes that approximately 100 wt % recovery of resin is feasible for simplicity. The DFA that is recovered is then fed to a reactive distillation (RD) column, for the esterification reaction in the presence of methanol, with subsequent separation of the DAF sludge fatty methyl ester (DSME or biodiesel) and distillate (methanol and water) products achieved in the non-reactive zone of the column. The DSME product is purified via vaporisation to remove any residual water and methanol impurities that may be present. After the vaporisation operation, the methanol and water impurities from the biodiesel product are mixed with the methanol and water distillate of the RD column.
Depending on the mass fraction of methanol present in the recovered methanol-water mixture, the mixture containing methanol and water may be fed to a distillation column to aid further purification of useful methanol for reuse. This study assumes the sufficiency of re-using the recovered methanol directly if a high mass fraction of methanol content of ≥95 wt % in the methanol-water mixture is generated. This is because commercial large scale processes in chemical, pharmaceutical, and even microbiological industries typically utilise industrial grade B methanol which has a mass fraction of about 92 wt % of methanol [
31]. Having determined the yield of biodiesel possible in large-scale biodiesel production processing via the in-situ hydrolysis pathway, it is crucial to assess the energetics of the biodiesel production process. Prior to a determination of the total external energy duty that is required in the biodiesel production process, the extent to which process heating and cooling could be met internally was explored.
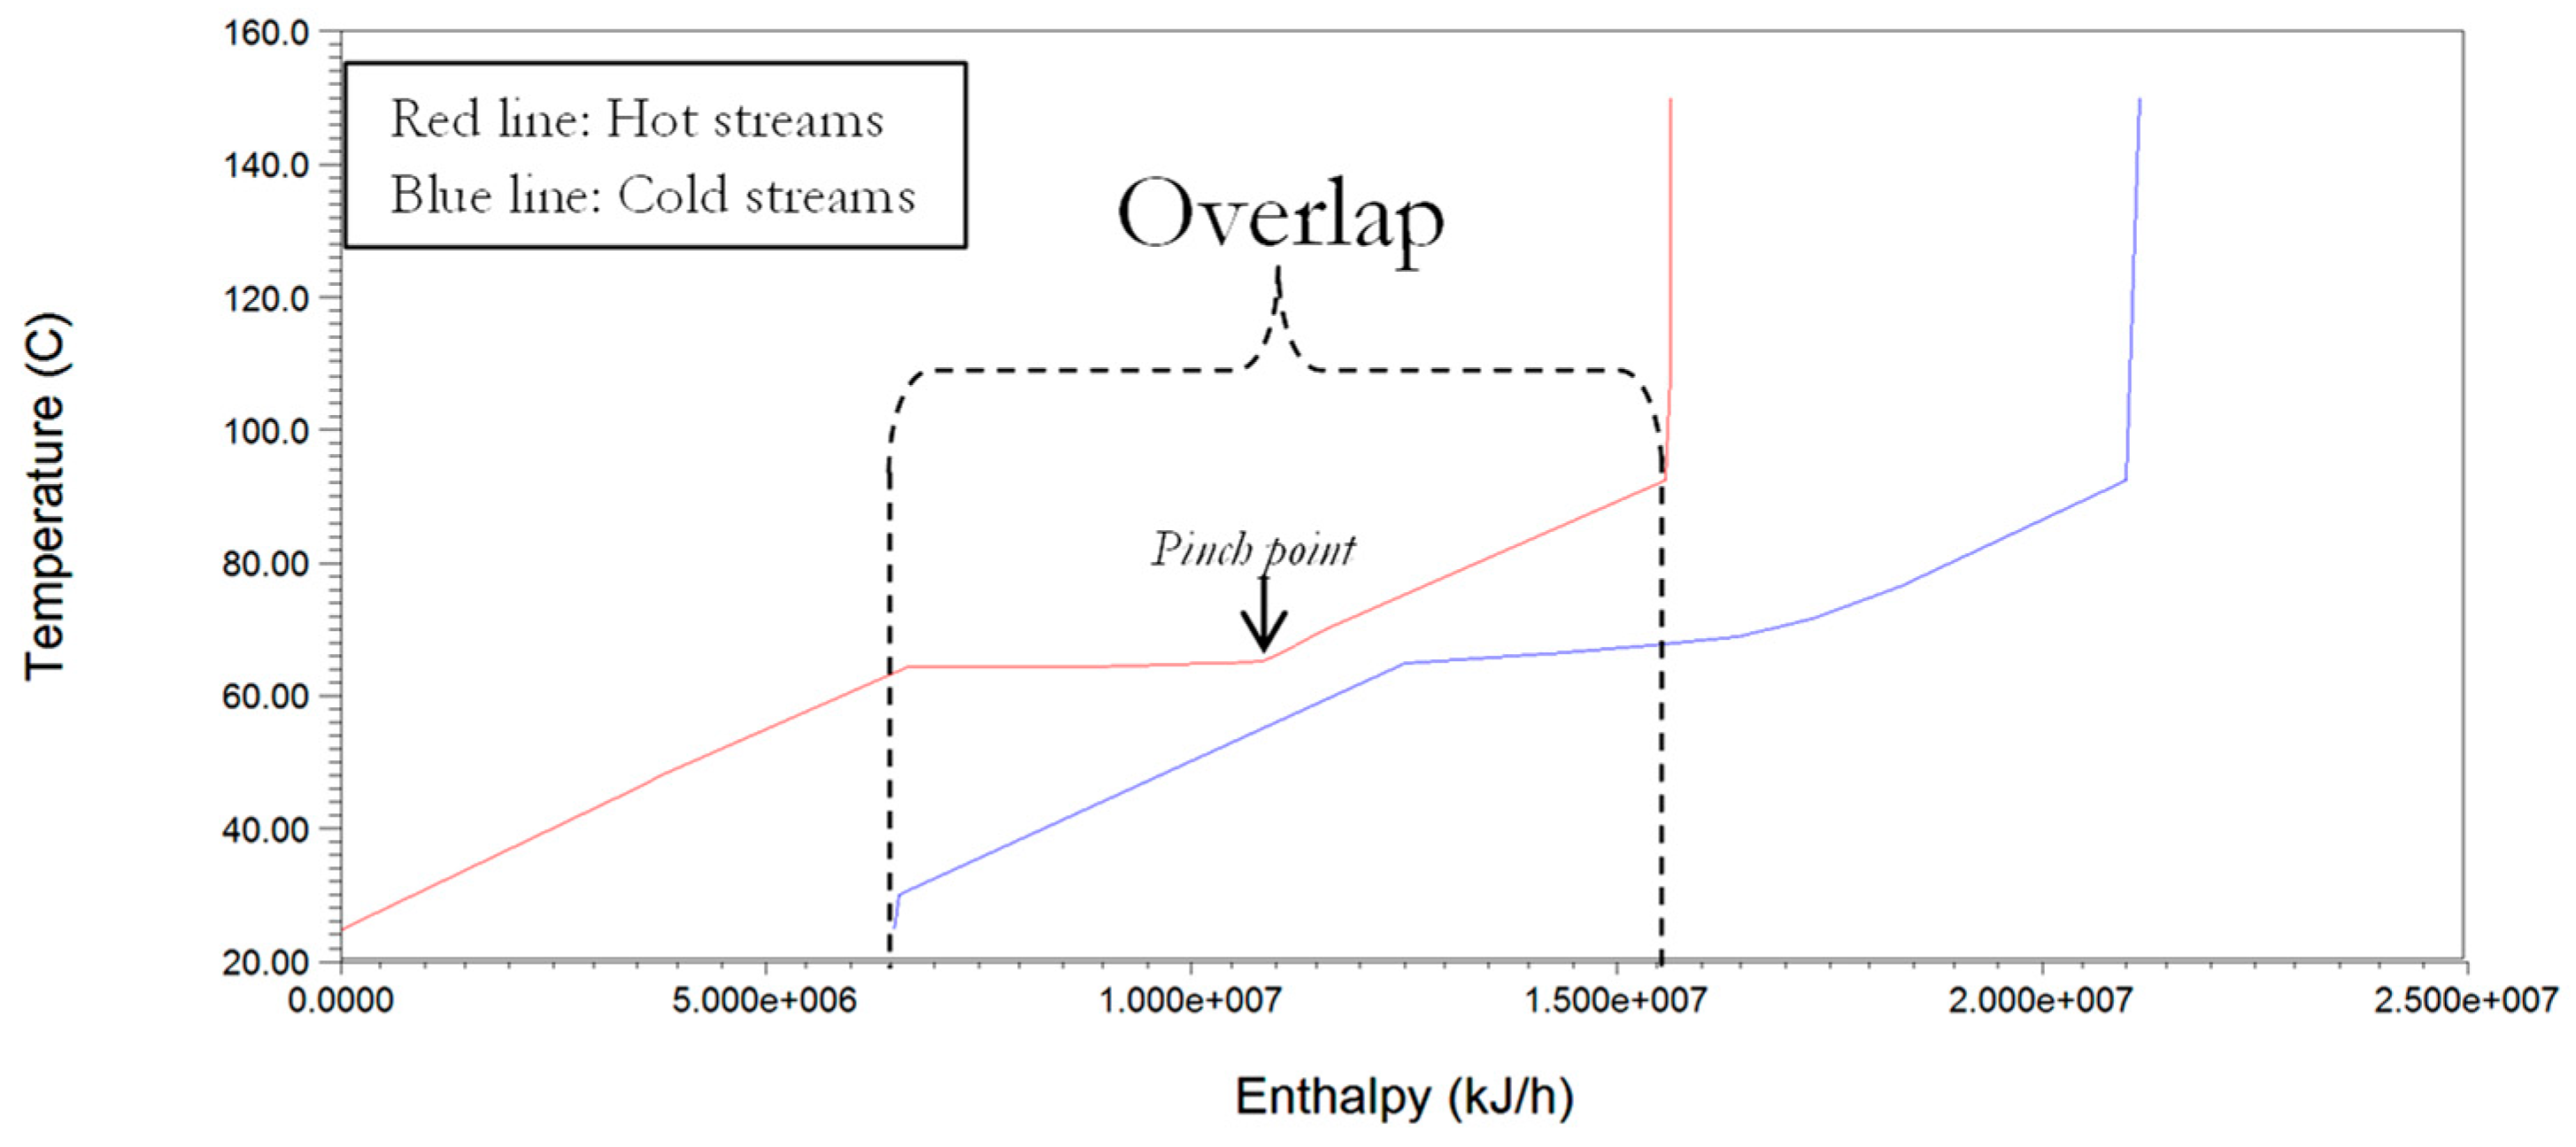
Energy analysis for reduced cooling and heating duties is undertaken using classic pinch analysis methods that were incorporated in the ASPEN energy Analyser
® V.10. The classic pinch analysis method incorporates the assessment of inequalities in heat flow rate and stream splitting rules using tick-off heuristics [
32]. The ASPEN energy analyser
® is utilised according to the procedure in the literature [
33]. The procedure involves the extraction of all thermal data from the simulation output sheet generated by ASPEN plus which highlights the hot and cold streams in the process. The extracted thermal data is then used in constructing a composite curve, which shows the counter-current heat flow of the streams selected for integration and heat recovery. This plot facilitates the determination of the minimum energy consumption target since the overlap of heat availability (hot composite curve) and the heat requirement (cold composite curve) provides an indication of the maximum possible process heat recovery [
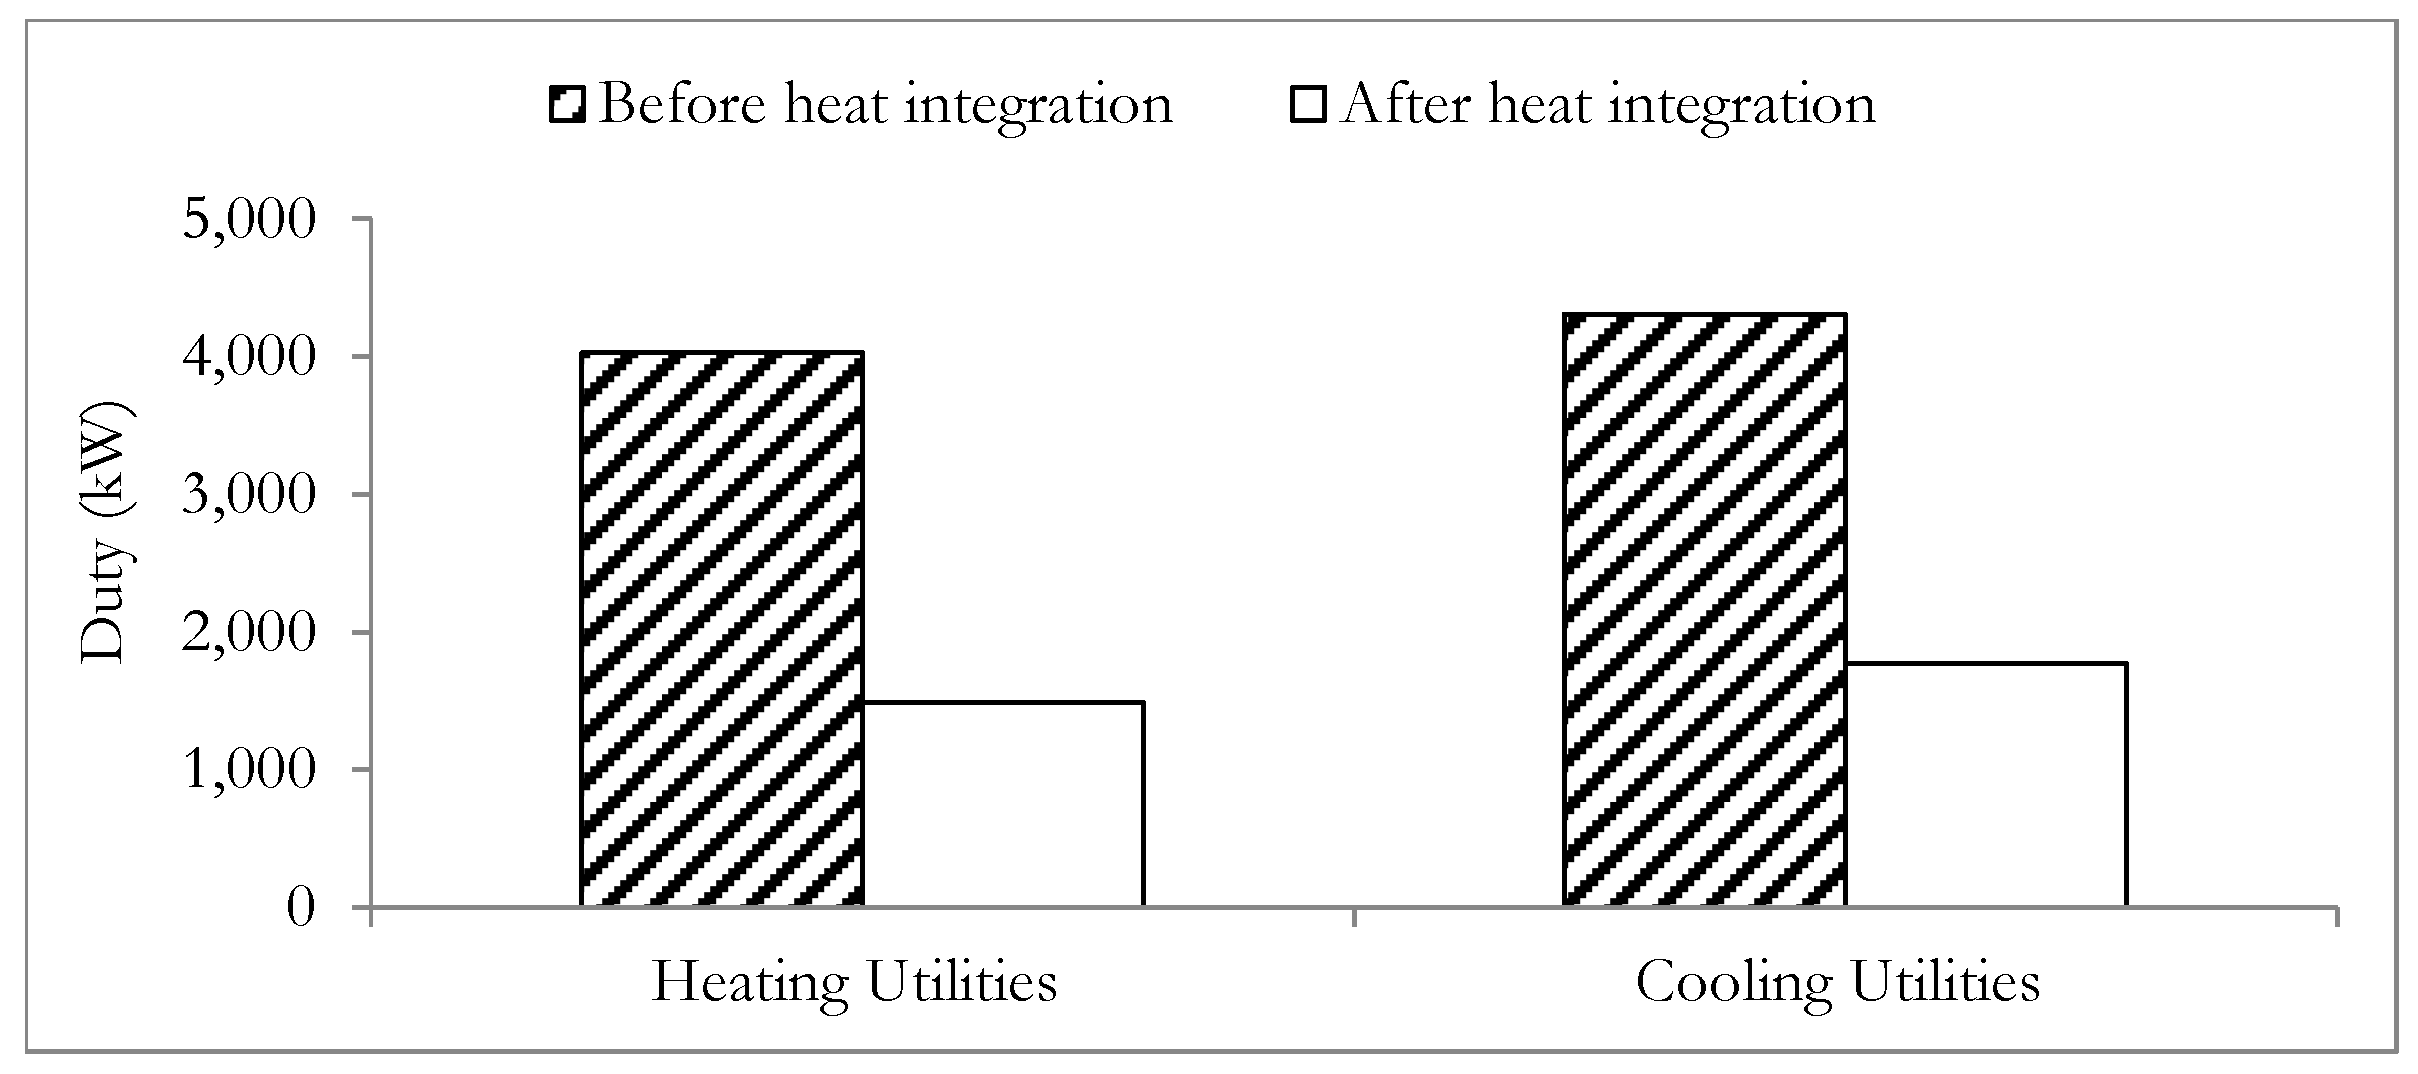
34]. The determination of the possible heat recovery enables the estimation of the remaining heating requirement (called the minimum hot Q(H)
min) and cooling requirements (called the minimum cold Q(C)
min). For simplicity we have adopted the minimum allowable temperature difference (ΔT
min) at ‘pinch point’, in a heat exchanger to be 10 °C [
35]. The area and number of the shell and tube heat exchangers utilised in this study were also determined using ASPEN energy analyser as a precursor to heat exchanger network capital cost estimation. In addition to energy demand due to heat flow requirements, electrical energy will be required by the mechanical mixers within the in-situ hydrolysis reactor if enhanced mixing of the reactants in the in-situ hydrolysis reactor is to be achieved. ASPEN plus assumes that the complete mixing of the reactant is achieved and thus does not provide an estimate for the duty requirement by the mechanical stirrers. To improve the realism of the results obtained the additional energy duty requirement of mechanical stirring will be obtained by other means. This study recognises that for liquid-solid systems, the energy requirement of the mechanical stirrer is largely dependent on the type of impeller, nature of the mixture, and important reactor geometric parameters [
36]. However for a simplified estimation of the reactor mixing energy requirement the average specific electrical power mixing power of 0.5 kW per m
3 of the mixture reported by Pangarkar [
36] was utilised.
2.2.4. Modelling the Catalysed In-Situ Lipid Hydrolysis and Fatty Acid Esterification Processes
Based on work that is presented earlier in [
10], 98% of the mass of DSL was specified as being hydrolysable to produce FA, via the in-situ pathway and under the action of the environmentally benign resin catalyst. It has been proposed that the DSL hydrolysis is occurring as follows,
This DSL hydrolysis step was therefore modelled using the simple stoichiometric reactor block of ASPEN plus, according to Equation (23) with a 98% conversion of the DSL being imposed [
29]. The esterification reaction of the model DFA using methanol (CH
3OH) for DAF sludge methyl ester (DSME) production was modelled as follows,
where the rate of the reaction (
re) is given as follows,
where
kf and
kb represent the rate constant of the reaction occurring in the forward and backward direction, respectively, which are expressed as,
and
In Equations (25)–(27), n, m, i, and j represent the order of the reaction (dimensionless) with respect to the chemical species of DFA, CH3OH, DSME, and H2O, respectively, Ea, represents the activation energy of the reaction occurring in the forward (f) or backward (b) direction, respectively, in kJ/kmol, Af and Ab represent the pre-exponential constants of the reaction occurring in the forward (f) and backward (b), respectively, R represents the universal gas constant in kJ/(kmol·K) and T represents the temperature in K.
The kinetic parameters (
Ea,
n,
m,
i,
j, and
A) that describe the esterification of DFA were obtained from the literature based on the esterification reaction of the model FA, to be determined after employing the methods that are discussed earlier in
Section 2.2.2. The molar mass of the resulting DSME product was specified as 285.7 kg/kmol based on the work in [
9]. The RD column for the esterification reaction is assumed to contain trays having a Murphree efficiency of 100% with heat losses being assumed to be negligible [
37,
38]. The pressure within the column is assumed to be maintained at 1 atm and a steady state flow in all unit operations is also assumed.


