Article

Scaled-Up Biodiesel Production from Meat Processing Dissolved Air Flotation Sludge: A Simulation Study

by
Oseweuba Valentine Okoro
Department of Physics, University of Otago, P.O. Box 56 Dunedin, New Zealand
AgriEngineering 2019, 1(1), 17-43; https://doi.org/10.3390/agriengineering1010003
Submission received: 2 October 2018 / Revised: 23 October 2018 / Accepted: 25 October 2018 / Published: 29 October 2018

Abstract

:
For the first time, a steady state computational simulation for the production of biodiesel from meat processing dissolved air flotation sludge via an integrated process of in-situ hydrolysis and esterification technologies has been investigated. Important thermophysical properties of the intrinsic lipids of dissolved air flotation sludge were estimated using chemical constituent fragment methods. The environmental performance and the economic performance of the biodiesel production process were assessed via the estimation of the net energy ratio (NER) and the unit production cost, respectively. Since electrical energy requirements may be satisfied via either non-renewable (case A) or renewable sources (case B), the NER was determined for both scenarios. To enhance the robustness of the study results, uncertainties in the NER and the unit cost of the biodiesel production process due to the variability of the underlying study assumptions were also assessed. Uncertainty analysis indicated that the likely range of the NER for the biodiesel production process for cases A and B are 1.76 to 3.32 and 1.82 to 3.36, respectively, at 95% probability. Uncertainty analysis also showed that the likely range of the unit production cost for biodiesel is $US0.41/kg-biodiesel to $US0.71/kg-biodiesel at 95% probability. The results that were obtained in this study therefore provide evidence of both the environmental sustainability and the economic viability of biodiesel production from dissolved air flotation sludge via the proposed integrated process of in-situ hydrolysis and esterification.

1. Introduction

The utilisation of biodiesel as an alternative fuel has been identified as a practical method of improving the environmental sustainability of energy consuming processes. This is because of the reduced generation of associated anthropogenic gaseous pollutants, such as CO2, SOx, and NOx when biodiesel fuels are utilised. However, in spite of the obvious environmental benefits of biodiesel utilisation, the wider commercialisation of biodiesel production processes has thus far been limited. This is because biodiesel production processes generally present poorer economic performances when compared with existing fossil diesel production processes [1]. The poorer economic performance of the biodiesel production process is largely due to the high feedstock cost that characterises the process, with previous studies suggesting that the biodiesel feedstock may account for 60% to 80% of total biodiesel production cost [2]. In an attempt to counter high feedstock cost concerns, the feasibility of large-scale biodiesel production from cheaper unconventional feedstocks has been extensively investigated via simulation studies in the literature. Examples of such studies include assessments of the large-scale biodiesel production from un-conventional feedstocks of Nannochloropsis salina algae and sewage sludge [3,4].
Unconventional feedstocks typically contain low grade lipids, which are characterised by high free fatty acid (FFA) contents (>0.5 wt %); thus, limiting the applicability of conventional alkali catalysed transesterification reactions, due to unwanted saponification side reactions. To resolve this challenge of high FFA content of low grade lipids, different approaches have been investigated in the literature. Examples of the major approaches that are employed in resolving the challenge of high FFA content include simulation studies of Silva et al. [4], Canakci & Van Gerpen [5] and Olkiewicz et al. [3]. In the study undertaken by Silva et al., the glycerolysis reaction was applied as a preliminary step to convert any FFAs present in algae-sourced lipids to triglycerides (TGs) prior to undertaking conventional transesterification reactions. Canakci & Van Gerpen [5] explored the viability of utilising a preliminary esterification treatment step that initially converted any FFAs present in low-grade lipids to alkyl esters such that only the TGs will be left unreacted. Having converted all FFAs present to alkyl esters, the residual TGs were subsequently converted also to alkyl esters via the conventional transesterification pathway. In the study undertaken by Olkiewicz et al. [3], an acid catalyst was utilised as an alternative catalyst to the traditional alkaline catalyst, to enhance the transesterification reaction involving sewage-sourced lipids, thus avoiding unwanted saponification reactions. These alternative pathways, which were previously employed to improve the usability of unconventional feedstocks for biodiesel production, are however characterised by several limitations, for example, the glycerolysis step employed in the study by Silva et al. [4] as an initial FFA to TG conversion step, is an energy intensive and slow process [6]. Also in the study by Canakci & Van Gerpen [5], the application of the preliminary esterification reactions, to convert FFA to alkyl esters may require several pre-treatment steps to reduce the FFA to reasonable levels, leading to a higher processing cost [7]. The alternative utilisation of an acid catalyst as a method of eliminating concerns that are associated with the unwanted saponification reaction as presented by Olkiewicz et al. [3] will also lead to unfavourably long reaction times [8]. It is therefore clear that the application of these aforementioned methods reported in the literature may serve to increase the process energetic cost and equipment capital cost, which will have unfavourable implications on the overall economics of the biodiesel production processes.
To avoid these highlighted energetic cost concerns, this study proposes the preferred application of the two-step integrated processes of in-situ hydrolysis and esterification for biodiesel production from dissolved air flotation (DAF) sludge as an unconventional feedstock due to its simplicity as highlighted previously in [9]. Energetic concerns that are associated with the initial lipid hydrolysis process, from initial drying operations were considered, with the in-situ hydrolysis pathway that was proposed in [9] and experimentally investigated in [10]. The study presented in [10] demonstrated that DAF sludge lipids (DSL) can be readily hydrolysed for fatty acid production via the in-situ hydrolysis pathway, under a moderate temperature condition of 92.5 °C and a moderate pressure condition of 1 atm. The study also demonstrated the possibility of regenerating an ‘exhausted’ resin catalyst via acid treatment for the replacement of the H+ ions (from the resin) depleted during the hydrolysis reaction. The possibility of such catalyst regeneration is expected to lead to further reductions in the biodiesel production costs in large-scale systems.
In summary, therefore, the present study will present a simulation based investigation into the technical and economic feasibility of large-scale production of biodiesel from meat processing DAF sludge as an unconventional feedstock. The pragmatism of the results presented in this study will be enhanced by ensuring that relevant thermophysical properties of the DSL are estimated via a consideration of the experimentally determined DAF fatty acid (DFA) profile [11,12]. The technical feasibility study will generate useful data relating to the biodiesel fuel yield and the energy requirements of the major unit operations as a basis for assessing the overall environmental performance of the biodiesel production process. The economic feasibility studies that were undertaken in the present study will generate useful costing data that will provide the basis for assessing the unit cost of biodiesel production when DAF sludge is employed as the feedstock.

2. Materials and Methods

2.1. Materials

The meat processing DAF sludge is characterised by carbohydrate, protein, lipid, and ash contents of 0.4329 kg-carbohydrates/kg-dry sludge, 0.2205 kg-proteins/kg-dry sludge, 0.1298 kg-lipid/kg-dry sludge and 0.2168 kg-ash/kg-dry sludge, respectively, as previously reported in [9]. The results of the characteristic fatty acid (DFA) distribution of DSL, also reported in [9] are presented in Table 1.
Also the simulation of biodiesel production from DAF sludge as the unconventional feedstock was achieved using ASPEN plus® V10 process simulator (Aspen Technology Inc., Cambridge, MA, USA). ASPEN plus enables the development of a large-scale, albeit simplified model that is subsequently resolved by employing classic chemical and process engineering principles, thus facilitating the generation of useful mass balance and energy balance data for the biodiesel production process in a timely fashion. In the present study, the convergence of simulation results has been enhanced by incorporating logical assumptions in modelling complex reaction species.

2.2. Modelling and Simulation Methods

2.2.1. The Model DAF Sludge Lipid, Carbohydrate and Protein Employed in the Simulation Study

DAF sludge has been assumed to be composed of several triglycerides (TGs) due to the presence of different fatty acid molecules in its mixture as presented in Table 1. It is therefore necessary to develop a model DAF sludge lipid (DSL) molecule that will enable the approximation of the properties of the DSL. To develop the molecular formula of a model DSL, the fatty acid distribution of the DSL that is presented in Table 1 was utilized. The molecular formula of the model DSL was determined by employing Espinosa’s method [13]. Espinosa’s method considers the contribution of the experimentally determined moles of the fatty acids present (in mole fractions) in the DSL extract in providing a ‘condensed’ molecular formula for the model DSL molecule [13], as follows,
[(CH2COO)2CHCOO](CH=CH)(CH2)M(CH3)N
where [13],
N = i n n i x i
M = i n m i x i
In Equations (2) and (3), xi represents the mole fraction of the fatty acid i in DSL, mi and ni represent the number of CH=CH and CH2 functional groups present in the parent TGs of the fatty acids. The mole distributions of the parent TGs are assumed to be similar to the mole distributions of their respective fatty acids, as presented in Table 1.
Having estimated the condensed molecular formula of the model DSL molecule, it is important to estimate crucial thermophysical properties of the model DSL that will serve as inputs to the simulation software for property abstraction and predictions using in-built correlations in ASPEN plus via the pseudo-component designation in ASPEN plus. A similar methodology was employed in [14]. These crucial thermophysical properties of the model DSL include its vapour pressure equilibrium relation with temperature, boiling temperature at 1 atm, and molar density-temperature relation. To estimate the aforementioned properties of the model DSL, several aggregation techniques have been reported in the literature. One of such methods is the weighted average approach that considers the properties of a lipid mixture as a weighted average of the properties of the component lipids in the mixture [15]. Another important approach utilised in estimating the properties of a mixture of lipids is the group contribution method [15]. The group contribution method is similar to the weighted average approach with the major difference being that the contribution of the functional groups rather than the mass fractions of the individual lipids are considered [15]. Recent studies have however shown that for improved accuracy it may be more appropriate to estimate some thermophysical properties of lipid mixtures, such as boiling temperature, density, and vapour pressure while using the chemical constituent fragment (CCF) approach [12]. This is because although the weighted average and group contribution methods cannot be considered to be erroneous, the CCF method has been shown to provide more accurate results when estimating some crucial thermophysical properties of TGs [11,12]. The CCF approach will enable the provision of accurate estimates which will form the basis for an optimal level of parameter abstraction for thermodynamic property estimation in simulation studies [12]. In the CCF approach, the model DSL molecule is considered as being composed of a backbone glycerol fragment plus three fatty acid fragments, such that the attributes of each fragment (specific to a particular thermophysical property) can be combined via established model relations as a basis for thermophysical property estimations. From the condensed model DSL molecular formula (Equation (1)), the model DSL can be characterised by three major fatty acid fragments, which together with the glycerol backbone will enable the estimation of crucial thermophysical properties of the model DSL using CCF methods. In this study, the vapour pressure, boiling temperature, and density of the model DSL molecule were estimated using CCF. The temperature dependence of the vapour pressure of the model DSL was estimated using the Perry’s relationship [16], with the constant parameters A and B calculated as 15.2493 and 8623.732, respectively [12],
log 10 p D S L = A B T
where pDST is the vapour pressure of the model DSL in Pa and T represents temperature in K.
The vapour pressure of the model DSL is expected to be very low given that lipids typically exhibit a negligible vapour pressure with lipids, such as tristearin and triolein, presenting vapour pressures as low as 7.2 × 10⁻¹⁵ Pa and 1.5 × 10⁻⁷ Pa respectively [17]. The temperature dependence of the density (ρDSL) of the model DSL in kg/m3, was determined from its molar mass (Mave.), which was approximated to be 853.14 kg/kmol in [9] and its molar volume (VDSL) in m3/kmol of the DSL, as follows [12],
ρ D S L = M a v e . V D S L
where [18],
V D S L = i n N i V i
In Equation (6), Ni is the number of the ith fragment in the DSL and Vi represents the molar volume of the ith fragment in m3/kmol, which can be estimated by the following relation [12],
V i = 1 + C i T B i
where Ci and Bi represent the temperature-dependent correlation parameters of fragment, i, of the DSL, measured in K−1 and kmol/m3, respectively, and T represents the temperature in K.
The boiling temperature Tb,DSL in K of the model DSL at a pressure of 1 atm, was estimated as follows [11],
T b , D S L = 1 ( 0.0045 N c 0.0603 ) × ( i n N i T b i n )
where [11],
T b i = 6.6333 H i + I i
In Equations (8) and (9), Tbi represents the boiling temperature of the ith fragment in K at 1 atm of pressure, Ni is the number of the ith fragment present, Hi and Ii represent adjustment parameters for the ith fragment in K, and Nc represents the number of carbon atoms present in the representative DSL molecule.
Using Equations (1)–(3) above, the condensed molecular formula of the model DSL molecule was determined to be [(CH2COO)2CHCOO](CH=CH)(CH2)44(CH3)3, such that the main FA fragments of the model DSL molecule include a stearic acid fragment (CH3(CH2)16CO), oleic acid fragment (CH3(CH2)7CH=CH(CH2)7CO), and palmitic acid fragment (CH3(CH2)14CO). The CCF model parameters that were utilised in this study have therefore been presented in Table 2.
Further simplification of the simulation study was undertaken by modelling the protein content and carbohydrate content of DAF sludge as l-phenylalanine and glucose respectively. L-phenylalanine was selected as an appropriate model protein since it is an essential protein monomer present in food materials like meat; glucose was selected as an appropriate carbohydrate model compound since it is regarded as the most representative carbohydrate form and it is present in both cellulose and starch [19]. The ash component was modelled in ASPEN Plus using properties such as density, molecular weight, and boiling temperature, as employed in a previous study in the literature [20]. In a similar manner, the resin catalyst component was modelled using information for its properties, such as density and molecular weight presented in [10]. The properties of other chemical inputs, such as methanol, water, and glycerol employed in the simulation study were obtained from the databank of the chemical property library in ASPEN plus® V10.

2.2.2. The Model DAF Fatty Acid Employed in the Simulation Study

Given that the hydrolysis of the lipids present in DAF will generate a mixture of fatty acids (DFAs), it is also necessary to determine the most appropriate model FA molecule that best approximates the DFA mixture, as this will aid simulation result convergence. Two major approaches for modelling a mixture of FAs are acknowledged in the literature. The first approach involves the simple selection of the most abundant FA present in the mixture [3] and the second approach involves the initial determination of the average properties of the FA mixture based on the contribution of the component FAs in the mixture. The model FA is then subsequently selected after a comparative assessment of the properties of possible model FAs and estimated average properties of the FA mixture [21,22]. The present study considers the second approach more comprehensively in determining the model FA best suited to model the DFA mixture, since in my view, the first approach is too simplistic to provide a sufficiently accurate basis for accurate simulations. This is because the first approach, which selects the most abundant FA molecule as the model FA for simulation purposes, conveniently ignores the contribution of the specific properties of other FA constituents present in the mixture. The average properties of the DFA mixture containing FAs, as shown in Table 1, were therefore estimated by considering the contribution of -CH3-, -CH2-, >CH- and -COOH- functional groups of each FA in the mixture. The properties of the DFA mixture were predicted using classic group contribution techniques. The model FA molecule considered to be sufficient to approximately model the DFA mixture was subsequently established by assessing the absolute relative deviations of the property of each possible model FA molecule considered and the estimated (aggregated) properties of the DFA mixture using the following relation,
A R D = | P D F A s , i P F A , i P F A , i |
where ARD represents the absolute relative deviation, PDFAs,i represents the average estimated ith property of the DFA mixture value, and PFA,i represents the estimated ith property of the representative FA.
The boiling temperature Tb in K at 1 atm of pressure, standard heat of formation Høform in kJ/mol, heat of fusion Hf in kJ/mol, critical molar volume, Vc in cm3/mol, critical temperature Tc in K, critical pressure Pc in bar of the aggregated DFA mixture were subsequently obtained using Joback’s group contribution method, as follows [23],
T b = 198 + i n T b , i
H ø f o r m = 68.29 + i n H f o r m , i
H f = 0.88 + i n H f , i
V c = 17.5 + i n V c , i
T c = T b [ 0.584 + 0.965 i n T c , i ( i n T c , i ) 2 ] 1
P c = [ 0.113 + 0.0032 N A i n P c , i ] 2
where Tb,i in K, Tm,i in K, Høform,i in kJ/mol, Hf,i in kJ/mol, Vc,i, in cm3/mol, Tc,i, in K, Pc,i in bar represent the ith group contribution parameters that are associated with the relevant property and with the parameters presented in Table 3.
Acentric factor, ω was estimated using Lee-Kesler method, as follows [24],
ω = α β
where,
α = ln P c 5.97214 + 6.09648 θ + 1.28862 ln θ 0.169347 θ 6
β = 15.2518 15.6875 θ 13.472 ln θ + 0.43577 θ 6
θ = T b T c
Heat of vaporization Hv in kJ/mole at Tb was estimated using Reidel’s method, as follows,
H v = 1.092 R T b [ ln ( P c ) 1.013 ] 0.930 T b T c
The mean density of the DFA mixture was estimated using the so called ‘mixing rule’ represented by the following equation [25,26],
ρ m = i n x i ρ i
where, ρm represents the mean density of the DFA mixture product, xi represents the mole fraction of the ith fatty acid and ρi represents the density of the ith fatty acid in the DFA mixture product. The densities of the component fatty acids of myristic, palmitic stearic acid, oleic acid and cis-vaccenic acid have been specified as 862 kg/m3, 853 kg/m3, 941 kg/m3, 887 kg/m3, and 887 kg/m3, respectively [27].

2.2.3. Analysis Tools and Process Flow Description

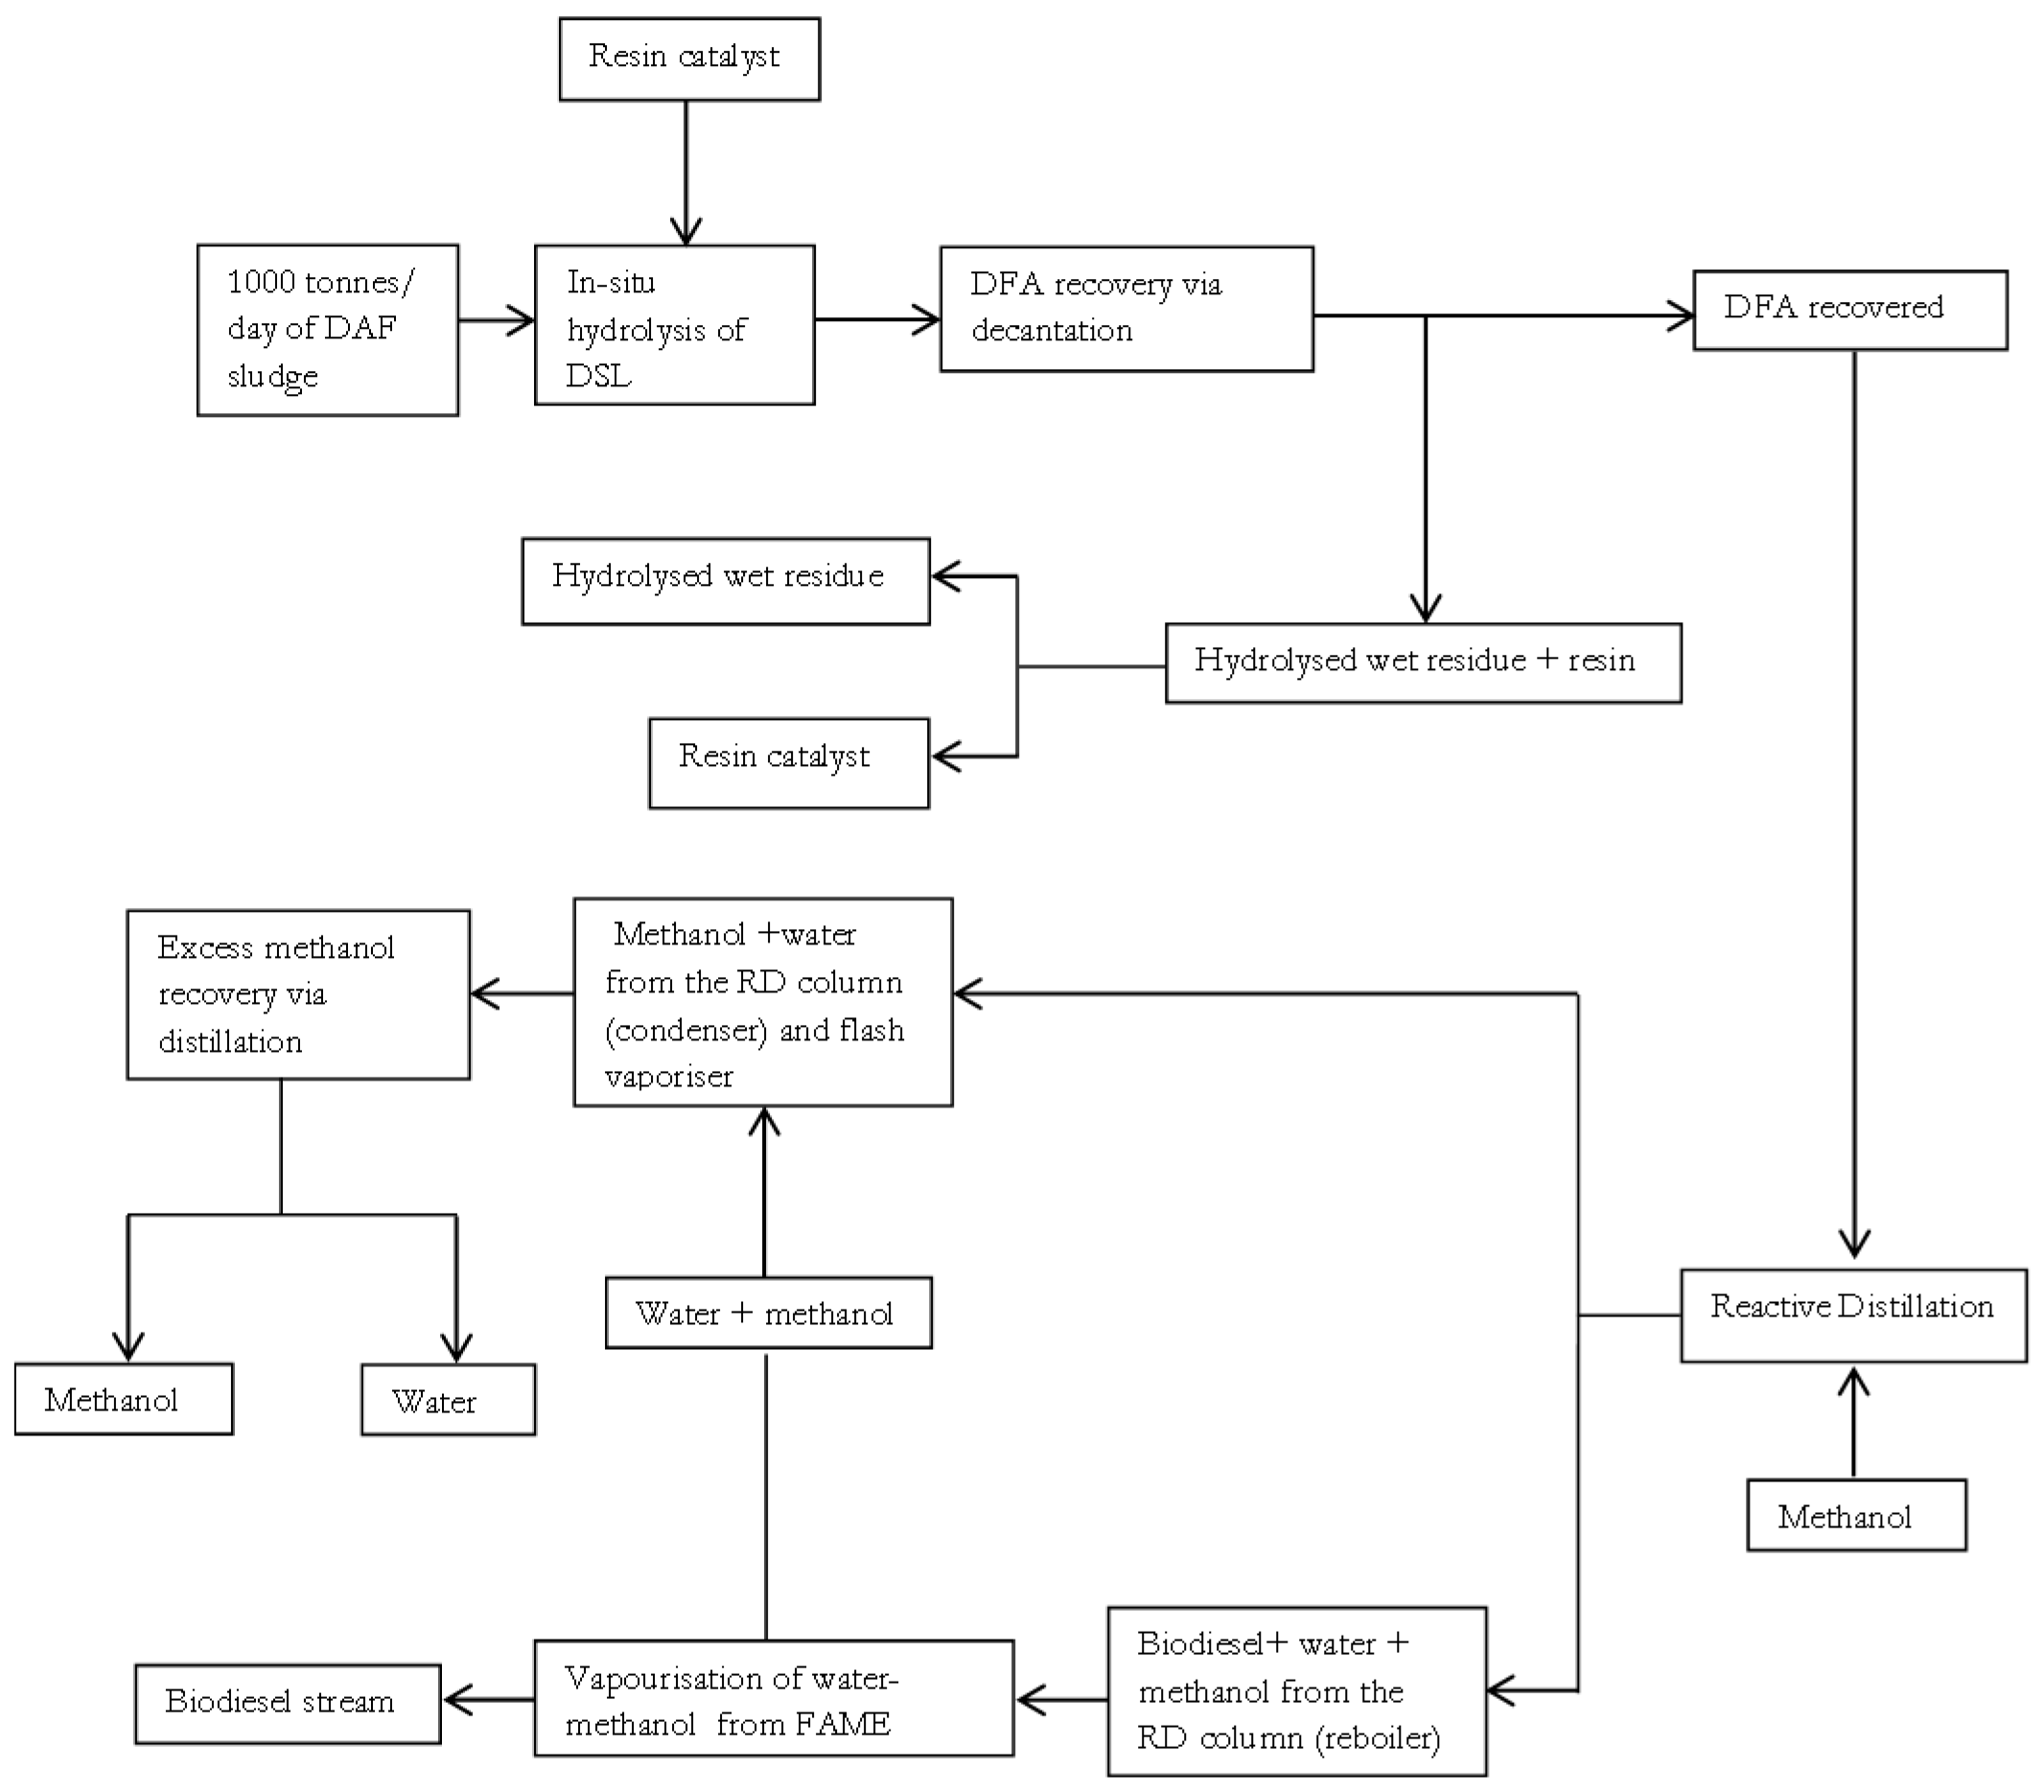
Initially the proper thermodynamic property method to be utilised in the simulation study was determined. To determine the proper thermodynamic property method, the decision steps outlined by Carlson, [28] and the guide provided by Aspen tech [29] were reviewed and employed. The NRTL-Redlich-Kwong property method in ASPEN plus was selected as sufficient in predicting the vapour-liquid equilibria of chemical species in this study, due to its high accuracy level in simulation studies involving complex systems [29]. Having selected a property method in ASPEN plus, the block diagram summarising the base case simplified integrated processes of in-situ hydrolysis and esterification for biodiesel production is shown in Figure 1. The integrated processes of in-situ hydrolysis and esterification may also be referred to as an in-situ hydroesterification process in this study.
In Figure 1, biodiesel production process is achieved using 1000 tonnes/d of meat processing DAF sludge as the low grade lipid source. A simplified and direct (loop-free) process of Figure 1, with feed rate of 1000 tonnes/d for the DAF sludge is initially assumed as base case scenario in this preliminary study with the effects of uncertainties in biodiesel productivity on production energetics and economics investigated in Section 2.3 below. Figure 1 shows that the fed DAF sludge is initially subjected to an in-situ lipid hydrolysis process that occurs under the reaction conditions: catalyst load of 0.09216 wt of resin/wt of wet fresh DAF sludge, temperature of 92.5 °C, and a moisture content of 92 wt % on a wet basis. These reaction conditions are based on the experimental work presented earlier in [10]. The hydrolysed product is then subjected to a decantation operation, under ambient conditions of 25 °C and 1 atm, since fatty acids are typically the least dense non-polar component in the mixture and are essentially immiscible with the polar water phase at mild temperatures [30]. The base case scenario assumes that approximately 99 wt % recovery of DFA is feasible via the decantation operation. The hydrolysed residue is subjected to a separation operation to facilitate resin recovery, under a temperature 25 °C and pressure of 1 atm. The base case scenario also assumes that approximately 100 wt % recovery of resin is feasible for simplicity. The DFA that is recovered is then fed to a reactive distillation (RD) column, for the esterification reaction in the presence of methanol, with subsequent separation of the DAF sludge fatty methyl ester (DSME or biodiesel) and distillate (methanol and water) products achieved in the non-reactive zone of the column. The DSME product is purified via vaporisation to remove any residual water and methanol impurities that may be present. After the vaporisation operation, the methanol and water impurities from the biodiesel product are mixed with the methanol and water distillate of the RD column.
Depending on the mass fraction of methanol present in the recovered methanol-water mixture, the mixture containing methanol and water may be fed to a distillation column to aid further purification of useful methanol for reuse. This study assumes the sufficiency of re-using the recovered methanol directly if a high mass fraction of methanol content of ≥95 wt % in the methanol-water mixture is generated. This is because commercial large scale processes in chemical, pharmaceutical, and even microbiological industries typically utilise industrial grade B methanol which has a mass fraction of about 92 wt % of methanol [31]. Having determined the yield of biodiesel possible in large-scale biodiesel production processing via the in-situ hydrolysis pathway, it is crucial to assess the energetics of the biodiesel production process. Prior to a determination of the total external energy duty that is required in the biodiesel production process, the extent to which process heating and cooling could be met internally was explored.
Energy analysis for reduced cooling and heating duties is undertaken using classic pinch analysis methods that were incorporated in the ASPEN energy Analyser® V.10. The classic pinch analysis method incorporates the assessment of inequalities in heat flow rate and stream splitting rules using tick-off heuristics [32]. The ASPEN energy analyser® is utilised according to the procedure in the literature [33]. The procedure involves the extraction of all thermal data from the simulation output sheet generated by ASPEN plus which highlights the hot and cold streams in the process. The extracted thermal data is then used in constructing a composite curve, which shows the counter-current heat flow of the streams selected for integration and heat recovery. This plot facilitates the determination of the minimum energy consumption target since the overlap of heat availability (hot composite curve) and the heat requirement (cold composite curve) provides an indication of the maximum possible process heat recovery [34]. The determination of the possible heat recovery enables the estimation of the remaining heating requirement (called the minimum hot Q(H)min) and cooling requirements (called the minimum cold Q(C)min). For simplicity we have adopted the minimum allowable temperature difference (ΔTmin) at ‘pinch point’, in a heat exchanger to be 10 °C [35]. The area and number of the shell and tube heat exchangers utilised in this study were also determined using ASPEN energy analyser as a precursor to heat exchanger network capital cost estimation. In addition to energy demand due to heat flow requirements, electrical energy will be required by the mechanical mixers within the in-situ hydrolysis reactor if enhanced mixing of the reactants in the in-situ hydrolysis reactor is to be achieved. ASPEN plus assumes that the complete mixing of the reactant is achieved and thus does not provide an estimate for the duty requirement by the mechanical stirrers. To improve the realism of the results obtained the additional energy duty requirement of mechanical stirring will be obtained by other means. This study recognises that for liquid-solid systems, the energy requirement of the mechanical stirrer is largely dependent on the type of impeller, nature of the mixture, and important reactor geometric parameters [36]. However for a simplified estimation of the reactor mixing energy requirement the average specific electrical power mixing power of 0.5 kW per m3 of the mixture reported by Pangarkar [36] was utilised.

2.2.4. Modelling the Catalysed In-Situ Lipid Hydrolysis and Fatty Acid Esterification Processes

Based on work that is presented earlier in [10], 98% of the mass of DSL was specified as being hydrolysable to produce FA, via the in-situ pathway and under the action of the environmentally benign resin catalyst. It has been proposed that the DSL hydrolysis is occurring as follows,
DSL + 3 H 2 O catalyst Glycerol + 3 DFA
This DSL hydrolysis step was therefore modelled using the simple stoichiometric reactor block of ASPEN plus, according to Equation (23) with a 98% conversion of the DSL being imposed [29]. The esterification reaction of the model DFA using methanol (CH3OH) for DAF sludge methyl ester (DSME) production was modelled as follows,
DFA+ Methanol ⟷ DSME + water
where the rate of the reaction (re) is given as follows,
r e = d [ D F A ] d t = d [ D S M E ] d t = k f [ D F A ] n [ m e t h a n o l ] m k b [ D S M E ] i [ w a t e r ] j
where kf and kb represent the rate constant of the reaction occurring in the forward and backward direction, respectively, which are expressed as,
k f = A f exp E a , f R T
and
k b = A b exp E a , b R T
In Equations (25)–(27), n, m, i, and j represent the order of the reaction (dimensionless) with respect to the chemical species of DFA, CH3OH, DSME, and H2O, respectively, Ea, represents the activation energy of the reaction occurring in the forward (f) or backward (b) direction, respectively, in kJ/kmol, Af and Ab represent the pre-exponential constants of the reaction occurring in the forward (f) and backward (b), respectively, R represents the universal gas constant in kJ/(kmol·K) and T represents the temperature in K.
The kinetic parameters (Ea, n, m, i, j, and A) that describe the esterification of DFA were obtained from the literature based on the esterification reaction of the model FA, to be determined after employing the methods that are discussed earlier in Section 2.2.2. The molar mass of the resulting DSME product was specified as 285.7 kg/kmol based on the work in [9]. The RD column for the esterification reaction is assumed to contain trays having a Murphree efficiency of 100% with heat losses being assumed to be negligible [37,38]. The pressure within the column is assumed to be maintained at 1 atm and a steady state flow in all unit operations is also assumed.
2.3. Environmental Performance and Economic Performance Assessment Approaches

2.3.1. Environmental Performance Assessment

The environmental performance of the in-situ hydroesterification biodiesel production process from DAF sludge is crucial to assessing the technical feasibility of the process. According to [39], the environmental performance of a biodiesel production system is dependent on the fraction of energy sourced from fossil fuels (chemical energy) compared to the energy obtainable from the biodiesel production system. The environmental performance of the biodiesel production process that was discussed in this paper is therefore approximated using the net energy ratio (NER), because the NER is widely regarded as a surrogate measure of renewability and thus is considered as a sufficient metric in most initial sustainability assessments [40]. It is important note that different energy carriers (i.e., electrical and thermal) will have different qualities (i.e., useful work obtainable reflective of the 2nd law of thermodynamics) and thus must be converted to the same energetic form prior to employing the NER method.
The environmental performance of biodiesel production from DSL, in terms of the NER metric was therefore determined by calculating the NER of the process, as follows,
NER = H H V b × P c ( E E η H - E + i n E H - f , i η C - H )
where HHVb represents the higher heating value of the biodiesel product, which was determined to be 39,800 kJ/kg in [9], Pc represents the production capacity of the biodiesel production process in kg/h; EH-f,i represents input heat energy in kJ/h for the ith major equipment, from fossil based sources; EE represents the electrical energy consumed by the mechanical stirrer; ηC-H represents the thermal efficiency of energy conversion from fuel to heat using boilers; and, ηH-E represent the thermal efficiency of energy conversion from fuel to electrical energy. In this study, ηC-H and ηH-E are specified as 0.9 and 0.472 [41,42,43]. In New Zealand the environmental impact from electricity generation will be negligible, since electricity is largely generated from renewable energy sources, such as hydropower. Two cases, thermal (fossil) based electricity generation (denoted as case A) and renewable energy base electricity generation (denoted as case B) will therefore be investigated in the NER calculations. Generally speaking, if the NER ratio is greater than one, then the NER of the overall system presents a favourable energetic performance and it is environmentally sustainable. This is because a NER ratio that is greater than one constitutes the minimum requirement necessary to indicate if the biodiesel production system results in reduced dependency on fossil energy [44]. It is recognised that estimated values of the net input energy input from fossil based sources and Pc represent the base case scenarios, since the determinants of these values may vary in practice, depending on the changes in the energy duties of each unit operation. Possible uncertainty in the estimated NER value due to the variation of these estimates is therefore assessed in future sections (Section 2.4).

2.3.2. Economic Performance Assessment

2.3.2.1. Capital Cost Components

The current work has employed the unit production cost metric as the preferred economic assessment tool, which is defined as the total annualised cost per unit mass of the specified product. This is because this economic assessment approach is widely utilised in the economic assessment of engineering systems more so as it enables an easy comparison of different production processes [22,45,46]. The unit cost of production, C, in US$/kg-biodiesel was determined, as follows [22],
C = C A E C C + C A O C P c
where,
C A E C C = I t , j × [ ( 1 + i ) n × i ( 1 + i ) n 1 ]
and
I t , j = 1.81 × E I S B L , j
In Equations (29)–(31), the constant number 1.81 is the conversion factor for calculating the capital investment cost It,j from EISBL,j, CAECC represents the annual equivalent capital cost in $US, CAOC represents the annual operating cost in $US, It,j represents the total investment cost in $US in year j, i represents the interest rate, given to be 10% for typical biodiesel production processes [47], n represents the plant lifespan, assumed to be 10 years and EISBL,j represents the inside battery limit equipment cost in $US in year j and serves to incorporates the cost that is associated with the utilisation of resources for the acquisition, transportation, and installation of equipment within the processing area [22]. The plant was assumed to operate for 7200 h/year. The estimated values of the CAECC, CAOC and Pc clearly represent the base case scenarios, since the determinants of these values may vary in practice. The uncertainty in the estimated unit cost of production due to the variation of these estimates is also assessed in future sections. EISBL highlighted in Equation (31) was calculated using the Lang factor approach, as follows [48],
E I S B L , j = f L i n C o s t i , j
and
I t , j = I M , j + I H E N , j
In Equation (32), Costi,j represents the equipment purchase cost for the ith equipment in $US in year j and fL represents the Lang factor, given as 3.60 for mixed fluid-solid processing plants [48].
The purchase costs of the major equipment in the process were estimated using standard mapping, sizing, and costing algorithm modules of ASPEN process economic analyser® V.10 (APEA). Crucially costing estimates for mechanical stirrers in the reactors are not provided by APEA V. 10, since complete mixing is assumed, as discussed earlier above. The purchase cost for the mechanical stirrers must therefore be obtained elsewhere. Due to the large masses of the feed streams feed to the process per h, it is proposed that the assumption of complete mixing may not hold in the absence of a mechanical stirrer with the additional purchase cost of the mechanical stirrer or agitator estimated using correlations provided by Towler & Sinnott [49] for propeller mixer. Also, given that the costs employed in the APEA database are based on equipment cost data from 2016 (ASPEN technology Inc., personal communication 1 August 2017), modifications to introduce costing escalations due to inflation must be incorporated. The total capital investment cost for 2017 was therefore estimated using the Chemical Engineering Plant Cost (CEPCI) Index, as follows,
I t , 2017 = I t , 2016 ( C E P C I 2017 C E P C I 2016 )
The values for CEPCI2017 and CEPCI2016 were reported to be 562.1 (as at June 2017) and 541.7 [50,51], respectively.
C o s t s , 2016 = 4866.924 + 2173.138 S 0.8
where Costs, 2016 is the cost of the mechanical stirrer in $US, in 2016; S is the power requirement of the stirrer in kW; the constant number of 4866.924, 2173.138 and 0.8 are the costing correlation constants.
APEN energy analyser® V.10 determined the heat exchanger surface area requirement and number of shell and tube heat exchangers. This is because these parameters are necessary for the estimation of the investment cost of the heat exchange network (HEN). The default costing methodology in ASPEN energy analyser® V.10 was utilised, such that the total investment cost in $US in year 2016 of the HEN required for heat recovery is determined, as follows,
I H E N , 2016 = 10 , 000 + 800 N ( A N ) 0.8
where A represents the total area of the HEN in m2 and N represents the number of shell and tube heat exchangers. The investment cost for the HEN in year 2017 was also determined using the relation presented in Equation (34).

2.3.2.2. Operating Cost Components

The operational cost CAOC refers to the cost associated with utilities, such as energy, labour, repairs, maintenance, and raw materials consumed by the biodiesel production plant per year [22]. In this study, the combined cost of repairs and maintenance was calculated to be 6% of the total investment cost (It) [52]. The cost of chemicals inputs were obtained directly from an electronic commerce website (www.alibaba.com). The cost of the resin catalyst was however modified to account for the cost of the regeneration, as highlighted in Section 1 above. As stated above, the resin catalyst can be regenerated via the replacement of H+ ions utilised in catalysing nucleophilic attack of the DSL lipid molecule. The replacement of the H+ ions is achieved via acid treatment as shown in [10]. The theoretical real cost of the resin is therefore assumed to incorporate the cost of catalyst ‘regeneration’ via acid treatment, such that the real resin cost per 1 kg is estimated as the cost of the resin plus the cost of acid required to regenerate 1 kg of the resin. This approach was employed in a previous study using Amberlyst BD20 as the catalyst [53].
Thus, since as stated in [9], 1 kg of resin contains 4.8 moles of H+ ions, the mass of H2SO4 (selected acid) that can supply this number of moles of H+ ions is assumed to be sufficient in ‘regenerating’ the resin. Given that commercial H2SO4 (98 wt % of H2SO4) produces 20 moles of H+ per 1 kg-H2SO4, only 0.24 kg of the mass of commercial H2SO4 will be required to generate 4.8 moles of H+. The cost of 0.24 kg of commercial H2SO4 was then added to the cost of 1 kg of resin to obtain the so called ‘real’ resin cost. According to the resin manufacturer, the resin cannot be regenerated in perpetuity with its lifespan being dependent on several factors, such as concentration of organics present and operational temperature [54]. This also implies that the lifespan of the resin cannot be quantitatively specified accurately [54]. A resin lifespan of up to six years was nevertheless reported when the resin was utilised in ion exchange operations during water treatment [54]. Recognising however the higher concentration of solids in DAF sludge (8 wt % kg of solids) as compared to the concentration of the solids present in dirty water (0.3 wt % to 1.2 wt %) traditionally handled in water treatment plants, it was assumed that a more frequent replacement of the resin catalyst will be required [55]. It is therefore assumed that fresh batches of the resin are to be introduced every three months.
To estimate the labour cost (Lc), four plant operators have been assumed to be sufficient to operate a fully functional biodiesel production plant such that for 300 plant operational days, the total operating labour cost is $US440,064/year if a payment scale of $US15.28/h holds [56]. It is also assumed that a supervising process engineer contracted to work for only 8 h per day, such that three supervisors are engaged daily. Each supervisor is assumed to have a yearly remuneration of $US56,000/year [56] such that the combined labour cost is $US608,064/year. Natural gas is assumed to be the fuel source for the heating utility and cooling water assumed be sufficient to satisfy the plant cooling requirements. The costs of the natural gas and the cooling water utilised in this study have been obtained from the literature as $US2.48/GJ [57] and $US0.25/GJ [58], respectively. The energy cost per kWh reported as 0.0681/kWh by EIA USA, as the appropriate end user retail price for industries was utilised in estimating the electricity cost [59]. In this study, the depreciation of equipment are assumed to occur linearly over a 10 years utilisation period, such that the depreciation cost (Dc) in $US per y is the total investment cost, It, divided by the 10 years period. The assumption of linear depreciation has been reported as being sufficient for cost efficiency calculations [60]. Finally, for completeness, costs that are not associated with the repair and maintenance of the chemical plant, such as overhead costs (Vc) in $US per y due to internal staff requirements, like onsite office stationaries, were introduced and estimated, as follows [60],
V c = 0.05 ( D c + L c + E c )
where Dc, Lc and Ec represents the depreciation, labour and energy costs in $US per y.

2.4. Uncertainty Assessments of the NER and the Unit Production Cost of the Biodiesel Production Process

A review of Section 2.2 above highlights that several assumptions have been utilised in estimating the NER and the unit production cost of the biodiesel production process. This observation suggests that the NER and the unit production cost may vary with fluctuations in the underlying assumptions. To investigate uncertainties in the NER and unit biodiesel production cost due to the variability of the aforementioned determinants, the Monte Carlo simulation method was utilised. The Monte Carlo simulation method was selected, because it is a powerful statistical tool that utilises randomised sequences of the specified performance determinants to numerically determine the probability density of the estimates of NER and the unit biodiesel production cost, C according to the probability density function that is defined, as follows [60],
f ( x ) = 1 2 π σ e 1 2 ( x μ σ ) 2
where x represents the value of the performance measure (NER and C) for specific conditions of the performance determinants, μ represents the mean value of the performance measure (NER and C), and σ represents the standard deviation of the performance measure.
The likelihood (P) of the performance measures (NER and C) to ‘fall’ within a particular interval, (a, b), is determined by the area under the curve that was generated by the probability density function, as follows [61],
P ( a < x < b ) = a b f ( x ) d x
The detailed expressions of the probability density function used in this study can be found in the literature [62,63]. The uncertainty in the unit biodiesel production cost, C, was investigated for 50% to 150% range of the operating costs, annualised capital cost, and biodiesel productivity, respectively. The uncertainty in the NER value was investigated for a 50% to 150% range of the biodiesel productivity and net energy demand from fossil sources. An arbitrarily specified 1000 different combinations of the annualised capital cost, the annual operating cost, and the DAF sludge feedstock mass rate, for unit cost determinations and combinations of biodiesel production capacity and the energy duty for NER determinations were initially generated using Minitab® V16 (Minitab, LEAD Technologies, Inc., Charlotte, NC, USA) to reduce computational time. The associated unit production costs and NER values for the different cases were then calculated and statistically analysed.

3. Results and Discussion

3.1. The Model DSL and the Model DFA

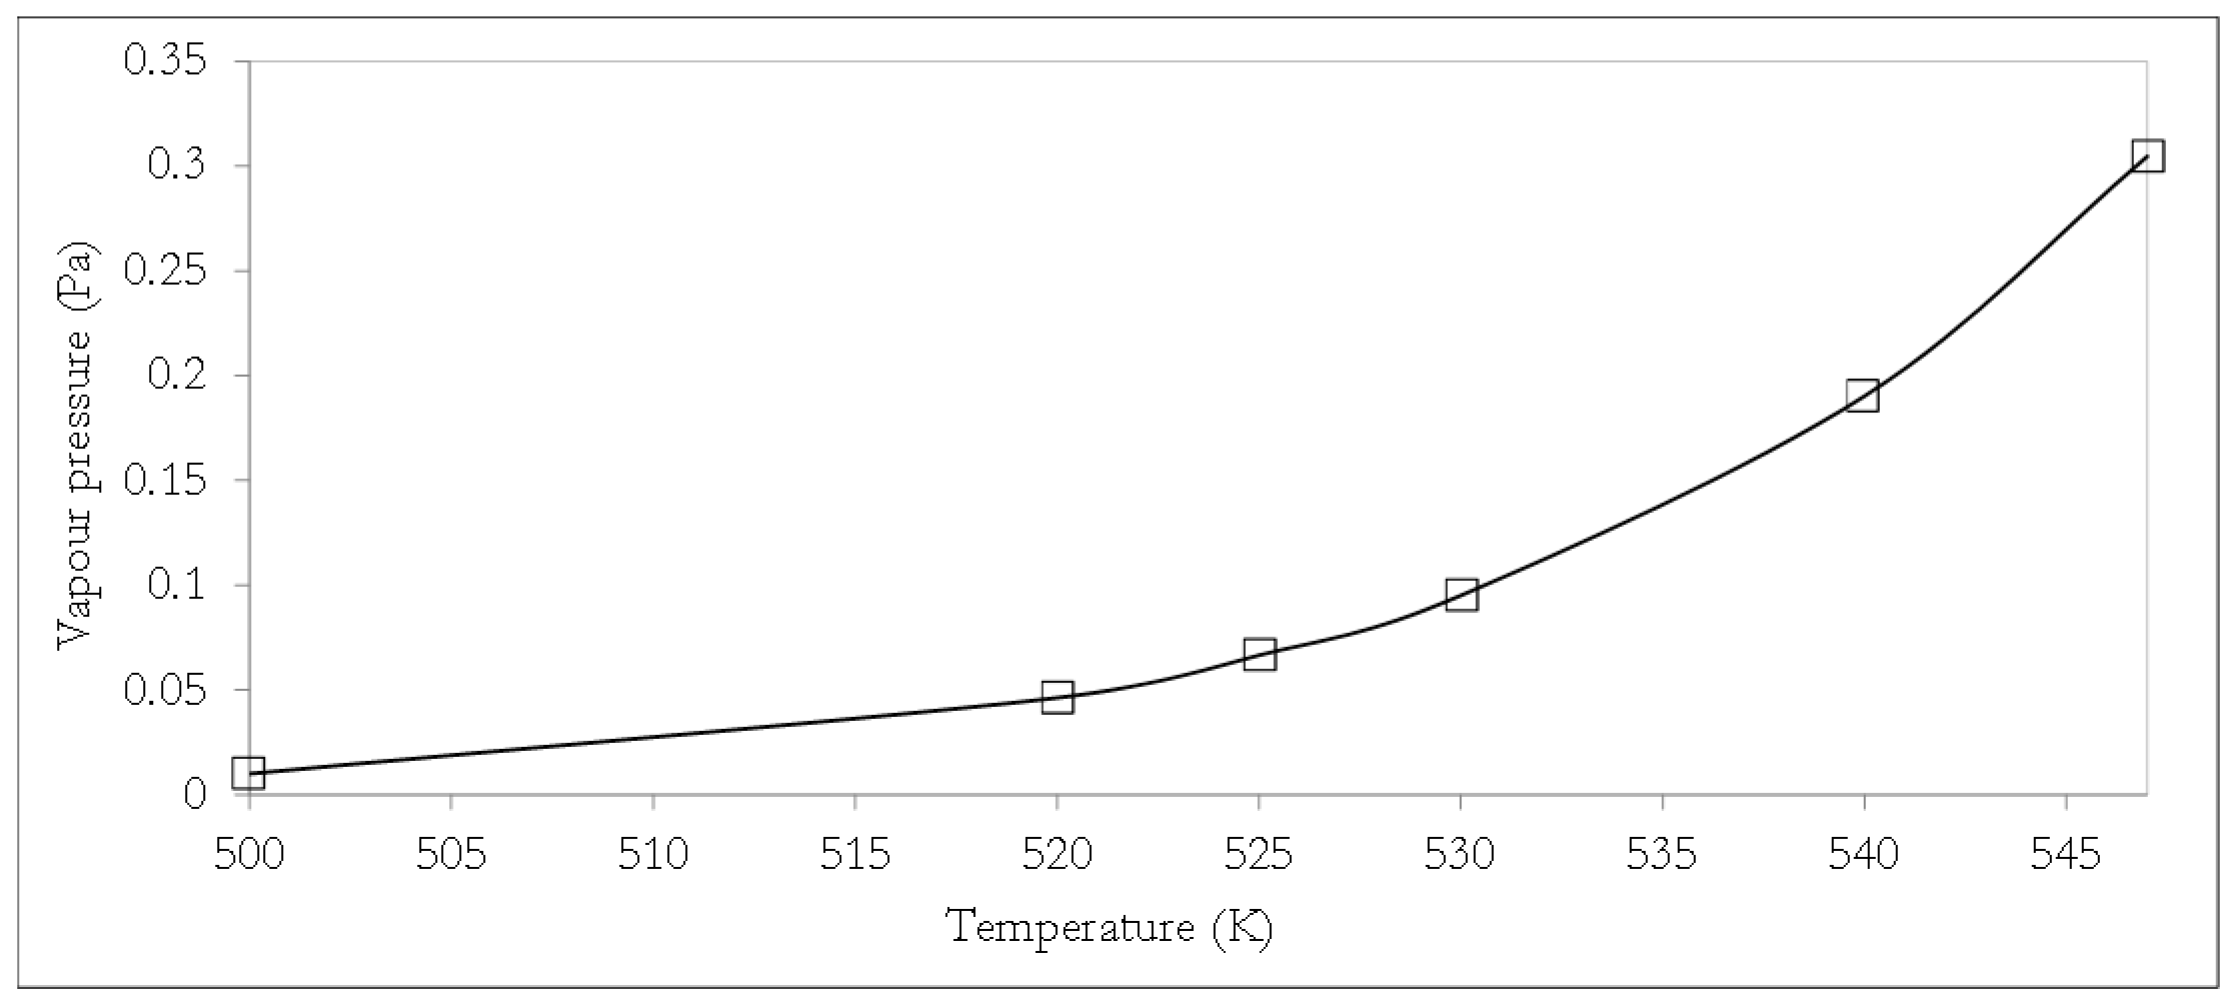
Utilising the determined oleic acid, stearic acid, and palmitic acid fragments of the theoretical DSL molecule, the boiling point of DSL at atmospheric pressure was determined to be 659.9 K less than the boiling temperature of triolein given as 685.95 K. This calculated value is expected, since the theoretical model DSL molecule was estimated to have a shorter carbon chain length. A shorter carbon chain length leads to reduced total bond strength, with the reduced bond strength implying that reduced energy required breaking the bonds and thus reduced boiling point temperatures. The temperature dependence of other properties: density and vapour pressure were also determined and are presented in Figure 2 and Figure 3, respectively.
Figure 2 shows that the density of the DSL will decrease with temperature. It is interesting to note that the density of the DSL decreases approximately linearly (R2 = 0.9975) with temperature, with a slope of 0.682 kg/m3 K, which is similar to the average slope 0.672 kg/m3.K for the density vs temperature (K) plot that was reported by Noureddini et al. [64] for several lipids from different sources.
Figure 3 shows that the vapour pressure of the DSL that increases with temperature, which is expected from the vapour pressure behaviour of pure substances. However, the DSL presents a low vapour pressure (<0.3 Pa), even when it is subjected to high temperatures (>500 K). This observation is expected since both pure triglycerides and triglyceride mixtures, such as 2 oleyl-1,3 di-stearin and soybean oil, respectively, have vapour pressures of ~0.1 Pa when subjected to high temperatures (500–527 K) [65,66].
The reduced vapour pressure is due to the bond strength of the long fatty acid chains within typical triglyceride molecules. Further reductions in vapour pressures were observed as the triglyceride molecule becomes more saturated [16,66].
Table 4 shows the average relative deviations (ARDs) of the estimated mean properties of the DFA mixture relative to the properties of the constituent FAs present in the DFA mixture. All properties have been estimated using the same group contribution estimation methods for to allow for comparisons. From Table 4, it can be seen that the DFA mixture exhibits average properties that are most similar to the properties of oleic acid, as illustrated by the overall lowest ARD values when similar estimation (approximate) methods are employed. Interestingly, when considering the contribution of the major functional groups of -CH3, -CH2-, >CH-, and -COOH that are present in the DFA mixture, the mean molecular formula of the DFA mixture can be shown to be C17.5H33.7O2, which is also very similar to the molecular formula of oleic acid given as C18H34O2. Furthermore, comparing the mean density of the DFA mixture of 893.7 kg/m3 at 25 °C in Table 4 and the mean density of the model DSL from Figure 2 of 902 kg/m3 at 25 °C also shows that DFA is less dense than the DSL, as expected when the density of fatty acids and their parent oils are considered.
As a result of the these highlighted similarities, the average properties of the DFA mixture to oleic acid, the oleic acid molecule was specified as the most appropriate model FA molecule that will be sufficient to model the average behaviour of the DFA mixture and it will enable the achievement of the objectives of this study. The kinetic parameters describing the esterification of oleic acid were therefore selected to simulate the esterification process. Previous studies have shown that an irreversible homogeneous first order kinetic model, relative to the fatty acid. This first order kinetic model constitutes the most appropriate and convenient kinetic model for esterification reactions [67,68]. In the present study, the parameters of the esterification reaction kinetics presented in the investigation undertaken by Patel & Brahmkhatri [68] have been utilised. This is because Patel & Brahmkhatri [68] demonstrated that a high percentage conversion (100%) of the oleic acid to its methyl ester is feasible. In the experimental investigation by Patel & Brahmkhatri, the methanol to oleic acid molar ratio was 40:1 and a solid 12-tungstophosphoric acid catalyst supported on silica was used. According to Patel & Brahmkhatri [68], the activation energy (Ea), reaction order (n), and pre-exponential constant (A) are 44.6 MJ/kmol, first order (relative to oleic acid), and 1.574 h−1, respectively, at a catalyst load of 0.0354 kg of solid 12-tungstophosphoric per kg of oleic acid. These kinetic parameters were utilised to simulate the esterification reaction with methanol as the alkyl group donor. For simplicity, it is assumed that the solid catalyst is localised on the trays within the reactive distillation column.

3.2. Technical Feasibility Assessment

The in-situ hydroesterification biodiesel production process using meat processing DAF sludge as the feedstock has been modelled using the ASPEN plus software and the model output is presented in Figure 4. Table 5 lists the assigned and modelled results of the mass flow rate, temperature, pressure, and mass fractions of the streams of the in-situ hydroesterification biodiesel production process. Based on the results listed in Table 5, the processes in Figure 4 are described here in detail. As shown in Figure 4, the inlet feed streams, wet DAF sludge (DAF-SLDG) containing 92 wt % moisture content (wet basis) at a mass flow rate of 1000 tonnes/d or 41,667 kg/h, temperature condition of 25 °C and pressure condition of 1 atm and the resin-catalyst (RESIN-CT) at a mass flow rate of 3840 kg/h, are initially mixed and the mixture is fed to the in-situ lipid hydrolysis reactor (H-REACT). The in-situ reaction temperature is specified as 92.5 °C and the reaction pressure specified as 1 atm. The hydrolysed product (stream 1) from the reactor is cooled to 25 °C using a heat exchanger (H-1) and it is subsequently fed to a decanter (DFA-DEC). The cooling of the stream is crucial to encourage the immiscibility of the non-polar phase fatty acid (DFA) product and the polar (aqueous) phase and solid residuals (AQ+RES). Having recovered the FAs, the residual aqueous and solid residual mixture (AQ+RES) is fed to a series of resin (catalyst) recovery units (CAT-RECY) that is assumed to be composed of a series of sieves to enable resin recovery (CAT-R). For simplicity, it is also assumed that for the base-case simulation run, 99 wt % of DFA is recovered in the DFA separation process and a 100 wt % of the resin catalyst is recovered from the catalyst recovery units. The separated DFA (stream 2) from the decanter (DFA-DEC) is mixed with excess methanol (METH-F) and the mixture is preheated to 70 °C and then is fed to the reactive distillation column (RDISTIL). The preheating of the methanol-FA mixture is undertaken to reduce the heating duty that may be required by the reboiler of the reactive distillation column (RDISTIL). The esterification reaction is then undertaken under the action of the solid tungstophosphoric acid catalyst. At the conclusion of the esterification reaction, the distillate (stream 5) from the RDISTIL, containing mainly methanol and water, is mixed in the mixer (MIX-2) with the methanol and water that were obtained from the vapourisation process (VAP), which is undertaken to purify the biodiesel product stream (stream 4). The purification of the biodiesel product stream (stream 4) obtained from the reboiler of the RDISTIL, via the vaporisation (VAP) is necessary to remove the volatile methanol and water impurities retained in the biodiesel product to ensure that the European EN 14214 standard for a minimum required FAME content that is specified as 96.5% of the mass of the biodiesel stream [69,70]. The vaporisation operation is undertaken at a temperature of 150 °C and pressure of 1 atm to vaporise any methanol and water impurities that were present in the biodiesel product (stream 4), since biodiesel typically has boiling point temperatures ranging for 340 °C to 375 °C under a pressure of 1 atm [71], implying that the lower boiling temperature impurities will be removed under a high temperature of 150 °C.
The purified biodiesel product, containing ~99 wt % DSME, is then cooled to 25 °C using a heat exchanger (H-3). Since the mixture (stream 7) of the distillate from RDISTIL (stream 5) and the vaporised stream from vaporisation contains 98.6 wt % of methanol, it is assumed that the stream can be sufficiently re-used as a methanol source without the need for further purification. This assumption will facilitate a reduced overall equipment cost. The recovered methanol (stream 7) is then cooled to 25 °C using a heat exchanger (H-4) to ensure that the vaporized methanol is returned to its liquid phase (METH-R) to be re-used in the reaction-distillation process.
From Figure 4 and Table 5, it can be seen that from DAF sludge supplied at a feed rate of 1000 tonnes/d, it is theoretically possible to generate 425.6 kg/h of biodiesel with 98.9 wt % DSME. Given that the mass fraction of lipids that are present in the fresh DAF sludge is 0.01038 wt./wt., the mass feed rate of the lipid fraction is 432.634 kg/h. Also, given that the biodiesel product contains 98.9 wt % of DSME, it shows that the biodiesel product of 425.6 kg/h produced will contain 420.92 kg/h of DSME. The mass of the DSME relative to the mass of the DSL available translates to a yield of 97% in percentage.
The results that are listed in Table 5 also suggest that biodiesel production from 1000 tonnes/d or 41,667 kg/h of high moisture DAF sludge will generate a significant mass of 41,265.7 kg/h of the by-product (AQU) containing mainly water (93 wt %) with small masses of ash (1.8 wt %), carbohydrate (3.5 wt %), proteins (1.8 wt %) and glycerol (0.1 wt %). Clearly, the low mass of glycerol (0.1 wt % fraction) present in this by-product stream does not justify the introduction of additional glycerol purification steps. However, in line with the resource recovery principle, this stream is not considered as waste, but rather a by-product that can effectively serve as a feedstock for secondary biomethane generation via an anaerobic digestion process. The utilisation of this residue as a co-digestion substrate is therefore investigated in another study [72].
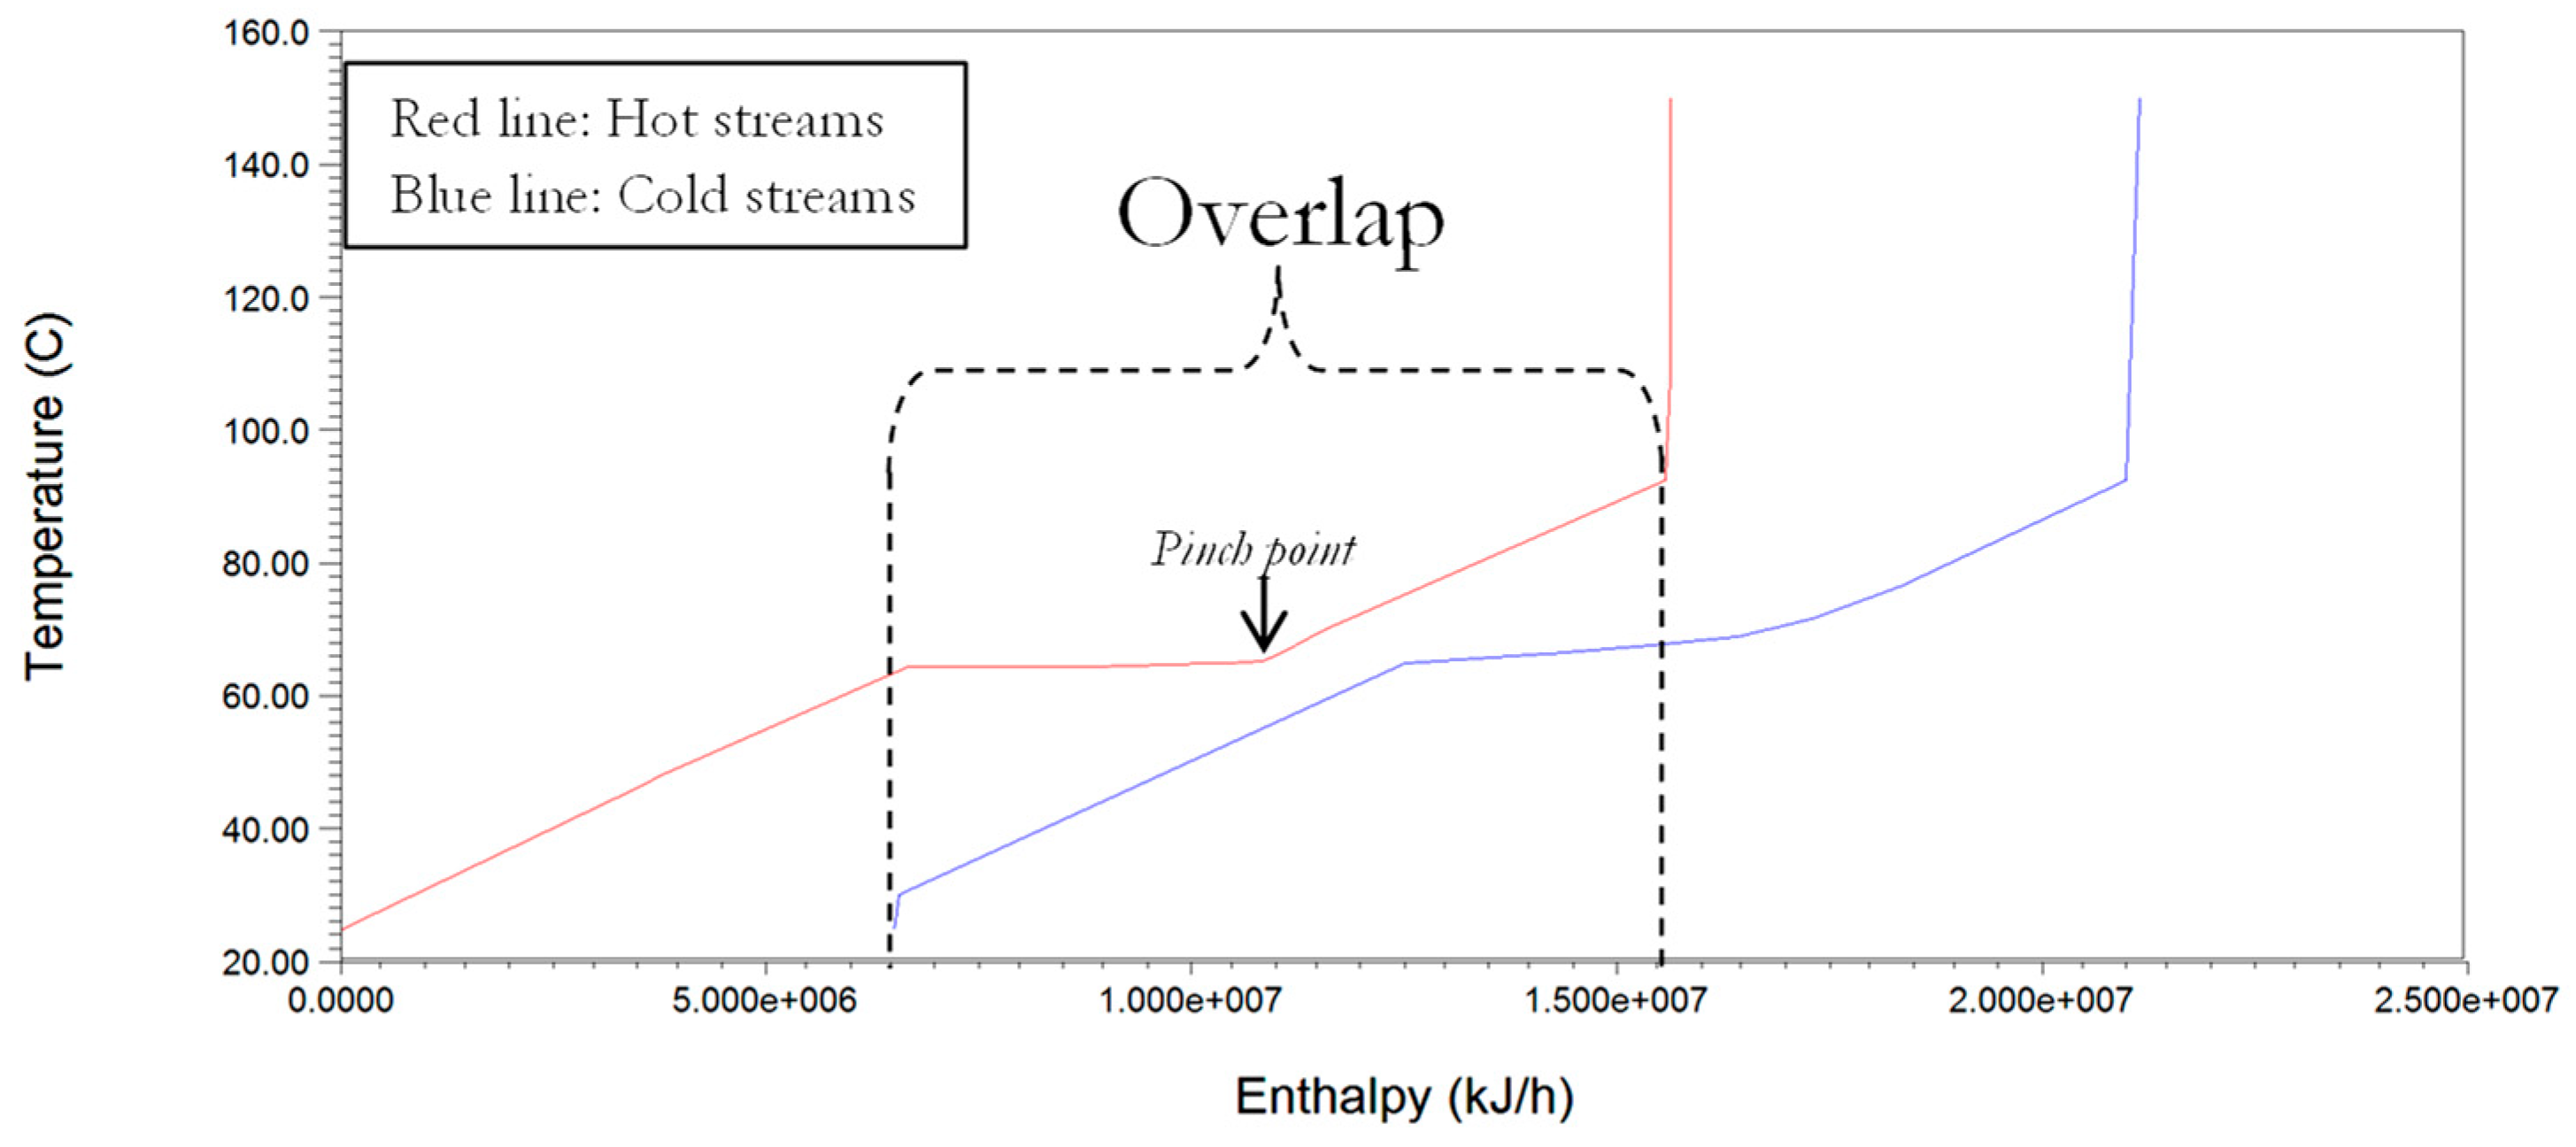
The thermal data that were extracted from the simulation output are listed in Table 6 and utilised to formulate the composite curves (CC) in Figure 5.
Table 6 shows that prior to heat integration duties of 4070.2 kW and 4352.4 kW were required by the heating and cooling utilities respectively. This indicates that heat recovery will be necessary to improve the energetic performance the production process. Therefore, with a pinch temperature difference of 10 °C, Figure 5 has been generated using the inbuilt ASPEN energy analyser®, as previous specified in Section 2.3 above, which employs the classic heat integration methods [33,34,35].
Figure 5 shows the plot of the counter-current heat flow of the hot and cold streams specified in Table 6. From Figure 5 it is seen that there is significant overlap of the hot curve and the cold curve with respect to heat flow and the pinch temperature of 65.2 °C at the pinch point. It has been determined that using eight heat exchangers with a combined area of 627.3 m2, the heating utility and the cooling utility for the biodiesel production process can be reduced from 4070.2 kW (or 14,652.72 MJ/h) and 4352.4 kW (15,668.64 MJ/h) to 1489 kW (5360.4 MJ/h) and 1771 kW (6375.6 MJ/h), respectively.
The energy duties that are required, before and after heat integration, are also illustrated in Figure 6. From this figure, it is seen that the application of heat integration techniques will result in a 63.4% reduction in the heating utility and a 59.3% reduction in the cooling utility, respectively, in the biodiesel production process. It is assumed that the external minimum cooling and minimum heating requirement can be satisfied using cooling water and steam by burning (fossil sourced) natural gas. ASPEN plus V.10 has also estimated that, in addition to duties associated with the hot and cold streams, additional heating duty of 224.1 kW is required by the catalyst separation unit (CAT-RECY) and additional 6.23 kW of cooling duty is required by the FA separation unit (DFA-DEC). This duty is a due to associated enthalpy changes of isothermal and isobaric separation operations involving non-ideal mixtures [73,74,75,76]. The total heating duty required after heat integration has therefore been determined to be 1719.3 kW or 6189.6 MJ/h. In addition to the heating duty, additional energy demand of stirring required for complete mixing of the DAF sludge-resin mixture in the reactor will be required, as discussed in Section 2.3 above. Based on the volume 46.5 m3 of the mixture estimated using the Aspen plus and the average specific mixing power of 0.5 kW per m3 or 1800 kJ/h per m3 [36], the total electrical duty has been estimated to be 23.25 kW (or 83.7 MJ/h).
The electrical energy (stirrer used in the H-REACT) and thermal energy (heating and cooling duties) after heat integration of the biodiesel production process is summarised in Table 7.
Given therefore that the biodiesel production capacity was determined to be 425.6 kg/h and assuming the combined cooling duty can be satisfied using cooling water, the NER value for the base-case scenario can be calculated. Using Equation (28), the NER for case A (electrical energy generated from fossil sources) and case B (electrical energy generated from renewable energy sources), as discussed in Section 2.3.1 above, have been determined to be 2.40 and 2.46, respectively, thus suggesting that for the base case scenario (mass feed rate of 1000 tonnes/d or 41.7 tonnes/h of DAF sludge) the biodiesel production process is renewable for both cases A and B. This is because the energy potential of case A and case B are both 16,938.9 MJ/h, while the total fossil fuel energy demand of case A and case B are 7054.7 MJ/h and 6877.3 MJ/h, respectively. The results also suggest that it is also possible to further enhance the NER value of the biodiesel production process via the employment of thermal energy from non-fossil energy sources, such as hydro energy and geothermal energy which are abundant in New Zealand [77].

3.3. Economic Assessment

Utilising the methods that are described in Section 2.3.2.1 above, the equipment purchase cost has been obtained using the mapping algorithm in ASPEN plus economic assessment (APEA). The inside battery limit cost (ISBL) cost, total investment cost and the annualised capital cost have been subsequently estimated using Equations (30)–(32), respectively, and are presented in Table 8. The mean chemical costs of the solid 12-tungstophosphoric acid catalyst, H2SO4, methanol, and Dowex 50 WX2 resin are found to be $US35 per kg, $US0.37 per kg, $US0.5 per kg, and $US1.25 per kg, respectively, using methods stated above in Section 2.3.2.
From the mass balance results listed in Table 5, it can be observed that the mass flow rate of methanol is 24.56 kg/h, suggesting that 176.8 t of methanol will be required per year. Also, since fresh batches of the resin and solid 12-tungstophosphoric acid catalyst will be introduced every three months, 15.36 tonnes and 56.8 militonnes will be purchased per year, respectively. The distribution of the costing components is presented in Figure 7 below.
Figure 7 shows that the estimated utility cost, repair and maintenance cost, chemical cost, depreciation cost, annualised capital cost, and labour cost are M$US0.13, M$US0.14, M$US0.11, M$US0.23, M$US0.38, and M$US0.61, respectively. The overhead cost of M$US0.042 constitutes the lowest cost component and the total cost expenditure per year is estimated to be M$US1.64. Given that up to 3064 tonnes/year of biodiesel can be produced from 1000 tonnes/d (or 41.7 tonnes/h) of wet meat processing DAF sludge, the unit production (base-case) cost of $US0.54/kg-biodiesel has been determined.

3.4. Uncertainty Investigations and Sensitivity Assessments of the NER and the Unit Production Cost of the Biodiesel Production Process

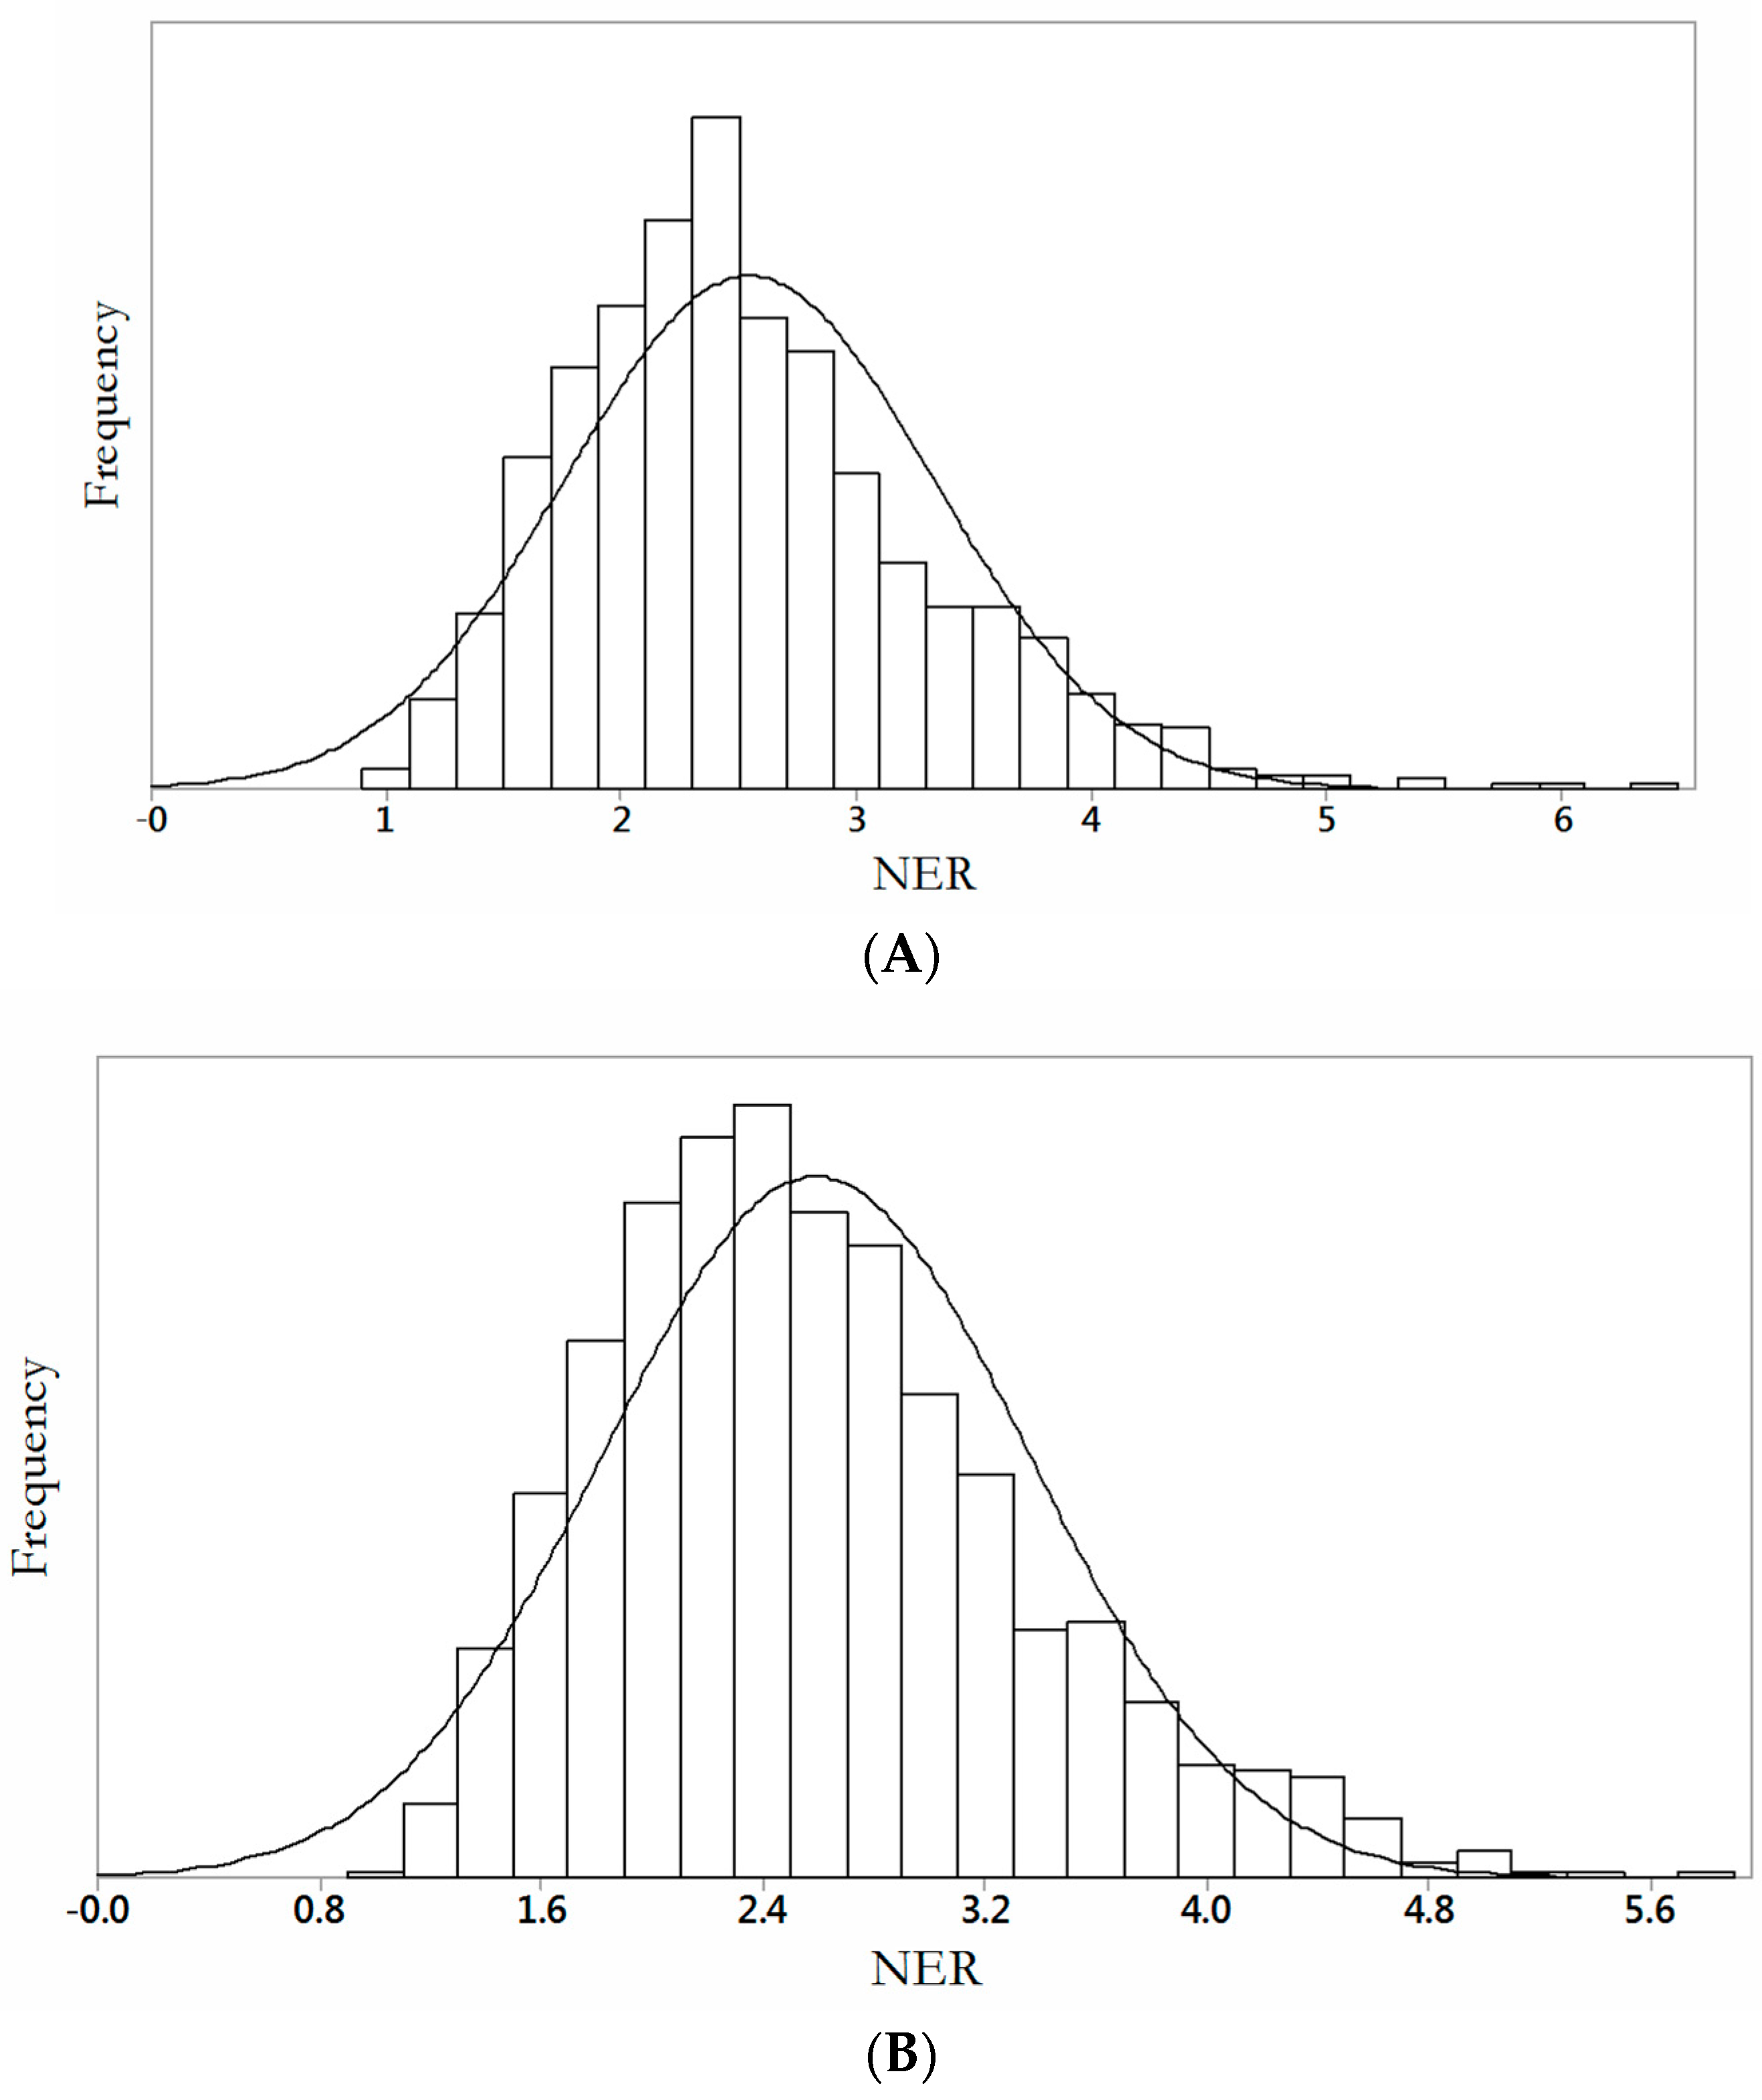
The results of the Monte Carlo simulations reflecting the probability distributions of the NER and the unit production cost (C) due to uncertainties in production capacities, costing determinants of operating cost, and annualised capital cost, as discussed in Section 2.4 above, are presented in Figure 8A,B and Figure 9, respectively. Figure 8A,B refer to the probability distributions of the NER for case A and case B. Figure 9 shows the probability distribution of the unit production cost of the biodiesel production process. For a 95% certainty, Figure 8A,B show that the NER of biodiesel production from DAF sludge for case A and case B ranges from 1.76 to 3.32 and 1.82 to 3.36, respectively. The mean value of the NER for case A and case B is also determined to be 2.54 and 2.59, respectively. For a 95% certainty, Figure 9 shows that the unit production cost of the biodiesel production from DAF sludge will range from $US0.41/kg-biodiesel to $US0.71/kg-biodiesel with an average value of $US0.56/kg-biodiesel. The determined range of the NER values for case A and case B suggests that the biodiesel production process will not lead to net energy consumption, irrespective of the energy source since NER is always larger than 1 in both cases A and B.
It has been observed that the mean unit biodiesel production cost, $US0.56/kg-biodiesel determined in the present study using DAF sludge as the lipid source is lower than the reported unit production cost, $US1.232/kg-biodiesel, of the acid catalysed biodiesel production process using sewage sludge as feedstock, reported in [3]. The lower cost in this present study is largely due to a reduction in the operating cost and a simplification in the system complexities. The reduced operating cost is largely due to the reduced mass of chemical inputs required as the catalysts employed are heterogeneous and re-usable. The reduced system complexity is because of the avoided complex lipid extraction stages, which also require large masses of hexane according to the lipid extraction step employed in [3]. The average unit biodiesel production cost evaluated in this study is also significantly less than the unit biodiesel production cost of $US1.34/kg-biodiesel, if microalgae is utilised as the feedstock, as reported by Lassing et al. [78].
The improved unit biodiesel production cost as compared with the biodiesel production process using microalgae may be explained by recognising that meat processing DAF sludge is essentially freely available. Therefore, the biomass production cost is eliminated. It is important to acknowledge that previous scale-up studies of biodiesel production did not incorporate uncertainty considerations, thus did not present comprehensive insight to the range of possible unit production costs. It must be emphasised that the work presented herein employs so called ‘study-level’ estimation techniques. These ‘study-level’ estimation techniques are a compromise between the less accurate order-of-magnitude method and the more accurate estimate method that require detailed site and process-specific knowledge of costing requirements for the biodiesel production system [79]. It is therefore logical to state that the values presented in this work may be sufficient in supporting future transitions to large-scale biodiesel production using DAF sludge as the feedstock, if the technical challenges that are associated with complete fatty acid recovery and complete catalyst recovery are minimised.

4. Conclusions

In this study, the techno-economic assessment of biodiesel production from meat processing dissolved air flotation (DAF) sludge via an in-situ hydroesterification process was undertaken using ASPEN Plus® V10. To incorporate uncertainties in production capacities, operating cost, and annualised capital cost in the simulation study, Monte Carlo simulations were conducted to investigate the effects of these uncertainties in the determinants of the specified environmental performance and economic performance measures. It has been demonstrated that the mean net energy ratio of the biodiesel production process is 2.54 and 2.59 when electricity is generated from fossil sources (case A) and renewable sources (case B), respectively. These mean net energy ratios have been determined for scenarios where production capacity and the fossil fuel energy demand of the biodiesel production process range from 50% to 150% of the base-case production capacity of 425.6 kg/h and base-case fossil energy demand of 7054.7 MJ/h (case A) and 6877.3 MJ/h (case B), respectively. It was demonstrated that the mean unit biodiesel production cost is $US0.56/kg-biodiesel, for the ranges from 50% to 150% of the base-case of production capacity, annualised capital cost, and operating cost of 425.6 kg/h, $kUS377.1, and $kUS1263.4, respectively. This study established that dissolved air flotation sludge as an unconventional feedstock for biodiesel production via the novel in-situ hydroesterification pathway has the potential of facilitating a significantly cheaper biodiesel product at not significant environmental performance cost.

Author Contributions

The study was undertaken by Oseweuba.

Funding

No external funding.

Acknowledgments

Oseweuba Valentine Okoro gratefully acknowledges the financial support of the University of Otago via the Otago Doctoral scholarship.

Conflicts of Interest

The author declares no conflict of interest.

References

  1. Pandey, A.; Larroche, C.; Ricke, S.C.; Dussap, C.; Gnansounou, E. Biodiesel production in non-catalytic super critical fluid reactions. In Biofuels: Alternative Feedstocks and Conversion Processes, 1st ed.; Elsevier: Oxford, UK, 2011; pp. 339–353. [Google Scholar]
  2. Zahan, K.A.; Kano, M. Biodiesel production from palm oil, its by-products and mill effluent: A review. Energies 2018, 11, 2132. [Google Scholar] [CrossRef]
  3. Olkiewicz, M.; Torres, C.M.; Jiménez, L.; Font, J.; Bengoa, C. Scale-up and economic analysis of biodiesel production from municipal primary sewage sludge. Bioresour. Technol. 2016, 214, 122–131. [Google Scholar] [CrossRef] [PubMed]
  4. Silva, C.; Soliman, E.; Cameron, G.; Fabiano, L.A.; Seider, W.D. Commercial-Scale Biodiesel Production from Algae. Ind. Eng. Chem. Res. 2013, 53, 5311–5324. [Google Scholar] [CrossRef]
  5. Canakci, M.; Van Gerpen, J. Biodiesel production from oils and fats with high free fatty acids. Trans. ASAE 2001, 44, 1429–1436. [Google Scholar] [CrossRef]
  6. Negi, D.S.; Sobotka, F.; Kimmel, T.; Wozny, G.; Schomäcker, R. Glycerolysis of Fatty Acid Methyl Esters: 1. Investigations in a Batch Reactor. J. Am. Oil Chem. Soc. 2013, 84, 83–90. [Google Scholar] [CrossRef]
  7. Kombe, G.; Temu, A.K.; Rajabu, H.M.; Mrema, G.D.; Kansedo, J.; Lee, K.T. Pretreatment of High Free Fatty Acids Oils by Chemical Re-Esterification for Biodiesel Production—A Review. Adv. Chem. Eng. Sci. 2013, 3, 242–247. [Google Scholar] [CrossRef]
  8. Lee, S.Y.; Hubbe, M.A.; Saka, S. Prospects for biodiesel as a byproduct of wood pulping—A review. BioResources 2006, 1, 150–171. [Google Scholar]
  9. Okoro, O.V.; Sun, Z.; Birch, J. Meat processing dissolved air flotation sludge as a potential biodiesel feedstock in New Zealand: A predictive analysis of the biodiesel product properties. J. Clean. Prod. 2017, 168, 1436–1447. [Google Scholar] [CrossRef]
  10. Okoro, O.; Zhifa, S.; Birch, J. Experimental evaluation of a polystyrene sulphonic acid resin catalyst in the hydrolysis of low-grade lipids from the meat processing industry. Biomass Bioenergy 2018, 116, 49–59. [Google Scholar] [CrossRef]
  11. Cruz-Forero, D.; González-Ruiz, O.; López-Giraldo, L. Calculation of thermophysical properties of oils and triacylglycerols using an extended constituent fragments approach. CT&F Cienc. Tecnol. Futuro 2012, 5, 67–82. [Google Scholar]
  12. Zong, L.; Ramanathan, S.; Chen, C. Fragment-Based Approach for Estimating Thermophysical Properties of Fats and Vegetable Oils for Modeling Biodiesel Production Processes. Ind. Eng. Chem. Res. 2010, 49, 876–886. [Google Scholar] [CrossRef]
  13. Espinosa, S.; Fornari, T.; Bottini, S.B.; Brignole, B.A. Phase equilibria in mixtures of fatty oils and derivatives with near critical fluids using the GC-EOS model. J. Supercrit. Fluids 2002, 23, 91–102. [Google Scholar] [CrossRef]
  14. Cardona, C.A.; Rincón, L.E.; Jaramillo, J.J. Integral analysis of feedstocks and technologies for biodiesel production in tropical and subtropical countries. In Proceedings of the Word Renewable Energy Congress, Linköping, Sweden, 8–13 May 2011. [Google Scholar]
  15. Durán, M.A.; Filho, R.M.; Macielc, M.R.W. Rate-Based Modeling Approach and Simulation for Molecular Distillation of Green Coffee Oil. Comput. Aided Chem. Eng. 2010, 28, 259–264. [Google Scholar]
  16. Perry, E.S.; Weber, W.H.; Daubert, B.F. Vapor Pressure of Phlegmatic Liquids I. Simple and Mixed Triglycerides. J. Am. Chem. Soc. 1949, 71, 3720–3726. [Google Scholar] [CrossRef]
  17. NCBI. PubChem Compound. Available online: https://www.ncbi.nlm.nih.gov/pccompound?cmd=search (accessed on 27 October 2017).
  18. Van Krevelen, D.W. Properties of Polymers, 3rd ed.; Elsevier: Amsterdam, The Netherlands, 1990. [Google Scholar]
  19. Saylor. Carbohydrates. 2010. Available online: https://www.saylor.org/site/wp-content/uploads/2010/11/BIO101-Carbohydrates.pdf (accessed on 27 October 2017).
  20. Rajendran, K.; Kankanala, H.R.; Lundin, M.; Taherzadeh, M.J. A novel process simulation model (PSM) for anaerobic digestion using Aspen plus. Bioresour. Technol. 2014, 168, 7–13. [Google Scholar] [CrossRef] [PubMed]
  21. Granjo, J.F.O.; Duarte, B.P.M.; Oliveira, N.M.C. Integrated production of biodiesel in a soybean biorefinery: Modeling, simulation and economical assessment. Energy 2017, 129, 273–291. [Google Scholar] [CrossRef]
  22. Santana, G.C.S.; Martins, P.F.; de Lima da Silvab, N.; Batistellab, C.B.; Maciel Filho, R.; Wolf Maciel, M.R. Simulation and cost estimate for biodiesel production using castor oil. Chem. Eng. Res. Des. 2010, 88, 626–632. [Google Scholar] [CrossRef]
  23. Joback, K.G.; Reid, R.C. Estimation of pure-component properties from group-contributions. Chem. Eng. Commun. 1987, 57, 233–243. [Google Scholar] [CrossRef]
  24. Lee, B.K.; Kesler, M.G. A Generalized Thermodynamic Correlation Based on Three-Parameter Corresponding States. AlChE J. 1975, 21, 510–526. [Google Scholar] [CrossRef]
  25. Benjumea, P.; Agudelo, J.; Agudelo, A. Basic properties of palm oil biodiesel-diesel blends. Fuel 2008, 87, 2069–2075. [Google Scholar] [CrossRef]
  26. Ramírez-Verduzco, L.F. Density and viscosity of biodiesel as a function of temperature: Empirical models. Renew. Sustain. Energy Rev. 2013, 19, 652–665. [Google Scholar] [CrossRef]
  27. Chemspider. Chemspider Search and Share Chemistry. Available online: www.chemspider.com (accessed on 9 April 2017).
  28. Carlson, E.C. Don’t Gamble with Physical Properties for Simulations. Chem. Eng. Prog. 1996, 92, 35–46. [Google Scholar]
  29. ASPEN. ASPEN Plus User Guide; Aspen Technology, Inc.: Cambridge, MA, USA, 2000. [Google Scholar]
  30. Machado, G.D.; de Souza, T.L.; Aranda, D.A.G.; Pessoa, F.L.P.; Castier, M.; Cabral, V.F.; Cardozo-Filho, L. Computer simulation of biodiesel production by hydro-esterification. Chem. Eng. Process. 2016, 103, 37–45. [Google Scholar] [CrossRef]
  31. EUROCHEM. Methanol. Available online: http://www.eurochemgroup.com/en/product/methanol/ (accessed on 22 November 2017).[Green Version]
  32. Martín, A.; Mato, F.A. Hint: An educational software for heat exchanger network design with the pinch method. Educ. Chem. Eng. 2008, 3, 6–14. [Google Scholar] [CrossRef]
  33. Sadhukhan, J.; Ng, K.S.; Martinez-Hernandez, E. Heat integration and utility system design. In Biorefineries and Chemical Processes: Design, Integration and Sustainability Analysis, 1st ed.; Wiley: Chichester, UK, 2014; pp. 63–91. [Google Scholar]
  34. Linnhoff, B.; Flower, J.R. Synthesis of heat exchanger networks: I. Systematic generation of energy optimal networks. AIChE J. 1978, 24, 633–642. [Google Scholar] [CrossRef]
  35. Sinnot, R.; Towler, G. Chemical Engineering Design, 5th ed.; Elsevier: Burlington, NJ, USA, 2009. [Google Scholar]
  36. Pangarkar, V.G. Design of Multiphase Reactors; John Wiley & Sons, Inc.: Hoboken, NJ, USA, 2015. [Google Scholar]
  37. Alfradique, M.F.; Castier, M. Automatic Generation of Procedures for the Simulation of Reactive Distillation Using Computer Algebra. Comput. Chem. Eng. 2005, 29, 1875–1884. [Google Scholar] [CrossRef]
  38. Machado, G.D.; Aranda, D.A.G.; Castier, M.; Cabral, V.F.C.; Cardozo-Filho, L. Biodiesel Production by Esterification of Hydrolyzed Soybean Oil with Ethanol in Reactive Distillation Columns: Simulation Studies. Ind. Eng. Chem. Res. 2013, 52, 9461–9469. [Google Scholar] [CrossRef]
  39. Sheehan, J.C.V.; Duffield, J.; Graboski, M.; Shapouri, H. Life Cycle Inventory of Biodiesel and Petroleum Diesel for Use in an Urban Bus/SR-580-24089 Golden, Colorado; National Renewable Energy Laboratory: Golden, CO, USA, 1998.
  40. Hill, J.; Nelson, E.; Tilman, D.; Polasky, S.; Tiffany, D. Environmental, economic and energetic costs and benefits of biodiesel and ethanol biofuels. Proc. Natl. Acad. Sci. USA 2006, 30, 11206–11210. [Google Scholar] [CrossRef] [PubMed]
  41. Freris, L.; Infield, D. Renewable Energy in Power Systems; Wiley: New York, NY, USA, 2008. [Google Scholar]
  42. Europe-Environmental-Agency. Efficiency of Conventional Thermal Electricity and Heat Production. Available online: https://www.eea.europa.eu/data-and-maps/indicators/efficiency-of-conventional-thermal-electricity-generation-4/assessment-1 (accessed on 7 August 2018).
  43. Eurelectric. Efficiency in Electricity Generation; VGB PowerTech e.V.: Essen, Germany, 2003. [Google Scholar]
  44. Silalertruksa, T.; Gheewala, S.H. Environmental sustainability assessment of bio-ethanol production inThailand. Energy 2009, 34, 1933–1946. [Google Scholar] [CrossRef]
  45. Haas, M.J.; McAloon, A.J.; Yee, W.C.; Foglia, T.A. A process model to estimate biodiesel production costs. Bioresour. Technol. 2006, 97, 671–678. [Google Scholar] [CrossRef] [PubMed]
  46. Chen, J.; Tyagi, R.D.; Li, J.; Zhang, X.; Drogui, P.; Sun, F. Economic Assessment of Biodiesel Production from Wastewater Sludge. Bioresour. Technol. 2018, 253, 41–48. [Google Scholar] [CrossRef] [PubMed]
  47. Duncan, J. Costs of Biodiesel Production; Energy Efficiency and Conservation Authority: Wellington, New Zealand, 2003. [Google Scholar]
  48. Sinnott, R.K. Chemical engineering. In Chemical Process Design; Butterworth–Heinemann: London, UK, 1996. [Google Scholar]
  49. Towler, G.; Sinnott, R. Chemical Engineering Design: Principles, Practice and Economics of Plant and Process Design; Elsevier: Amsterdam, The Netherlands, 2008. [Google Scholar]
  50. Chemengonline. CEPCI Updates. Available online: www.chemengonline.com (accessed on 23 February 2018).
  51. Chemengonline. Current Economic Trends. Available online: www.chemengonline.com/current-economic-trends-march-2016/?printmode=1 (accessed on 3 April 2017).
  52. Zhang, Y.; Dubé, M.A.; McLean, D.D.; Kates, M. Biodiesel production from waste cooking oil. 2. Economic assessment and sensitivity analysis. Bioresour. Technol. 2003, 89, 229–240. [Google Scholar] [CrossRef]
  53. Omberg, K.S. Small-Scale Biodiesel Production Based on a Heterogenous Technology. Master’s Thesis, Norwegian University of Life Sciences, Ås, Norway, 2015. [Google Scholar]
  54. DOW. Ion Exchange Resins: Resin Wear-Out Guidelines; Dow Chemical Company: Midland, MI, USA, 2016. [Google Scholar]
  55. FAO. Wastewater Characteristics and Effluent Quality Parameters. Available online: http://www.fao.org/docrep/t0551e/t0551e03.htm (accessed on 22 October 2017).
  56. Payscale. Chemical Plant Operators. Available online: http://www.payscale.com/research/US/Job=Chemical_Plant_Operator/Hourly_Rate (accessed on 31 December 2017).
  57. Index-Mundi. Natural Gas. 2017. Available online: http://www.indexmundi.com/commodities/?commodity=natural-gas (accessed on 19 December 2017).
  58. Torres, C.M.; Ríos, S.D.; Torras, C.; Salvadó, J.; Mateo-Sanz, J.M.; Jiménez, L. Sustainability analysis of biodiesel production from Cynara Cardunculus crop. Fuel 2013, 111, 535–542. [Google Scholar] [CrossRef]
  59. EIA. Electricity Monthly Update-July; U.S. Energy information Administration: Washington, DC, USA, 2017.
  60. Vogel, H.G. Process Development: From the Initial Idea to the Chemical Production Plant; Wiley: Weinheim, Germany, 2014. [Google Scholar]
  61. Shemfe, M.; Gu, S.; Fidalgo, B. Techno-economic analysis of biofuel production via bio-oil zeolite upgrading: An evaluation of two catalyst regeneration systems. Biomass Bioenergy 2017, 98, 182–193. [Google Scholar] [CrossRef]
  62. Ou, L.; Thilakaratne, R.; Brown, R.C.; Wright, M.W. Techno-economic analysis of transportation fuels from defatted microalgae via hydrothermal liquefaction and hydroprocessing. Biomass Bioenergy 2015, 72, 45–54. [Google Scholar] [CrossRef]
  63. Weisstein, E. Triangular Distribution; Wolfram MathWorld: Boston, MA, USA, 2017. [Google Scholar]
  64. Noureddini, H.; Teoh, B.C.; Clements, L. Densities of Vegetable Oils and Fatty Acids. J. Am. Oil Chem. Soc. 1992, 69, 1184–1188. [Google Scholar] [CrossRef]
  65. NIIR. Modern Technology of Oils, Fats & Its Derivatives, 2nd revised ed.; Asia Pacific Press: Delhi, India, 2013. [Google Scholar]
  66. Oreopoulou, V.; Krokida, M.; Marinos-Kouris, D. Frying foods. In Handbook of Industrial Drying, 4th ed.; CRC Press: New York, NY, USA, 2015; pp. 1189–1208. [Google Scholar]
  67. Ilgen, O. Investigation of reaction parameters, kinetics and mechanism of oleic acid esterification with methanol by using Amberlyst 46 as a catalyst. Fuel Process. Technol. 2014, 124, 134–139. [Google Scholar] [CrossRef]
  68. Patel, A.; Brahmkhatri, V. Fuel Processing Technology. Kinetic study of oleic acid esterification over 12-tungstophosphoric acid catalyst anchored to different mesoporous silica supports. Fuel Process. Technol. 2013, 113, 141–149. [Google Scholar] [CrossRef]
  69. EN. Automotive Fuels-Fatty Acid Methyl Esters (FAME) for Diesel Engines—Requirement Methods; European Committee for Standardization (CEN): Brussels, Belgium, 2009. [Google Scholar]
  70. Kay, K.H.; Yasir, S.M. Biodiesel Production from Low Quality Crude Jatropha Oil Using Heterogeneous Catalyst. APCBEE Procedia 2012, 3, 23–27. [Google Scholar] [CrossRef]
  71. Goodrum, J.W. Volatility and boiling points of biodiesel from vegetable oils and tallow. Biomass Bioenergy 2002, 22, 205–211. [Google Scholar] [CrossRef]
  72. Okoro, O.V.; Sun, Z.; Birch, J. Prognostic assessment of the viability of hydrothermal liquefaction as a post-resource recovery step after enhanced biomethane generation using co-digestion technologies. in press.
  73. Martınez, F.; Gomez, G. Thermodynamic Study of the Solubility of Some Sulfonamides in Octanol, Water, and the Mutually Saturated Solvents. J. Solut. Chem. 2001, 30, 909–923. [Google Scholar] [CrossRef]
  74. Qian, J.W.; Privat, R.; Jaubert, J.N.; Duchet-Suchaux, P. Enthalpy and heat capacity changes on mixing: Fundamental aspects and prediction by means of the PPR78 cubic equation of state. Energy Fuels 2013, 27, 7150–7178. [Google Scholar] [CrossRef]
  75. Mikheev, Y.A.; Guseva, L.N.; Davydov, E.Y.; Ershov, Y.A. The hydration of hydrophobic substances. Russ. J. Phys. Chem. A 2007, 81, 2119–2136. [Google Scholar] [CrossRef]
  76. Shiotsubo, T.; Takahashi, K. Changes in enthalpy and heat capacity associated with the gelatinization of potato starch, as evaluated from isothermal calorimetry. Carbohydr. Res. 1986, 158, 1–6. [Google Scholar] [CrossRef]
  77. MBIE. Energy in New Zealand. Available online: http://www.mbie.govt.nz/info-services/sectors-industries/energy/energy-data-modelling/publications/energy-in-new-zealand/documents-images/energy-in-nz-2017.pdf (accessed on 27 October 2017).
  78. Lassing, M.; Hulteberg, C.; Mårtensson, P.; Karlsson, H.T.; Børre, E.O.; Børresen, T.; Svensson, M.; Eklund, H. Final Report on Biodiesel Production from Microalgae: A Feasibility Study; StatoilHydro ASA: Oslo, Norway, 2008. [Google Scholar]
  79. Mussatti, D.C.; Vatavuk, W.M. Cost Estimation: Concepts and Methodology. Available online: https://www3.epa.gov/ttn/ecas/docs/cs1ch2.pdf (accessed on 19 July 2018).
Figure 1. In-situ hydroesterification process for biodiesel production.
Agriengineering 01 00003 g001
Figure 2. Variation of the density of DAF sludge lipids (DSL) with temperature.
Agriengineering 01 00003 g002
Figure 3. Variation of the vapour pressure of the DSL with temperature.
Agriengineering 01 00003 g003
Figure 4. In-situ hydroesterification of DAF sludge simulation ASPEN model output based on the simplified block diagram in Figure 1 above.
Agriengineering 01 00003 g004
Figure 5. Composite curves (CC) for minimum driving temperature of 10 °C for the biodiesel production process as generated by ASPEN energy analyser®.
Agriengineering 01 00003 g005
Figure 6. Energy duty of the biodiesel production process before and after heat integration.
Agriengineering 01 00003 g006
Figure 7. Cost distribution for the biodiesel production process using DAF sludge as feedstock.
Agriengineering 01 00003 g007
Figure 8. Frequency distribution function of the net energy ratio (NER) for the biodiesel production process. (A) denotes electricity generation from fossil sources and (B) denotes electricity generation from renewable sources.
Agriengineering 01 00003 g008
Figure 9. Frequency distribution function of the unit production cost for the biodiesel production process.
Agriengineering 01 00003 g009
Table 1. The dissolved air flotation (DAF) sludge fatty acid distribution.
Common NameIUPAC NameCompound IDMole Fraction of Fatty Acids
Myristic acidTetradecanoic acidC14:00.0598
Palmitic acidHexadecanoic acidC16:00.3162
Stearic acidOctadecanoic acidC18:00.3504
Oleic acid9-octadecenoic acidC18:1 (cis 9)0.1795
Cis vaccenic acid11-octadecenoic acidC18:1 (cis 11)0.0941
Table 2. Chemical constituent fragment (CCF) model parameters used in the present study.
* Constituent FragmentMolecular Structure of the Constituent FragmentsDi (kmol/m3)Ci (K−1)Hi (K)Ii (K)
Glycerol-OCH2CH(O-)CH2O20.0480.0007692317.7446
Stearic acidCH3(CH2)16CO4.63260.001409128.5443
Oleic acidCH3(CH2)7CH=CH(CH2)7CO4.29240.000986528.5443
Palmitic acidCH3(CH2)14CO5.05240.001300827.3427
* The effect of the double bonds on the adjusted fragment parameter is negligible [12,16].
Table 3. Relevant Joback’s group contribution parameters.
GroupTcPcVcTbTmHøformHf,
-CH30.0141−0.00126523.58−5.1−76.450.908
-CH2-0.018905622.8811.27−20.642.59
>CH-0.01640.0024121.7412.6429.890.749
-COOH0.07910.007789169.09155.5−426.7219.537
Table 4. Estimated average properties of the DAF fatty acid (DFA) mixture compared with the estimated properties of the major fatty acid (FA) in the mixture.
Property Estimated aDFAMyristic AcidARDPalmitic AcidARDStearic AcidARDOleic acid bARD
Critical temperature, Tc (K)921.26841.640.09887.340.04935.120.01933.30.01
Critical pressure, Pc (bar)13.3016.350.1914.080.0612.250.0913.190.01
Critical volume, Vc (m3/kmol)1.020.8430.210.9560.071.0680.051.0380.02
Acentric factor, ω1.081.010.061.04400.031.04030.051.090.01
Heat of formation, Høform (kJ/mol)−691.16−682.560.01−723.840.05−765.120.01−664.060.04
Heat of vaporization Hv (kJ/mol)86.2977.070.1281.820.0584.940.1088.23370.02
Heat of fusion, Hf (kJ/mol)48.8642.160.1647.340.0352.520.0248.8370.00
Boiling temperature, Tb (K)743.29665.230.12710.990.05756.750.07754.470.01
Density at 25 °C (kg/m3)893.78620.04853.00.05941.00.05887.00.01
a All properties of the DFA and the major FAs are estimated using the same methods to justify comparison as stated above, b Oleic acid is an isomer of cis-vaccenic acid and thus cis-vaccenic acid is estimated to exhibit similar properties.
Table 5. Mass balance results of the major product streams of the simulation ASPEN model output.
Stream NameDAF-SLDGRESIN-CT123567BIODISLAQUCAT-RMETH-FMETH-R
Temperature (°C)252592.5252564.7150652525252525
Pressure (Pa)101,325101,325101,325101,325101,325101,325101,325101,325101,325101,325101,325101,325101,325
Mass fractions, x
DSL (x)0.010000000000000
DFA (x)000.0091.0000.175TraceTraceTraceTraceTrace00Trace
Water (x)0.92000.842000.0050.1400.0130.0030.929000.013
Glycerol (x)000.0010000000.001000
Methanol (x)00000.8250.9950.8520.9860.008001.0000.986
Ash (x)0.01700.0160000000.018000
Carbohydrate (x)0.03500.0320000000.035000
Proteins (x)0.01700.0160000000.018000
DSME (x)00000Trace0.00800.9890000
Resin (catalyst) (x)01.0000.084000000Trace1.00000
Mass Flows (kg/h)41,666.73840.045,506.7401.02292.81754.9112.31867.2425.641,265.73840.01891.81867.2
Table 6. Hot and cold streams extracted from Simulation flowsheet for the biodiesel production process.
Stream DescriptionTemperature (°C)Duty (Enthalpy Change)
SourceTarget(kW)
Hot streams
7_To_METH-R64.925.0113.0
8_To_BIODISL150.025.031.8
Condenser at RDISTIL_TO_565.564.71076.9
1_To_1-192.525.03130.7
Sum 4352.4
Cold streams
Reboiler at RDISTIL_TO_466.776.6580.7
VAP_heat76.6150.062.0
3_To_3-125.070.0597.7
H-REACT_heat30.292.52829.8
Sum 4070.2
Table 7. Thermal and electrical duty of the biodiesel production process.
Energy DemandEnergy CarrierTotal Value Calculated (MJ/h)
Heating dutyThermal6189.6
Cooling dutyThermal6375.6
Electrical dutyElectricity83.7
Table 8. Costing estimations based on the purchase cost of major equipment.
EquipmentPurchase Cost ($kUS)
RDISTIL-reflux pump4.6
RDISTIL-condenser accumulator13
DFA-DEC15.7
VAP-flash vessel15.7
CAT-RECY18.2
Stirrers32.7
RDISTIL-tower85.2
H-REACT124.8
Total purchase cost2016309.0
ISBL cost20161112.4
Investment cost (IM, 2016)2013.4
HEN Investment cost (IHEN, 2016)219.7
Total investment cost (It, 2017)2317.3
Annualised capital cost377.1