Article

A Multimodal Learning Approach for Protecting the Metro System of Medellin Colombia Against Corrupted User Traffic Data

by
Josue Genaro Almaraz-Rivera
1,
Jose Antonio Cantoral-Ceballos
1,*,
Juan Felipe Botero
2,*,
Francisco Javier Muñoz
3 and
Brian David Martinez
3
1
Tecnologico de Monterrey, School of Engineering and Sciences, Av. Eugenio Garza Sada 2501, Monterrey 64700, Nuevo Leon, Mexico
2
Universidad de Antioquia, Electronics and Telecommunications Engineering Department, GITA-Lab, Calle 67 N.º 53-108, Medellin 050010, Antioquia, Colombia
3
Aligo Defensores Informaticos S.A.S., Carrera 43B N.º 16-95 Oficina 1601, Medellin 050021, Antioquia, Colombia
*
Authors to whom correspondence should be addressed.
Smart Cities 2025, 8(6), 198; https://doi.org/10.3390/smartcities8060198
Submission received: 13 October 2025 / Revised: 22 November 2025 / Accepted: 25 November 2025 / Published: 27 November 2025

Highlights

What are the main findings?
  • The novel concepts of Self-Supervised Tabular Learning and Large Multimodal Models are integrated to create a multimodal learning solution for auditing the metro system of Medellin, Colombia.
  • On publicly available data, in an offline process, corrupted user traffic is detected, explained, and corroborated using SHAP values and the image understanding process of a Large Multimodal Model.
What are the implication of the main findings?
  • A visibility layer is added for smart proper policy making, also shedding light on the pros and opportunities of the current publicly available data.
  • Each abnormal passenger behavior is not only flagged, but a thorough justification is also provided to enhance the robustness of the detections.

Abstract

A critical task in infrastructure security is to model user traffic in transportation systems to alert whenever anomalous behavior is observed. Discerning those abnormal samples is possible by auditing the available data, which then enables proper policy making to guarantee fair tariffs and the design of strategies to tackle problems such as passenger congestion. In this paper, we present an offline cybersecurity approach for the multimodal modeling of user traffic for the Colombian metro. To identify the anomalies, we design custom Deep Autoencoders based on the embeddings produced by the Self-Supervised Learning TabNet architecture. Additionally, we provide explainability through a SHAP-based component and the analysis of external image data using LLaVA as the selected Large Multimodal Model. The results indicate that most problems that occur on one metro line also affect the other, demonstrating the interconnectivity of the metro system, a crucial aspect that motivates the coordinated emergency response to improve the passenger travel experience. Although the detected problems might already have been identified and reported on social media, the transparency provided helps create confidence when an abnormality is observed, and in case there is no backup information on our official external data sources, it represents an alert to examine it more deeply, becoming an intelligent assessment tool for the metro. This article also sheds light on the potential of the publicly available dataset used and the importance of expanding its existing variables and information.

1. Introduction

Infrastructure security is a relevant research area for protecting the goods and services of modern societies, ranging from Smart Grid systems [1] to transportation technology. Transportation encompasses not only the protection of the in-vehicle networks for self-driving cars [2] but also the security of bus and metro systems, including their several routes, the movement of people, and the monitoring of user traffic behavior [3].
As an example, the Metropolitan Transportation Authority of New York, in the United States, provides information on the use of the metro system in the city, including updated data on the ridership between stations, allowing policy making for the expansion of the metro with new wagons, the discussion of stopping fare evaders, as well as the impact of congestion pricing [4,5,6].
In this paper, as part of an effort to replicate in Latin America successful initiatives undertaken in cities such as New York to modernize transportation systems, we employ recently released public data from the Colombian metro [7]. Although passenger fares are fixed, regardless of the number of traveled stations [8], by using the information on the hourly number of users in each metro line, we can provide intelligence on policy making to reduce commute times by allocating wagons when necessary, while also laying foundational work toward a dynamic tariff policy with fairer prices suitable for heterogeneous demands across stations. Transportation-related policies are vast in scope, so we are targeting those where the primary objective is traffic management and transportation safety [9], based on the results and observations obtained from this public dataset.
To achieve this visibility level for the Colombian metro, we design a smart cybersecurity solution to flag and automatically explain any abnormal behavior detected. These anomalies can be seen as corrupted data continuously fed into the currently available control dashboards [10], for example, due to extreme weather conditions, repairs, social events, or early closures that affect the metro lines.
Given that the available information is provided in tabular format, and motivated by the recent advances in tabular learning and Self-Supervised Learning (S-SL) [11], we propose two Deep Autoencoders based on the embeddings produced by the TabNet architecture [12]. S-SL is a novel training strategy that enables the construction of robust encoders from unlabeled data, extracting patterns that capture the general context of the problem, followed by a fine-tuning stage that only requires a small amount of labeled instances [13]. This paradigm is particularly valuable in the cybersecurity domain, where challenges evolve rapidly, and the scarcity of labeled data is a well-documented limitation [14].
Moreover, building on the original SHAP methodology for the interpretability of supervised learning models [15], we provide SHAP-based explainability for our S-SL setting [16]. Lastly, by using the LLaVA framework [17] for image understanding, as a specialized assistant based on Large Multimodal Models (LMMs) [18], we enhance our results by providing additional information regarding the potential causes of the anomalies. These results are achieved through the analysis of posts from the official X account of the Colombian metro (@metrodemedellin. https://x.com/metrodemedellin, accessed on 28 July 2025) and the local government weather forecast account (@siatamedellin. https://x.com/siatamedellin, accessed on 28 July 2025).
Although our Artificial Intelligence (AI) solution works offline and the detected problems might already have been identified and reported on social media, the transparency provided in our detection process, reinforced with external data, increases confidence when an anomaly is identified. Furthermore, in case there is no information on our official external data sources, our system provides an alert to carry out further investigation, serving as an intelligent assessment tool for the metro.
The public data available in [10] also includes buses, trams, and cable cars that belong to the transportation system. However, the analysis presented here is focused on the metro because it carries the largest share of the daily commute, with more than 650,000 passengers on average, across lines A and B in the city of Medellin, Antioquia. Regarding the operational scale in peak hours, such as 5 pm, it can reach over 100 thousand people traveling in both lines. Each user record is registered using the Automatic Fare Collection (AFC) system of the Cívica card [19]. Nonetheless, an important limitation in the dataset is that no information regarding passenger destination is provided, nor can it be inferred, since data about fare price and traversed stations are not recorded.
Therefore, the main contributions of this work are summarized as follows:
  • A multimodal AI solution that functions as an offline data inspector for the control dashboards of the Colombian metro. In late information fusion [20], the system integrates posts from X representing external influencing factors, with numerical user traffic data. This offline inspection serves as a visibility tool to flag and to explain potential anomalies that may have been overlooked and that require further analysis.
  • The design of Deep Autoencoders using the embeddings produced by the S-SL TabNet architecture, in tandem with the calculation of SHAP values for unsupervised learning, while also exploring the use of LMMs such as LLaVA to provide additional information for finding the reason behind each of the detected anomalies.
  • We are closing the gap between the integration of novel AI approaches such as multimodal learning, S-SL, and LMMs for intelligent metro systems.
The rest of this document is organized as follows: Section 2 shows the related literature on the integration of AI for modeling passenger flow patterns in modern metro systems; Section 3 introduces our proposed data inspection solution, explaining the user traffic data from the Colombian metro, the proposed Deep Autoencoders based on S-SL, the integration of SHAP values for interpretability, and how the LLaVA framework works. Section 4 shows the results obtained and a discussion of them. Lastly, Section 5 provides our final observations and presents future work ideas.

2. Related Work

This section reviews the state of the art on AI integration in modern metro systems to model passenger flow patterns. To the best of our knowledge, this study represents the first effort in the literature to use passenger flow data from the Colombian metro and conduct AI experiments on it. See Table 1 for a summary of the listed documents and the key differences compared to this work.
Wang et al. [21] proposed a time series approach with a dynamic time window technique to predict abnormal passenger inflow in the Shanghai metro system. The dataset comprised over 200 million activity records from 1 million users during April 2015, covering 288 stations. Each record consisted of information about the paid fare, which helped infer the user’s destination. The authors concluded that the importance of adding this latter feature is useful for smart traffic congestion control. Regarding explainability, they crawled three different websites, gathering event information such as sports and concerts, which later helped justify the abnormalities detected. Although a comprehensive regression analysis for time series forecasting was conducted, there is room for improvement by exploring anomaly detection from a classification perspective, specifically using the novel S-SL training strategy.
Also implementing windowing for real-time detection in time series, Wei et al. [24], working with data from the Beijing metro, built an unsupervised learning model based on Principal Component Analysis and 2D matrices to detect anomalies in passenger flow patterns. These matrices indicate the flow (inflow or outflow) observed per station during a specific time interval (days or weeks). The proposed algorithm decomposes each original observation matrix into a low-rank normal matrix and a sparse abnormal matrix. This solution relied on external social media data (such as festivals) to explain the detected anomalies. However, this strategy, i.e., only distributing traffic into matrices, does not scale to incorporate equally important features such as the holiday and weekend variables. This limitation hinders the implementation of an explainability method for quantitatively analyzing how additional variables weigh in the final predictions.
Wu et al. [3] worked with data from the Hangzhou metro system to predict passenger inflow and outflow across 80 different stations, with 70 million records collected during January 2019. The proposed model was a hybrid, including K-means clustering and XGBoost. The purpose of using K-means was to group metro stations with similar passenger flow patterns, thus facilitating the training of the n XGBoost models corresponding to the n station clusters. Interpretability was achieved using SHAP values and Accumulated Local Effects [27], revealing, for example, that the passenger volumes are higher on weekdays than on weekends, and that the presence of business facilities near the metro stations has a significant impact. In addition, open-source information, such as points of interest, temperature, and weather, was also considered a key factor for irregular travel patterns. Lastly, the holiday variable was not evaluated in this study, overlooking the relevance of this feature for traffic prediction.
In [22], the concept of hypergraph learning is introduced to model the Origin-Destination (OD) traffic flow in metro systems. Hypergraphs are an extension of conventional graphs, where the edges between vertices represent not only the topological connection between stations but also higher-order information such as the number of vehicles, operating time, and the time travel interval. This way, spatio-temporal relationships are modeled to get a stronger flow prediction. The authors used the same Hangzhou dataset as the work in [3], and additional information from the Beijing metro system. The latter was collected in 2015, covering a network of 327 stations and 22 lines. The hour, day, and week granularities are considered with a different hypergraph for each one, fusing the output for node-level prediction. Nevertheless, this architecture could benefit from external crawled information indicating real-time social events (e.g., concerts and festivals) in each city.
Zhang et al. [26], based on passenger flow patterns, analyzed the impact of user traffic and other factors, such as the wagons’ carrying capacity and travel time between stations, to create a Deep Reinforcement Learning (DRL) solution to reduce delays. Working with data from the Yizhuang line of the Beijing metro, which covers 13 stations, a DRL agent is built to handle the complexity of regulating 20 different trains during the morning peak (i.e., from 6:30 am to 9 am). When comparing the regulations provided by this DRL solution, the departure deviations are diminished, solving the domino effect that causes the delay in one of the trains, and therefore, the resulting congestion of passengers and poor quality of service. Although more than 25 factors are evaluated, from the physical characteristics of the train to passenger flow patterns and time information, no interpretability method was used to distinguish the main variables, harming the auditing of the decisions behind each control action.
The works discussed thus far focus on traffic modeling applications in China, but in the state of the art, there are other relevant advances in cities such as London and Paris. In the United Kingdom, Zhang et al. [23] proposed a fuzzy logic system with data clustering, to predict passenger flow in different underground trains in the London metro, using as training data the one-year information from the Victoria line, including the variables of weather conditions, external events (e.g., a football match or a concert), day of the week (i.e., weekday or weekend), etc. Regarding France, Bapaume et al. [25] focused on the Paris metro line 9, using three years of information for the task of passenger flow forecasting, training Vision Transformers [28] with synthetic images that indicate external information such as strikes and sports events occurring near stations.
Based on this literature review, passenger flow modeling in major cities such as Shanghai and Beijing highlights the importance of incorporating outflow data when analyzing abnormal behaviors. Furthermore, the chosen data source is critical, as external factors such as social events and weather conditions play an essential role in conducting a comprehensive study and justifying the detected anomalies. The reviewed studies employ a variety of AI techniques, ranging from standard XGBoost models to hypergraph theory, DRL, and transformers, to extract the intelligence obtained from these data. Nonetheless, to the best of our knowledge, we are the first effort to integrate the novel S-SL training paradigm for building Deep Autoencoders based on numerical user traffic data, while incorporating weekend and holiday variables, along with the calculation of SHAP-based values for interpretability, and the use of LMMs for image understanding of X posts from the Colombian metro and local weather forecasting accounts.
In the next section, we present details about the methodology followed to build the proposed multimodal learning cybersecurity solution.

3. Methodology

In this section, we present our methodology. It includes the analysis of the Colombian metro dataset to define the relevant features, the design of the Deep Autoencoders architectures based on TabNet, the calculation of the most salient features based on SHAP values, and finally, the integration of LMMs to strengthen the justification of each abnormal sample. Please refer to Figure 1 for an overview of these steps during the offline inference stage.
In Figure 1, two independent models work together, namely a custom unimodal Deep Autoencoder and LLaVA, where the outputs of each are then concatenated for the final detection. The output of the Deep Autoencoder is the datetime with abnormal inflow traffic behavior, and the output of the LMM is the potential X post for that case, exemplifying this as a late multimodal fusion technique [20] that enhances the detection results.

3.1. User Traffic Data from the Colombian Metro

The only metro system in Colombia is located in the city of Medellin, Antioquia. Public data are provided, indicating the movement of people at the hour granularity level, between 4 am and 11 pm, in each of the two existing lines: A and B [7]. This information spans from 1 January 2019 until 31 March 2025 and is gathered from the entry registration of a passenger using the Cívica Card. In total, there are 2278 records per metro line.
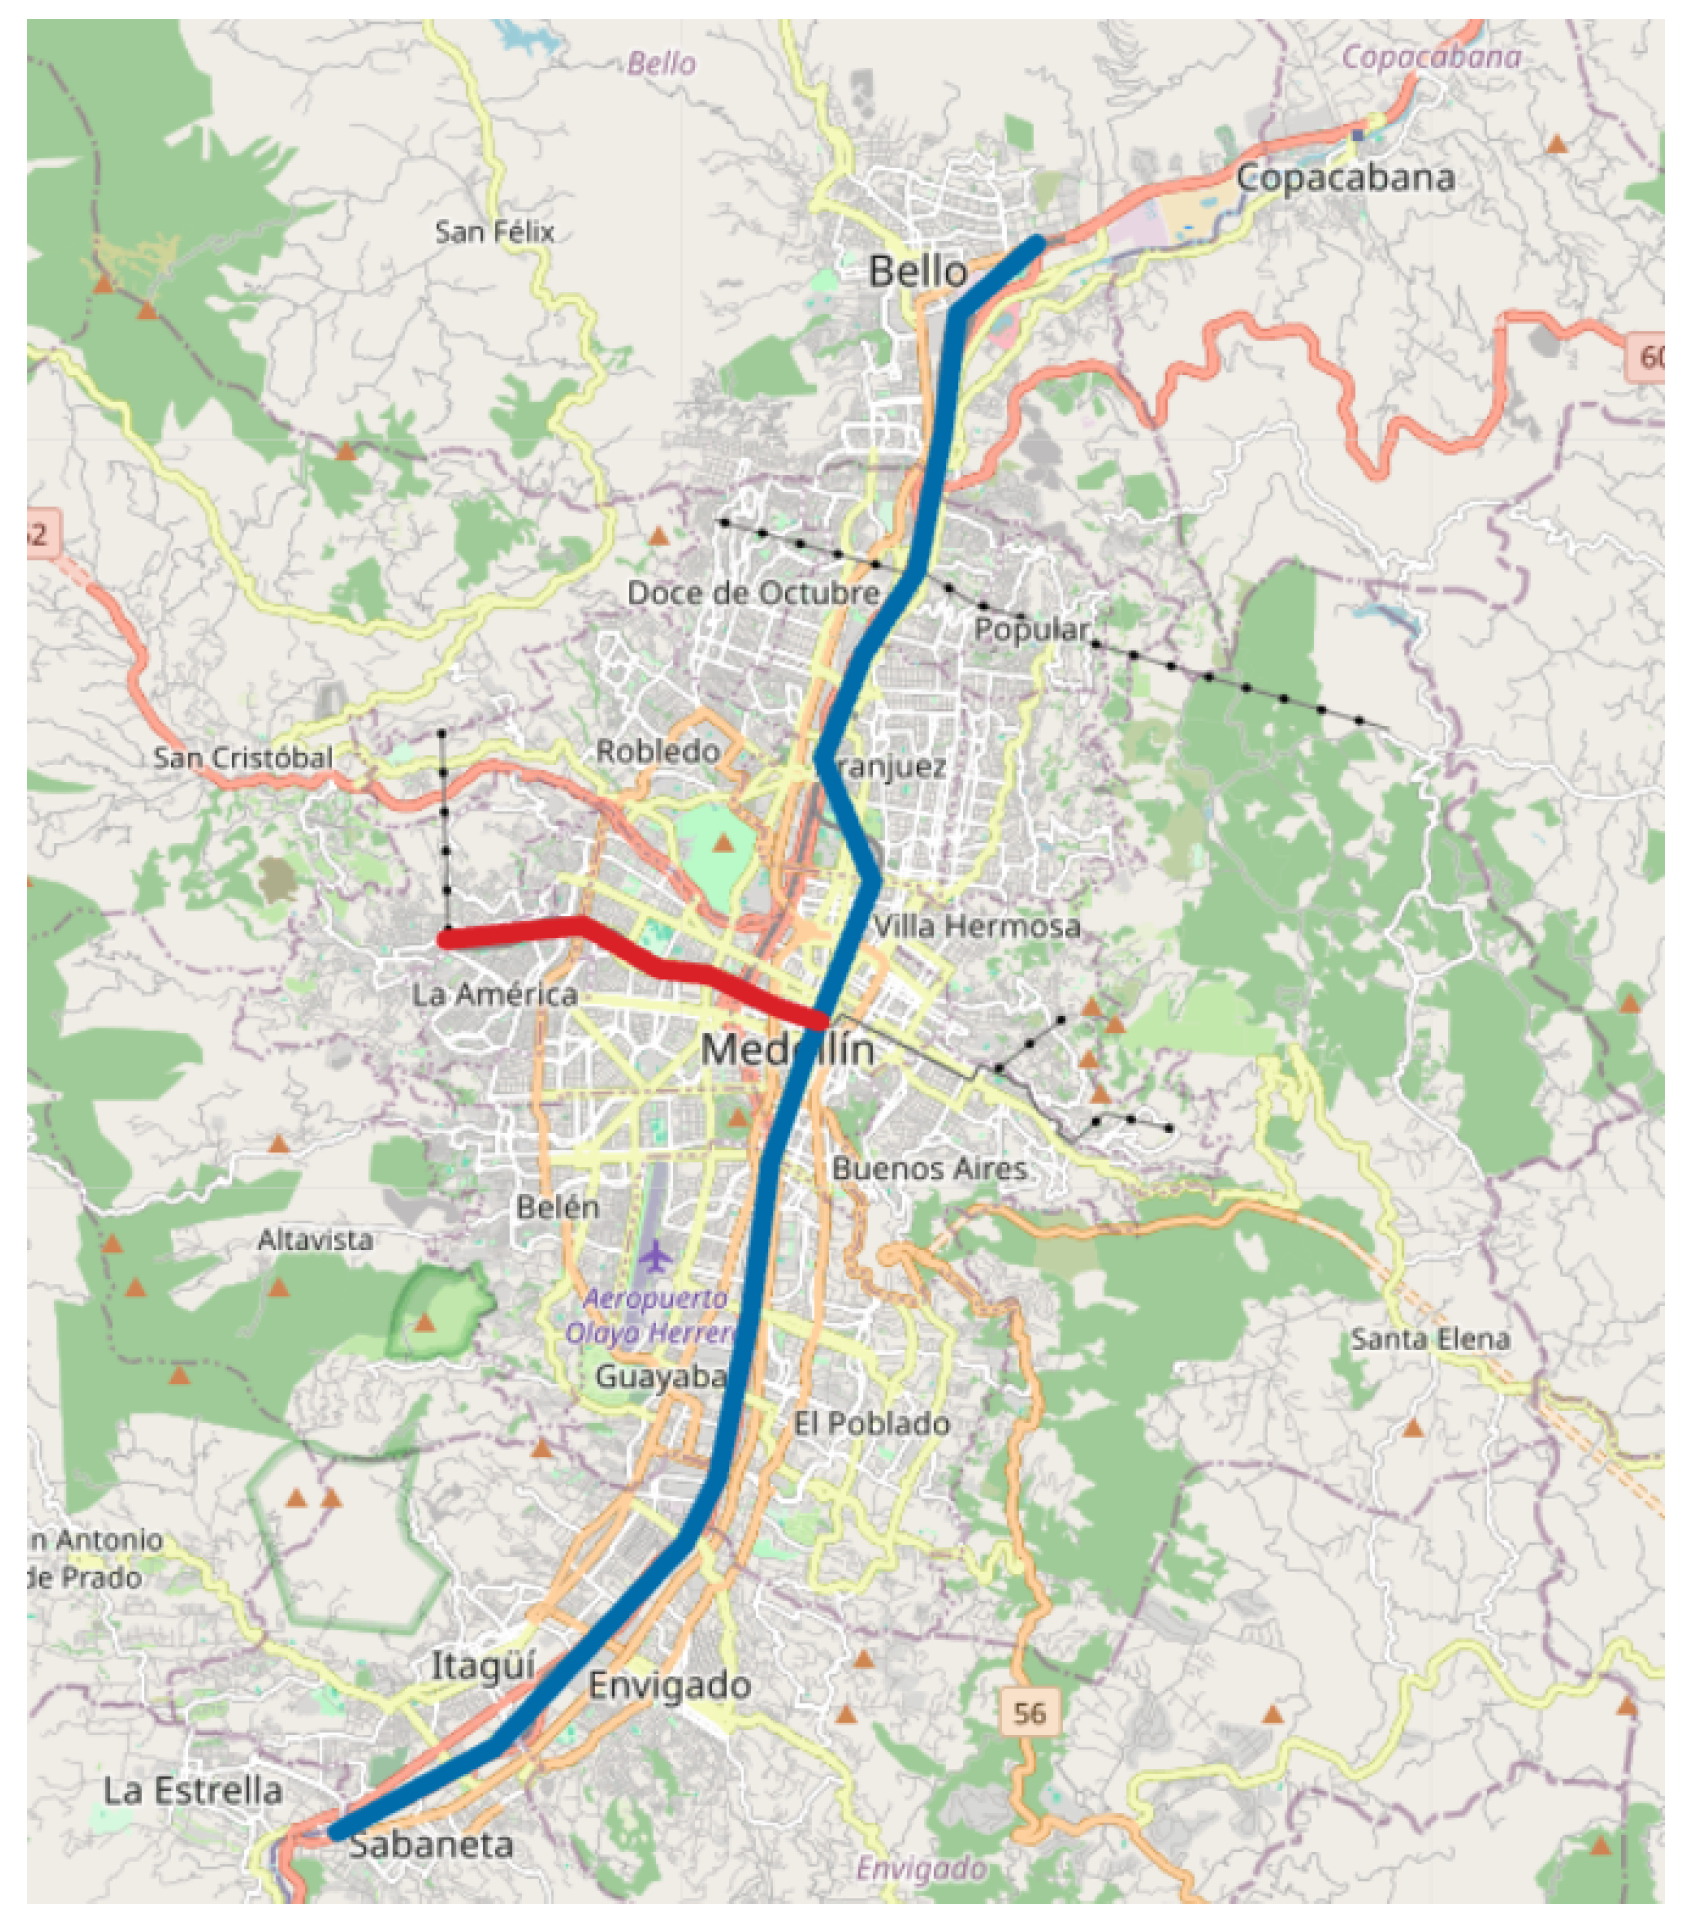
According to the last 100 records in these data, on average, every day more than 650,000 people use the metro, making it the transportation system with the highest volume of users when compared to buses, trams, and cable cars [10]. See Figure 2 for the distribution of users, where line A moves the majority of people. Line A comprises 21 stations, from south to north, becoming the backbone of the metro system. On the other hand, line B includes seven stations, expanding perpendicularly to line A. See Figure 3 for the location of these stations in the city of Medellin.
From the more than 2000 records available per line, we selected those dated after the official lifting of the COVID-19 restrictions in Colombia (i.e., 30 June 2022). According to [29], the pandemic drastically disrupted passenger mobility in the metro system and led to serious economic losses. Therefore, in order to model this user traffic behavior with Deep Autoencoders, the final dataset for each line included 1005 records distributed across:
  • 731 samples for training: 30 June 2022–30 June 2024.
  • 184 for validation: 1 July 2024–31 December 2024.
  • 90 for testing: 1 January 2025–31 March 2025.
Based on the original features indicating the date, hour, and total number of passengers, we created two additional variables to determine whether the corresponding day is a holiday and/or a weekend. Since passenger mobility varies between weekdays and important celebration days in the city, the goal of these two additional columns is to handle these cases. In particular, there can exist 4 scenarios:
  • It is a weekday, but it is a holiday.
  • It is a weekday, but it is not a holiday.
  • It is a weekend, but it is a holiday.
  • It is a weekend, but it is not a holiday.
Ten different holidays were considered, including New Year, Independence Day, Labor Day, and religious celebrations such as Christmas and Holy Week. To handle missing values, cells were filled with 0, this was considered the best practice according to the Total number of passengers column. This column and the Day variable were removed after preprocessing for our final feature set. See Table 2 for a breakdown of the final group of variables used in this work, which covers date and time information.
Building on prior work with Autoencoders for reconstruction-based anomaly detection [30] and the use of S-SL in classification problems in cybersecurity [31,32], we categorized the numerical user traffic in the metro dataset into four different classes. The categories per hour are low, usual, high, and outlier inflow traffic, and are calculated according to the Equations (1)–(3), where the outlier category occurs when a number is too small or too high to fit into one of the other three classes. The variables q 1 and q 3 indicate the first and third quartiles, respectively, while w h i s k e r _ h i g h and w h i s k e r _ l o w e r are the upper and lower extreme values, excluding outliers.
l o w   =   ( w h i s k e r _ l o w e r ,   q 1     1 )
u s u a l   =   ( q 1 ,   q 3     1 )
h i g h   =   ( q 3 ,   w h i s k e r _ h i g h )
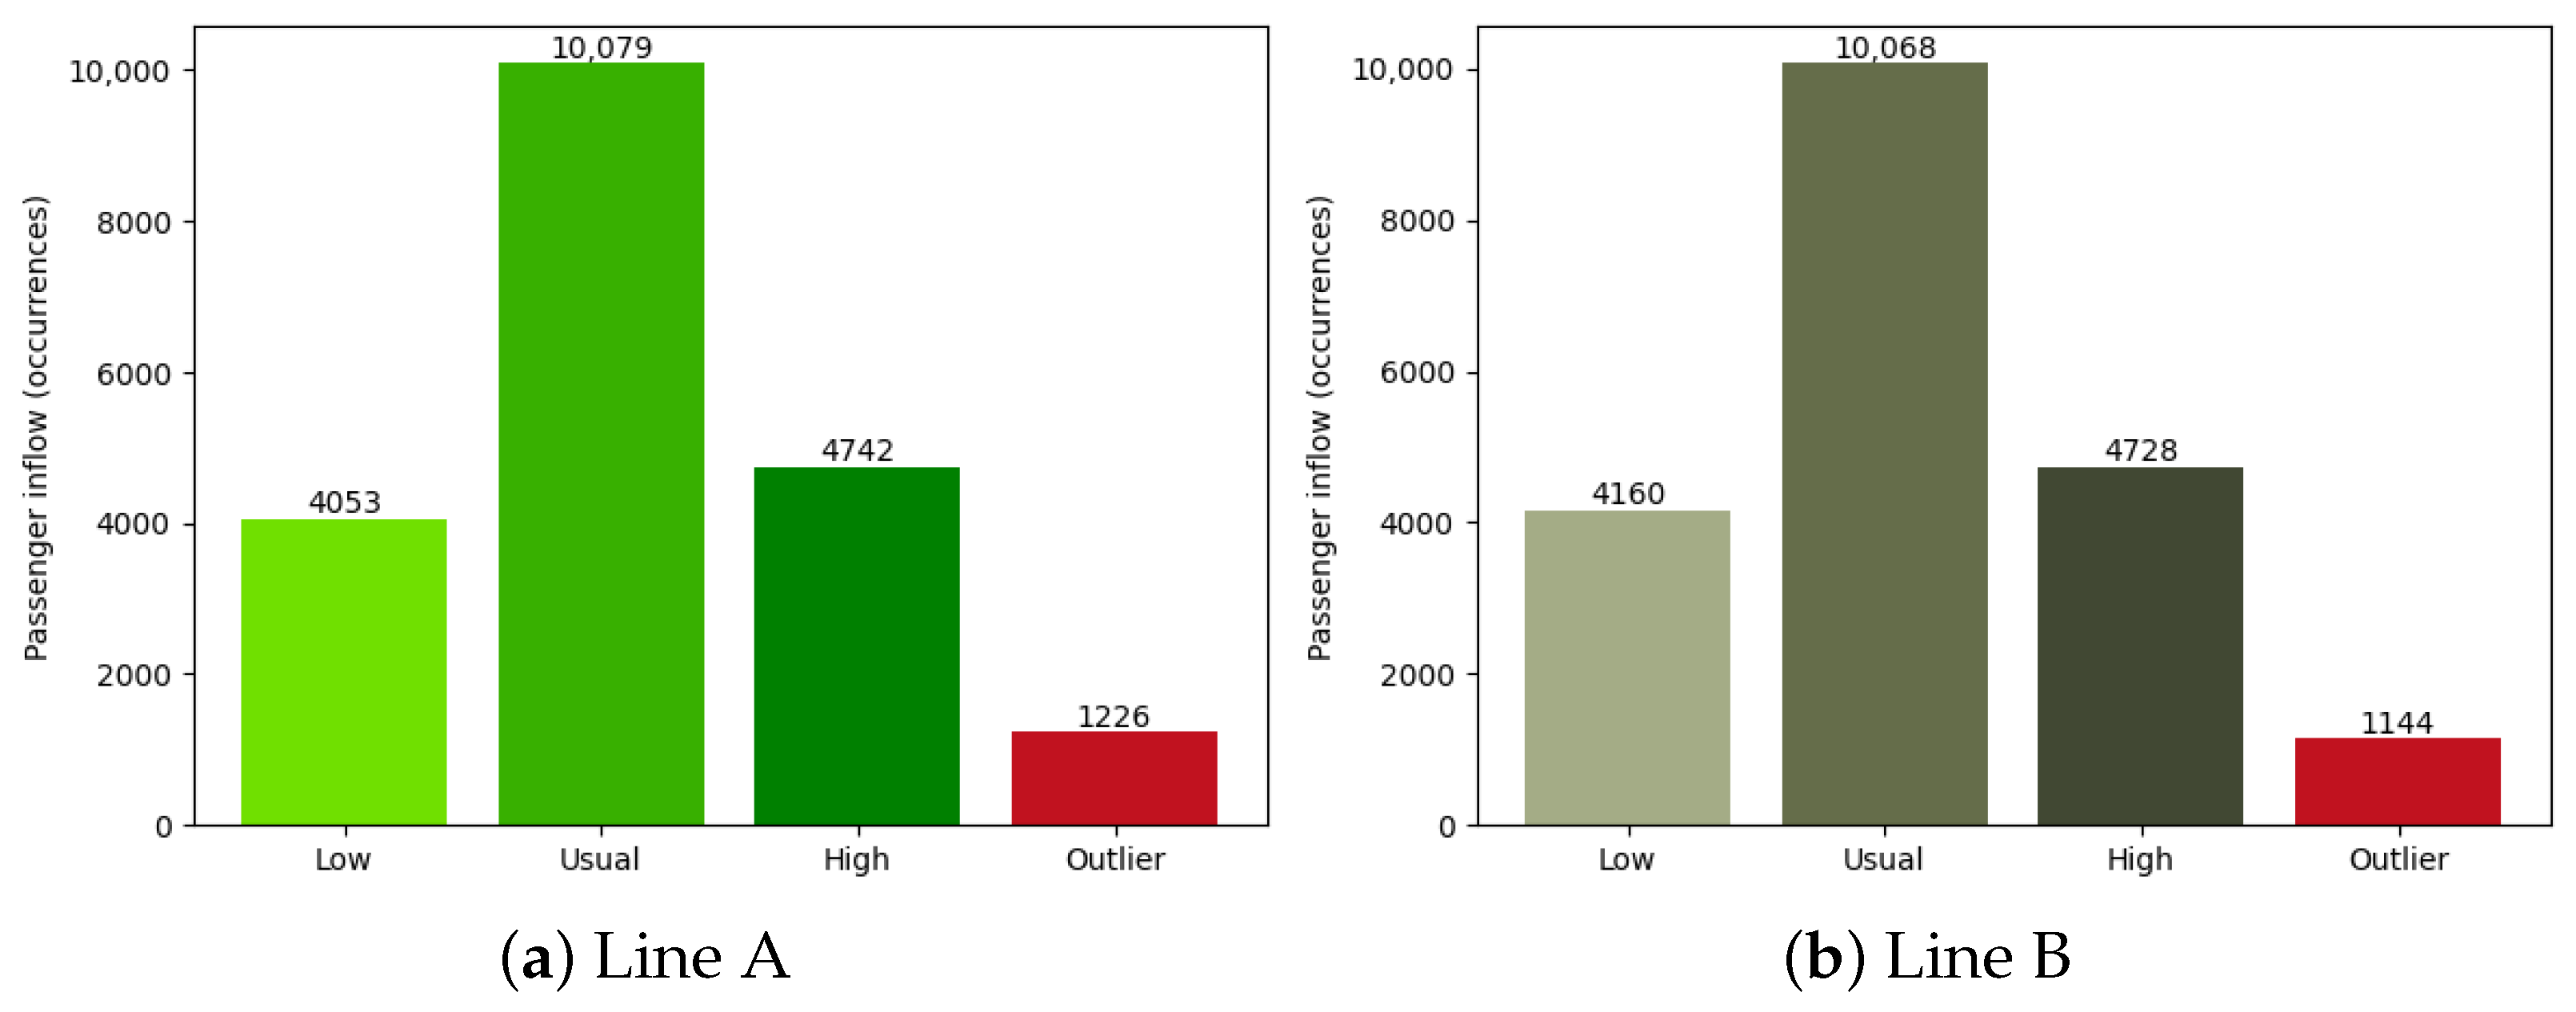
For training, these four categories were encoded as: {low: 0, usual: 1, high: 2, outlier: −1}. This way, the  h i g h class is assigned a higher order than the l o w class to reflect the intended ordinal encoding. See Figure 4 for the number of occurrences of each of these passenger inflow categories per metro line. In line A, o u t l i e r traffic accounts for 6.1% of the total cells, while in line B it accounts for 5.69%. Therefore, instead of removing this class to model a cleaner behavior per line, we consider it valuable information to model genuine deviations from normal traffic patterns. As expected, most of the traffic (i.e., over 90% per line) belongs to the other three categories, thus validating our strategy for categorizing the original numerical data.

3.2. Deep Autoencoders Based on Self-Supervised Learning

TabNet, short for Tabular Network [12], is an S-SL model in which the architecture follows an autoencoder. The encoder consists of multiple sequential steps (blocks) incorporating both feature and attentive transformers, which, together with the sparsemax activation function [33], enable the model to focus on the most relevant features for decision-making. Sparsemax works by zeroing out some of these variables, filtering large output spaces.
Each feature transformer includes fully connected layers, batch normalization, and the Gated Linear Unit activation function [34]. Conversely, each attentive transformer includes a fully connected layer, batch normalization, and the sparsemax masking function. We propose to extract the embeddings (latent space z) produced by the TabNet encoder and pass this encoded representation into a set of fully connected layers, increasing in dimension, to reconstruct the input data. See Figure 5 for the proposed Deep Autoencoder architecture used in each metro line.
Relying on the assumption that the self-attention mechanism in TabNet is sufficiently robust to produce high-quality feature representations, we decouple the original multi-step decoder with feature transformers and integrate our proposed block of fully connected layers. Since our initial goal was to train a robust reconstructor capable of discerning abnormalities in the user traffic behavior, the encoder remained frozen during the training stage, only optimizing the linear decoder. This decoder included ReLU activation functions and started from an embedding dimension of eight, followed by linear layers of 16, 32, 64, and 128 neurons. See Table 3 for the hyperparameter values manually selected through experimentation for the encoders of our Deep Autoencoders. The architecture remains identical across metro lines, with variations only from the input data.
Early stopping was conducted by evaluating the validation loss. Furthermore, cosine annealing was selected as the learning rate scheduler, and Adam was used as the optimizer. The source code provided in the pytorch-tabnet GitHub repository (pytorch-tabnet 4.1.0. https://dreamquark-ai.github.io/tabnet, accessed on 20 August 2025) was analyzed to only extract the encoder part and produce the required embeddings. This whole implementation, also considering the linear decoder part, is coded using PyTorch v2.6.0 [35].

Reconstruction Threshold ( ϵ )

To calculate the reconstruction threshold ( ϵ ) that works as a delimiter between normal and abnormal days, the Equation (4) was defined, using the mean squared error as the criterion to measure the quality of the reconstructions in the validation set. A value of k equal to one was established, allowing for more sensitivity in the anomaly detection task. Although the 99th percentile of the distribution of the mean squared errors can also be used as the delimiter, we did not test this approach because, in our methodology, it is not relevant if a large number of abnormalities are flagged in the inflow traffic, since each of these detected instances can then be filtered with the help of the explanations provided by our LMM.
ϵ = m e a n ( m s e )   +   k s t d ( m s e )
No other metrics were used to measure the detection rate performance, such as precision or F1 score. The reason is that these custom Deep Autoencoders enable an unsupervised exploration phase within the large amount of posts in the two provided X accounts. Therefore, there is no ground-truth set of abnormal (corrupted) samples from which to benchmark the detection results. Besides the ϵ value and explainability, overfitting was properly evaluated using early stopping and the validation set to find the optimal number of training iterations.

3.3. SHAP Values for Deep Autoencoders

SHAP is a game theory approach that provides feature importance values in supervised black box models [15]. More recently, an adaptation of this algorithm was proposed for Autoencoders [16], which we transfer to our case. Specifically, our Deep Autoencoders, during training and inference, are fed with the 22 variables defined in Table 2, where each record represents a different day. Therefore, once an anomaly is detected, the advantage of having the original granularity at the hour level is lost because anomalies are just days with abnormal traffic behavior. To handle this issue, we need to provide interpretability to the model, finding those features (e.g., hours) that contribute more to the high reconstruction error of the detected anomaly.
The approach mentioned in [16] is based on two important matrices: X _ t r a i n and X _ e x p l a i n . X _ t r a i n is used to build the local explanation baseline model to calculate the SHAP values, and its size (i.e., the number of background samples) is defined by a variable called b a c k g r o u n d _ s e t ; X _ e x p l a i n includes the anomalies that need explanation, where the top abnormal samples are selected by mean squared error, limited by the variable n u m _ a n o m a l i e s _ t o _ e x p l a i n .
For the Colombian metro, X _ e x p l a i n is the set of anomalies detected in each line (A or B), with no limit on the variable n u m _ a n o m a l i e s _ t o _ e x p l a i n , since interpretability is required for each of the abnormal samples. Then, for each row in X _ e x p l a i n , the top features are extracted according to how much percentage of the total reconstruction error of that specific record we want to explain, with a value of 100% for this scenario. Lastly, the top variables by SHAP value, explaining these most important features, are listed. Regarding X _ t r a i n , it was built with a shuffle of samples, specifically a b a c k g r o u n d _ s e t of 365 instances (one year).

3.4. Large Multimodal Models: LLaVA Framework

LMMs are augmented Large Language Models (LLMs) that handle not only text but also other input data modalities such as images, videos, and audio [36]. Some LMMs are intended for image understanding, following the Equation (5), where a vision encoder works in tandem with an LLM backbone [37].
I m a g e + T e x t T e x t
LLaVA (Large Language and Vision Assistant) is a state-of-the-art framework for image understanding [38]. Specifically, we use the checkpoint of 13 billion parameters (13B) [17], and provide as input a text-image pair, where the image passes through a CLIP [39] vision encoder, then through a Multi-layer Perceptron model acting as the vision-language connector, and finally through the Vicuna [40] backbone as the language model, which also handles the input user prompt after tokenization. The open-source version of LLaVA 13B was obtained from Ollama (Ollama platform: https://ollama.com/, accessed on 25 August 2025).
In the proposed solution, LLaVA is used at inference time to analyze posts from the official X account of the Colombian metro and the weather account of the local government, to identify potential causes behind each detected anomaly. Each input text-image pair consists of a screenshot of a post and a user prompt, as in Figure 1. LLaVA provides an additional layer of explainability, complementing the SHAP-based interpretability approach applied to the Deep Autoencoders.

4. Experimental Results and Discussion

In this section, we present the classification and explainability results obtained from the proposed multimodal learning approach.

4.1. Anomalies Detected by the Deep Autoencoders

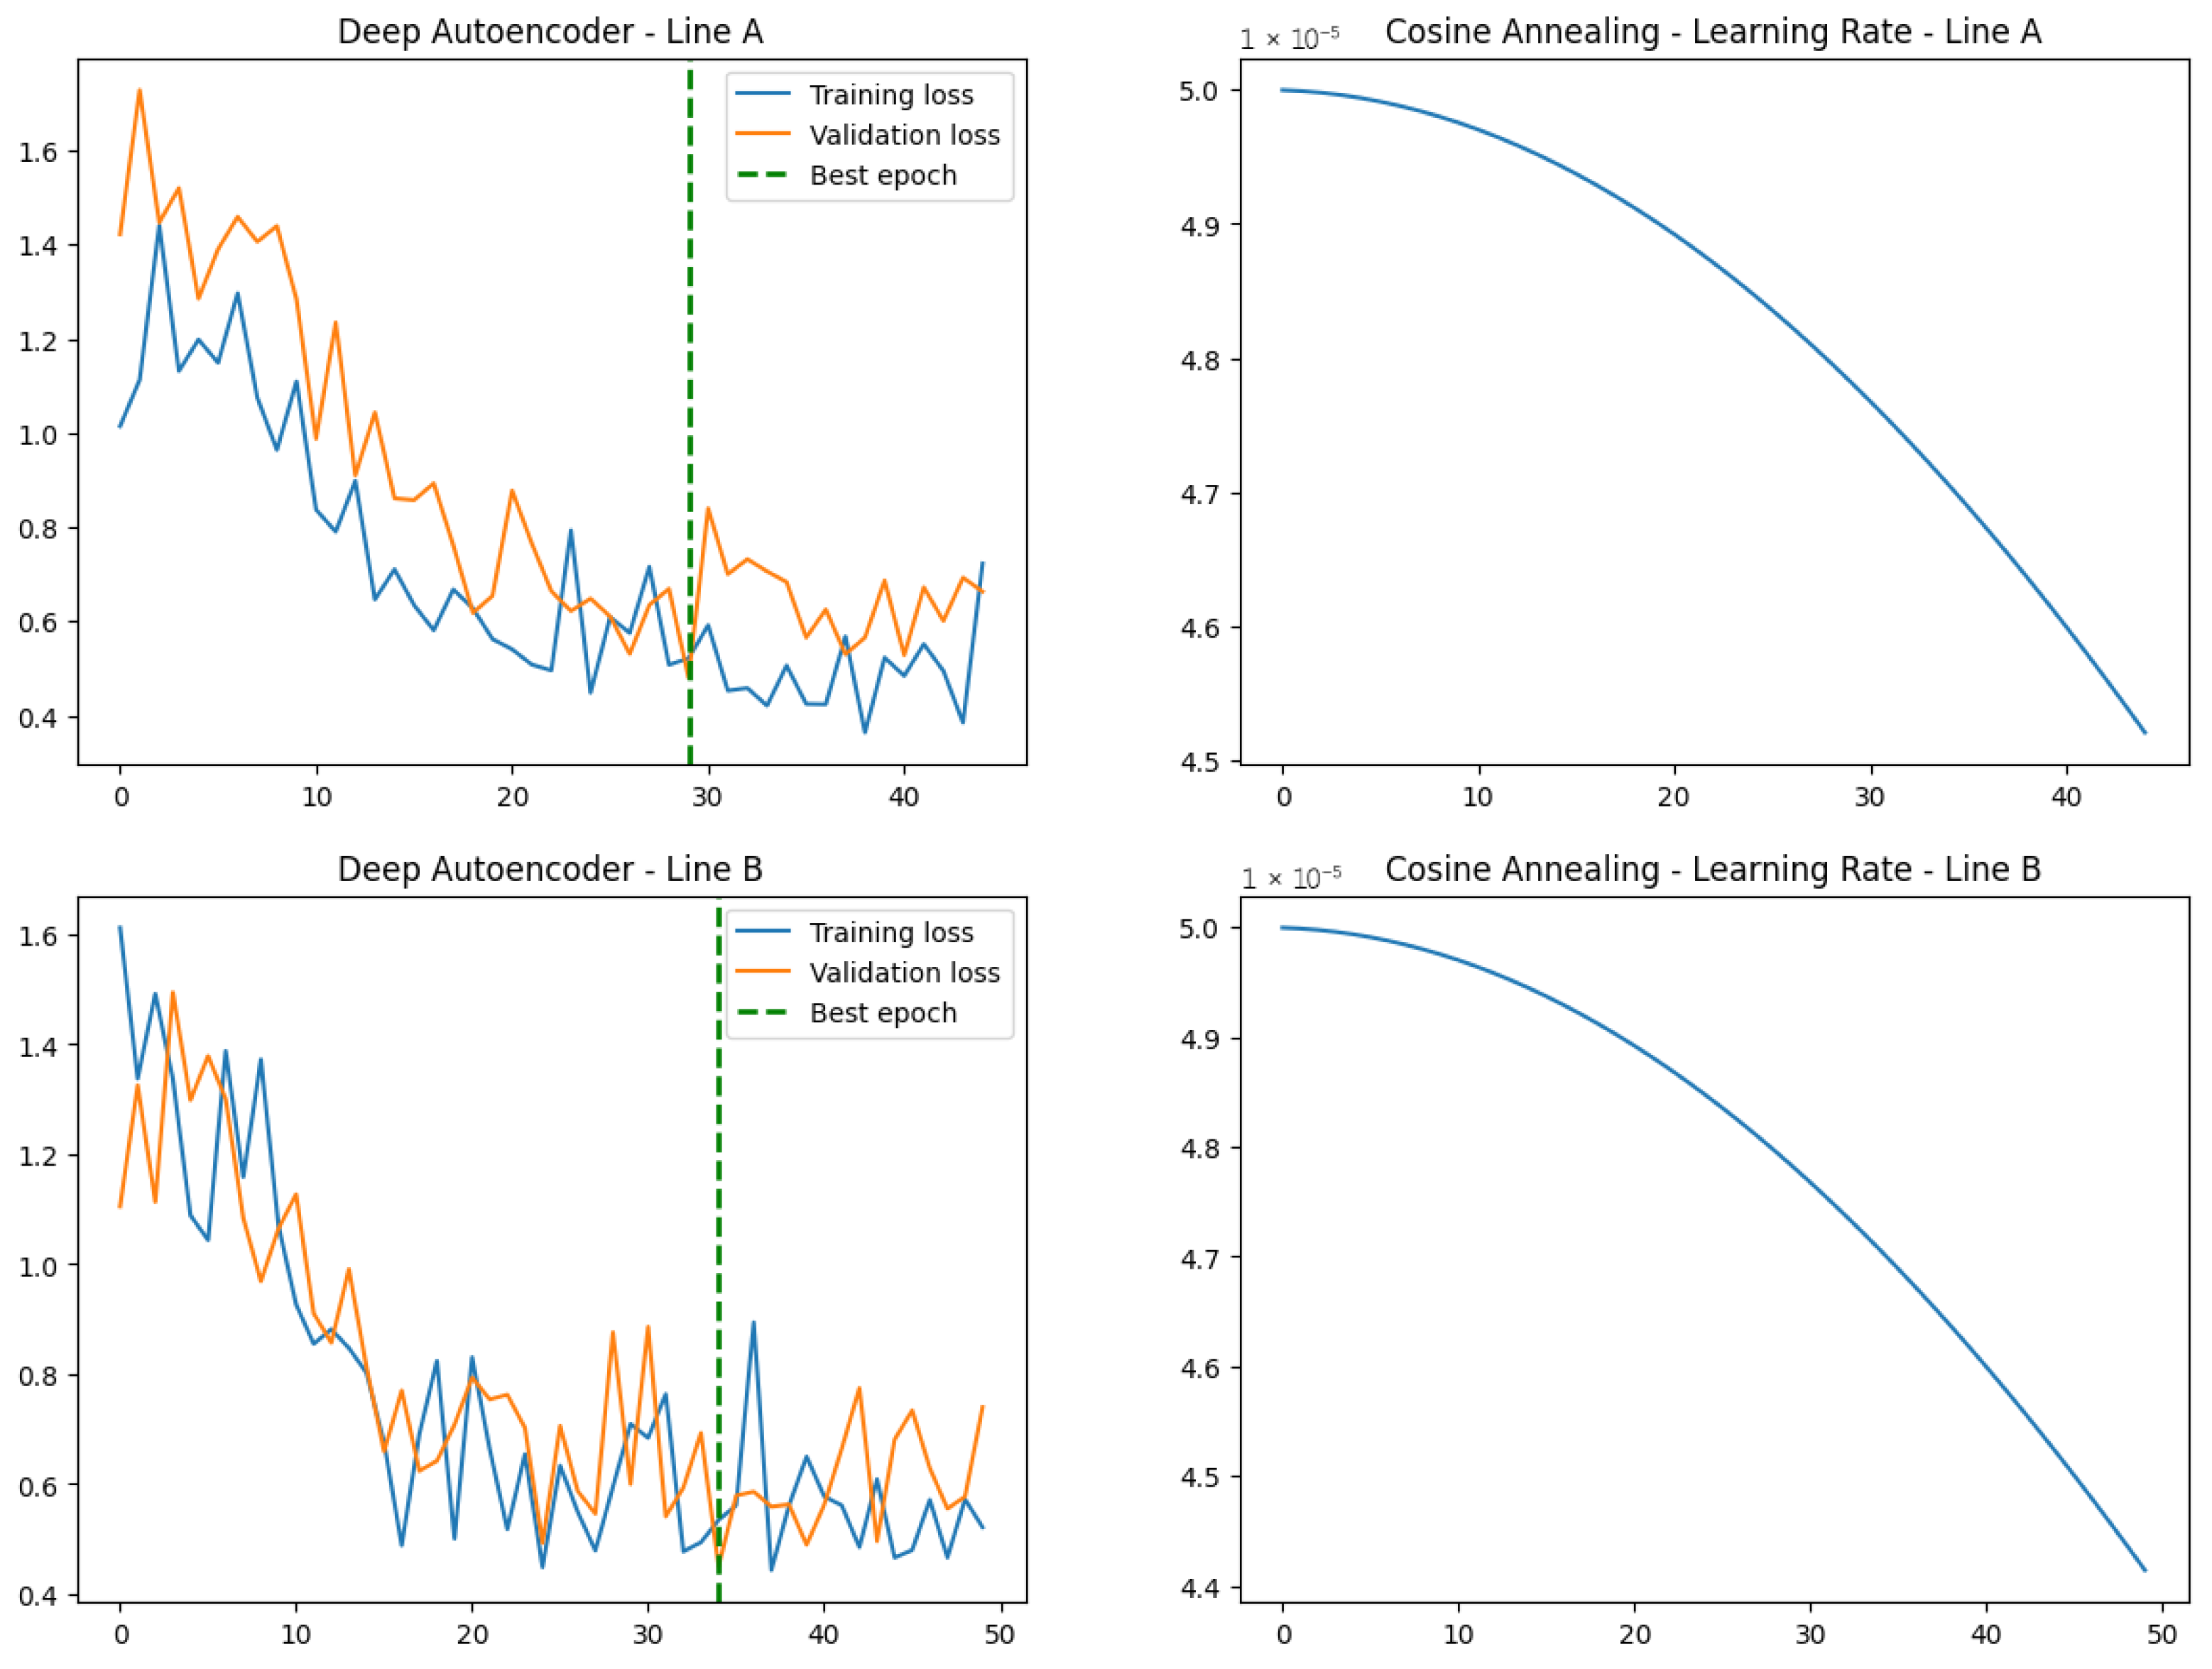
Given the limited number of 731 training records, an important challenge is the potential risk of overfitting. Therefore, to mitigate this issue, we performed early stopping with a patience value of 15 to measure the improvement in the validation loss. Moreover, to help navigate the complex solution space that this passenger inflow problem may represent, we modified the learning rate by using cosine annealing. See Figure 6 for the corresponding plots calculated during this training process, for lines A and B.
As depicted, convergence was achieved in a similar number of epochs, 29 for line A and 34 for line B, and benefited from a small learning rate, close to 4 × 10 5 . This indicates that the Deep Autoencoders, without too many iterations, achieved confident predictions, potentially due to well-defined patterns learned from the feature set defined in Table 2 and the four scenarios listed in Section 3. These four cases were obtained due to the Is weekend and Is holiday variables created.
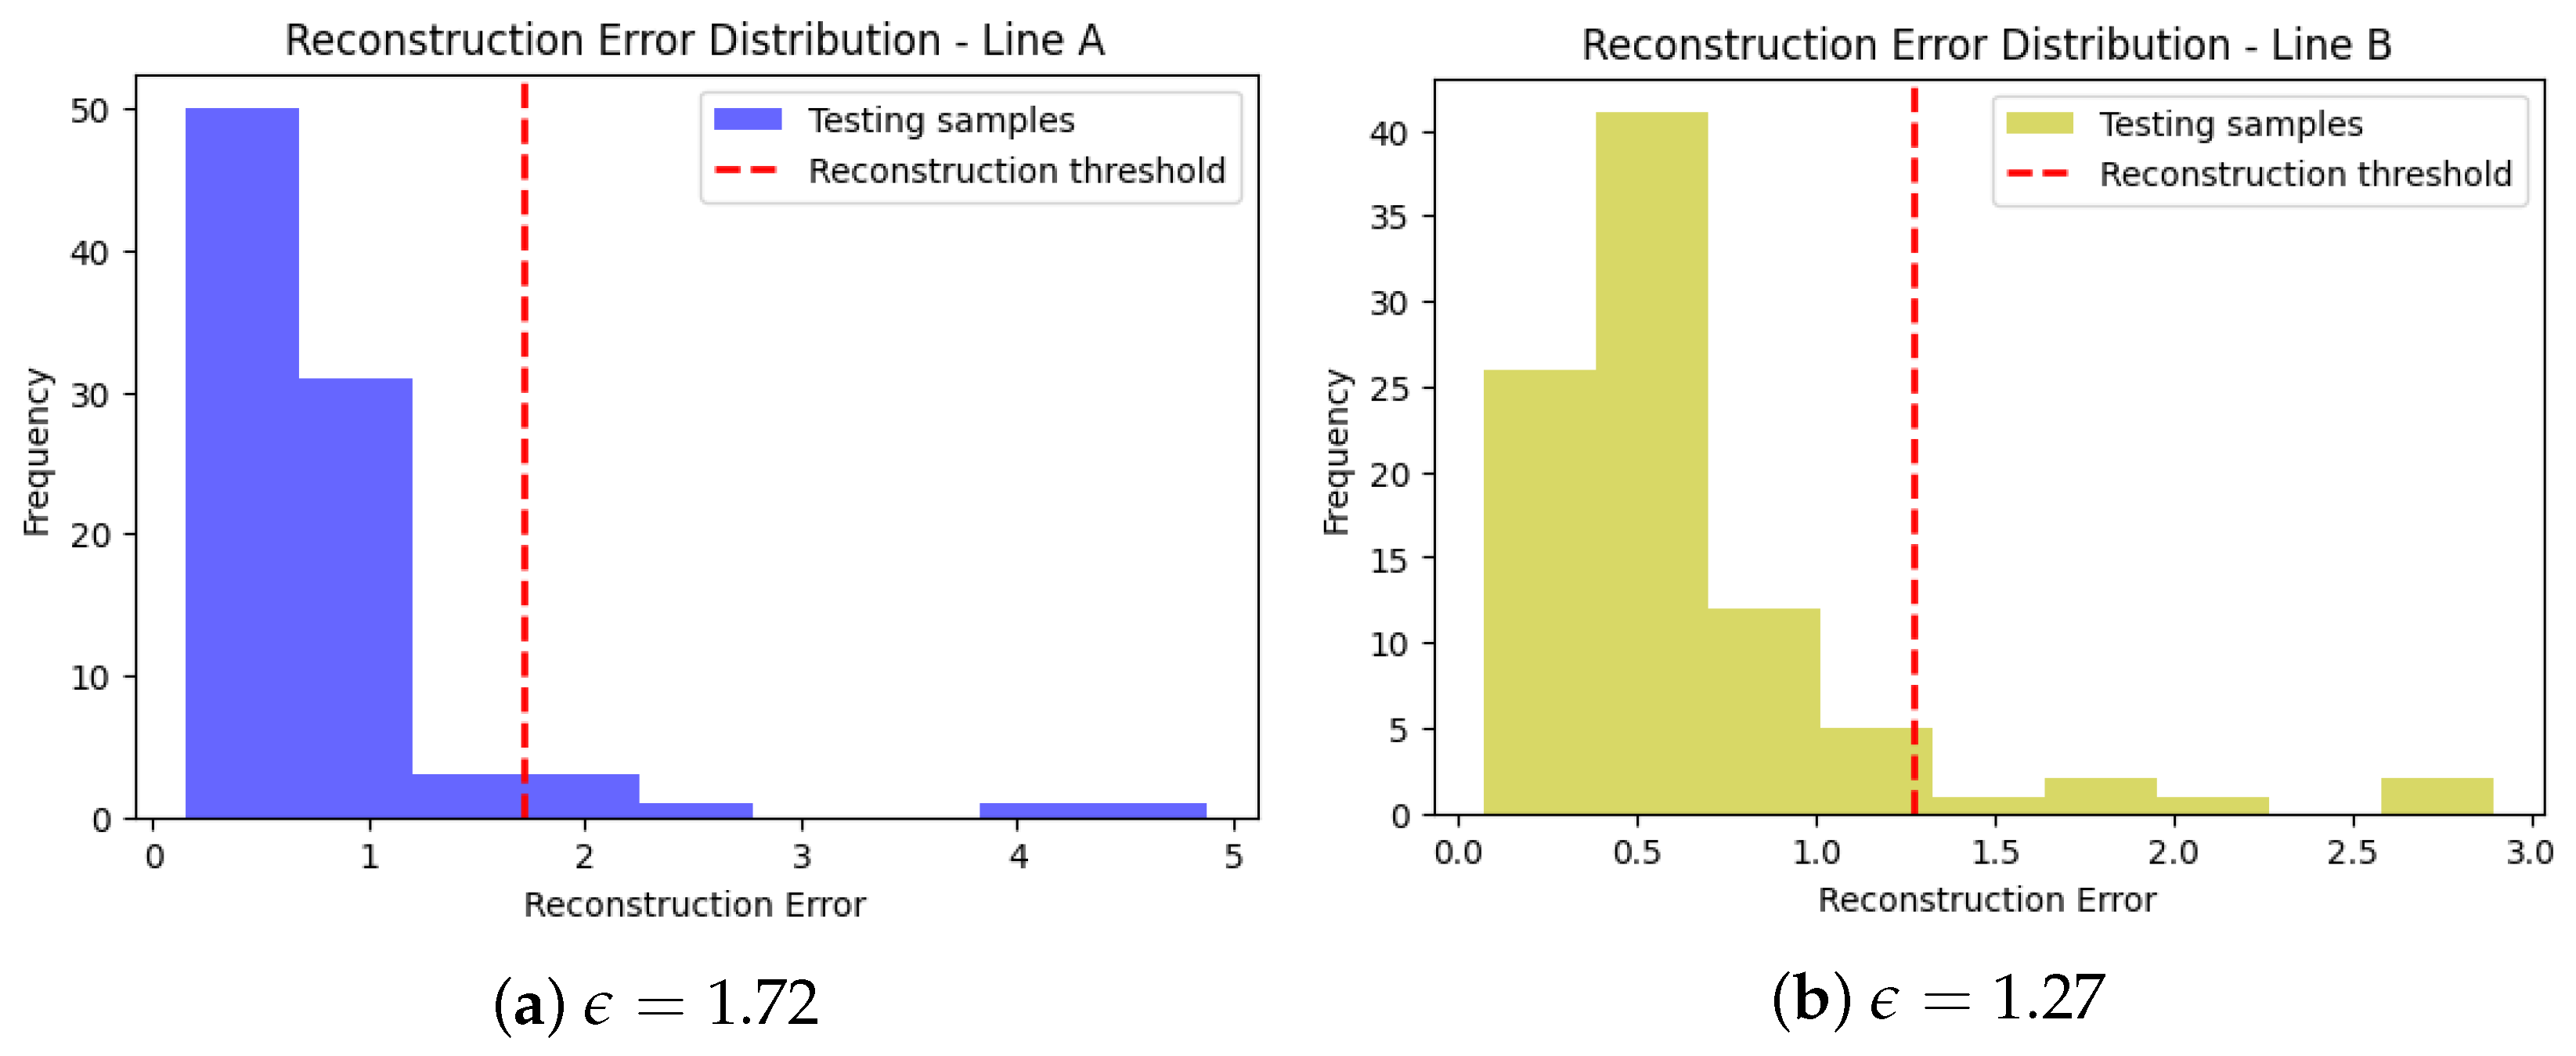
Using the best model from the best epoch in each line, the reconstruction threshold ϵ was calculated based on the validation set. See Figure 7 for the corresponding histograms, where the reconstruction errors from the testing samples are plotted, with the red dashed line separating the normal instances from the detected anomalies.
As expected, in both histograms, the high frequency and high number of bins are on the left side of the reconstruction threshold, since the anomalies are not abundant. From each test set of 90 different samples per metro line, each Deep Autoencoder detected six anomalies. Remarkably, as indicated in Table 4, 67% of the anomalies detected in each line also occur in the other, demonstrating the interconnectivity of the Colombian metro, where problems in one line also affect the other. This is a crucial aspect that motivates the coordinated emergency response to improve the passenger travel experience [41].

4.2. SHAP-Based Explainability and Image Understanding Using LLaVA

To investigate each abnormal day further, SHAP values are calculated following the algorithm explained in Section 3. To assess the magnitude, rather than the direction, of each feature’s contribution to the high reconstruction errors associated with anomalies, we use absolute SHAP values. Two cases are selected to evaluate the proposed multimodal learning approach: first, the analysis of an abnormal day not detected by both Deep Autoencoders and then the analysis of an abnormal day detected by both.
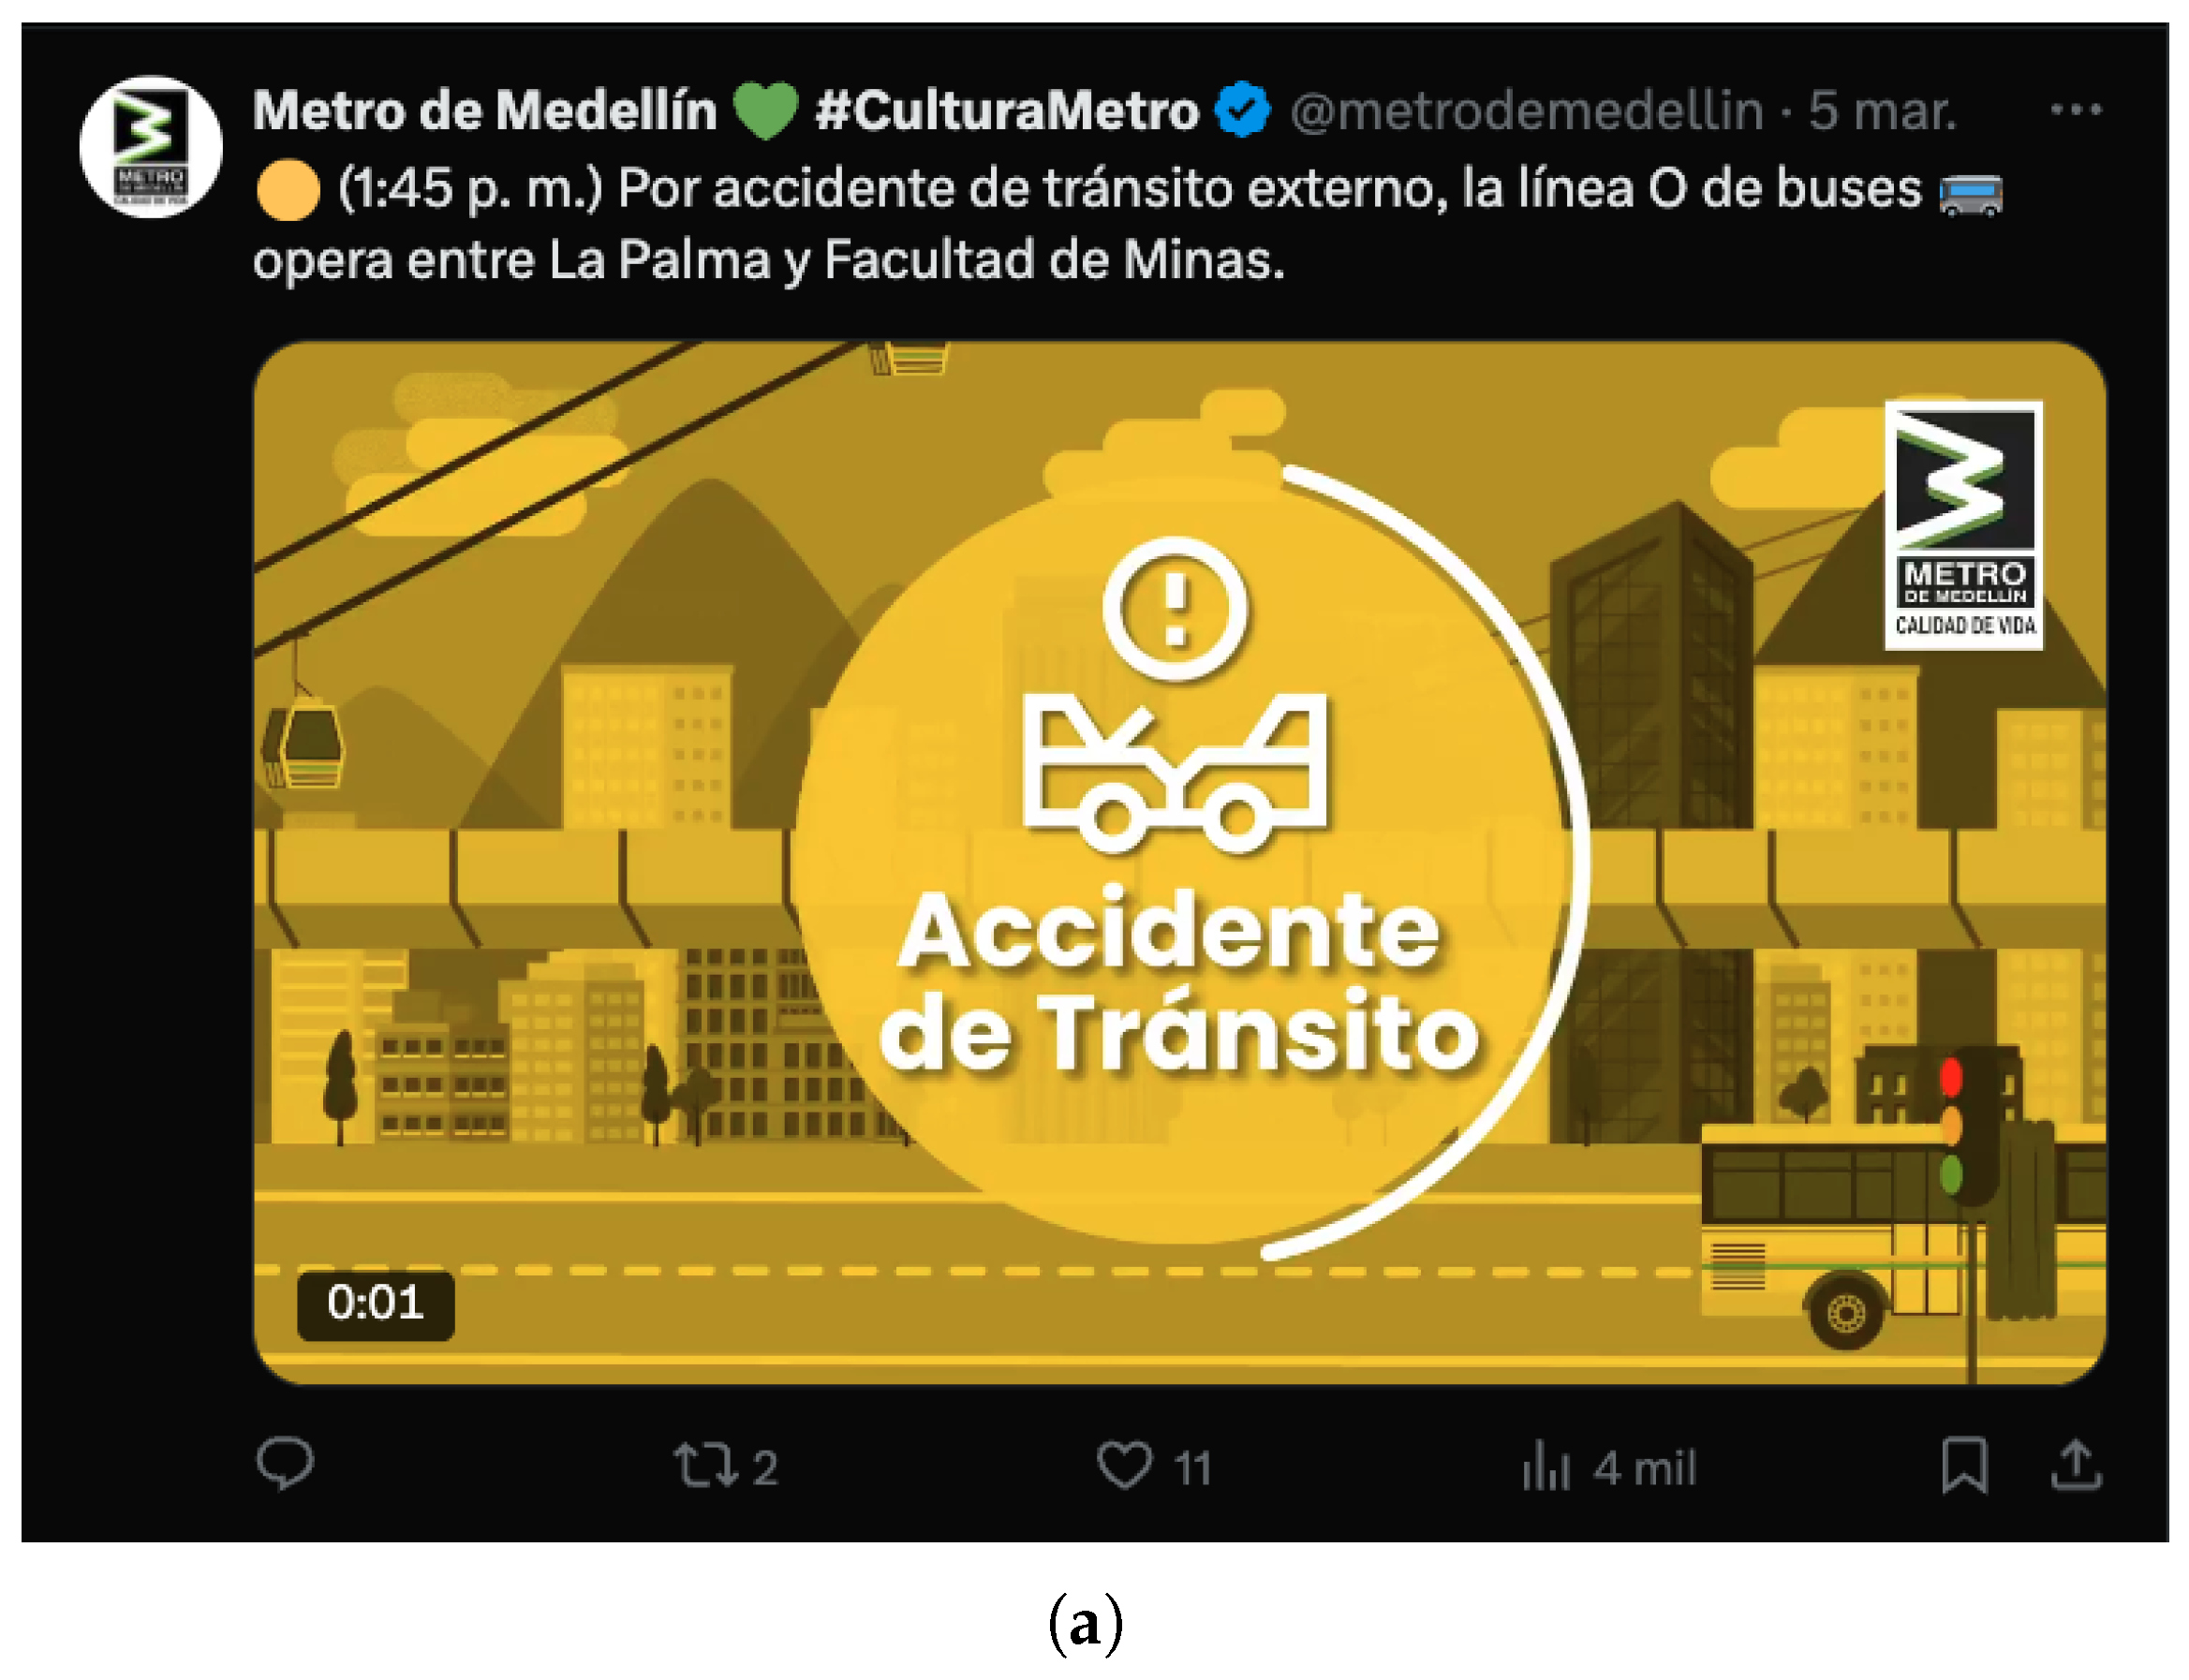
From the isolated events in Table 4, the most recent anomaly occurred on 5 March 2025, in line A. The top five absolute SHAP values for this event are in Figure 8, indicating that a variation in passenger inflow traffic was notoriously observed, for example, between 5 and 6 pm. Taking into account these five main characteristics (all hours), we filtered the X posts of the official metro account and the weather account of the local government for that day, to then use LLaVA to perform the image understanding task on those posts. See Figure 9 to observe the results of this final proposed step.
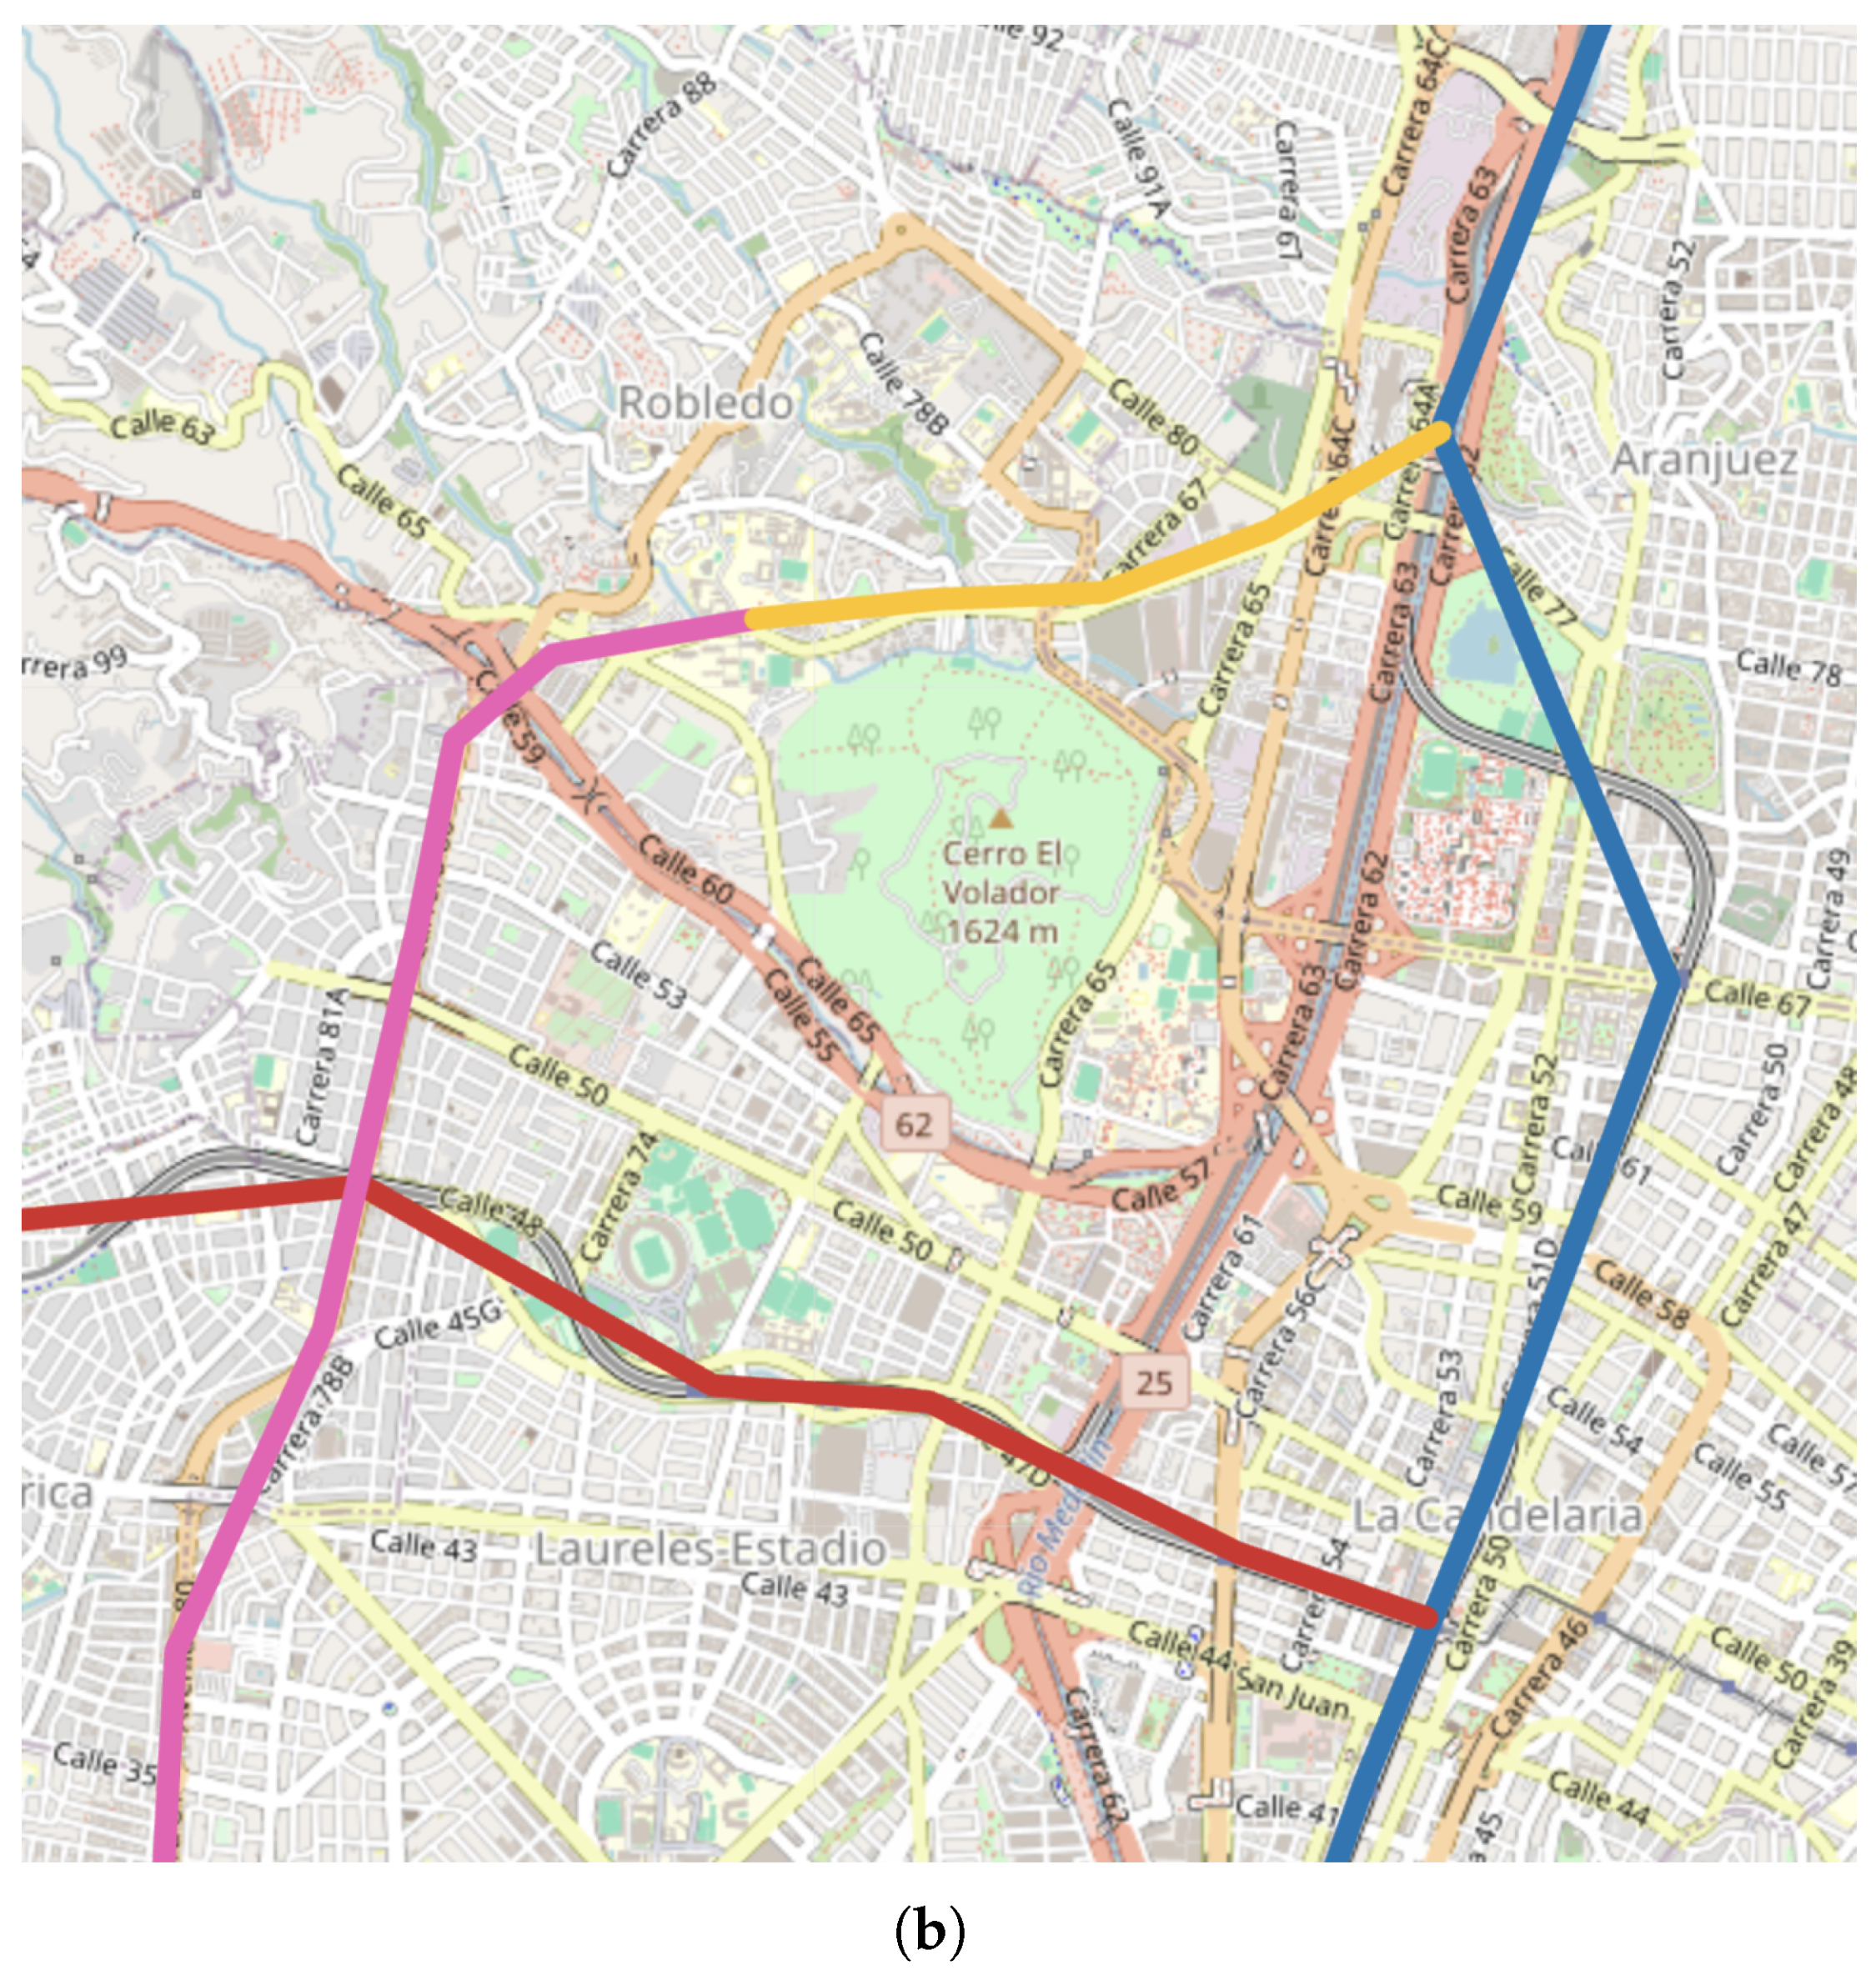
From Figure 9, we can read that a traffic accident could affect line A of the metro system at 1 pm. This hour is exactly in the ranking provided in Figure 8, as one of the most important variables for explaining the high reconstruction error of that day. Congestion could have occurred at the station on line A, where the pink bus route should start, considerably increasing user traffic during that time, probably because passengers decided to move more stations down line A when realizing the pink line was interrupted.
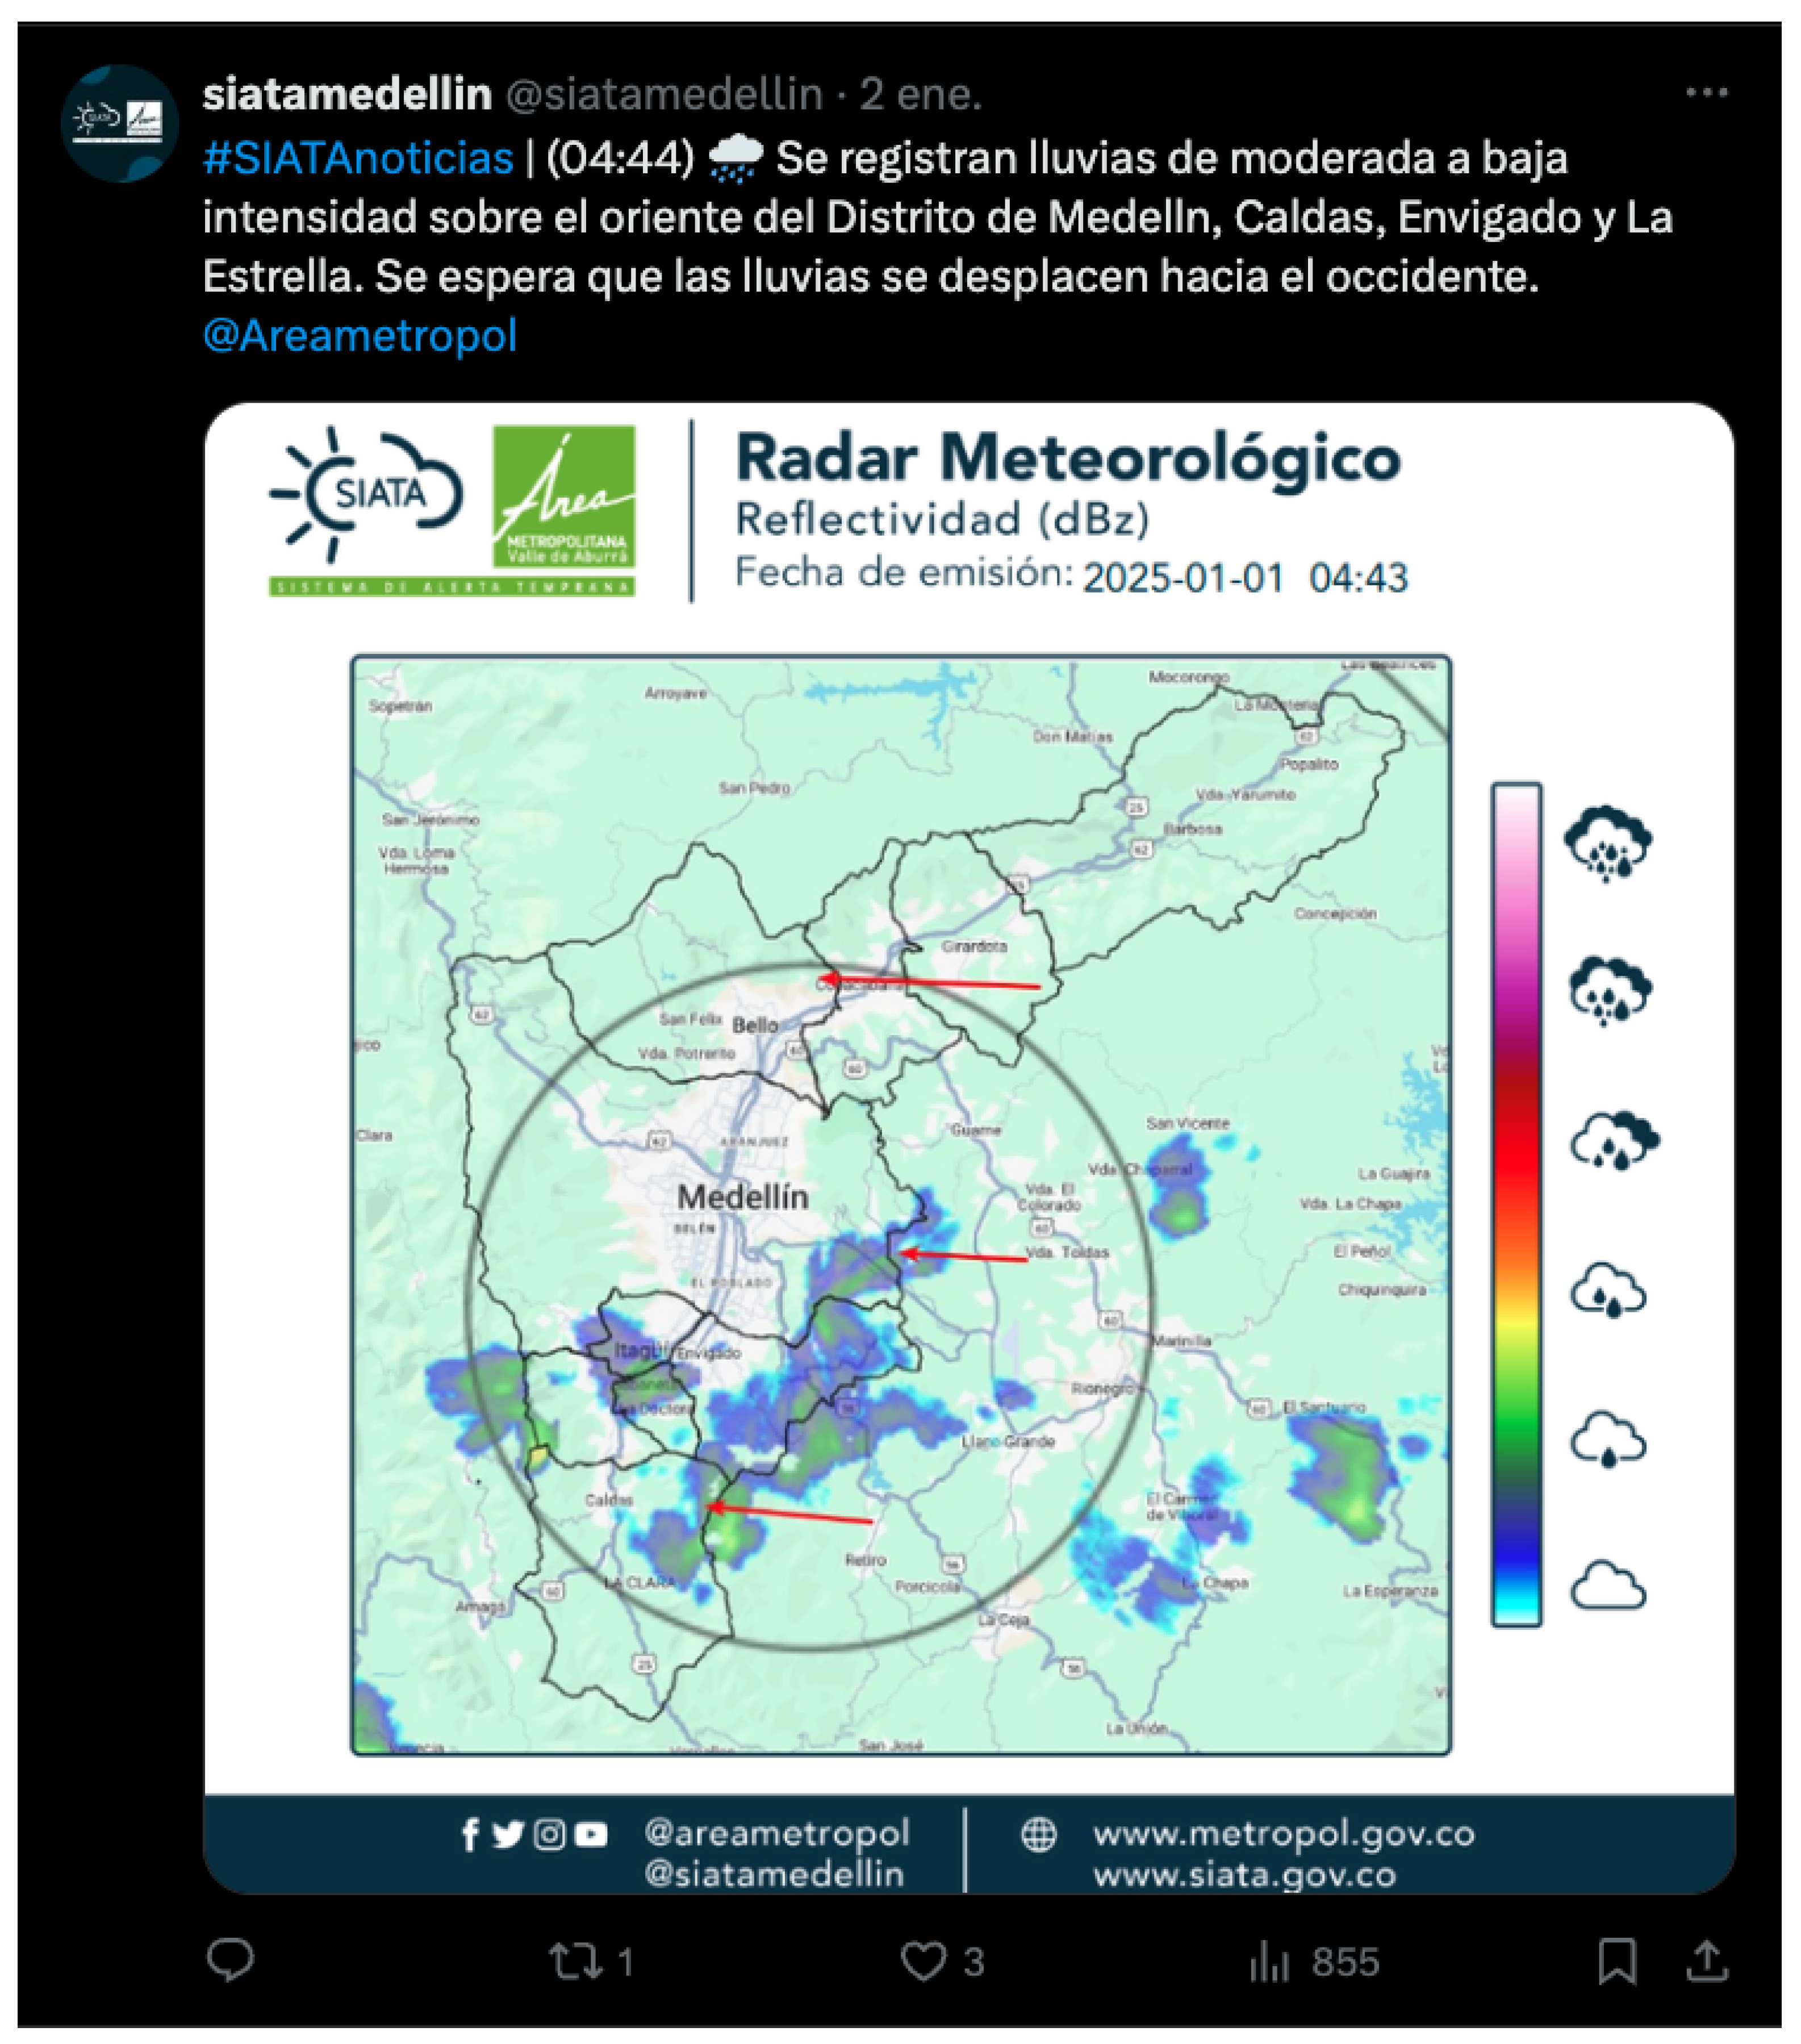
For anomalies detected in both lines, the first abnormal case was selected, corresponding to 2 January 2025. See Figure 10 for the absolute SHAP values that explain the hours when more abnormal behavior was observed during that day. From both rankings, 4 am and 12 pm are the times in common. Therefore, the intuition is that something relevant occurred at those hours. See Figure 11 for the identified X post that could explain the anomaly.
In Figure 11, the X post states moderate rainfall in the city of Medellin at 4 am. The formal public transport system in Medellin includes buses that serve the metro lines [42], so the weather conditions that morning might have caused those bus routes to get stuck in traffic, reducing the number of people in the metro stations. Regarding the other common time in both lines (i.e., 12 pm), no post was found in the two X accounts for that abnormal date, thus, an additional external data source would be beneficial, or we have just detected an overlooked problem like the malfunction in the AFC readers of one or some stations at that particular hour.
These two selected cases show the potential of the created approach for offline data auditing processes in both lines of the Colombian metro system. However, there are some important issues to discuss, and these are critical to attend to if we pursue a robust deployment of this solution.

4.3. Limitations of the Proposed Solution

Although the proposed multimodal learning approach, using numerical data from the Colombian metro, and images from two specific X accounts, shows its usefulness in identifying and explaining days with abnormal user traffic, the publicly available dataset used [7], is not as comprehensive as others, such as the commented cases of major cities like New York, Beijing, Shanghai, and Hangzhou, explained in Section 2. In particular, there is a lack of information on which stations the users go to and what fare they pay for the routes they follow. This OD data is crucial and has been leveraged before to measure efficiency in the travel times between metro stations [43]. Adding this OD pair will require expanding the available date information with another category to handle more patterns beyond weekdays and holidays.
Another issue is how we collect the posts from the X accounts of the Colombian metro and the local weather forecast. Currently, we conduct a manual research process using the X advanced search feature [44], filtering by the date and hours of the detected anomaly. But we are limited by the information shared on that social network. Therefore, if we partner with the company responsible for the management of the Colombian metro system, we could have an external data source directly connected to our AI approach, allowing better and faster retrieval of potential events affecting user traffic.
Furthermore, LLaVA is susceptible to hallucination. Hallucination is a recent concept used for foundation models, and can be defined as the generation of answers that may sound coherent, but the model’s reasoning is incorrect [45]. The answers provided in Figure 9 and Figure 11 are good enough. However, LLaVA is not yet a specialist in the transportation system of Medellin. Therefore, we propose to conduct in the future a context augmentation process by providing LLaVA with a corpus of different bus, tram, and cable car lines connected to the metro of Medellin, indicating how many lines exist, how they operate, in what directions, at what times, etc.

5. Conclusions and Future Work

Modeling user traffic behavior in metro systems is crucial as a visibility strategy for smart policy making and the protection against corrupted (abnormal) passenger patterns. In this paper, a solution to this area of infrastructure security was presented with a multimodal learning cybersecurity approach for the offline auditing of user traffic in the Colombian metro. We strongly believe that this solution represents a step toward defining a dynamic and fair pricing strategy for different stations according to their demand, and we also shed light on the importance of having destination data to better predict passenger congestion problems.
To the best of our knowledge, we are the first in the literature to use the publicly available data of the Colombian metro system. Furthermore, this solution is outstanding in the state of the art because we explore the S-SL TabNet architecture for producing high-quality embeddings, as well as two different methods of explainability based on absolute SHAP values for custom Deep Autoencoders, and the image understanding process of external data sources using LLaVA.
The proposed data categorization algorithm and the proper training of our custom Deep Autoencoder architectures produced results that demonstrate the interconnectivity of this metro, where the majority of the anomalies detected on one line also occur on the other, motivating a coordinated response for any emergency. Moreover, our classification task not only flagged those days with abnormal passenger inflow behavior, but also carefully explained the hours and detected the external events that could be responsible for those high reconstruction errors.
This study opens academic questions around S-SL and multimodal learning, like: what is the most suitable early fusion technique to model numerical, text, and image data in the pre-training phase of S-SL algorithms? By achieving this, the quality of the embeddings produced by the TabNet architecture will be highly improved, as they will not solely rely on numerical traffic data.
As future work, we plan to evaluate the proposed multimodal learning solution using data from other metro systems, providing a robust benchmark that considers not only passenger inflow patterns but also destination data and information at the station granularity level, as shared by some cities in China and the United States. Another direction is the online deployment of this system for real-time anomaly detection, which will involve modifying the hourly rate of user traffic to collect this information every couple of minutes instead.
We hope that this article serves as a valuable resource, for example, to the company responsible for the management of the Colombian metro, since we demonstrated the potential of their publicly available dataset and the importance of expanding its existing variables and information.

Author Contributions

Conceptualization, J.G.A.-R. and J.A.C.-C.; methodology, J.G.A.-R.; software, J.G.A.-R.; validation, J.G.A.-R., J.A.C.-C. and J.F.B.; formal analysis, J.G.A.-R.; investigation, J.G.A.-R.; resources, J.G.A.-R.; data curation, J.G.A.-R.; writing—original draft preparation, J.G.A.-R.; writing—review and editing, J.G.A.-R., J.A.C.-C., J.F.B., F.J.M. and B.D.M.; visualization, J.G.A.-R.; supervision, J.G.A.-R., J.A.C.-C. and J.F.B.; project administration, J.G.A.-R., J.A.C.-C. and J.F.B. All authors have read and agreed to the published version of the manuscript.

Funding

This research received no external funding.

Institutional Review Board Statement

Not applicable.

Informed Consent Statement

Not applicable.

Data Availability Statement

Publicly available data were used for this study. They can be found at https://datosabiertos-metrodemedellin.opendata.arcgis.com/search?tags=afluencia (accessed on 14 July 2025).

Acknowledgments

The authors would like to thank Christian Garzon for his valuable comments on the Colombian metro. Furthermore, Genaro Almaraz thanks the Tecnologico de Monterrey and Secretaría de Ciencia, Humanidades, Tecnología e Innovación (SECIHTI) for the scholarships during his PhD studies.

Conflicts of Interest

Authors Francisco Javier Muñoz and Brian David Martinez were employed by the company Aligo Defensores Informaticos S.A.S. The remaining authors declare that the research was conducted in the absence of any commercial or financial relationships that could be construed as a potential conflict of interest.

References

  1. Tan, S.; De, D.; Song, W.Z.; Yang, J.; Das, S.K. Survey of Security Advances in Smart Grid: A Data Driven Approach. IEEE Commun. Surv. Tutorials 2017, 19, 397–422. [Google Scholar] [CrossRef]
  2. Cui, J.; Chen, Y.; Zhong, H.; He, D.; Wei, L.; Bolodurina, I.; Liu, L. Lightweight Encryption and Authentication for Controller Area Network of Autonomous Vehicles. IEEE Trans. Veh. Technol. 2023, 72, 14756–14770. [Google Scholar] [CrossRef]
  3. Wu, F.; Zheng, C.; Zhou, S.; Lu, Y.; Wu, Z.; Zheng, S. An interpretable approach to passenger flow prediction and irregular passenger travel patterns understanding in metro system. Expert Syst. Appl. 2025, 265, 125991. [Google Scholar] [CrossRef]
  4. Introducing the Subway Origin-Destination Ridership Dataset. 2024. Available online: https://www.mta.info/article/introducing-subway-origin-destination-ridership-dataset (accessed on 14 July 2025).
  5. MTA Subway Hourly Ridership: 2020–2024. 2025. Available online: https://data.ny.gov/Transportation/MTA-Subway-Hourly-Ridership-2020-2024/wujg-7c2s (accessed on 14 July 2025).
  6. Safer Subways: Governor Hochul Announces Budget Investments to Protect Subway Riders and Transit Workers. 2025. Available online: https://www.governor.ny.gov/news/safer-subways-governor-hochul-announces-budget-investments-protect-subway-riders-and-transit (accessed on 14 July 2025).
  7. Datos Abiertos–Metro de Medellin–Afluencia. Available online: https://datosabiertos-metrodemedellin.opendata.arcgis.com/search?tags=afluencia (accessed on 14 July 2025).
  8. Tarifas Metro de Medellín. Available online: https://www.metrodemedellin.gov.co/usuarios (accessed on 20 August 2025).
  9. Yun, H.; Lee, E.H. Party politics in transport policy with a large language model. Transp. Policy 2025, 171, 487–496. [Google Scholar] [CrossRef]
  10. Datos Abiertos–Metro de Medellin–Tableros de Control. Available online: https://datosabiertos-metrodemedellin.opendata.arcgis.com/ (accessed on 14 July 2025).
  11. Yoon, J.; Zhang, Y.; Jordon, J.; van der Schaar, M. VIME: Extending the Success of Self- and Semi-supervised Learning to Tabular Domain. In Proceedings of the Advances in Neural Information Processing Systems; Larochelle, H., Ranzato, M., Hadsell, R., Balcan, M., Lin, H., Eds.; Curran Associates, Inc.: Red Hook, NY, USA, 2020; Volume 33, pp. 11033–11043. [Google Scholar]
  12. Arik, S.Ö.; Pfister, T. TabNet: Attentive Interpretable Tabular Learning. In Proceedings of the AAAI Conference on Artificial Intelligence, Virtual, 2–9 February 2021; Volume 35, pp. 6679–6687. [Google Scholar] [CrossRef]
  13. Gui, J.; Chen, T.; Zhang, J.; Cao, Q.; Sun, Z.; Luo, H.; Tao, D. A Survey on Self-Supervised Learning: Algorithms, Applications, and Future Trends. IEEE Trans. Pattern Anal. Mach. Intell. 2024, 46, 9052–9071. [Google Scholar] [CrossRef] [PubMed]
  14. Mahdavifar, S.; Ghorbani, A.A. Application of deep learning to cybersecurity: A survey. Neurocomputing 2019, 347, 149–176. [Google Scholar] [CrossRef]
  15. Lundberg, S.M.; Lee, S.I. A Unified Approach to Interpreting Model Predictions. In Proceedings of the Advances in Neural Information Processing Systems; Guyon, I., Luxburg, U.V., Bengio, S., Wallach, H., Fergus, R., Vishwanathan, S., Garnett, R., Eds.; Curran Associates, Inc.: Red Hook, NY, USA, 2017; Volume 30. [Google Scholar]
  16. Antwarg, L.; Miller, R.M.; Shapira, B.; Rokach, L. Explaining anomalies detected by autoencoders using Shapley Additive Explanations. Expert Syst. Appl. 2021, 186, 115736. [Google Scholar] [CrossRef]
  17. Liu, H.; Li, C.; Li, Y.; Lee, Y.J. Improved Baselines with Visual Instruction Tuning. In Proceedings of the IEEE/CVF Conference on Computer Vision and Pattern Recognition (CVPR), Seattle, WA, USA, 17–21 June 2024; pp. 26296–26306. [Google Scholar]
  18. Deng, Z.; Ma, W.; Han, Q.L.; Zhou, W.; Zhu, X.; Wen, S.; Xiang, Y. Exploring DeepSeek: A Survey on Advances, Applications, Challenges and Future Directions. IEEE/CAA J. Autom. Sin. 2025, 12, 872–893. [Google Scholar] [CrossRef]
  19. Civica. Medio de Pago Para que te Muevas por la Ciudad. Available online: https://civica.metrodemedellin.gov.co/ (accessed on 14 July 2025).
  20. Hangloo, S.; Arora, B. Multimodal fusion techniques: Review, data representation, information fusion, and application areas. Neurocomputing 2025, 649, 130827. [Google Scholar] [CrossRef]
  21. Wang, H.; Li, L.; Pan, P.; Wang, Y.; Jin, Y. Online detection of abnormal passenger out-flow in urban metro system. Neurocomputing 2019, 359, 327–340. [Google Scholar] [CrossRef]
  22. Wang, J.; Zhang, Y.; Wei, Y.; Hu, Y.; Piao, X.; Yin, B. Metro Passenger Flow Prediction via Dynamic Hypergraph Convolution Networks. IEEE Trans. Intell. Transp. Syst. 2021, 22, 7891–7903. [Google Scholar] [CrossRef]
  23. Zhang, Q.; Liu, X.; Spurgeon, S.; Yu, D. A two-layer modelling framework for predicting passenger flow on trains: A case study of London underground trains. Transp. Res. Part A Policy Pract. 2021, 151, 119–139. [Google Scholar] [CrossRef]
  24. Wei, X.; Zhang, Y.; Zhang, X.; Ge, Q.; Yin, B. Real-time passenger flow anomaly detection in metro system. IET Intell. Transp. Syst. 2023, 17, 2020–2033. [Google Scholar] [CrossRef]
  25. Bapaume, T.; Côme, E.; Ameli, M.; Roos, J.; Oukhellou, L. Forecasting passenger flows and headway at train level for a public transport line: Focus on atypical situations. Transp. Res. Part C Emerg. Technol. 2023, 153, 104195. [Google Scholar] [CrossRef]
  26. Zhang, Y.; Li, S.; Yuan, Y.; Yang, L. Multi-step look ahead deep reinforcement learning approach for automatic train regulation of urban rail transit lines with energy-saving. Eng. Appl. Artif. Intell. 2025, 145, 110181. [Google Scholar] [CrossRef]
  27. Apley, D.W.; Zhu, J. Visualizing the Effects of Predictor Variables in Black Box Supervised Learning Models. J. R. Stat. Soc. Ser. B Stat. Methodol. 2020, 82, 1059–1086. [Google Scholar] [CrossRef]
  28. Dosovitskiy, A.; Beyer, L.; Kolesnikov, A.; Weissenborn, D.; Zhai, X.; Unterthiner, T.; Dehghani, M.; Minderer, M.; Heigold, G.; Gelly, S.; et al. An Image is Worth 16x16 Words: Transformers for Image Recognition at Scale. arXiv 2021. [Google Scholar] [CrossRef]
  29. un año de reactivación y aportes del Metro al Valle de Aburrá. Available online: https://www.metrodemedellin.gov.co/al-dia/noticias/2022-reactivacion-y-aportes-del-metro-al-valle-de-aburra (accessed on 15 July 2025).
  30. Berahmand, K.; Daneshfar, F.; Salehi, E.S.; Li, Y.; Xu, Y. Autoencoders and their applications in machine learning: A survey. Artif. Intell. Rev. 2024, 57, 28. [Google Scholar] [CrossRef]
  31. Almaraz-Rivera, J.G.; Cantoral-Ceballos, J.A.; Botero, J.F. Enhancing IoT Network Security: Unveiling the Power of Self-Supervised Learning against DDoS Attacks. Sensors 2023, 23, 8701. [Google Scholar] [CrossRef]
  32. Almaraz-Rivera, J.G.; Cantoral-Ceballos, J.A.; Botero, J.F.; MuñOz, F.J.; Martinez, B.D. Hyphatia: A Card-Not-Present Fraud Detection System Based on Self-Supervised Tabular Learning. IEEE Open J. Comput. Soc. 2025, 6, 812–821. [Google Scholar] [CrossRef]
  33. Martins, A.; Astudillo, R. From Softmax to Sparsemax: A Sparse Model of Attention and Multi-Label Classification. In Proceedings of the 33rd International Conference on Machine Learning, New York, New York, USA, 19–24 June 2016; Balcan, M.F., Weinberger, K.Q., Eds.; Proceedings of Machine Learning Research. Curran Associates, Inc.: Red Hook, NY, USA, 2016; Volume 48, pp. 1614–1623. [Google Scholar]
  34. Dauphin, Y.N.; Fan, A.; Auli, M.; Grangier, D. Language Modeling with Gated Convolutional Networks. In Proceedings of the 34th International Conference on Machine Learning, Sydney, Australia, 6–11 August 2017; Precup, D., Teh, Y.W., Eds.; Proceedings of Machine Learning Research. Curran Associates, Inc.: Red Hook, NY, USA, 2017; Volume 70, pp. 933–941. [Google Scholar]
  35. Paszke, A.; Gross, S.; Massa, F.; Lerer, A.; Bradbury, J.; Chanan, G.; Killeen, T.; Lin, Z.; Gimelshein, N.; Antiga, L.; et al. PyTorch: An Imperative Style, High-Performance Deep Learning Library. In Proceedings of the Advances in Neural Information Processing Systems; Wallach, H., Larochelle, H., Beygelzimer, A., d’Alché-Buc, F., Fox, E., Garnett, R., Eds.; Curran Associates, Inc.: Red Hook, NY, USA, 2019; Volume 32. [Google Scholar]
  36. Zhang, D.; Yu, Y.; Dong, J.; Li, C.; Su, D.; Chu, C.; Yu, D. MM-LLMs: Recent Advances in MultiModal Large Language Models. arXiv 2024. [Google Scholar] [CrossRef]
  37. Huang, D.; Yan, C.; Li, Q.; Peng, X. From Large Language Models to Large Multimodal Models: A Literature Review. Appl. Sci. 2024, 14, 5068. [Google Scholar] [CrossRef]
  38. Liu, H.; Li, C.; Wu, Q.; Lee, Y.J. Visual Instruction Tuning. In Proceedings of the Advances in Neural Information Processing Systems; Oh, A., Naumann, T., Globerson, A., Saenko, K., Hardt, M., Levine, S., Eds.; Curran Associates, Inc.: Red Hook, NY, USA, 2023; Volume 36, pp. 34892–34916. [Google Scholar]
  39. Radford, A.; Kim, J.W.; Hallacy, C.; Ramesh, A.; Goh, G.; Agarwal, S.; Sastry, G.; Askell, A.; Mishkin, P.; Clark, J.; et al. Learning Transferable Visual Models From Natural Language Supervision. In Proceedings of the 38th International Conference on Machine Learning, Virtual, 18–24 July 2021; Meila, M., Zhang, T., Eds.; Proceedings of Machine Learning Research. Curran Associates, Inc.: Red Hook, NY, USA, 2021; Volume 139, pp. 8748–8763. [Google Scholar]
  40. Chiang, W.L.; Li, Z.; Lin, Z.; Sheng, Y.; Wu, Z.; Zhang, H.; Zheng, L.; Zhuang, S.; Zhuang, Y.; Gonzalez, J.E.; et al. Vicuna: An Open-Source Chatbot Impressing GPT-4 with 90%* ChatGPT Quality. 2023. Available online: https://lmsys.org/blog/2023-03-30-vicuna/ (accessed on 25 August 2025).
  41. Lin, D.; Broere, W.; Cui, J. Metro systems and urban development: Impacts and implications. Tunn. Undergr. Space Technol. 2022, 125, 104509. [Google Scholar] [CrossRef]
  42. Stiller, D.; Wurm, M.; Sapena, M.; Nieland, S.; Dech, S.; Taubenböck, H. Does formal public transport serve the city well? The importance of semiformal transport for the accessibility in Medellín, Colombia. PLoS ONE 2025, 20, e0321691. [Google Scholar] [CrossRef]
  43. Lee, E.H. eXplainable DEA approach for evaluating performance of public transport origin-destination pairs. Res. Transp. Econ. 2024, 108, 101491. [Google Scholar] [CrossRef]
  44. How to Use Advanced Search. Available online: https://help.x.com/en/using-x/x-advanced-search (accessed on 28 July 2025).
  45. Chakraborty, N.; Ornik, M.; Driggs-Campbell, K. Hallucination Detection in Foundation Models for Decision-Making: A Flexible Definition and Review of the State of the Art. ACM Comput. Surv. 2025, 57, 1–35. [Google Scholar] [CrossRef]
Figure 1. Overview of the proposed offline inference process. First, the 22 input features of the analyzed day are fed to the Deep Autoencoder of the corresponding metro line (A or B). Then, after using SHAP for unsupervised learning, the most important features contributing to the anomaly are highlighted in red, while those in green are the ones offsetting the anomaly (i.e., not contributing to the high mean squared error in the abnormal sample). Finally, using LLaVA, with the text-image pair of the example user prompt and the X post, we are able to report the detection result with a higher level of confidence, finding an event that could justify the anomaly.
Smartcities 08 00198 g001
Figure 2. Daily average of the number of passengers in both lines, A and B, of the Colombian metro. 100 records were used to calculate these results, with information from 22 December 2024, until 31 March 2025.
Smartcities 08 00198 g002
Figure 3. Line A (blue color) traverses the city of Medellin from south to north, including 21 stations, while Line B (red color) includes seven stations and is perpendicular to it.
Smartcities 08 00198 g003
Figure 4. Number of occurrences of each traffic category per metro line. Both plots exhibit the same pattern, where the u s u a l class is the most prevalent, followed in decreasing order by the h i g h , l o w , and o u t l i e r categories.
Smartcities 08 00198 g004
Figure 5. This proposed Deep Autoencoder uses the transformed numerical data. The multi-step TabNet encoder, including several transformer-like blocks where the input features are normalized using sparsemax for feature attention, generates a latent space z that is then passed to a set of fully connected layers, increasing in dimension, to reconstruct the inflow traffic behavior of the metro.
Smartcities 08 00198 g005
Figure 6. Training plots for both lines, A and B. The validation loss is measured together with early stopping to prevent overfitting. Moreover, the learning rate is continuously decreased, since this solution space seems to benefit from a low step size.
Smartcities 08 00198 g006
Figure 7. Distribution of the reconstruction errors calculated from the testing samples, and their separation according to the reconstruction threshold ϵ calculated separately for each line.
Smartcities 08 00198 g007
Figure 8. Ranking of the top five absolute SHAP values for the abnormal day 5 March 2025 detected in Line A. These hours guide the search for the X posts of that date for using LLaVA.
Smartcities 08 00198 g008
Figure 9. Image understanding results when explaining the abnormal day 5 March 2025, in Line A. LLaVA receives as input the X post in (a), that describes a traffic accident at 01:45 pm in that date, and the following prompt: Analyze the next image {IMAGE_PATH}. Given its message. Is it affecting the transportation system? Why? The following is LLaVA’s answer: [...] The image depicts a scenario where there is one less bus on Line 0 due to an accident, indicating that this accident has caused disruptions in the public transportation system. The infographic highlights the impact of such incidents on the transit schedule and suggests that these accidents can have broader implications for commuters, traffic flow, and overall transportation efficiency. [...]. In (b), there is the corresponding map, where the yellow portion of the pink bus line was affected by the traffic accident, and the blue line is the Line A of the metro.
Smartcities 08 00198 g009aSmartcities 08 00198 g009b
Figure 10. Ranking of the top five absolute SHAP values per metro line, for the abnormal day 2 January 2025 detected by both Deep Autoencoders. These hours guide the search for the X posts of that date for using LLaVA.
Smartcities 08 00198 g010
Figure 11. Image understanding results when explaining the abnormal day 2 January 2025, for both Lines A and B. LLaVA receives as input the presented X post, that describes moderate rainfall over the city of Medellin at 04:44 am in that date, and the following prompt: Analyze the next image {IMAGE_PATH}. Given its message. Is it affecting the transportation system? Why? The following is LLaVA’s answer: [...] This image relates to the weather system, rather than transportation. The presence of rainfall could potentially affect the transportation system by causing flooding or slippery roads that may lead to accidents or disruptions in service schedules. [...].
Smartcities 08 00198 g011
Table 1. Comparison between this work and the related state of the art about integrating AI in modern metro systems for passenger flow modeling.
Self-Supervised LearningExplainable AILarge Multimodal ModelsExternal Data Sources
Wang et al., 2019 [21]
Wang et al., 2021 [22]
Zhang et al., 2021 [23]
Wei et al., 2023 [24]
Bapaume et al., 2023 [25]
Wu et al., 2025 [3]
Zhang et al., 2025 [26]
This work
Table 2. Description of the 22 features extracted from the public Colombian metro dataset.
FeatureDescription
Date information
Is weekendBoolean numerical value to indicate if the day is a weekday (0) or weekend (1).
Is holidayBoolean numerical value to indicate if the day is a holiday (1) in the country or not (0).
Time information
04:00:00, 05:00:00,…, 23:00:00Granularity at the hour level. The normal operation time of the metro spans from 4 am to 11 pm.
Table 3. Hyperparameter values selected for the extracted encoders from the original TabNet architecture.
VariableSelected Value
Batch size32
Virtual batch size32
Maximum learning rate5 × 10 5
Minimum learning rate1 × 10 5
Number of blocks (steps)3
Number of shared layers2
Number of independent layers2
Momentum0.3
Embedding dimension8
Feature re-usage ( γ )2
Dimension of the attention layer8
Table 4. Days detected as anomalies by the different Deep Autoencoders. 67% of the occurrences in one metro line also exist in the other, proving their interconnectivity. These days in common are in green color.
Line ALine B
2 January 20251 January 2025
3 January 20252 January 2025
7 January 20253 January 2025
9 January 20257 January 2025
5 March 202510 January 2025
24 March 202524 March 2025
Disclaimer/Publisher’s Note: The statements, opinions and data contained in all publications are solely those of the individual author(s) and contributor(s) and not of MDPI and/or the editor(s). MDPI and/or the editor(s) disclaim responsibility for any injury to people or property resulting from any ideas, methods, instructions or products referred to in the content.