Article

Pedal Power: Operational Models, Opportunities, and Obstacles of Bike Lending in North America

1
Civil and Environmental Engineering, University of California, Berkeley, CA 94704, USA
2
Transportation Sustainability Research Center, University of California, Berkeley, CA 94704, USA
*
Author to whom correspondence should be addressed.
Smart Cities 2025, 8(6), 185; https://doi.org/10.3390/smartcities8060185
Submission received: 2 September 2025 / Revised: 26 October 2025 / Accepted: 29 October 2025 / Published: 4 November 2025

Highlights

What are the main findings?
  • Bike lending programs lower cost and access barriers to encourage cycling adoption.
  • Programs personalize experiences via bike fittings, gears, and safety training.
  • Bike lending experts and users recommend more cycling infrastructure to increase safety and use.
What are the implications of the main findings?
  • The findings imply that sustained investment in bike lending programs and supportive cycling infrastructure can enhance equitable access, safety, and long-term adoption of cycling as a sustainable transportation mode.

Abstract

Bike lending offers a service that enables individuals to borrow bicycles for short-term use (i.e., ranging from 2 hours to 36 months), typically from designated locations within cities, campuses, or communities. Unlike bikesharing systems that typically rely on automated kiosks and/or undocked and free-floating devices for public access, bike lending involves a managed program with staff, similar to a library model. These programs can be administered by community organizations, bike shops, public libraries, and other local entities. They are typically community- or membership-based, with many programs associated with non-profit organizations or publicly owned and operated. In this paper, we investigate bike lending in the United States and Canada as of Spring 2024, including a literature review, the identification and characterization of bike lending programs (n = 55), expert interviews (n = 24), a survey of bike lending operators (n = 31), and 2 focus groups with a total of 12 participants. Insights from expert interviews and operator surveys highlight the experiences of professionals involved in bike lending. The focus groups capture the experiences of bike lending users. This paper finds that North American bike lending is often tailored to the specific needs of communities, such as youth, low-income individuals, and the general population. More sustained funding could support program expansion and diversify bike offerings. Enhancing cycling infrastructure, such as adding dedicated bike lanes and paths, could improve overall cycling safety and increase participation in bike lending programs. This study’s findings could help strengthen existing bike lending programs, guide the development of new initiatives and supportive policies, and enhance safe bicycle use for participants.

1. Introduction

Bike lending provides individuals with an opportunity to experience bike ownership and mobility for extended periods (ranging from a few hours to a few months). It differs from bikesharing models, including station-based, dockless services, and hybrid models that include both, since bike access and use typically have little to no financial investment, extend temporal access beyond per trip travel, and participants are responsible for bike storage [1]. We opt for the general term bike lending, rather than bike lending libraries, as the term “library” suggests the services are free. Some programs require participants to place a deposit or other financial commitment, whereby the use of the term “library” can be misleading. However, bike lending programs typically do not profit from lending transactions and are often focused on addressing local community, environmental, transportation, and equity challenges (e.g., providing clean mobility options for underserved communities).
Bike lending programs exist in various built environments (urban, rural, suburban) across the U.S. and are typically designed to address community needs (such as cycling education, financial barriers to bike use, community building, physical activity). Many offer a variety of bikes, often ranging in size and type (e.g., pedal bike, e-bike, cargo bike, etc.) that can serve a wide range of age groups and abilities. While offering participants an active transportation mode for trips, bike lending allows individuals to evaluate how cycling may fit into their lifestyle before acquiring a bike, including more expensive e-bikes and cargo e-bikes. As cities explore strategies to improve transportation sustainability, accessibility, and equity, bike lending can support these goals. It can help meet the needs of populations who are traditionally underserved by bikesharing due to cost and service area limitations.
While it is widely believed that bike lending has grown over the last decade (i.e., 2014 to 2024), there is a lack of systematic documentation on bike lending in North America. This study aims to document the existence and better understand operational models, opportunities, and challenges to bike lending in the U.S. and Canada. The research team conducted this study from January to April 2024, including a literature review, expert interviews, and focus groups, to better understand bike lending operations (e.g., business model, lending arrangements, safety training, and program insurance), geographical distribution, safety considerations, bike infrastructure needs, social and environmental impacts, and the financial resources needed to support the bike lending programs.
Through this paper, we document our findings in response to the following research question: What is the state of bike lending in North America? This paper is organized into four sections, beginning with a literature review describing bike lending. Next, we describe the data and methodology for our research. Then, we present the results of our research, followed by our conclusions from this research.

2. Literature Review

This literature review was conducted between January 2024 and March 2025, and it includes gray literature, academic literature, and professional literature. We identified relevant research through general online search engines and academic databases (e.g., Google, Google Scholar). Key search terms include bike lending, bike equity, bike infrastructure challenges, and the impacts of bike lending. It is important to note that there is a limited number of peer-reviewed publications specific to bike lending. Based on the identified literature, this review is organized into three subsections: bike lending business models, the role and impact of bike lending programs, and barriers to bike lending and the adoption of cycling.

2.1. Bike Lending Business Models

Bike lending offers access to a bike without an ownership commitment. However, bike lending programs in the United States and Canada have distinct business models that are different from bikesharing (according to SAE International JA3163 [2], bikesharing is defined as “A service that provides travelers on-demand, short-term access to a shared fleet of bicycles, usually for a fee. Bikesharing service providers may own, maintain, and provide charging (if applicable) for the bicycle fleet”). In this paper, we define “business model” as the operational, funding, and service delivery strategy of a program. Bike lending programs tend to offer a community-focused approach by allowing individuals to access a bike at community destinations (i.e., public library, bike shop, community center, etc.). Alternatively, bikesharing often relies on public rights-of-way for bike storage and leverages user fees to support the programs (i.e., membership, time-based fees) [3]. Participation in a bike lending program is often free or low-cost and typically only involves fees when a bike is lost [4,5]. This free or low-cost access to bikes is often aimed at reducing the barriers to bike use. Additionally, the process of bike lending is often similar to checking a book out from the library, further reducing barriers (i.e., requirement to have a smartphone and credit or debit card) that may exist in traditional bikesharing programs [6,7]. Figure 1 illustrates the key similarities and differences between bike lending and bikesharing.

2.2. Role and Impact of Bike Lending Programs

Bike lending programs are often designed to meet community needs and may be implemented with various desired outcomes. For example, programs may focus on offering participants an opportunity to try a bike before they purchase their own, reducing vehicle emissions by substituting vehicle trips with a bicycle, or addressing transportation equity challenges [4,5,8]. Programs focused on helping users decide if they want to purchase a bike may emphasize the use of a bike for commuting and highlight the importance of determining if it fits an individual’s lifestyle [9]. One study [10] on commuting patterns after the implementation of a company bike lending program suggests that offering a diverse range of bikes can encourage participation from more employees. Additionally, lessons learned from bikesharing suggest that understanding the demographic characteristics of potential users is essential for developing programs that appeal to diverse communities [3].
Bike lending programs may also help provide users with access to employment, education, and services. Programs with this focus may support improved quality of life among participants and foster greater connectivity and accessibility within a community [6]. A survey of participants in a bike loan program in Western Sydney, Australia, where participants paid $25 to borrow a bike, found that they rode the bike an average of twice per week and reported increased levels of physical activity as a result of the program [11]. Additionally, equity-focused programs may provide support for cycling infrastructure investments in areas that were previously underserved [12].
In addition, bike lending programs can promote the adoption of bikes, including supporting equity and more accessible communities [5,8]. Based on the adoption trends of mobile phones and electric vehicles, exposure to bikes through longer-term test rides and financial incentives may support the trial use and adoption of bikes and e-bikes [4].

2.3. Barriers to Bike Lending and Adoption of Cycling

Physical challenges and negative perceptions of cycling may discourage participation in bike lending and the broader adoption of cycling. Many people have concerns regarding the physical exertion required, navigating roads, and the risk of potentially sharing the road with a vehicle, which prevents them from trying or adopting cycling. A lack of bike-friendly infrastructure, such as protected lanes and bike paths, exacerbates the perceived danger for cyclists and potential users. Research from Pucher and Buehler, suggest in 2019, 902 cyclists died in the U.S. from fatal crashes, which is much higher than other high-income countries such as the Netherlands, Denmark, and Germany [13]. More recent data from The League of American Bicyclists indicate in 2023, 1166 cyclists were killed by fatal crashes in the U.S. [14]. By comparison, the Canadian Automobile Association reports that an average of 74 cyclists are killed in crashes each year in Canada [15]. As such, initiatives aimed at improving the safety of cycling infrastructure may play a role in the success of bike adoption [16]. Pucher and Buehler explain the need for physical separation between vehicles and cyclists, such as dedicated cycle tracks, to improve cycling safety and encourage more cycling [13]. In addition, a study from the National Association of City Transportation Officials suggests that the number of cyclist fatalities declined in seven U.S. cities that invested in high-comfort bike infrastructure between 2007 and 2014 [17].
Research suggests the need for comprehensive strategies to change the perceptions of cycling as a transportation mode [18]. Local geography (e.g., hills) may present physical challenges, and the inconvenience of arriving at destinations in a less-than-presentable state may further compound these barriers [19]. A study in Montreal, Canada found that weather may also impact cycling rates, with humidity and precipitation negatively impacting cycling counts [20]. One study among two multi-family housing communities who had access to community e-bikes found that the expense of a bike or bike related gear was the most common barrier to cycling [21]. Storage for a bike and understanding of bike maintenance may also present barriers for individuals interested in adopting cycling [22].

3. Data and Methodology

In this study, we employed four methods of data collection: identification and characterization of bike lending programs in North America (n = 55), expert interviews (n = 24), a survey of bike lending program operators (n = 31), and focus groups with bike lending users (n = 12 participants). We used these methods to characterize and understand bike lending programs from both the operator and participant perspectives. These methods and their limitations are described in the following subsections.

3.1. Identification and Characterization of Bike Lending Programs

We identified and characterized bike lending programs to catalog the currently operating bike lending programs, with online and publicly available information, in the U.S. and Canada. This process occurred from January 2024 to April 2024 and primarily involved online research and the review of bike lending program websites using search terms such as bike lending, bike library, book a bike, e-bike lending, e-bike library, and reserve a bike, followed by geographical qualifiers such as state names (e.g., bike lending California) and country names (e.g., bike lending Canada). The search yielded 58 programs, which were narrowed to 55 that met the criteria for bike lending. Three programs were excluded because their characteristics were more consistent with bikesharing, or there was insufficient information to categorize them as bike lending. For programs that were less clearly defined, we also considered the mission and objectives to determine whether they aligned more closely with bike lending or traditional bikesharing. The bike lending programs span the U.S. (n = 49) and Canada (n = 6). We distinguished bike lending and bikesharing primarily on our assessment of the program’s structure, goals, terms of use, and pricing structure (if applicable). Each identified program was recorded in a spreadsheet and categorized according to:
  • General information (i.e., location, type of organization, year of inception);
  • Bike types offered (i.e., e-bikes, mountains bikes, children’s bikes, tricycles, etc.);
  • Accessories offered (i.e., helmet, basket, bike lock, etc.);
  • Populations served (i.e., general, youth, low income, etc.);
  • Lending arrangements (i.e., requirement of user agreement/waiver, library, card, photo ID, deposit, etc.);
  • Safety training (i.e., education provided on helmet use, hand signals, road signage, etc.);
  • Other services/incentives offered (i.e., bike purchase assistance, bike purchase discount);
  • Additional information (i.e., website link, contact information).
We used information from the expert interviews to supplement this process when data were not available online.
There are a few limitations associated with the identification and characterization of bike lending programs. Some bike lending program may not have websites, or existing websites are not maintained on a regular basis, which may contribute to the inadvertent exclusion or an inaccurate categorization of a program. We also found some bike lending programs operate on a seasonal basis (i.e., bikes are available during the summer months only). Given this process was conducted primarily during the winter months, the seasonal effect may have contributed to outdated information online (i.e., from the previous season of operation). We also excluded bike lending programs that operated in the past and are no longer in operation or do not have information online. Additionally, not all websites provided information on all eight categories previously identified. For example, it is difficult to identify the program start date and the number of available bikes for some programs. Two bike lending programs in California were excluded (i.e., City of Long Beach E-Bike Lending Library and Leimert Park Ride On! Bike Co-Op) because they launched late in the research process and lacked available information prior to their launch.

3.2. Expert Interviews

We interviewed 24 stakeholders to gain insight on bike lending programs. We targeted stakeholders representing diverse programs with different types of bikes, those that cater toward different users, and programs with a variety of business models. As a result, the experts included diverse roles such as program leaders, executives, or directors (42%); program managers (29%); program staff (i.e., librarian, mechanic) (17%); and program founders (13%). We recruited expert interview participants via email, asking if they were interested in participating in an interview, based on the contact information identified through the process of identifying and categorizing bike lending programs. We also asked interviewees if they recommended other individuals to participate in the interviews (i.e., snowball recruitment). We conducted the expert interviews from January 2024 to March 2024 via Zoom, which lasted approximately one hour. We employed an interview protocol with questions regarding operations, safety, infrastructure, and resources needed to support bike lending and ridership to guide the expert interviews. We analyzed the expert interview findings by grouping responses across all interviews by theme and quantifying repeated responses. Findings from the expert interviews are integrated throughout the Results section as they align with the presented categories (i.e., program growth, goals, and funding; operations; and experience and user impacts). Table 1 indicates the organizations and bike lending programs represented through the expert interviews.

3.3. Survey of Operators

To collect additional information on bike lending in North America, we employed a survey of bike lending operators. We used Qualtrics to populate a digital survey and distributed the survey link by email, including the closing date of the survey. The survey was sent to 51 individuals associated with bike lending operations, and this resulted in 31 responses for the analysis (61% response rate). We were unable to contact all 55 bike lending operators because some lacked available contact information, and others were not yet operational. We accepted survey responses from 12 March 2024 to 10 April 2024. The responses represent bike lending programs from Canada (2), the U.S. (28), and one unknown location. We identified survey participants based on the bike lending programs found in our review and through expert interviews. The most common role among survey respondents was program manager, representing 12 out of 31 participants. The next most common category was “Other,” which, based on written responses, included roles such as communications manager, volunteer safety trainer, founder, and owner. The remaining respondents included executive directors (n = 3/31), library directors (n = 2/31), librarians (n = 2/31), and outreach coordinators (n = 1/31).
Similar to the expert interviews, the operator survey included a series of questions related to the operational details of the bike lending programs, bike safety, and resources needed to support bike lending. In addition, we also asked about the operator’s role and perspective on the impacts of bike lending. The survey attempted to collect sociodemographic data of participants; however, only five bike lending programs reported that they collect data from their participants. This has been excluded from our analysis due to the limited respondents providing program demographics. Thus, the survey did not capture data from all the bike lending programs known to exist in the U.S. and Canada.

3.4. Focus Groups

We conducted two focus groups with bike lending program participants (n = 12 total) to gain insight into the bike lending experience and impacts from the participant perspective. The focus group participants were recruited from the following bike lending programs: (1) Markham Cycles (Ontario, Canada) (n = 6), (2) Newmarket Cycles (Ontario, Canada) (n = 3), and (3) Rutland E-bike Lending Library (Vermont, U.S.) (n = 3). The Markham and Newmarket Cycles lending programs both offer a variety of bikes including adult tricycles, e-bikes, pedal bikes, and youth bikes. While the Rutland E-bike Lending Library exclusively offers e-bikes, it offers various types including commuter, fat tire, folding, longtail, and recumbent tricycle. We conducted the focus groups via Zoom in April 2024, which lasted about 1.5 h. All participants were offered a gift card to select merchants upon the conclusion of the focus groups. During the focus groups, we asked about participant overall experience with bike lending, safety perceptions, strategies to improve safety, and the impacts of bike lending (e.g., changes in modal shift or travel behavior, new challenges or opportunities due to bike lending, deciding to purchase a bike, etc.). Each focus group was guided by a protocol. Similar to the expert interviews, we grouped responses from all participants by theme and question, and we quantified repeated responses among the participants. The findings from the focus groups are primarily presented in the Results section describing the bike lending experience and user impacts (Section 4.3). A limitation of the focus groups was their limited representation across different geographic areas and built environments (e.g., urban and rural). All three programs are located in areas with similar weather conditions, offering limited insight on the role of weather in bike lending participation. Additionally, the Newmarket Cycles and Rutland bike lending programs are in exurban cities, whereas Markham Cycles is located in an edge city of Toronto, Canada. These programs do not offer insights into the operations and impacts of bike lending programs in highly urbanized city centers.

4. Results

This section presents the results of our research on bike lending to better understand the operations, challenges, and opportunities. First, we present results that help to characterize bike lending and its history, including growth, objectives, funding, and fleets. Next, we explore bike lending operations including the participation process, safety training, program insurance, and the resources needed to support bike lending programs. Last, we describe bike lending experiences and user impacts, including participation and bike use, participant safety, bike safety and infrastructure, and the impacts of bike lending.

4.1. Bike Lending Growth, Program Goals, and Funding

In this section, we explore bike lending’s history, program distribution, program goals and population, funding, and fleets.

4.1.1. History of Bike Lending

To document the history of bike lending in North America, we recorded the year in which bike lending programs started. After excluding 11 programs for which the start date was unavailable, we found 58% of the remaining bike lending programs (n = 42) began between 2019 and 2023. Figure 2 provides an overview of the number of bike lending programs in the U.S. and Canada over the past three decades. At the time of our data collection, to our knowledge all of the programs identified were still in operation.

4.1.2. Distribution of Bike Lending Programs

In total, we identified 55 bike lending programs in the U.S. (89%) and Canada (11%). In the U.S., we found the greatest number of bike lending programs in California and Ohio, with 10 in each state. Other notable states with multiple bike lending programs include Oregon (four programs), Vermont (four programs), Colorado (three programs), and Virginia (three programs). The six bike lending programs in Canada are located in the provinces of Ontario (three programs), British Columbia (two programs), and Manitoba (one program). The symbols in Figure 3 indicate the locations where we identified bike lending programs and the types of bikes offered in each location. Not all locations are labeled on the map, and two programs were identified in the following locations: Denver, Colorado; Eugene, Oregon; and Winter Park, Florida. In addition, this map may include programs that ended since the completion of this research and exclude programs that ended prior to this research.
Through the operator survey, we found 52% (n = 16) of programs are associated with non-profits, followed by 39% of programs publicly owned and operated (n = 12). One program was privately owned and operated, another was publicly owned but privately operated, and a third followed an unspecified ownership and operational model. Based on our findings, many of the publicly owned and operated bike lending programs are housed at public libraries and other public facilities (i.e., community centers). Other bike lending programs may have been operated from a bike shop or other facilities (e.g., private business, home, or university). The research team also noted seven bike lending programs housed and operated at colleges and universities:
  • Lane Community College,
  • Roanoke College,
  • Rollins College,
  • Montclair State University,
  • University of California, Berkeley,
  • University of Massachusetts Amherst, and
  • University of Oregon.

4.1.3. Bike Lending Objectives and Populations Served

Our analysis, including the expert interviews, revealed that bike lending programs have diverse program goals, such as:
  • Encouraging the exploratory use of bikes to inform future purchase decisions, especially for e-bikes;
  • Promoting awareness and education about cycling as a clean transportation mode;
  • Providing bicycles for transportation and to support physical activity;
  • Bringing a clean mobility option to an underserved community;
  • Reducing financial barriers for children or low-income families to access bikes; and
  • Building a community of cyclists that may influence infrastructure changes.
Some experts (n = 5/24) noted the mission of their bike lending program was influenced by funding opportunities (i.e., clean mobility, transportation equity, health initiatives, etc.) and may have evolved over time. For example, one program expressed they initially received funding for the bike lending library to support modal shift from cars to e-bikes. However, they found their program had a greater impact on quality of life. For instance, some participants previously struggled with unreliable transportation to commute to work. After receiving access to a bike, they were able to arrive at work on time or take jobs with different hours (e.g., nighttime).
Across the diverse goals of bike lending programs, they tend to serve a variety of populations. Some programs are designed for commuters, while others serve populations who tend to bike for recreation. A few experts noted that program participants are usually not experienced cyclists, and many have not ridden a bike in years—often not since childhood (n = 3/31). One expert explained that many e-bike program participants had never ridden an e-bike prior to their program participation. Thus, program staff recognize the need for training on bike use, as well as education to promote safe riding among users.
Most bike lending programs (n = 38/50) appear to be designed for the general adult population, i.e., individuals aged 18 years or older. However, there may be additional eligibility criteria before they can participate in the bike lending program (e.g., providing proof of residency or a library card). Some programs serve more specific populations such as youth, low-income individuals, or group affiliates (i.e., university students and staff). We identified 15 programs that provide children’s bikes (exclusively or in addition to adult bikes) and two programs that specialize in bike lending for low-income individuals. To participate in certain bike lending programs, individuals must meet specific criteria—such as age, income level, employment status, or presenting a school-issued ID card.
The expert interviews explored the opportunities and challenges of bike lending. The most cited opportunity was access to pedal bikes or e-bikes at little to no cost (n = 18/24). Other opportunities discussed by the experts interviewed include: enhancing personal independence or mobility (n = 5/24), allowing participants to try a bike before they purchase their own (n = 4/24), providing a chance to explore and enjoy the local area (n = 4/24), offering health benefits (n = 3/24), promoting environmental sustainability (e.g., using a bike instead of a car) (n = 3/24), creating opportunities for community building (n = 3/24), and enabling mobility to complete daily tasks (n = 3/24). Two experts noted their programs support cycling safety training and education to the community. Conversely, the operator survey found that the greatest bike lending opportunities are the associated with physical health benefits (n = 19/30). Table 2 presents the benefits provided by bike lending programs from the operator survey.

4.1.4. Funding

Bike lending programs are funded through a variety of sources including grants, city or regional government funding, private donations, and local business partnerships. Grants may serve as initial seed money, as demonstrated with the Brattleboro and Rutland E-Bike lending libraries, which were initially started by Local Motion, a state bike and pedestrian advocacy group. After a few years, Local Motion required local efforts to take over the bike lending operations and fund the program. Government funding also plays a role in supporting bike lending programs. For example, the City of Oakland program benefits from California’s cap-and-trade funds, and the Ghisallo Cycling Initiative leverages federal traffic safety funding. The Bike Center in Santa Monica initially received city funding, but later they integrated the bike lending program into the bike shop business model. Regional government funding and school board contributions support The Centre for Active Transportation in Canada. Some lending programs are also started or supported through personal investments, like those made by the founders of the Camberville E-Bike Lending Library and Charlottesville E-Bike Lending Library. These programs have evolved to receive more community support through donations and local business partnerships. Business sponsorships and community donations may also support operations as demonstrated by Norte Youth Cycling and Shared Mobility Inc. These diverse funding mechanisms reflect the different approaches and funding opportunities that may support bike lending programs.
Many experts expressed aspirations to grow the program, but they are faced with operational challenges (such as limited funding, limited staffing, physical space constraints) (n = 8/31). As such, few programs expressed they are currently in the process of expanding or have plans to expand. Aspirations for program expansion include increasing the number of bikes available, providing a greater variety of bike types, or adding adaptive bikes, which tend to be more expensive than pedal bikes and e-bikes.

4.1.5. Bike Lending Fleets and Bike Models

We also asked the experts a series of questions about bike lending fleets. The bike lending programs acquire bicycles through diverse strategies to meet their specific operational needs. Many bike lending programs partner with local bike shops to leverage local expertise and support (n = 7/31). This may also allow for support for participants interested in purchasing a personal bike following program participation. Other programs, like Camberville and Charlottesville E-Bike Lending Libraries, combine several methods, such as direct purchases from the manufacturer, community donations, and partnerships with manufacturers to build their fleets. Bike lending programs that operate through bike shops may purchase bikes from manufacturers and other distributors, as they would for general bike sales. Some programs noted a portion of their fleet may have been acquired through a direct donation of bikes. Programs offering e-bikes often prioritize vendors they deem as reputable, like Aventon, Gazelle, Rad Power, Specialized, and Trek.
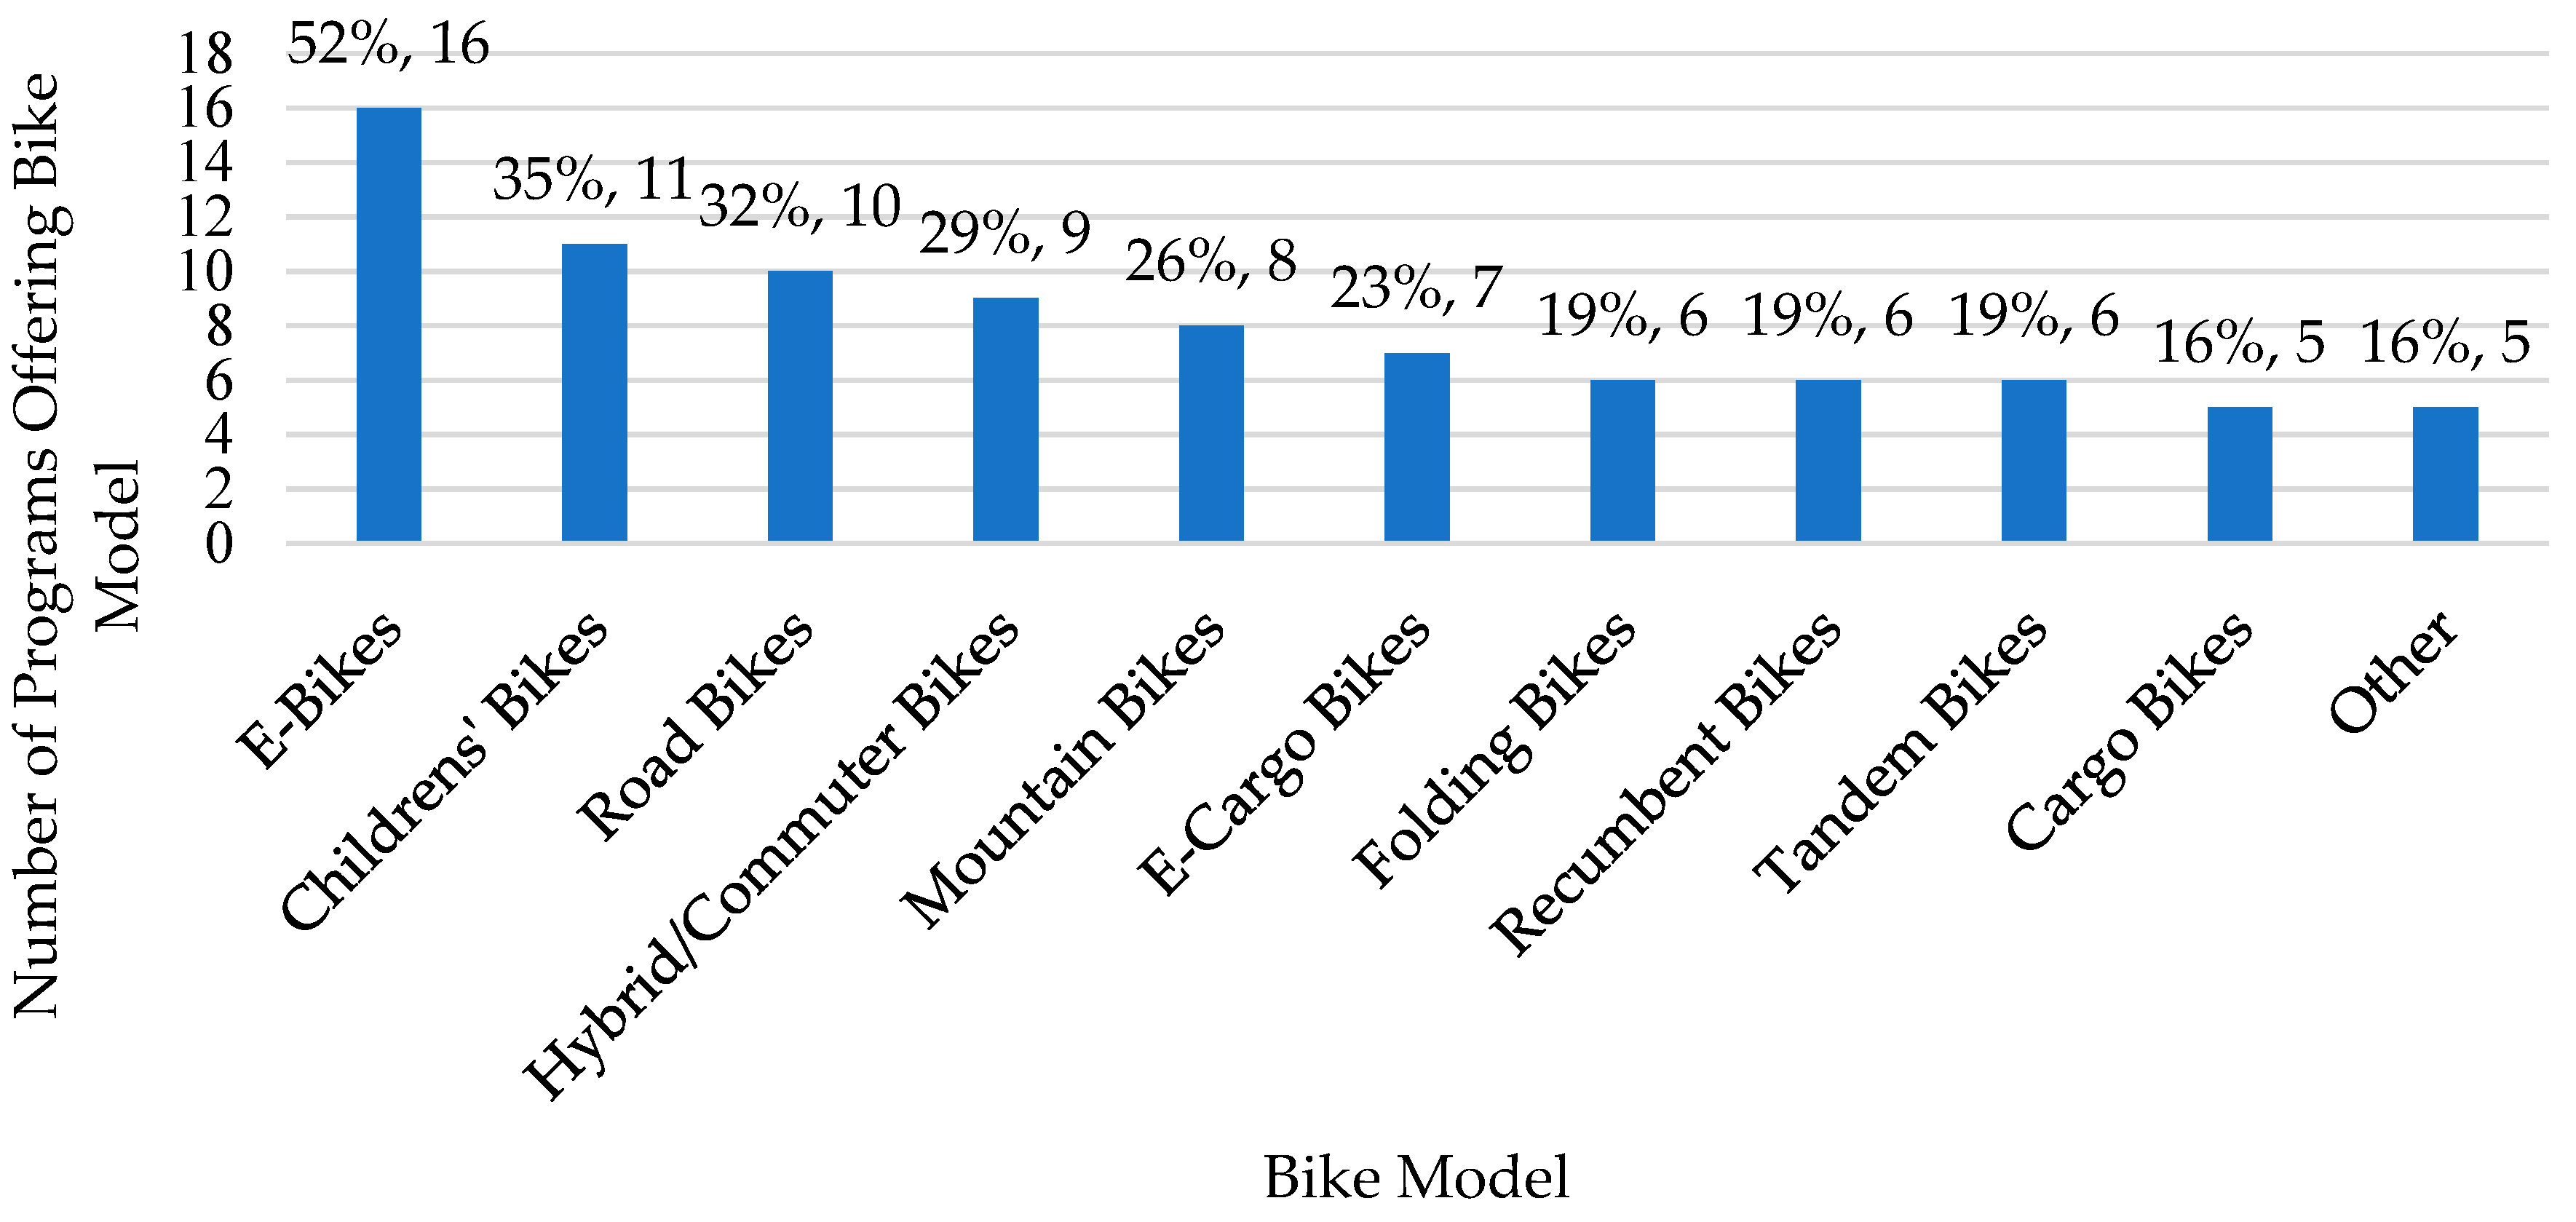
To better understand the fleet composition of bike lending programs, we asked operators in our survey to indicate the types of bikes offered. The survey results indicate that the most popular bike model is an e-bike (n = 16/31), followed by children’s bikes (n = 11/31), and road bikes (n = 10/31). Operators who indicated they offer other types of bikes noted tricycles, ultra-low step through bikes, adaptive bikes, and tag-along bikes (i.e., trailer bikes for children that can attach to an adult bike). Figure 4 provides additional information on the bike models offered by the number of programs reported in the survey.
Bike lending fleets are often planned to address program goals or community needs. Some programs specialize in providing certain types of bikes (i.e., children’s bikes, e-bikes, pedal bikes), while others offer a variety of bike types. Additionally, within e-bike lending programs, a variety of e-bikes (i.e., e-cargo bikes, fat tire e-bikes, commuter e-bikes, folding e-bikes, etc.) may be offered to support participants who are looking to inform an e-bike purchase decision. Some experts also noted the importance of including step-through bikes or adaptive bikes to support accessibility and equity among a range of potential users. The bike lending programs with the fewest bikes offer as few as two bikes, while bike lending programs with the greatest number of bikes offer 800 to 900 bikes. Fleet size is often limited by logistical constraints such as storage space and funding. For this analysis, the e-bike category is inclusive of all three classes (Since 2014, PeopleForBikes has promoted a three-class e-bike regulation system in the U.S. Class 1 e-bikes are equipped with motors, but they only provide assistance when the rider is pedaling and only up to 20 miles per hour (mph). Class 2 bikes have a motor that can be activated without pedaling and up to 20 mph. Class 3 e-bikes have a motor and speedometer, but they only assist when the rider is pedaling and may reach speeds up to 28 mph [23].) and types of e-bikes (i.e., e-mountain bike, foldable e-bike, etc.), except for e-cargo bikes.

4.2. Bike Lending Operations

In this section, we explore bike lending program operations and the participation process, safety training, program insurance, and the resources needed to support bike lending programs.

4.2.1. Bike Lending Program Operations and Participation Onboarding Process

The bike lending process typically begins with the completion of a registration form, often allowing participants to express interest in a specific bike type. Programs often require participants to complete a waiver of liability or agree to certain lending terms and conditions before receiving a bike. Most programs are free to participants, offering a low financial investment opportunity to try a bike. However, some programs ask for donations, require a deposit or other collateral, or charge participants if a bike is not returned or returned with damage. The GoSGV program in California requires participants to pay a monthly membership fee, but after 36 months of continuous membership, the participant may keep the bike.
Program staff may assist participants in adjusting the bike, distributing accessories, and sometimes offer advice on safe operations and suggest participants complete a test ride. Similar to borrowing a book from a library, participants are expected to return the bike within a defined time period and in reasonable condition. Bike lending programs typically do not impose geographical restrictions for bike use, but they may request participants store the bike indoors to reduce the risk of theft.
The most offered accessories are bike locks (87% of programs represented in survey) and helmets (77% of programs represented in survey), and participants are often required to take these accessories. Through the expert interviews, we found the provision of helmets is often mandatory due to liability and safety concerns. In other cases, helmets may be offered on an optional basis (i.e., participants do not provide their own helmet) or when the program has helmets available to provide to participants (i.e., they have a limited number of helmets available relative to the number of bikes). The experts explained many programs provide locks to help prevent theft while the participant is responsible for the bike. Some programs offer bikes with built-in or optional lighting to support general visibility or night riding. Additionally, several programs offer practical accessories like baskets, bells, panniers, and cargo trailers for personal belongings. Tag-along bikes for children and bike modifications like child seats or handlebars cater to families. More specialized items, like reflective vests, handlebar mittens for winter riding, e-bike chargers, extra e-bike battery, first aid kits, repair kits, and safety pamphlets are also provided by certain programs. The accessories offered often depend on the program’s focus and resources, with some prioritizing a basic set for every rider while others provide a more extensive range to meet specific needs.
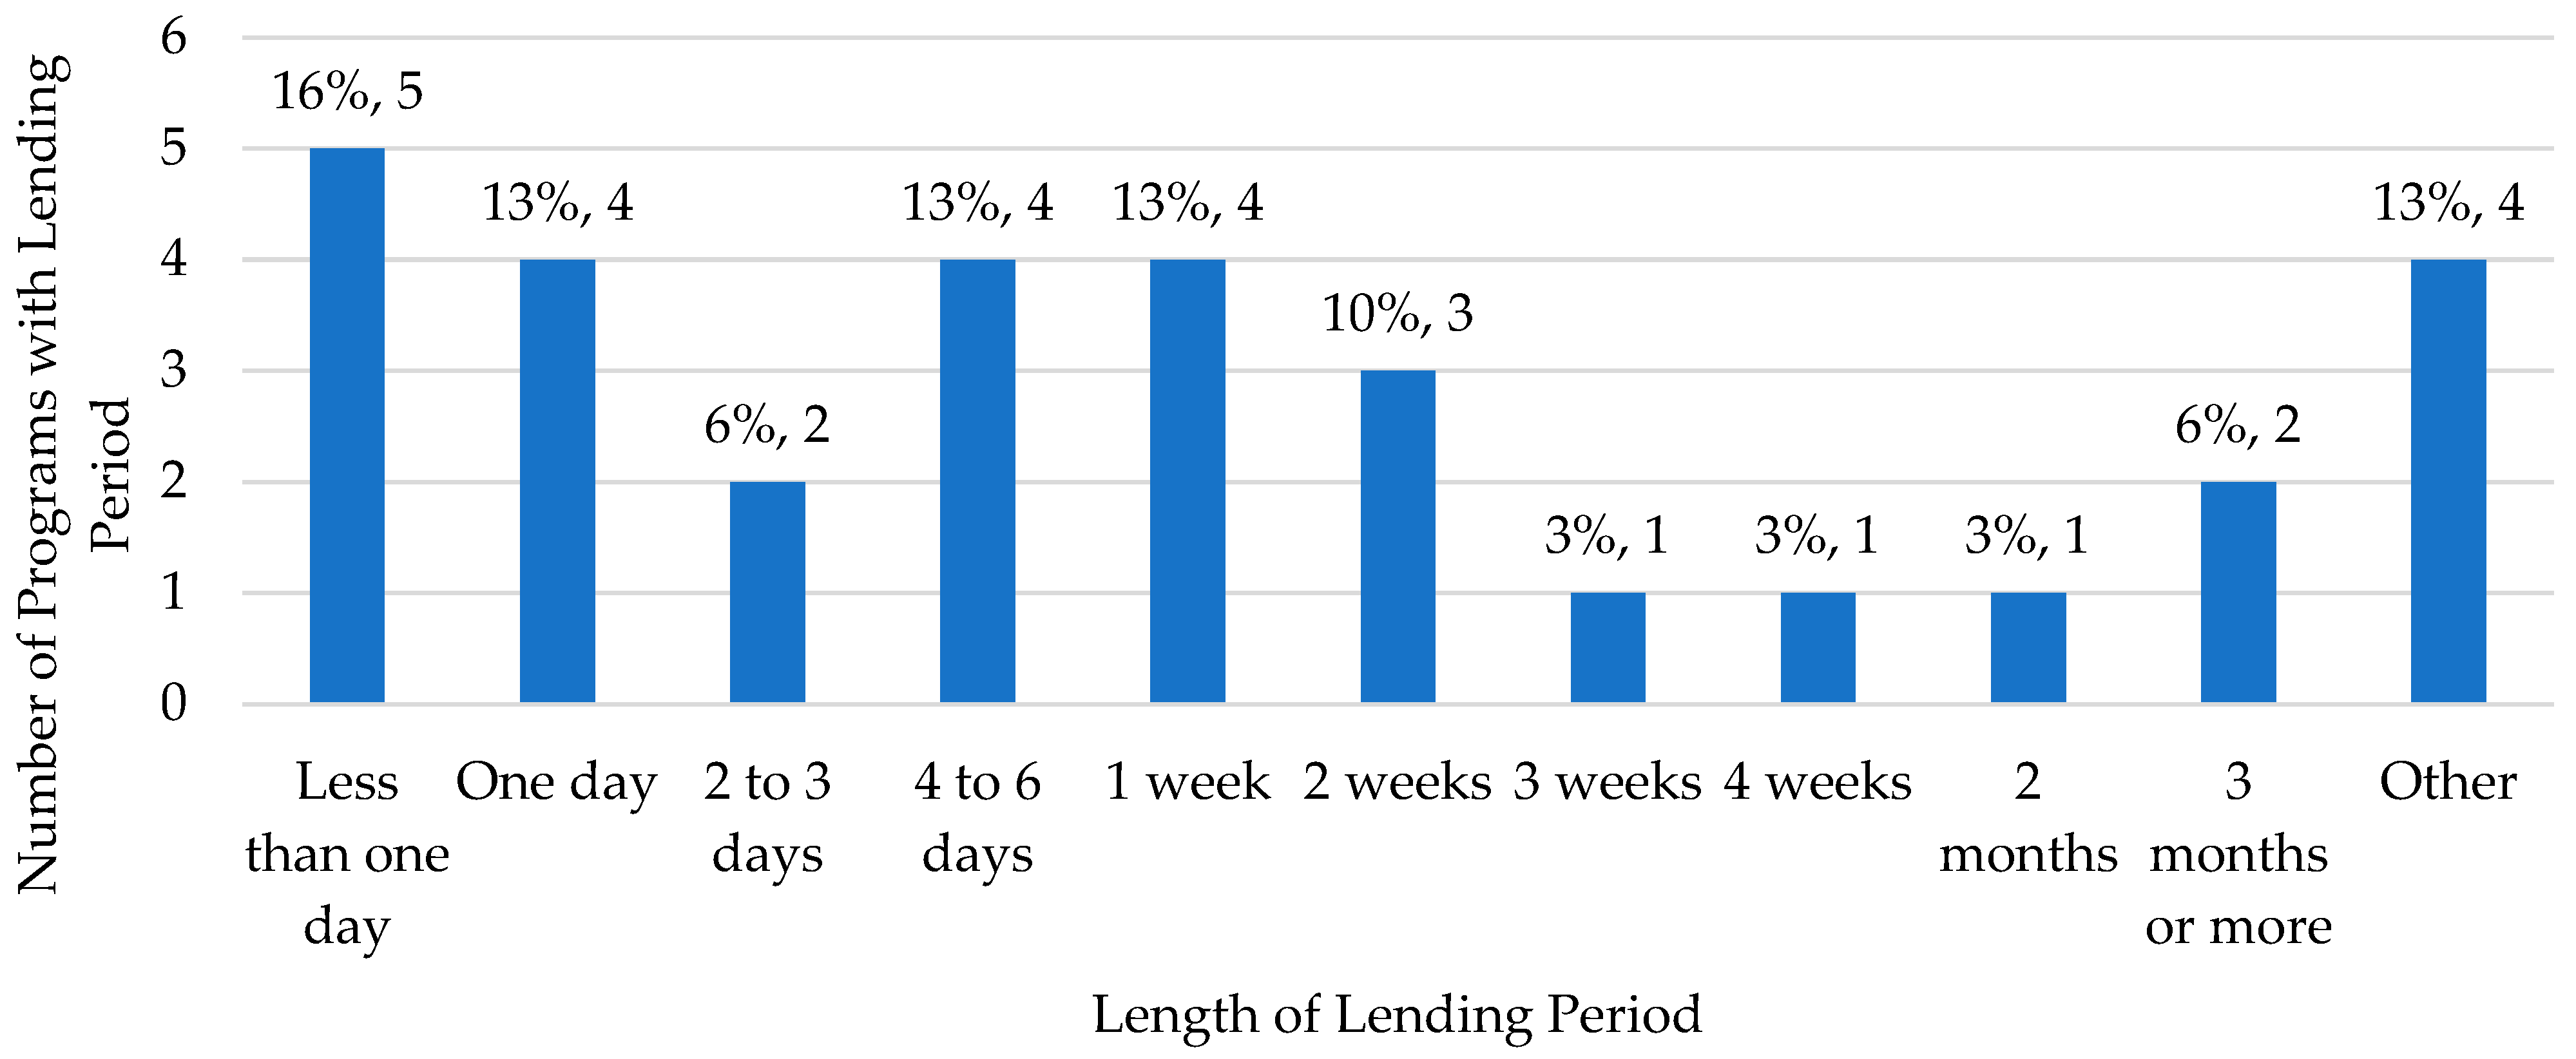
We found the length of time participants may borrow a bike (referred to as the lending period) varies among bike lending programs, ranging from two hours to 36 months (e.g., GoSGV program). Survey respondents indicated the length of the lending period before the bike loan ends or must be renewed. Based on available data, the median lending period is one week. The most reported lending period was less than one day (16%). However, at least one program was represented in each lending period (ranging from less than one day to three or more months). Figure 5 provides greater detail on the various lending periods for bike lending programs.
If a bike is not returned to the lending program, experts (n = 14/24) indicated they attempt to recover bikes by having the program coordinators contact participants (i.e., phone call, email, mail) requesting that they return the bike. If the participant does not respond or refuses to return the bike, the programs may refer to the GPS tracking devices (if available), visit the borrower’s physical address, and/or report the bike as stolen to law enforcement. Experts noted a lost, stolen, or unreturned bike becomes the liability of the participant, per the signed agreement. However, many organizations noted they may not enforce repayment for the bike. Experts explained they attempt to understand the circumstances of a lost or stolen bike, and they recognize many participants use the bike lending program because they cannot afford their own bike. Some participants may be unable to afford the replacement cost of the bike. Bike recovery rates vary across the programs, but overall, the experts noted few to no stolen bikes over the life of their program. Many suggest participant recognition of the program’s value, pre-lending education on bike security, and the provision of a lock promote the safe return of the bike at the end of the lending period.
We identified four programs that assist participants interested in purchasing their own bike (e.g., advising on a bike model to purchase based on their bike lending program experience), and another four programs offer discounts or discount codes for a bike purchase. The programs providing purchase assistance and/or discounts for a bike purchase come from programs offering e-bikes. A unique model is the RVA E-Bike Library in Virginia, which partnered with a bike shop to offer a $500 e-bike rebate, helmet, and lock to public school teachers and city employees in Richmond, Virginia. Additionally, some bike lending programs that are part of larger organizations (e.g., programs offering other bike-related programming) offer “earn-a-bike” programs or other opportunities for individuals to obtain a free or low-cost pedal bike (i.e., at least four programs).

4.2.2. Safety Training

Among the experts involved in bike lending operations, there were several approaches to disseminating safety information, ranging from required safety training to voluntary discussions on bike operations and the rules of the road. We found through the expert interviews that participants are often provided with an overview of the bike, safety tips, best practices for bike storage/locking, location-specific safety recommendations, route planning, and answers to any questions participants have before leaving with the bike. Some experts described attempts to gauge participant knowledge of cycling and tailor these discussions to each participant’s needs. Alternatively, some bike lending programs provide additional cycling safety training (i.e., group rides, clinics, or bike maintenance workshops). Experts working with e-bike lending programs expressed the importance of a pre-lending safety discussion, given that most participants are first-time e-bike users. A few experts suggest e-bike lending participants complete a test ride nearby to verify that they are comfortable and do not have any questions about e-bike operations.
To gain a better understanding of the safety precautions associated with bike lending programs, we asked operators in the survey if program participants are provided with safety training prior to lending and the topics covered in the safety training. About half of the programs (n = 16/31) do not require safety training. The remaining 15 programs either provide safety training prior to lending a bike (n = 7) or offer optional safety training/programming (n = 8). Due to the additional safety concerns associated with e-bikes (i.e., ability to travel at faster speeds), we analyzed the presence of a safety training program, with respect to offering e-bikes and/or e-cargo bikes. The analysis suggests that seven programs require safety training prior to lending e-bikes or e-cargo bikes. Table 3 provides greater detail on safety training for 31 bike lending programs.
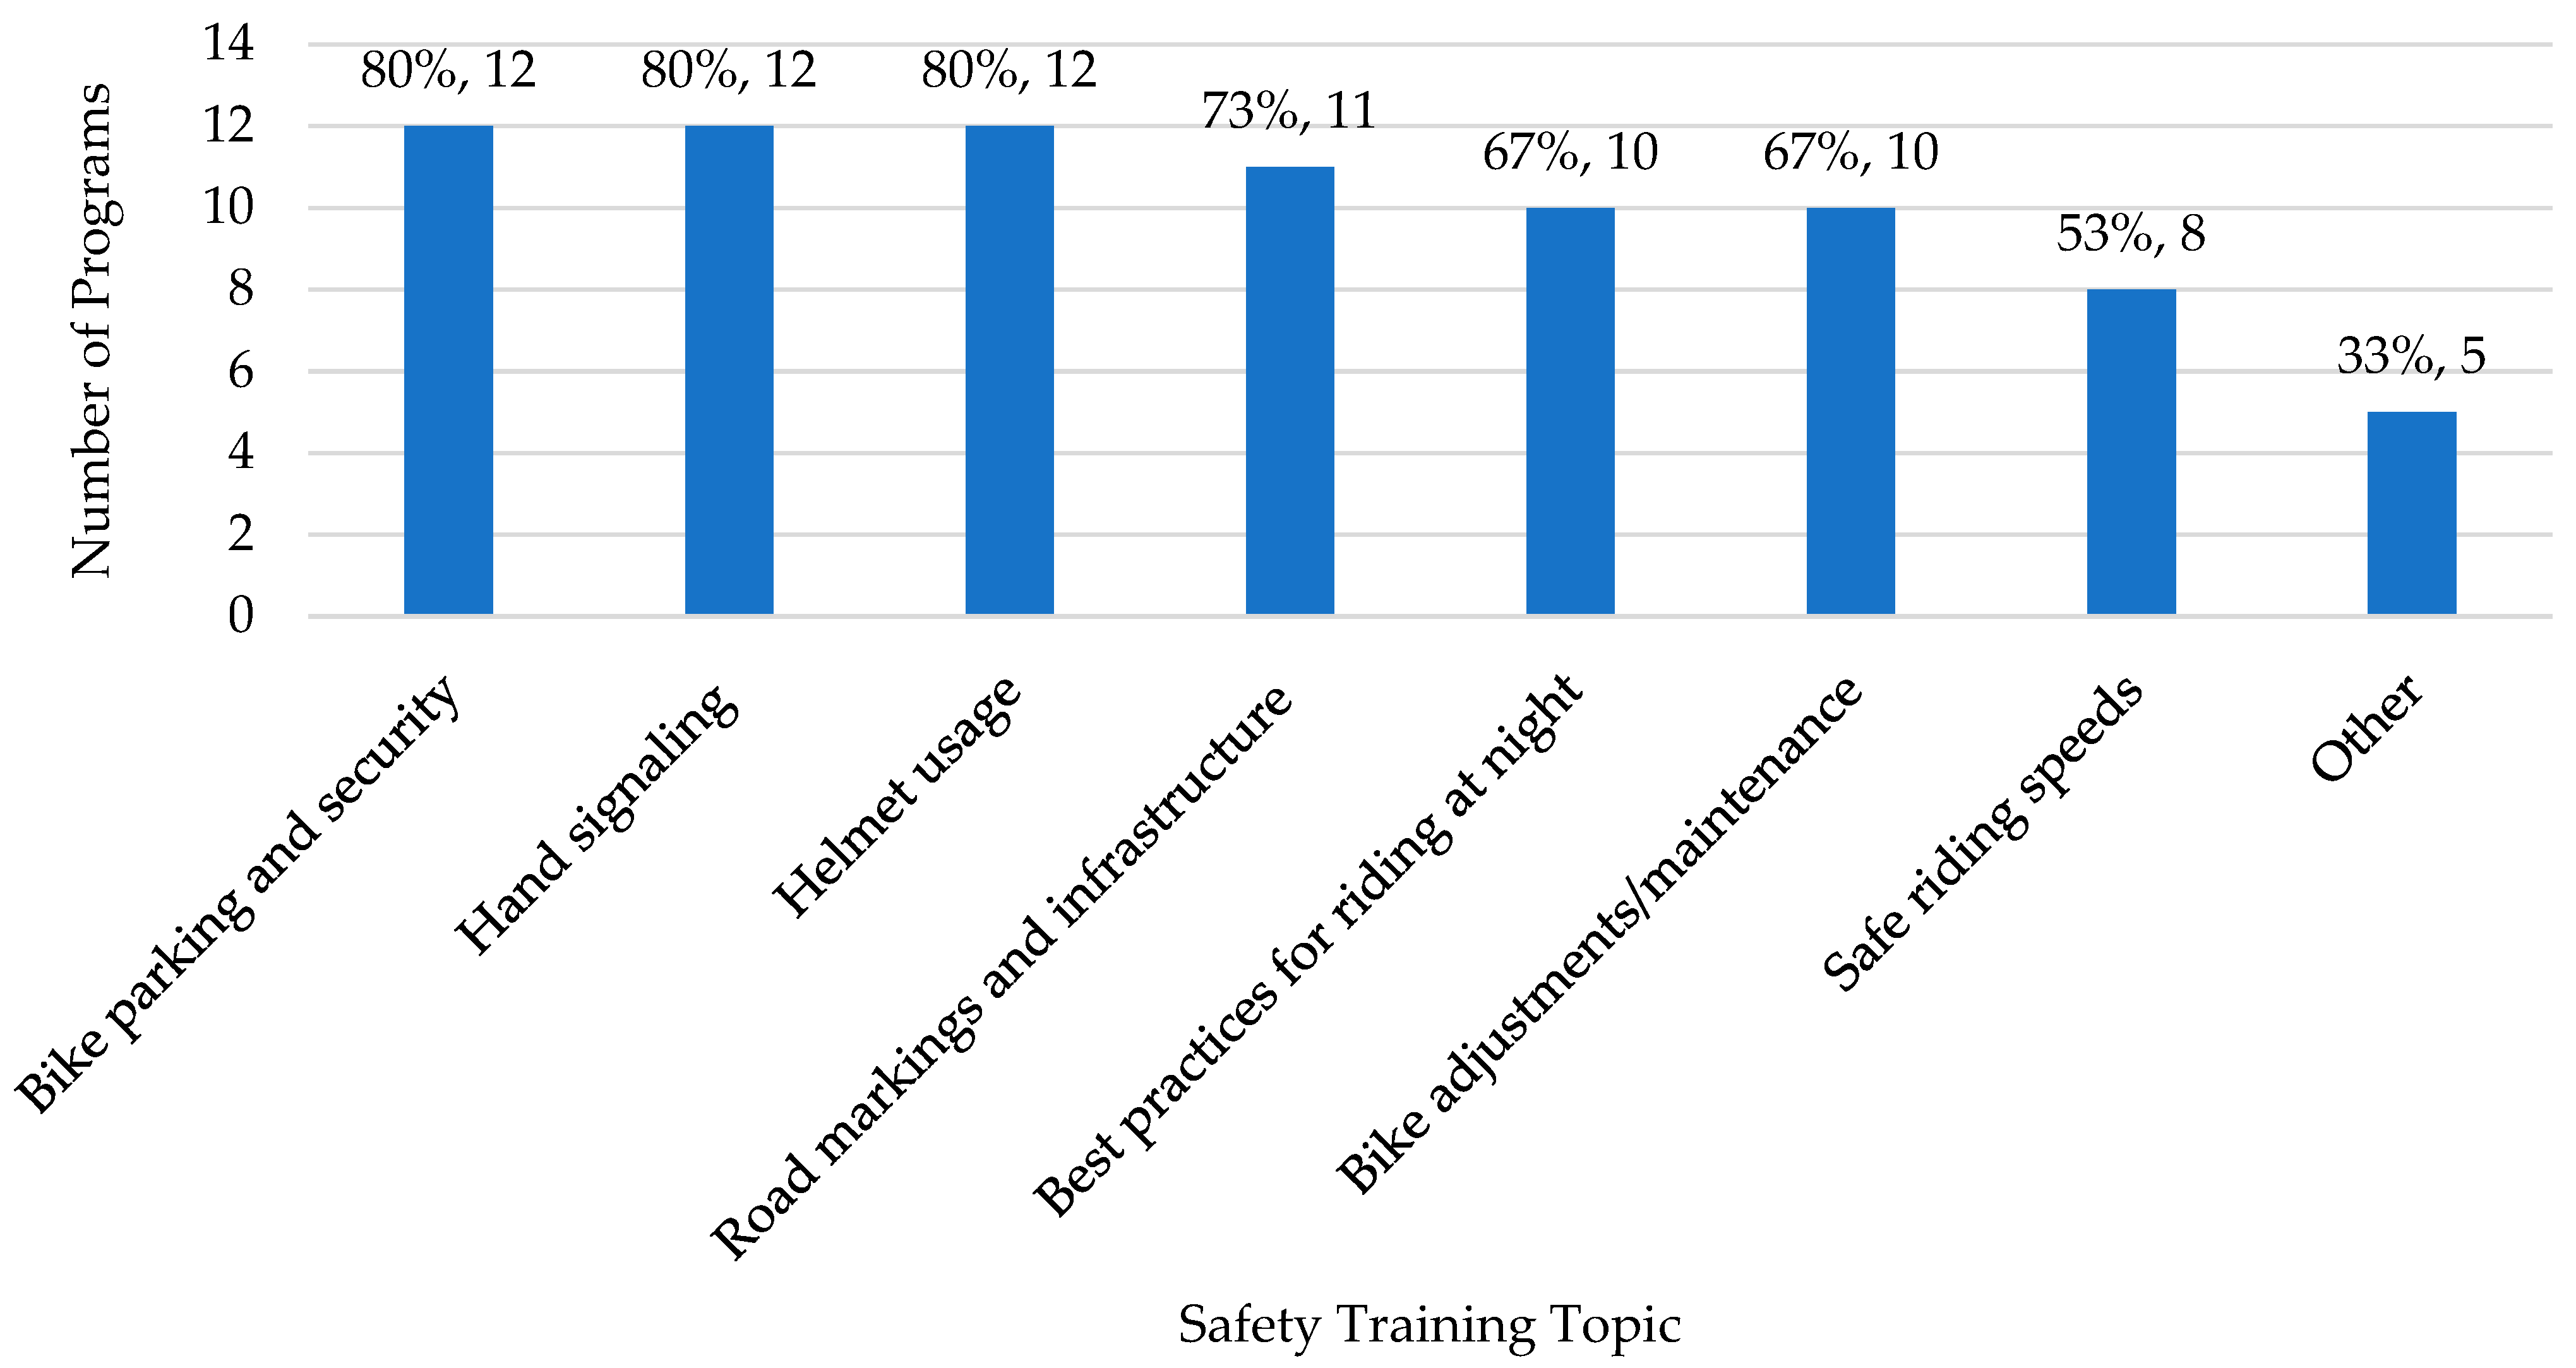
We asked respondents who indicated their programs either require safety training or offer optional safety training/programming (n = 15) about the topics covered in the training. The most common topics include bike parking and security (n = 12), hand signaling (n = 12), and helmet use (n = 12). Respondents also indicated other safety training topics such as: proper shifting and braking, removing the front wheel, local laws, pre-ride safety check, biking etiquette, and winter riding tips. Figure 6 provides additional information on the training topics.

4.2.3. Program Insurance

We asked the experts about insurance coverage for their bike lending programs. Program experts typically described insurance in one of three ways, they:
  • Accept liability risks without insurance due to high insurance costs;
  • Have insurance through a broader policy that may cover other programs or a broader entity (i.e., city recreation department that supports various activities); or
  • Hold their own insurance policy.
Some of the experts, particularly those working with programs offering e-bikes and holding insurance policies, described the process of obtaining insurance as a difficulty. The challenges relate to the uncertainty of e-bike safety among insurance writers and meeting insurance requirements set forth by grant programs. Additionally, some experts noted they carry insurance for the bikes through the manufacturer, in the case a bike is lost, stolen, or not returned.

4.2.4. Support and Resources for Bike Lending Programs

Despite the potential benefits provided by bike lending programs, the experts discussed several operational challenges and resources needed to support bike lending programs. Figure 7 provides a summary of the expert interview findings on operational challenges and the resources needed to support bike lending. These responses suggest bike lending programs need a variety of resources to sustain their programs and meet community needs. Many of the experts involved in program operations recognize great value in the programs and continue to support their continuation with available resources.
These findings are similar to the operator survey results, which indicated a lack of supportive bike infrastructure (n = 18/30), limited funding (n = 17/30), and concerns about the bikes being damaged or stolen while on loan (n = 14/30), as top challenges. Reinforcing the challenges associated with the lack of supportive infrastructure, 83% (n = 25/30) of the survey respondents indicated bike-friendly infrastructure is a resource needed to help support bike lending programs. Table 4 summarizes survey responses on the resources needed to support bike lending programs. A few notable responses in the “other” category include the need for community champions, individuals with bike knowledge and/or people to staff the program (n = 3/30), and storage for the bikes (n = 1/30).

4.3. Bike Lending Experience and User Impacts

In this section, we explore bike lending participation and bike use, safety among participants, bike safety and infrastructure, and impacts of bike lending.

4.3.1. Bike Lending Participation and Bike Use

We asked the focus group participants questions about their general experience and motivation for participating in a bike lending program. First, participants shared their favorite aspect of riding a bike. Some provided multiple answers with the most cited responses including exploring or going new places on the bike (n = 4), a feeling of freedom or independence while riding (n = 3), obtaining a convenient transportation mode (n = 3), exercising or health benefits (n = 2), feeling like a kid while riding (n = 2), and allowing them to go outside (n = 2). We also asked participants to describe how they learned about the bike lending program prior to their participation. Participants indicated they learned about the bike lending program either by word of mouth (n = 5), found the program in person (n = 5), or saw an advertisement (n = 2) that encouraged them to participate. Four participants expressed concerns before joining a bike lending program, citing issues such as the bike selection available, keeping the bike secure when not in use, and their personal safety. Despite these concerns, participants generally reported having a positive experience with the program. Most (n = 7) indicated no concerns about the program. Some said that receiving a helmet and lock, having a secure place to store the bike (such as a garage), and clearly understanding the lending terms helped alleviate or eliminate their concerns.
We asked the focus group participants how they used the bike from the lending program. The most reported uses of the bike were for recreation (n = 3) and commuting to work (n = 2). Other uses include taking a child to daycare and shopping for groceries. One participant explained their main reason for participating was to help them decide if they should purchase their own e-bike. Additionally, we asked participants to describe how far they are willing to ride a bike. They reported a wide variety of distances with a lower bound of about six miles and an upper bound of about 60 miles. It is important to note these distances were reported by both pedal bike and e-bike users. There did not appear to be a correlation between distance and bike type, instead many indicated the distance they are willing to travel is related to their comfort level. For example, participants less comfortable riding on the road with vehicles are less likely to make longer trips, as longer journeys often require some portion of the trip to be on a shared road. Two participants said they would feel more comfortable taking longer trips as they gained more riding experience or if the routes were on bike trails. One participant noted they can travel further on their personal pedal bike because they do not have to worry about range limitations with an e-bike.

4.3.2. Safety Among Participants

We also asked focus group participants a series of questions about their riding behavior and how the built environment may influence their comfort and safety. Four participants expressed discomfort about sharing the road with cars. Six explained they try to avoid busy roads and opt for less busy ones to avoid vehicle encounters. The three participants from the U.S. described safety precautions (i.e., wearing bright colored clothing and helmets, additional lights on their bike) to improve their visibility to drivers and promote safe riding. Many (n = 6) suggested that additional designated or separated bike lanes and paths would help them feel more comfortable riding. Another participant noted that they feel safer when street crossings have signals. Two expressed concerns that a lack of bicycle parking or safe storage space at their destination can limit cycling appeal.
Focus group participants also expressed a few safety concerns specific to e-bikes. For example, four e-bike users noted that they needed time to adjust to operating and maneuvering the bike because of its greater size, weight, and speed. However, two participants said they feel safer on shared roads when using an e-bike because they can better match the speed of other vehicles.
To better understand the risks associated with bike lending, we asked experts to describe the frequency of crashes or accidents among participants. Six experts reported minor incidents involving participants, which caused no significant harm to either the rider or the bike. Three experts reported more serious incidents (i.e., collision with a vehicle). However, most were not aware of any incidents, and among those that reported them, they occurred infrequently. The reported accidents included collisions with vehicles, distracted riding, poor infrastructure, user error, and lack of cycling education.
To conclude the discussion on bike safety, we asked experts whether they provide support to participants who face challenges while borrowing a bike. Such support is typically offered through on-demand assistance or community programs, such as a bike maintenance workshop. Some experts mentioned that participants receive contact information to report any bike-related issues. These issues are usually addressed individually on a case-by-case basis. When participants face mechanical issues or need bike repairs, program staff may assist directly, refer them to a partner bike shop, or encourage them to use community bike repair programs to learn how to fix the bike themselves. The type of support provided depends largely on the program’s business model and whether it has the in-house tools and expertise to handle repairs.

4.3.3. Bike Safety and Infrastructure

Due to various safety concerns associated with biking in North America, we asked the focus group participants about strategies to improve safety while participating in bike lending and cycling in general. Interestingly, the safety improvement responses diverged between the Canadian and U.S. participants. Four Canadian participants expressed a desire for more guidance or clear expectations before borrowing a bike, especially for e-bikes. They also suggested offering insurance or an emergency contact number. In contrast, three participants representing the U.S. bike lending programs were more interested in better access to safety accessories, such as mirrors and additional lighting.
The focus group participants discussed several strategies to address cycling safety concerns. Participants from the Rutland E-bike Lending Library emphasized the importance of visibility, both for drivers to see cyclists ahead and for cyclists to see oncoming vehicles. Both focus groups highlighted ways drivers can improve cyclist safety. Four participants expressed a desire for drivers to be more cautious, sharing the road more safely and maintaining a greater distance from cyclists. One noted the difficulty of sharing narrow roads with vehicles, underscoring the need for dedicated cycling infrastructure. Five participants suggested increasing education on on-road bike safety through local campaigns, public service announcements, and including bike safety in driver’s license tests. Three believed enforcement could help uphold existing safety rules, such as maintaining safe passing distances. U.S. participants advocated for better maintenance and cleaning of road shoulders and bike lanes. Overall, the focus group participants agreed that improving cyclist safety requires a combination of enhanced infrastructure and education. Figure 8 summarizes the concerns, precautions, and suggested improvements related to bike lending program safety.

4.3.4. Impacts of Bike Lending

We also investigated the impacts of bike lending, participant perceptions of cycling, and the new opportunities and challenges they encountered while participating in the program. Some focus group participants noted modal shifts, such as using an e-bike instead of taking the bus (n = 1) or biking to a destination when they otherwise would have walked (n = 1). Two shared that they drive most of the time and opt to use bikes for recreational purposes. Participants (n = 2) also noted their bike lending program led them to engage in educational activities, such as seminars and clinics, to learn about bike maintenance or laws surrounding bikes. One participant said they would not bike without the electric assistance provided by the e-bike. Overall, participants had a positive experience biking, and only a few reported using cycling for purposes beyond recreation.
We asked participants about the new opportunities or challenges they encountered through their bike lending program. Four said the program helped them discover new trails and scenery. Two mentioned that using an e-bike eased their concerns about biking uphill. Another two noted that the program introduced them to e-bikes and helped them become more comfortable riding one. One participant shared that they used the bike for grocery trips, an errand they usually complete by car.
Participants also described several challenges, including finding a suitable car-mounted rack for an e-bike (n = 3), bike storage (n = 2), and the weight of the e-bike (n = 2). Additional challenges included bike maintenance, theft prevention, and installing a child seat. One individual expressed concern about e-bike battery fires and explained how they chose an e-bike with a reliable battery despite the higher cost.
We asked the focus group participants if their program participation led them to purchase their own bike. Seven indicated they purchased either an e-bike (n = 3) or pedal bike (n = 2) after participating in a bike lending program. One shared that they had purchased an e-bike and three pedal bikes; another did not specify the kind of bike purchased. Additionally, four participants reported that they are either in the process of deciding which bike to purchase or are interested in buying a personal bike in the future. A few (n = 4) indicated that the bike lending program gave them a chance to try different bikes and served as an educational opportunity to help inform their bike purchase.
Ten operator survey respondents shared insights on individuals purchasing bikes after participating in the bike lending program. Eight noted that participants often choose to purchase a bike after participating, either directly through the lending program (if offered) or through a partner bike shop. One respondent mentioned that participants can volunteer their time to earn a free bike. Another program aims to achieve at least a 30% post-lending purchase rate, which they track through participant surveys. One respondent noted that most participants cannot afford to buy their own bike, emphasizing the program’s role in supporting transportation equity. Table 5 summarizes the operator responses regarding bike purchases after lending program participation.

5. Conclusions

Bike lending is an emerging business model that offers low-barrier access to bicycles. To understand the current landscape of bike lending programs in North America, we conducted a mixed-method study from January to April 2024. This included a literature review, identification and profiling of bike lending programs, 24 expert interviews, a survey of 31 program operators, and focus groups with 12 bike lending participants.

5.1. Key Findings on Bike Lending Operations

Our research highlights the need for more robust funding to support long-term bike lending operations, as well as improved cycling infrastructure to encourage participation and broader cycling adoption. Bike lending programs serve diverse goals such as addressing environmental concerns, promoting physical health, allowing users to try bikes before purchasing, and supporting transportation equity. These programs are often free or low-cost, funded through donations, safety grants, and local or regional funds. They are typically run by nonprofits or public agencies and operate in varied venues, including libraries, community centers, and bike shops. Fleet sizes range widely, from just a few bikes to over 200, with lending periods from a few hours to several months. Many programs offer different bike types, including e-bikes, children’s bikes, and commuter bikes. Operators face challenges such as limited funding, space constraints, staffing shortages, and insurance requirements. While many programs aim to expand, these operational barriers often limit growth.
Our research also revealed insights from bike lending program participants. We found varying bike uses among participants, including but not limited to commuting, recreation, and running errands. We also learned that some participants are motivated to participate in bike lending programs to inform their decision on the purchase of a personal bike. Some of the participants expressed discomfort in sharing the road when cycling, with several participants taking safety precautions (such as avoiding busy roads, wearing bright colored clothing, etc.) to help them feel more comfortable when cycling. Specific to e-bikes, some participants noted the need for additional time to adjust to the weight and speed of a bike, while others suggested they felt safer using an e-bike compared to a traditional pedal bike. Focus group participants from the U.S. and Canada suggested that improving cycling safety requires a combination of enhanced infrastructure and education.

5.2. Safety and Infrastructure Insights

Many programs provide safety accessories like helmets and locks, and some offer lights, mirrors, and bells. Programs that include e-bikes or cargo e-bikes often require participants to complete safety training covering hand signals, helmet use, parking, and bike-specific road rules. Optional workshops on cycling and bike maintenance are also common. The operator survey results underscore the critical challenges of bike lending programs: lack of bike-friendly infrastructure and the need for program funding support. Experts and participants emphasize the importance of improving and maintaining cycling infrastructure year-round. The focus group participants highlighted strategies to enhance rider visibility, such as reflective clothing and lighting, and stressed the need for better bike lanes and public education campaigns to encourage drivers to share the road.

5.3. Policy Recommendations

Our findings from the expert interviews, operator survey, and focus groups emphasize the importance of cycling infrastructure. We found that bike-friendly infrastructure as the most frequently indicated resource needed to support bike lending operations and the lack of supportive infrastructure a top challenge for bike lending operators. As such, our findings suggest local agencies, particularly those with bike lending operations within their jurisdiction, should consider policies to improve local cycling infrastructure. Based on findings from the focus groups, improved cycling infrastructure would likely encourage more cycling among bike lending participants.

5.4. Research Gaps and Future Directions

Given limited existing documentation, ongoing research is needed. Future studies could explore bike lending programs in Mexico and other countries, examine how these programs influence the development of cycling infrastructure, and better understand the demographics of users and non-users. Additionally, research could evaluate how well bike lending programs meet their goals, such as advancing transportation equity and reducing auto use and greenhouse gas emissions. Operational challenges and scarce documentation suggest a need for practical toolkits and resources to help programs achieve financial sustainability, optimize fleet sizes, and overcome common hurdles. Expanding research to include a larger and more diverse sample of participants and operators would further strengthen the understanding of bike lending’s role in promoting cycling.

Author Contributions

Conceptualization, S.S.; Methodology, S.S.; Validation, S.S., B.W. and A.C.; Formal Analysis, B.W. and A.C.; Investigation, B.W. and A.C.; Resources, S.S.; Data Curation, B.W. and A.C.; Writing—Original Draft Preparation, S.S., B.W. and A.C.; Writing—Review and Editing, S.S., B.W. and A.C.; Visualization, S.S., B.W. and A.C.; Supervision, S.S.; Project Administration, S.S.; Funding Acquisition, S.S. All authors have read and agreed to the published version of the manuscript.

Funding

This research was funded by the University Transportation Center Program, Center for Pedestrian and Bicyclist Safety, grant number 456802-87GR.

Institutional Review Board Statement

This study was conducted in accordance with the Declaration of Helsinki, and the protocol was approved by the Ethics Committee of University of California, Berkeley Institutional Review Board (2023-12-16963) on 19 December 2023.

Informed Consent Statement

Informed consent for participation was obtained from all subjects involved in this study.

Data Availability Statement

The datasets presented in this article are not readily available because they are protected by the University of California, Berkeley Institutional Review Board.

Acknowledgments

We acknowledge the Center for Pedestrian and Bicyclist Safety, funded by the U.S. Department of Transportation (USDOT) through the University Transportation Centers program, for their generous support of this research. We thank all the experts who participated in interviews and the operators who completed the survey. We also appreciate the assistance of Markham Cycles, Newmarket Cycles, and Rutland E-bike Lending Library in recruiting participants for the focus groups. Special thanks to Masuma Miti, Joel Tam, and Liana Tran for their valuable contributions to this project. We greatly appreciate everyone who shared their insights and supported this research.

Conflicts of Interest

The authors declare no conflicts of interest.

Abbreviations

The following abbreviation is used in this manuscript:
U.S.United States

References

  1. Shaheen, S.; Cohen, A.; Martin, E. Public Bikesharing in North America: Early Operator Understanding and Emerging Trends. Transp. Res. Rec. 2013, 2389, 83–92. [Google Scholar] [CrossRef]
  2. JA3163_202106; Taxonomy of On-Demand and Shared Mobility: Ground, Aviation, and Marine. SAE International: Warrendale, PA, USA, 2021. Available online: https://www.sae.org/standards/content/ja3163_202106/ (accessed on 24 October 2025).
  3. Assuncao-Denos, M.-E. The Ups and Downs of Bike-Sharing Systems in North America: Understanding the Successes and Struggles; McGill University eScholarship: Montreal, QC, Canada, 2017; Available online: https://escholarship.mcgill.ca/concern/papers/8s45q909x (accessed on 24 October 2025).
  4. Bliss, L. E-Bike Lending Libraries Aim to Boost Adoption. Bloomberg. 15 October 2021. Available online: https://www.bloomberg.com/news/articles/2021-10-15/e-bike-lending-libraries-aim-to-boost-adoption (accessed on 24 October 2025).
  5. MacArthur, J.; Miller, J.; Swain, I. E-Bike Lending Libraries: Trends and Practices in the United States; Portland State University, Transportation Research and Education Center: Portland, OR, USA, 2025. Available online: https://rosap.ntl.bts.gov/view/dot/83378 (accessed on 24 October 2025).
  6. Berger, B.; Reback, M.; Palmatier, S.M. Addressing the Barriers to Bicycling: A Bike Access Program in Lewiston and Auburn, ME. Community Engaged Res. Rep. 2018, 46, 4–39. Available online: https://scarab.bates.edu/community_engaged_research/46 (accessed on 24 October 2025).
  7. McNeil, N.; Broach, J.; Dill, J. Breaking Barriers to Bike Share: Lessons on Bike Share Equity; Institute of Transportation Engineers: Washington, DC, USA, 2018; pp. 31–35. Available online: https://ppms.trec.pdx.edu/media/project_files/ITE_Jounal_February_2018_Breaking_Barriers_to_Bike_Share_Lessons_on_Bike_Share_Equity.pdf (accessed on 24 October 2025).
  8. Janzer, C. Bike Libraries Are Boosting Access to Bike Across the U.S. Next City. 24 October 2022. Available online: https://nextcity.org/urbanist-news/bike-libraries-are-increasing-access-to-bikes-across-america (accessed on 24 October 2025).
  9. The Bike Center. Commuter Bike Loan Program. Available online: https://thebikecenter.com/commuter-bike-loan-program/ (accessed on 24 October 2025).
  10. Fitch, D.; Gao, Z.; Noble, L.; Mac, T. Examining the Effects of a Bike and E-Bike Lending Program on Commuting Behavior; Mineta Transportation Institute Publications: San Jose, CA, USA, 2022. [Google Scholar] [CrossRef]
  11. Miskell, S.; Xu, W.; Rissel, C. Encouraging community cycling and physical activity: A user survey of a community bicycle loan scheme. Health Promot. J. Aust. 2010, 21, 2–83. [Google Scholar] [CrossRef] [PubMed]
  12. Daly, E. The Social Implications of Bicycle Infrastructure: What it Means to Bike in America’s Best Cycling Cities; Macalester College Digital Commons: St Paul, MN, USA, 2014; Available online: https://digitalcommons.macalester.edu/cgi/viewcontent.cgi?article=1042&context=geography_honors (accessed on 24 October 2025).
  13. Pucher, J.; Buehler, R. Safer Cycling Through Improved Infrastructure. Am. J. Public Health 2016, 106, 2089–2091. [Google Scholar] [CrossRef] [PubMed]
  14. The League of American Bicyclists. National: Biking & Walking Road Safety; The League of American Bicyclists: Washington, DC, USA, 2022; Available online: https://data.bikeleague.org/data/national-bicyclist-pedestrian-road-safety/#number-of-annual-bicyclist-fatalities (accessed on 24 October 2025).
  15. Canadian Automobile Association. Cycling by the Numbers. Available online: https://www.caa.ca/driving-safely/cycling/bike-statistics/ (accessed on 24 October 2025).
  16. Davis, W. How to Build a Bike Lane in America. The Verge. 9 December 2023. Available online: https://www.theverge.com/23992114/bike-lane-us-infrastructure-milwaukee-dallas-woodlands (accessed on 24 October 2025).
  17. National Association of City Transportation Officials. High-Quality Bike Facilities Increase Ridership and Make Biking Safer; National Association of City Transportation Officials: New York, NY, USA, 2016; Available online: https://nacto.org/latest/high-quality-bike-facilities-increase-ridership-make-biking-safer/ (accessed on 24 October 2025).
  18. Fowler, S.L.; Berrigan, D.; Pollack, K.M. Perceived barriers to bicycling in an urban U.S. environment. J. Transp. Health 2017, 6, 474–480. [Google Scholar] [CrossRef]
  19. MacArthur, J.; Harpool, M.; Schepke, D.; Cherry, C. A North American Survey of Electric Bicycle Owners; Transportation Research and Education Center: Portland, OR, USA, 2018. [Google Scholar] [CrossRef]
  20. Miranda-Morena, L.F.; Nosal, T. Weather or Not to Cycle: Temporal Trends and Impact of Weather on Cycling in an Urban Environment. Transp. Res. Rec. J. Transp. Res. Board 2011, 2247, 42–52. [Google Scholar] [CrossRef]
  21. Del Valle Tonoian, J. Power to the Pedal: Assessing Barriers to Adoption of Closed-Access Bike Share in Low-Income Communities. Bachelor’s Thesis, Portland State University, Portland, OR, USA, 2024. [Google Scholar] [CrossRef]
  22. Hurford, M. Bike Libraries Are Growing in Popularity, and That’s a Good Thing! Bicycling. 31 October 2022. Available online: https://www.bicycling.com/culture/a41802584/bike-libraries-growing-in-popularity/ (accessed on 24 October 2025).
  23. PeopleForBikes. Statement on Electrically Powered Devices. PeopleForBikes. 2021. Available online: https://peopleforbikes.cdn.prismic.io/peopleforbikes/22cafb3e-7284-456d-9a7d-5dfa4208d935_PeopleForBikes+Statement+on+Electrically+Powered+Devices+032621.pdf (accessed on 24 October 2025).
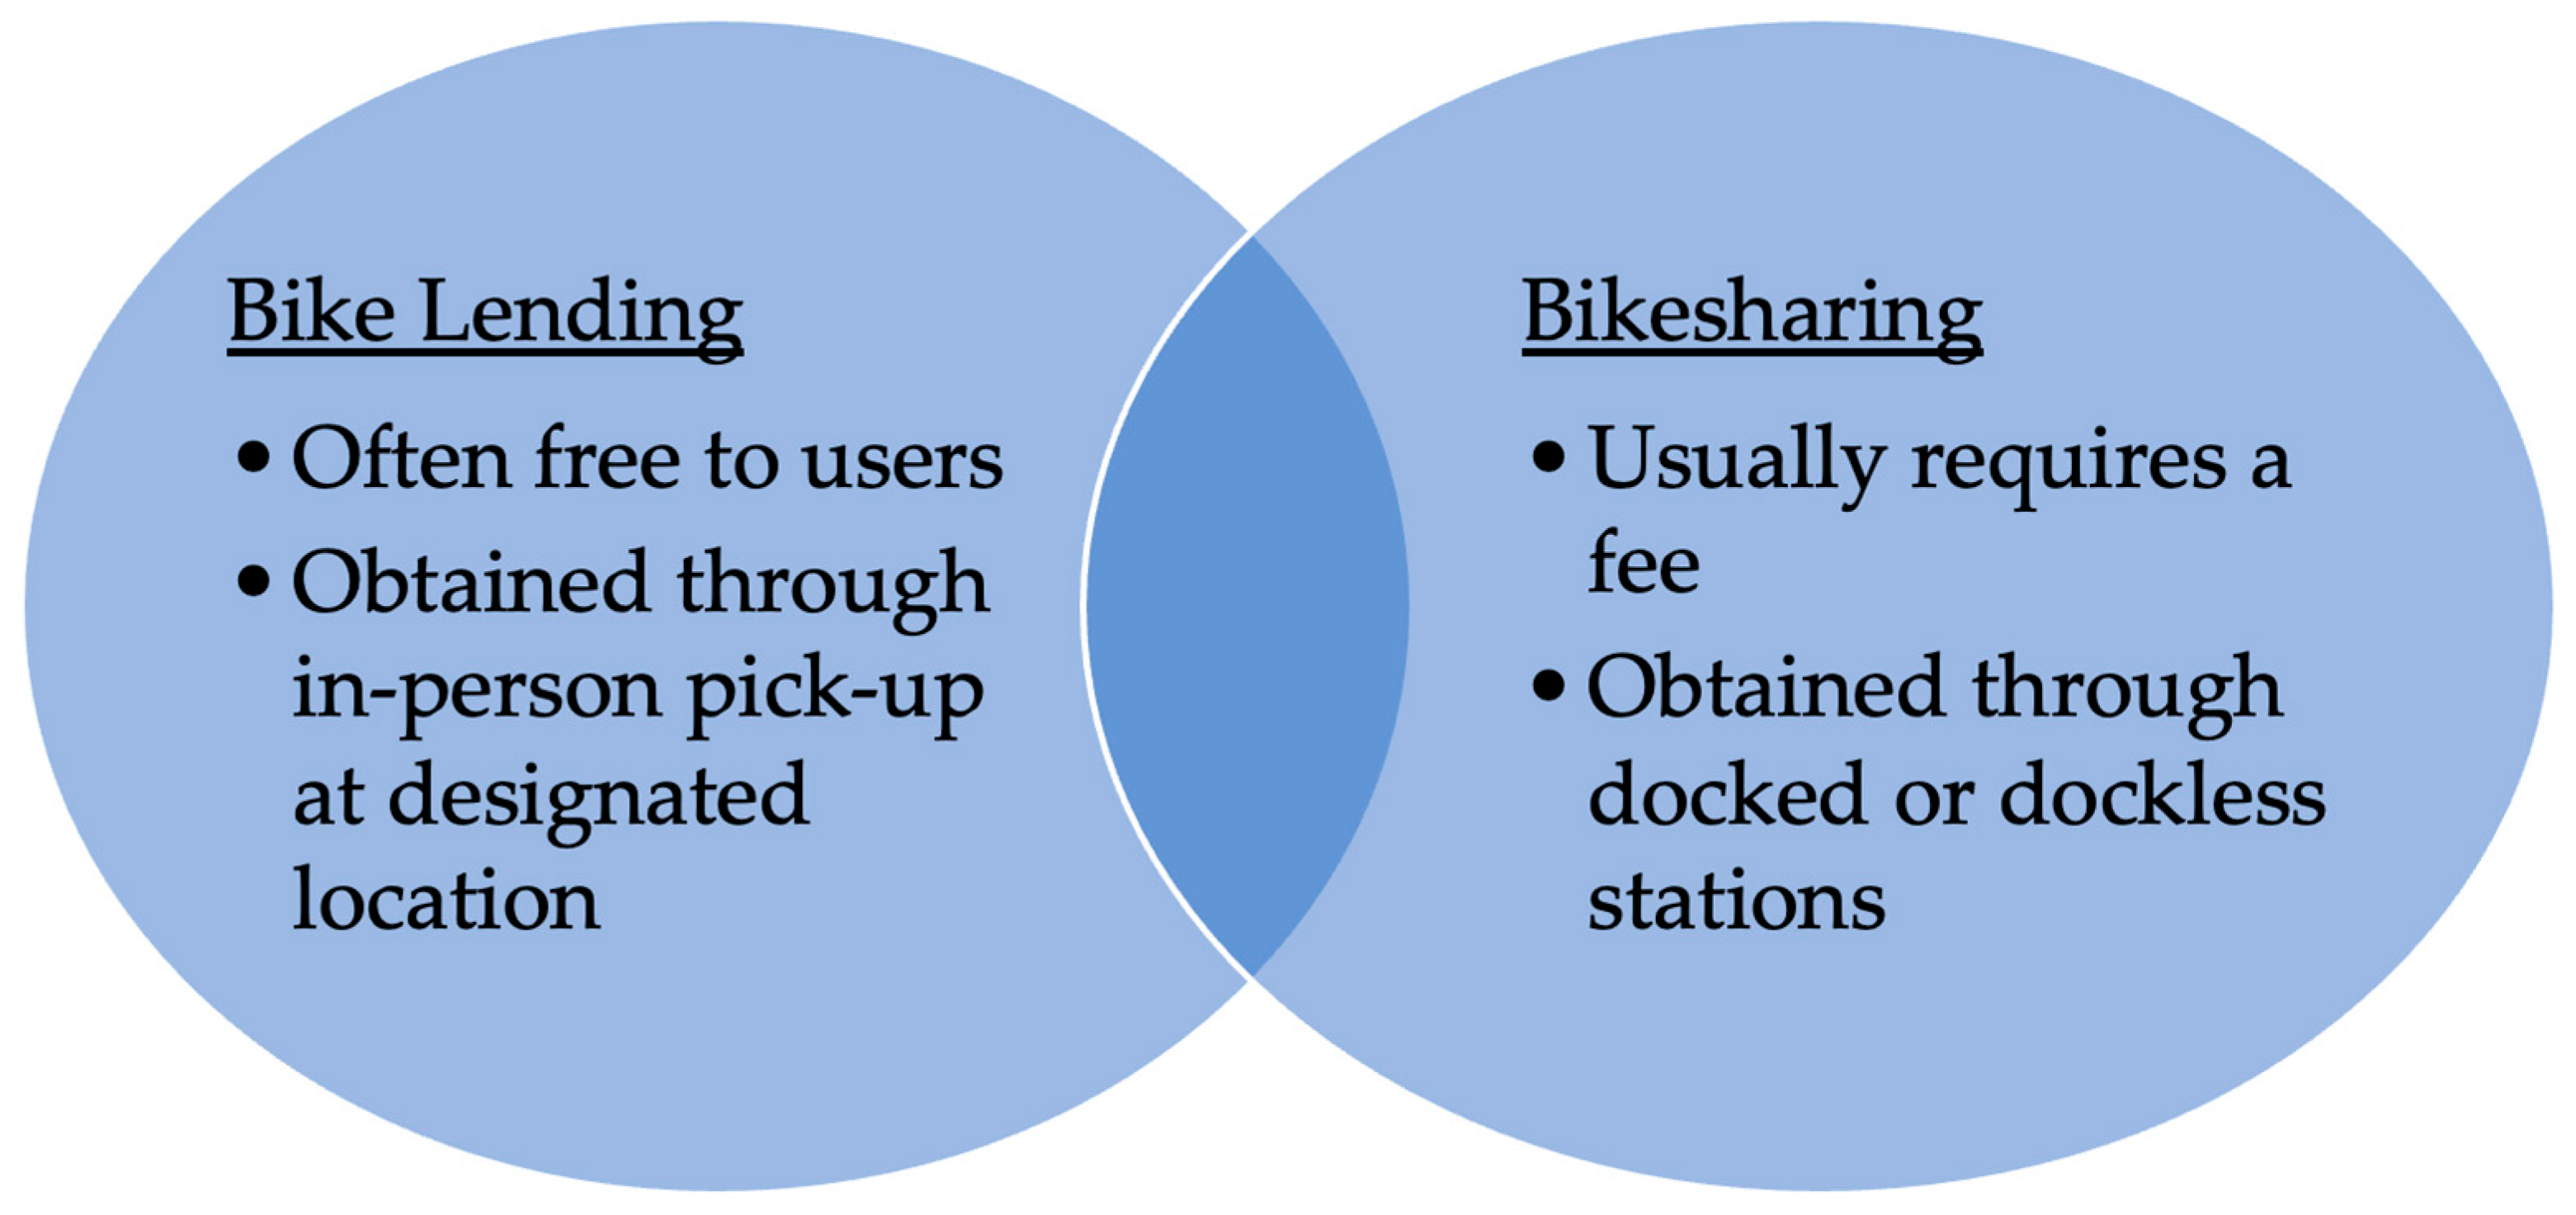
Figure 1. Comparison of Bike Lending and Bikesharing.
Smartcities 08 00185 g001
Figure 2. Number of Bike Lending Programs in the U.S. and Canada Over Time (n = 42).
Smartcities 08 00185 g002
Figure 3. Bike Lending Program Locations (Red Circle = E-bikes Only, Blue Square = Pedal Bikes Only, Green Diamond = Pedal Bikes, and E-bikes).
Smartcities 08 00185 g003
Figure 4. Bike Models Offered by Bike Lending Programs (n = 31).
Smartcities 08 00185 g004
Figure 5. Length of Lending Period (n = 31).
Smartcities 08 00185 g005
Figure 6. Safety Training Topics (n = 15).
Smartcities 08 00185 g006
Figure 7. Summary of the Expert Interview Findings on Operational Challenges and Resources Needed to Support Bike Lending.
Smartcities 08 00185 g007
Figure 8. Summary of Bike Lending Safety Focus Group Findings (n = 12).
Smartcities 08 00185 g008
Table 1. Organizations and Bike Lending Programs Represented in Expert Interviews by Type.
Bike Lending Programs
Operating Under Non-Profit
Organizations
Bike Lending Programs
Operated by Public
Entities
Bike Lending Programs
Operated by Non-Profit
Transportation Organizations
Other Organizations
  • GoSGV (Active San Gabriel Valley)
  • Book-a-Bike (Athens County Public Libraries)
  • NETC Bike Libraries (Northeast Transportation Connections)
  • City of Oakland
  • Camberville E-Bike Lending Library (Community Pedal Power)
  • Brattleboro E-Bike Lending Library (Brooks Memorial Library)
  • Markham and Newmarket Cycles (The Centre for Active Transportation)
  • GRID Alternatives
  • Charlottesville E-Bike Lending Library (Virginia Organizing)
  • Library of Things (Ilsley Public Library)
  • Westside Rides (Westside Transportation Alliance)
  • Shared Mobility Inc.
  • Ghisallo Bicycle Lending Library (Ghisallo Cycling Initiative)
  • Rutland E-Bike Lending Library (Rutland Recreation & Parks Department)
  • Ridepanda
  • Norte Bike Library (Norte Youth Cycling)
  • The Bike Center, Santa Monica
  • Upper Valley E-Bike Lending Library (Vital Communities)
Table 2. Benefits Provided by Bike Lending Programs (n = 30).
Benefits of Bike LendingCountPercentage
Physical health benefits1963%
Mental health benefits1550%
Access to essential services1033%
Economic opportunity930%
Social equity impacts930%
Environmental benefits827%
Reduced trip costs723%
Reduced trip time310%
Other310%
Table 3. Safety Training and Bike Type (n = 31).
Offers E-Bikes or E-Cargo BikesDoes Not Offer E-Bikes or E-Cargo BikesTotal
Requires Safety Training7 (23%)0 (0%)7
Does Not Require Safety Training6 (19%)10 (32%)16
Does Not Require Safety Training, But Offers Optional Safety Training/Programming5 (16%)3 (10%)8
Total181331
Table 4. Resources Needed to Support Bike Lending Programs (n = 30).
Resources Needed to Support Bike LendingCountPercentage
Bike friendly infrastructure2583%
Local funding2480%
Public sector partnerships1447%
Private sector partnerships1343%
Regional funding1240%
State funding1240%
Federal funding930%
Other620%
Table 5. Bike Purchase After Participating in a Bike Lending Program.
Bike Purchase StatusCount (n = 10)Percentage
Yes, and participants can purchase their own bike from us or a partnering bike shop.440%
Yes, however, we do not have any bikes for sale.220%
No, most participants of this program use but then cannot afford to purchase their own bike.110%
No, most participants do not have a desire to purchase a bike.00%
Other220%
I am not sure110%
Disclaimer/Publisher’s Note: The statements, opinions and data contained in all publications are solely those of the individual author(s) and contributor(s) and not of MDPI and/or the editor(s). MDPI and/or the editor(s) disclaim responsibility for any injury to people or property resulting from any ideas, methods, instructions or products referred to in the content.