Article

Intelligent Charging Navigation for Electric Vehicles Based on Reservation Charging Service

1
College of Electrical Engineering and New Energy, China Three Gorges University, Yichang 443002, China
2
State Key Laboratory of Advanced Electromagnetic Engineering and Technology, Huazhong University of Science and Technology, Wuhan 430074, China
3
Department of Electrical Power and Machines Engineering, Faculty of Engineering, Tanta University, Tanta 31511, Egypt
4
Department of Electrical Power Engineering, Faculty of Engineering, Egypt-Japan University of Science and Technology (E-JUST), New Borg El Arab City 21934, Egypt
*
Author to whom correspondence should be addressed.
Smart Cities 2025, 8(5), 178; https://doi.org/10.3390/smartcities8050178
Submission received: 11 September 2025 / Revised: 3 October 2025 / Accepted: 13 October 2025 / Published: 20 October 2025

Abstract

Highlights

What are the main findings?
  • The smart charging navigation framework based on reservation time windows maintains stable charging costs while improving efficiency and user experience, and reduces unnecessary charger occupancy.
  • The rolling time-axis dynamic dispatching model shortens queuing time, enhances user satisfaction, and improves distribution network voltage quality, showing better performance than conventional navigation strategies.
What is the implication of the main finding?
  • Reservation-based intelligent charging provides a sustainable pathway to accommodate more electric vehicles without large-scale infrastructure expansion.
  • Integrating user preferences and incentive mechanisms offers practical guidance for the large-scale promotion of smart charging services in future smart cities.

Abstract

To address the problem of selecting an “appropriate” charging station for emergency charging during the journey of electric vehicles, this paper proposes a basic architecture of an intelligent charging navigation system composed of the power system, traffic system, charging stations, and on-board navigation terminals. The concept of a charging time window is introduced into a “reservation-based charging + consumption” service model for electric vehicle charging prediction. On this basis, a dynamic dispatching model based on a rolling time axis is designed, enabling the charging process of users to be freed from the constraints of queuing time and time-dependent charging service fees. Case simulations show that intelligent charging navigation for electric vehicles based on reservation charging service can effectively improve the users’ charging experience while taking into account both the operating state of the power grid and the benefits of charging station operators.

1. Introduction

With the increasing popularity of electric vehicles and the development of charging infrastructure, charging stations have gradually become indispensable power supply points for electric vehicles. In real life, when electric vehicles on the road have urgent charging demands, how to guide them to select an “appropriate” charging station for charging will become an urgent problem to be solved by the power grid. However, existing in-vehicle navigation systems are only connected to ground traffic management systems, merely displaying the optimal route planning considering traffic conditions, without taking into account the impact of different charging decisions of each electric vehicle on the power grid side [1,2,3]. Further public evaluations and operational records also reveal systemic shortcomings in public charging networks regarding availability consistency, on-site waiting, and spatial balance. For example, the proportion of failed charging attempts upon arrival is around 20%, the availability rate typically falls within the 70–80% range, and there is a structural imbalance in station utilization characterized by congestion at a few popular stations and underutilization at nearby ones [4,5].
Effectively diverting and guiding users in an orderly manner, while enhancing their participation, is a necessary prerequisite. In recent years, research has advanced in areas such as orderly charging, price-based guidance, cloud–edge–terminal collaboration, and intelligent terminals. However, charging navigation and scheduling paradigms that can simultaneously coordinate the multidimensional coupling of transportation, power, and operations, balance user experience and grid friendliness under dynamic and uncertain environments, and maintain scalability remain relatively limited [6,7]. Therefore, starting from the perspective of enhancing user experience and employing relevant theories from sociology, management, and behavioral science, to determine multi-form adaptive rebate models that balance the interests of the power grid and user satisfaction, has become a key factor for the widespread adoption of fast-charging navigation schemes for electric vehicles. It is also a major challenge that must be overcome in designing intelligent charging navigation strategies capable of reconciling grid benefits with user experience.
As the number of electric vehicle expands and the Internet of Vehicles matures, the interconnection between in-vehicle navigation systems and power dispatching systems will become particularly important [8,9,10,11,12,13], which is mainly reflected in the following aspects:
(1)
Electric vehicles can be regarded as distributed loads and controllable power sources. The large-scale integration of electric vehicles will transform the traditional radial power grid into a complex network of distributed micro-storage and user interconnections with spatiotemporal stochastic characteristics. The interconnection between navigation systems and power dispatching systems enables power grid companies to monitor the status of electric vehicles in real time and to make accurate predictions of the spatiotemporal distribution of electric vehicle charging demand, thereby allowing dispatching instructions to be issued in advance to ensure the safe, economical, and stable operation of the power grid;
(2)
Traditional in-vehicle navigation systems cannot obtain information such as queuing time and charging service fees at charging stations. The charging station decisions that navigation systems provide are solely based on traffic information and cannot reflect the actual charging time and charging cost, which may result in users ultimately making charging decisions that are not truly optimal. This issue must be resolved through interconnection with the power dispatching system;
(3)
Through interconnection with the power dispatching system, charging stations can obtain users’ charging navigation decisions, thereby accurately predicting their charging service capacity in the next period, formulating corresponding charging service fees, and guiding the charging users in an orderly manner through pricing. On the basis of ensuring their own operational benefits and rational utilization of regional charging station resources, this can realize a multi-party win-win among the power system, traffic system, charging stations, and users.
From the perspective of research development, recent studies have mainly progressed along two technical pathways. The first focuses on the application of reinforcement learning (RL) and deep reinforcement learning (DRL) to charging scheduling, including single- and multi-station Markov modeling, multi-agent coordination, and constrained CMDP solutions, which have shown promising potential in reducing peak–valley differences, alleviating waiting times, and controlling costs [14,15,16,17]. The second pathway targets decentralized energy trading and charging settlement for V2G/V2V scenarios, leveraging blockchain and smart contracts to enhance transaction trust and privacy protection, thereby enabling interoperability between user and operator sides [18,19]. Despite these advances, most existing studies concentrate on algorithmic or transactional optimizations in isolation, and a unified, city-scale, and practically operable navigation–scheduling framework remains to be fully developed.
Considering the uncertainty of electric vehicle charging demand in the spatiotemporal variation, the updating and release of charging service fees face great challenges in practical applications. Exploring an integrated “reservation-based charging + consumption” service model and innovating intelligent charging navigation services are of great significance for addressing the large-scale integration of electric vehicles. Compared with the queuing system in the process of electric vehicles receiving services at charging stations, the reservation service system [20] has the following advantages: (1) It facilitates electric vehicle users. Since they have the conditions to optimize their charging decisions in both spatial and temporal dimensions, electric vehicle users possess greater initiative. Moreover, once a reservation is completed, they no longer need to wait in long queues at charging stations, thereby relieving the psychological pressure of reserved users. (2) It avoids congestion and conflicts at charging stations during peak periods of charging demand distribution. (3) It improves the planning capability and flexibility of charging stations. After reservations are made by electric vehicle users, charging stations can reasonably allocate electric energy and charging piles in advance to obtain the greatest economic and social benefits. (4) The reservation service system can combined with invitation mechanisms and membership systems, enabling operators to increase the attractiveness of charging services to electric vehicle users through means such as membership points and preferential pricing. At the same time, prepaid charging service fees are conducive, to a certain extent, to interest generation or capital turnover for operators. (5) Pure reservation services do not need to take queuing into consideration.
To this end, this paper first proposes a basic architecture of an intelligent charging navigation system composed of the power system, traffic system, charging stations, and on-board navigation terminals. On this basis, for the integrated “reservation-based charging + consumption” service model, the concept of a charging time window is applied to the optimization of electric vehicle charging prediction, and a dynamic dispatching model based on a rolling time axis is designed, enabling the charging process of users to be freed from the constraints of queuing time and charging service fee periods. Finally, simulations are conducted on the proposed model to test and verify the intelligent charging navigation strategy.

2. Intelligent Charging Navigation System

2.1. Basic Architecture

In order to study the interactive impact between the power grid and the transportation network during the charging process of electric vehicles, an integrated intelligent charging navigation architecture for electric vehicles is proposed, as shown in Figure 1. It mainly consists of four parts: the power grid control center, the transportation system, the charging stations, and the on-board navigation terminals.
The intelligent charging navigation system makes use of the equipment and infrastructure of conventional in-vehicle navigation, including on-board devices equipped with geographic information systems and global positioning system receivers, as well as wireless communication devices. The data structure of vehicle information is as follows: {Origin//location information; Destination//location information; Initial SOC//denoted as ESOC; Battery Capacity//denoted as EB; Starting Time//denoted as Ts; Energy Consumption per 100 km//denoted as Eave}.
With the support of communication systems in future smart cities, the above four components can achieve real-time information sharing: the transportation system receives signals collected from real-time traffic monitoring devices and releases real-time traffic information to electric vehicle users; the on-board navigation device formulates dynamic route planning by combining traffic information with vehicle information, and reminds users to send a charging reservation request to the power grid control center when the battery level falls below a certain threshold; after the user makes a confirmation, the on-board navigation device sends the reservation request, which contains the user’s charging behavior preferences and vehicle information, to the power grid control center; for all charging reservation requests received at the same time, the power grid control center first sorts them by processing priority according to the membership level of electric vehicle users, and then, based on the occupancy status of charging piles at each station and charging service fee information, formulates an optimal charging scheme according to user preferences, including the charging time window and total charging cost; finally, the successfully reserved charging schemes are fed back to electric vehicle users, while all processed reservation information is shared with charging stations and the transportation system; based on user charging decisions, the transportation department makes dynamic traffic forecasts and issues congestion warnings, and charging station operators formulate real-time charging service fees for each station by considering electricity price information from the power grid and the occupancy of charging piles It should be noted that newly built charging stations in the future are likely to be equipped with their own renewable energy generation systems whenever conditions permit. Their interactions with the power grid will therefore become more frequent. In this case, the real-time service fees are determined by the power grid control center according to indicators that best support the safe and stable operation of the grid. The resulting profits are then reasonably allocated to all charging station operators within the alliance.
The feasibility of the intelligent navigation architecture depends on a trusted relationship among the power grid company, charging station operators, and electric vehicle users. Charging service fees are still generated in real time by time periods, but what is released to users is the total charging cost that combines service fees across time periods with charging duration. Thus, the concept of service fees becomes less significant for users. Because the access time window of fast-charging loads is relatively rigid, the control center essentially provides cost-sensitive users with the optimal charging price for each demand. This price is not a uniform value but a customized cost determined by individual charging behavior preferences. Building sufficient trust between users and the control center is therefore essential. Such trust can be enhanced through the social credibility of the power grid company and a membership growth and interaction mechanism. On the other hand, charging station operators need to reach an agreement with the control center on real-time pricing of charging service fees in different time periods and on the profit distribution mechanism. It is necessary to ensure the information security of each operator while maintaining fairness and transparency in information related to profit distribution. To address this, blockchain technology can be employed to build an alliance database for charging stations. This ensures the integrity, security, and transparency of shared information and enables a profit distribution method that is convincing to all operators. Such an approach lays the theoretical and technical foundation for the practical application and promotion of intelligent charging navigation for electric vehicles based on reservation charging service.

2.2. Traffic Flow Model

In the established navigation architecture, the transportation system releases real-time traffic flow information obtained from monitoring devices to electric vehicle users through the communication system, while the on-board navigation device calculates the optimal driving path of the vehicle based on the road network information and real-time traffic conditions [21]. The release time is discretized into k time intervals. In each time interval t [ k Δ T , ( k + 1 ) Δ T ] , ( k = 0 , 1 , 2 , , h ) , the interaction analysis between the transportation system and the electric vehicles is carried out using an agent–cellular automata model.
(1)
For electric vehicles approaching an intersection, the driving direction remains unchanged. However, the driving speed is influenced by real-time traffic conditions, and variations in user driving behavior affect power consumption;
(2)
At intersections, the on-board navigation device performs dynamic route planning by combining the vehicle’s travel destination with the traffic conditions of the upcoming road segments.
Therefore, the focus is on obtaining the traffic flow between adjacent road network nodes. Three key variables in this traffic flow model are defined as follows: (1) traffic density ρ m ( k ) (vehicles/km/segment), representing the number of vehicles on segment m during time interval k ; (2) traffic speed v m ( k ) (km/h), representing the average vehicle speed on segment m during time interval k ; (3) traffic flow q m ( k ) (vehicles/hour), representing the number of vehicles leaving segment m during time interval k .
The traffic density of a road segment is influenced by the traffic flow as well as the traffic conditions at its origin and destination. The traffic density at ( k + 1 ) Δ T is the sum of the traffic density at k Δ T and the density increment during interval k . The traffic flow entering segment m is given by μ I m β μ , m ( k ) q μ ( k ) , The traffic flow leaving segment m is given by μ O m β m , φ ( k ) q φ ( k ) . The increment in traffic density on segment m caused by traffic flow variation can be expressed as:
Δ T L m ( μ I m β μ , m ( k ) q μ ( k ) μ O m β m , φ ( k ) q φ ( k ) )
The increment in traffic density on segment m contributed by trip start and end states can be expressed as:
1 L m ( N m S ( k ) N m E ( k ) )
Therefore, the traffic density can be expressed as:
ρ m ( k + 1 ) = ρ m ( k ) + Δ T L m ( μ I m β μ , m ( k ) q μ ( k ) μ O m β m , φ ( k ) q φ ( k ) ) + 1 L m ( N m S ( k ) N m E ( k ) )
where I m denotes the set of vehicles entering segment m ; β μ , m represents the transfer rate of vehicles from segment μ to segment m ; O m denotes the set of vehicles leaving segment m ; L m is the length of segment m ; N m S ( k ) denotes the number of vehicles starting their trips on segment k ; and N m E ( k ) denotes the number of vehicles ending their trips on segment m during interval k .
Therefore, the traffic speed can be calculated as:
v m ( k ) = v m f exp [ ( 1 / a m ) ( ρ m ( k ) / ρ c r , m ) a m ]
where v m f denotes the free-flow speed on segment m ; ρ c r , m represents the critical traffic density of segment m ; and a m is a statistical parameter.

2.3. Charging Decision Model

The charging behavior decisions of electric vehicle users are influenced by multiple factors, such as the state of charge (SOC), charging service fee prices at stations, the distance to the destination or charging station, real-time traffic conditions, and queuing time at charging stations. When electric vehicle users receive real-time information released by the control center, they decide whether to go to a charging station for charging. The following assumptions are made regarding the charging behavior of electric vehicle users:
(1)
When an electric vehicle generates a charging demand, it will go to a nearby charging station for charging. At this point, the charging behavior decision is made under the “reservation-based charging + consumption” mode;
(2)
Considering that over-discharge has an adverse effect on the lifetime of power batteries, the probability of generating a charging demand is 1 when the SOC of an electric vehicle falls below a certain threshold; the probability is 0 when the SOC reaches 100%; and when the SOC lies between these two values, the probability of generating a charging demand is influenced by the current SOC and the charging service fees of nearby stations.
Based on the established dynamic spatiotemporal evolution model of electric vehicle charging demand, and combined with the real-time traffic information released by the transportation department, the arrival time and SOC of electric vehicles at different charging stations can be accurately calculated. For the sake of simplifying the calculation process, it is assumed that electric vehicles will always choose to be fully charged at charging stations.
Therefore, the control center calculates the charging duration t d i , j of vehicle i at station j according to the following formula. The remaining energy of vehicle i upon arrival at station j is determined based on its energy consumption per 100 km E a v e i and its initial SOC E S O C i :
t d i , j = E B i ( E S O C i E a v e i D 0 i , j ( 1 ) ) P C i
where D 0 i , j ( 1 ) denotes the distance from vehicle i to station j , and P C i denotes the charging power of vehicle i .
The departure time T f i , j of vehicle from charging station j satisfies:
T f i , j = T s i , j + t p i , j + t d i , j
where T s i , j denotes the arrival time of vehicle i to station j , and t p i , j denotes the queuing time of vehicle i to station j .
The cost Y i , j (CNY) is calculated based on the real-time charging service fee, including both the charging cost and the travel cost from the charging station to the destination:
Y i , j = [ E B i ( E S O C i E a v e i D 0 i , j ( 1 ) ) ] × C j , t + E a v e i D 0 i , j ( 2 ) × C B
where D 0 i , j ( 2 ) denotes the distance from station j to the destination; C j , t denotes the charging price of vehicle i during this period, calculated based on the charging duration and the corresponding real-time charging service fee; and C B denotes the average charging cost.
After the above calculations, the intelligent charging navigation system provides electric vehicle users with three strategies:
Time-optimal: charging station p ,
T f i , p = min j = 1 , 2 , , n { T f i , j }
Cost-optimal: charging station q ,
Y i , q = min j = 1 , 2 , , n { Y i , j }
Comprehensive-optimal: charging station r ,
a T f i , r + b Y i , r = min j = 1 , 2 , , n { a T f i , j + b Y i , j }
where a and b are weighting coefficients determined by the relative importance of cost and time in the decision-making process. In practical applications, users who consider only time or only cost are in the minority. Most users exhibit certain preferences between time and cost, meaning that the values of a and b are not identical. Therefore, it is necessary to classify users through a database of charging behavior preferences in order to meet the personalized needs of electric vehicle users and further enhance their charging experience.

3. Charging Reservation Optimization Method Based on Hard Time Windows

3.1. Problem Description

Based on the intelligent charging navigation architecture, the control center can formulate an optimal charging scheme for electric vehicle users by considering their behavioral preferences. To this end, the concept of a time window is introduced to analyze the charging reservation problem.
According to the strictness of time constraints, time windows can be divided into two categories: soft time windows and hard time windows [22,23,24,25,26]. A soft time window requires arrival within the designated period as much as possible; otherwise, a penalty is imposed: (1) when an electric vehicle arrives before the earliest required time, it must wait at the charging station; (2) If an EV arrives later than the latest allowed time, an additional service fee will be charged in proportion to the delay, or its scheduling priority will be reduced to implement the penalty mechanism. A hard time window, on the other hand, requires that an electric vehicle must arrive at the charging station within the specified charging time window; otherwise, the charging service is denied. This paper focuses on the charging reservation problem of vehicles under hard time windows. The implementation of hard time windows is ensured by sending a billing statement, which includes charging time window information, to electric vehicle users who have successfully made reservations, and by receiving their consumption feedback information.
When making a charging reservation, each electric vehicle receives from the control center an estimated arrival time and estimated charging cost for the nearby candidate charging stations. These estimates are calculated based on the vehicle’s current location, SOC, real-time traffic conditions, station reservation status, and electricity price information. The user selects a charging station and submits a reservation request according to personal preferences. The control center then processes all reservation requests in the region, and, by applying the dynamic spatiotemporal evolution model of charging demand, generates reservation orders that include the exact arrival time, queuing time, charging duration, and charging cost for each vehicle. Once the user confirms and pays, the charging agreement is formally established. Special cases such as “no-shows” are not measured separately in this study; instead, their occurrence is mitigated as much as possible through prepayment and a membership points growth mechanism.
Furthermore, if electric vehicle users have established a sound trust relationship with the control center, they can directly submit charging reservation requests to the control center with their personal preferences (time, cost, or comprehensive). The selection of the charging station is then entrusted to the control center, which formulates an optimal charging scheme tailored to the specific travel demand and individual preferences of the user.

3.2. Reservation-Based Charging Service System

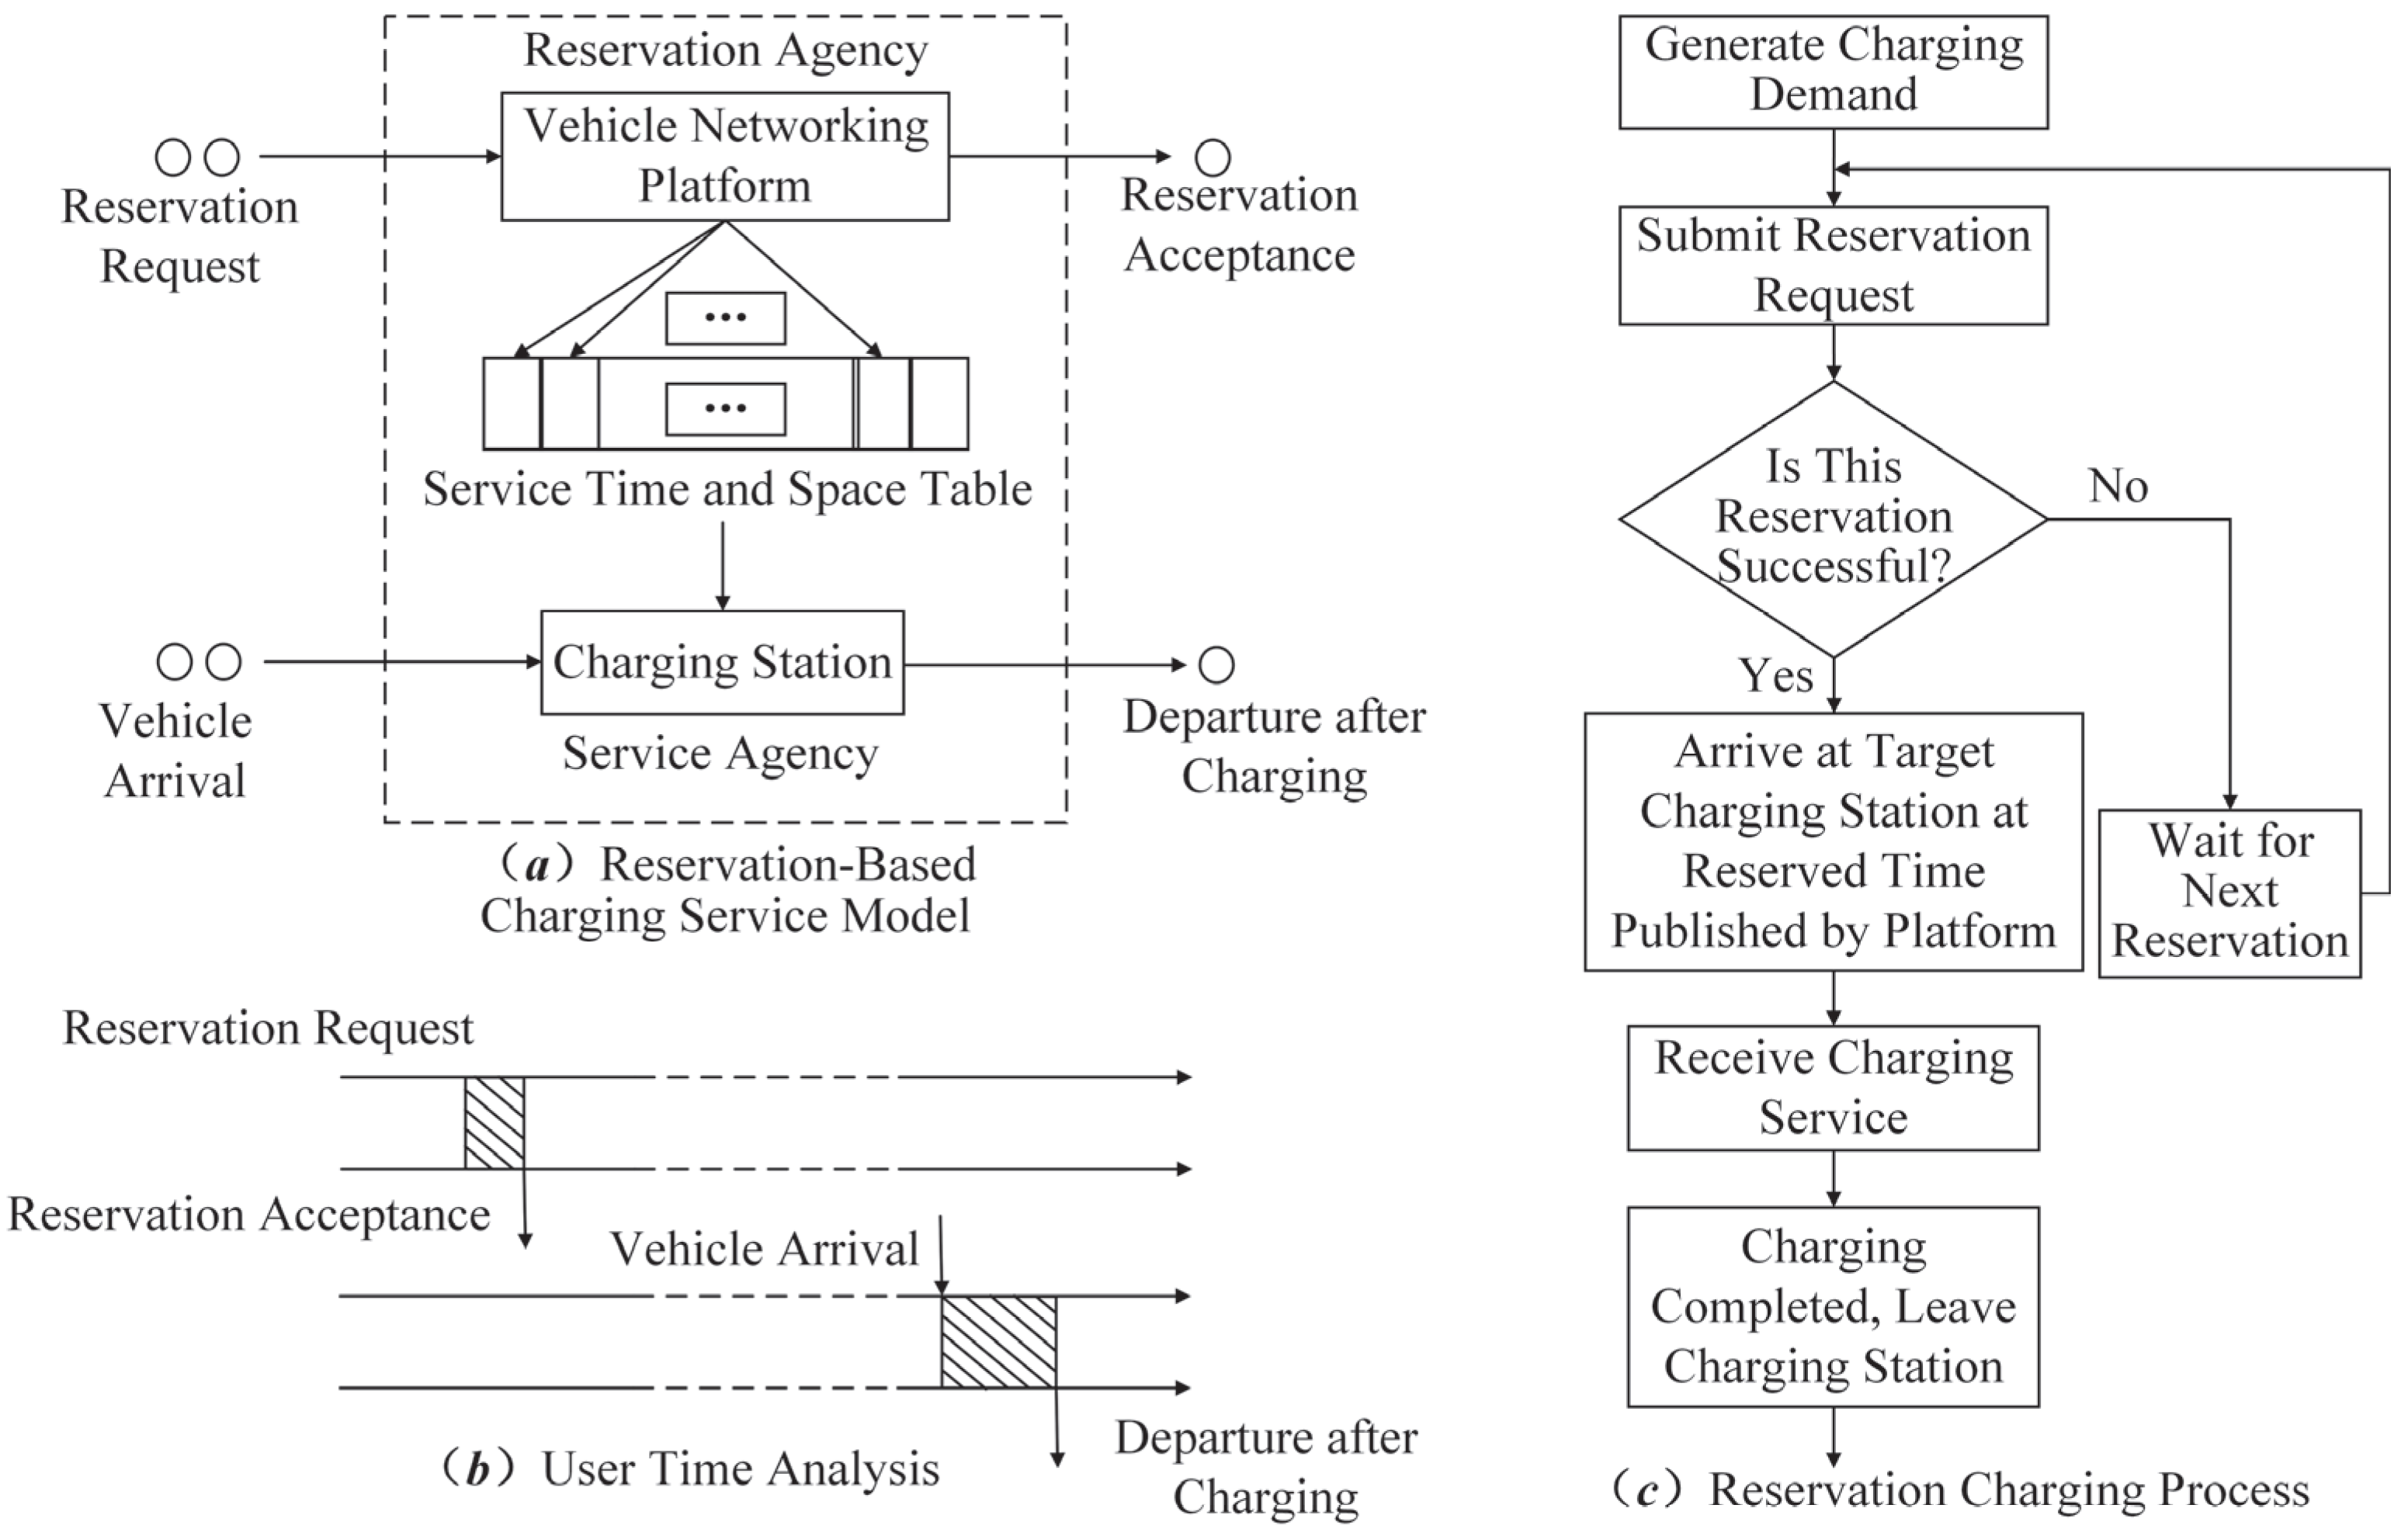
As shown in Figure 2, the reservation-based charging service model, user time analysis, and charging process are divided into two phases with six steps. The reservation phase consists of charging reservation request, request processing, and order confirmation. The service phase consists of vehicle arrival, charging process, and departure after charging. The reservation and service phases are interconnected.
The basic elements of the reservation-based charging service system include the arrival process of electric vehicle users, the reservation agency (control center), the service agency (charging stations), and the charging service process. Except for the reservation agency—the control center—the other elements are the same as those in the queuing-based charging service, but in the reservation-based system the number of reservable charging piles at a station can be adjusted or determined at any time according to the reservation status. The control center needs to consider multiple factors, including the number of reservable charging piles, the distribution of charging time windows, reservation rules, the number of charging reservation requests at the same moment, and the success rate of user reservations. The reservation rules indicate the adoption of a time-limited priority mechanism in which priority is assigned according to membership points, and once a reservation is made, service is guaranteed, but the control center determines the charging time window, charging cost, and charging station selection by considering the travel demand, personal preferences, and earliest arrival time of electric vehicle users.

3.3. Dynamic Dispatching Model Based on Rolling Time Axis

The control center needs to process all newly received charging reservation requests in real time within a very short period and perform an exhaustive search for optimal charging time windows and costs according to user travel demands and individual preferences. This problem can be regarded as an integrated dispatching problem of dynamic charging services at charging stations under time window constraints. To address this, a dynamic dispatching model based on a rolling time axis is established: at the end of each rolling horizon, the spatiotemporal distribution of all electric vehicle charging demands in the region is updated immediately, the charging reservation requests accumulated within the current rolling horizon are processed, and new charging schemes are generated for each electric vehicle and fed back to users. For simplicity of analysis, the queuing time of electric vehicles is not considered, and the difference between the earliest arrival time of an electric vehicle at the target charging station and the starting time of the reservation window is defined as the “slack time.”

3.3.1. Variable Length Rolling Horizon Mechanism

The variable length rolling horizon mechanism is used to process new charging reservation requests and generate corresponding charging schemes. At the end of each rolling horizon, the dynamic reservation requests accumulated within the horizon are dispatched in a unified manner.
The process of handling charging reservation requests by the control center in a day can be divided into a finite number of time intervals with variable lengths, each referred to as a variable length rolling horizon. The setting principles are as follows:
(1)
When an emergency occurs, the event-driven strategy is adopted to end the current rolling horizon and process user requests as quickly as possible;
(2)
When the duration reaches a certain threshold, the current rolling horizon is terminated;
(3)
When the number of new reservation requests reaches a certain threshold, the current rolling horizon is terminated.
The decision-making process is shown in Figure 3.

3.3.2. Dynamic Insertion Algorithm Based on Rolling Time Axis

In the dynamic processing of charging reservation requests, a time axis is established for a complete dispatching cycle. At time t 1 , both dynamic and static charging demand information are known, and all charging reservation orders at this moment are classified and processed using different strategies, as shown in Figure 4. The same procedure is repeated at the next moment t 1 , and so on.
For charging stations with multiple charging piles, the piles and time windows occupied by ongoing orders are fixed and cannot be changed. For orders in transit, the target charging station and the occupied time window are known, while the charging pile to be connected can be adjusted among all available piles at that station. Therefore, for a new reservation request, an initial charging scheme can be generated through the dynamic insertion algorithm. The specific steps are as follows:
(1)
After each rolling horizon ends, calculate the reachable time intervals and estimated charging demand for all new reservation requests using the dynamic spatiotemporal evolution model of electric vehicle charging demand;
(2)
Determine the occupancy status of all non-idle charging piles on the time axis according to ongoing orders;
(3)
For each new reservation request, assign an adjustable charging amount Δ E as the charging time window buffer for each vehicle. Based on the status of accepted reservations, perform superimposed analysis of all charging piles at each station to obtain the candidate set of charging schemes that satisfy the constraints of vehicle reachable time intervals and buffer;
(4)
Sequentially calculate the idle time of charging piles after inserting the new reservation orders into the existing charging schemes;
(5)
Taking into account the equipment utilization rate of each charging station, determine the optimal charging scheme under the dynamic dispatching model with user charging behavior preferences as the optimization objective.
When all charging stations are operating at full capacity, all charging reservation requests received by the control center are accumulated and processed collectively after a certain time threshold.
Let [ e i , l i ] denote the expected arrival time window of electric vehicle i , where e i is the upper bound and l i is the lower bound. The charging time of vehicle i , given by e i l i , should be less than its full charging time. Considering user accessibility and satisfaction, e i is set to be greater than the earliest arrival time of vehicle i and less than half an hour. If vehicle i arrives before e i , the time window constraint is not violated, and the lead time is recorded as the slack time Δ t i . If vehicle i arrives between e i and l i , it is recorded as a late response. If vehicle i fails to arrive before l i , it is recorded as a no-show response. In both late and no-show cases, the slack time of vehicle i is set to 0, and the penalty coefficient will be considered later in the membership points system. Therefore, in the dynamic dispatching model, the status of charging piles within a charging station can be represented as shown in Figure 5.
For newly received charging reservation requests, the optimization objective of each order is first determined according to the user’s personal preferences, and then the optimal charging scheme is identified. In particular, if multiple reservation requests are received simultaneously (e.g., within one minute), they are dispatched sequentially in descending order of user membership level. The specific decision-making process is as follows:
(1)
Predict the spatiotemporal distribution of charging demand for a finite number of variable forecasting stages n ( n = 1 , 2 , , N ; N is a finite integer, e.g., 15 min), and calculate the charging service fees of charging stations according to the coalition game pricing model;
(2)
For the charging reservation request of vehicle i , determine the optimization objective of the order based on the user’s personal preferences, as expressed in (8)–(10);
(3)
Apply the conventional navigation control strategy considering traffic conditions to calculate the earliest arrival time of vehicle i at charging station j ( j = 1 , 2 , , M ; M is the number of candidate charging stations), and determine the range of e i j ;
(4)
Based on the charging pile status within station j , generate a set of charging schemes that satisfy the constraint of e i j , including charging time windows and total costs, where the total cost is obtained from the charging service fees and time windows computed in step (1);
(5)
Traverse the set of charging schemes of vehicle i across all candidate charging stations, and use a heuristic algorithm to find the optimal charging scheme that satisfies the optimization objective defined in step (2). This scheme is then returned by the control center as the accepted charging order for the reservation request of vehicle i .

3.4. Membership Points Growth Mechanism

The membership points growth mechanism is a supplementary component of the integrated “reservation-based charging + consumption” service model. It is designed to further enhance the charging service experience of electric vehicle users during the practical application and promotion of the intelligent charging navigation system. This is achieved through measures such as prioritizing reservation request processing and providing charging discounts, thereby strengthening the mutually beneficial trust relationship between electric vehicle users and the control center.

3.4.1. Membership Points Model

Points are an important measure for evaluating user participation in reservation-based charging services. They are obtained through a comprehensive assessment of multiple data sources. The design quality of the points function has a direct impact on the participation and responsiveness of electric vehicle users, so the core issue of the membership points model lies in designing a reasonable points calculation function. When electric vehicle users participate in reservation-based charging services through the control center, events such as submitting reservation requests, selecting personal preferences, and making payments to lock orders occur. These events are collectively referred to as user responses to the control center, and the points calculation function is established based on these responses.
First, the following assumptions are made for the established “points calculation function” model:
(1)
The points obtained by electric vehicle users are proportional to the number of their responses to the control center;
(2)
The total points obtained by electric vehicle users during the reservation-based charging service process follow a “multiplicative growth” relationship with their expected single charging duration t , according to the relation 1 + k t , where k is a system parameter;
(3)
The control center has an independent function for imposing penalties on “breach of reservation”.
Next, six response indicators are proposed based on the model assumptions, as shown in Table 1.
Therefore, the points calculation function can be expressed as follows:
S = 1 + k t c 1 x 1 + c 2 x 2 + c 3 x 3 c 4 x 4 c 5 x 5
where k is a system parameter with a value of 1 / T and a unit of h 1 , and T represents the expected duration of a single charging session for all electric vehicles. c 1 , c 2 , , c 5 are also system parameters, representing the points obtained for each response, which are tuned by the platform according to actual conditions.

3.4.2. Membership Level Classification Model

The service priority and order discount of members correspond to their membership levels. The higher the level, the higher the service priority and the greater the order discount. Assume that there are n membership levels, where n > 1 . According to the assumption, the points SG required for a member to upgrade from level i to level i + 1 are defined as an exponential function of level i :
S G = a b i
where a and b are system parameters set by the control center according to the points calculation function S and the number of levels n ; i = 1 , 2 , , n 1 . The cumulative points S required for upgrading from level 0 to level i satisfy:
a ( b i 1 ) b 1 S < a ( b i + 1 1 ) b 1
The cumulative points S required to upgrade to the highest level n satisfy:
S a ( b n + 1 1 ) b 1

4. Case Simulation

4.1. Verification of the Charging Navigation Strategy Based on a Simulated Scenario

4.1.1. Simulation Process and Parameter Settings

Based on the effectiveness of the reservation-based charging optimization model, the probability of the trip starting time of electric vehicle users follows an exponential distribution. Meanwhile, to simulate traffic flow, the road network topology data in Reference [27] needs to be added to the vehicle navigation planning set. The specific simulation procedure is as follows:
(1)
Initialize all vehicles in the scenario, with their starting positions randomly set in the residential, work, and other three types of areas shown in Reference [27];
(2)
Obtain the trip starting time of each vehicle using the maximum likelihood estimation method. At the same time, randomly generate the destination direction of vehicles at the boundary of the area, and plan detailed driving routes based on the shortest path algorithm;
(3)
Analyze the traffic flow of each road segment in the road network using the traffic flow model;
(4)
When an electric vehicle generates a charging demand, it submits a reservation request to the control center containing charging behavior preferences and membership level. For ease of analysis, the proportions of the three types of preferences among all users are fixed at 1:1:1, the maximum membership level is six, and the preference type and membership level of each user are randomly generated;
(5)
The control center processes new reservation requests based on the charging decision model and the dynamic dispatching model. In the intelligent charging navigation mode, charging piles can be in three states: idle, occupied, and insertable. In the conventional navigation mode, charging piles have only two states: idle and occupied, and user preferences and membership levels are not considered;
(6)
Once an electric vehicle completes its charging process, it continues its remaining trip for the day.
The above steps are simulated using the Monte Carlo method. In the simulation, both charging stations A and B are equipped with 40 charging piles. One Monte Carlo cycle is completed every 24 h, and the simulation time interval is set to 1 min.
It should be noted that, to make the simulation results more generalizable, the charging service fees of stations A and B used for calculating user order costs during the simulation are determined by a pricing method under market competition. At the same time, to demonstrate the superiority of the dynamic insertion method, the buffer of the time window is set to 50%, meaning that users are allowed to charge at least 50% of the required energy. The buffer reflects the urgency of fast charging for electric vehicle users, and its final value needs to be determined through market practice analysis. At this stage, the coalition game model is not adopted for pricing.

4.1.2. Results Analysis

Users are numbered according to the order in which their charging demands occur, and the above simulation process is implemented through MATLAB R2023b programming. The charging behaviors of electric vehicle users are simulated under both the conventional navigation mode and the intelligent charging navigation mode. The simulation produces multiple data outputs, including user charging time windows, queuing times, charging costs, and the charging/discharging status of piles. The results are analyzed from three aspects: user experience, charging station operation, and distribution network voltage quality.
(1)
User Experience Analysis
To analyze the improvement in charging experience for electric vehicle users, the charging start times under the conventional navigation mode and the intelligent charging navigation mode were first compared. As shown in Figure 6, the variation trend and magnitude of charging start times under the two modes are basically the same, reflecting the time rigidity of fast-charging loads connecting to the power grid. Second, the average charging prices of electric vehicles under the two modes were compared. As shown in Figure 7, charging prices fluctuate with changes in charging demand, which is the result of market-based competitive pricing. The final average charging price under the intelligent charging navigation mode is 2.20 CNY/kWh, slightly higher than 2.15 CNY/kWh under the conventional navigation mode, while the overall variation trends are similar. In general, since fast-charging loads represent rigid time demands, their access times and charging costs show the same rigidity before and after navigation when viewed as a whole.
Furthermore, the queuing and slack times of electric vehicles under the conventional navigation mode and the intelligent charging navigation mode were compared. As shown in Figure 8, the intelligent charging navigation significantly reduces user queuing time due to the adoption of the dynamic dispatching model based on the rolling time axis. The total queuing time of electric vehicle users under the conventional navigation mode is 18,914 min, whereas under the intelligent charging navigation mode it is only 518 min. The reasons are as follows: (1) the dynamic insertion algorithm based on the rolling time axis enables more reasonable allocation of time resources for each charging pile at stations; (2) a 50% charging buffer is set, meaning that users inserting into existing schedules can sacrifice part of their charging amount in exchange for faster grid access, which also reflects the urgency of fast charging during travel.
In this case study, a total of 560 electric vehicle users changed their charging decisions after using intelligent charging navigation and selected different charging stations. To better compare the changes in their charging experience, these users were classified according to their charging behavior preferences, as shown in Figure 9. The statistics indicate the time and cost savings of electric vehicle users with different charging behavior preferences after changing their charging decisions under intelligent charging navigation compared with the conventional navigation mode, where negative values represent increases in time and cost.
As shown in Figure 9a, for the 120 electric vehicle users with a time preference, the comparison of time and cost after changing their charging decisions indicates that 102 users experienced faster charging access, saving a total of 2076 min. Among them, five users saw reductions in both charging time and cost. These time-preference users all experienced improved user satisfaction after adopting intelligent charging navigation. Meanwhile, nine users had a slight increase in charging access time, totaling 29 min, while saving 1.8348 CNY in charging costs. For these users, the charging experience slightly declined, which may be due to the following reasons: (1) their membership levels were relatively low, resulting in lower processing priority in the dynamic dispatching model; (2) the traffic flow on each road segment varied dynamically in the simulation, and after changing the charging station selection, the actual traffic conditions on the routes differed from the traffic flow predictions used in the intelligent charging navigation decision-making process. In addition, nine users experienced no change in charging access time, meaning their charging experience remained unchanged. Therefore, after adopting intelligent charging navigation, 85% of time-preference users had an improved experience, 7.5% experienced a decline, and 7.5% saw no change.
As shown in Figure 9b, for the 231 electric vehicle users with a cost preference, the comparison of time and cost after changing their charging decisions indicates that 138 users reduced their charging costs, saving a total of 260.4917 CNY, while also advancing their charging access time by 318 min. These cost-preference users all experienced improved satisfaction after adopting intelligent charging navigation. Meanwhile, 91 users saw an increase in charging costs, totaling 484.7661 CNY, but their charging access times were significantly advanced by 2956 min. For these users, the charging experience cannot be considered as reduced, and the reasons are as follows: Since the dynamic dispatching model is adopted in intelligent charging navigation, the queuing time that electric vehicle users would otherwise spend waiting at charging stations is greatly reduced. During this period, the charging service fee gradually decreases. Therefore, the increase in charging costs for these users is due to their overall access time being advanced (as indicated by the leading section in Figure 9b, rather than the navigation strategy itself. If they were to choose another charging station, the required charging cost would be even higher. Thus, these users in fact obtained the optimal charging scheme. In addition, two users experienced no change in charging cost, while their charging access times were advanced by 7 min, which also improved their experience. Therefore, after adopting intelligent charging navigation, at least 60.6% of cost-preference users achieved an improved charging experience.
As shown in Figure 9c, for the 209 electric vehicle users with a comprehensive preference, 133 users experienced faster charging access, saving a total of 3011 min. At the same time, their charging costs increased by 302.5602 CNY, with an average access time improvement of 22.64 min and an average cost increase in only 2.27 CNY. According to the definition in Section 2.3, their individual utility was thus improved. In addition, 75 users had no change in charging access time, while their total charging costs decreased by 173.7529 CNY, also resulting in improved utility. Moreover, one user experienced a decline in utility, with charging access time increasing by 5 min and cost decreasing by 0.121 CNY, for reasons consistent with those discussed in Figure 9a. Therefore, after adopting intelligent charging navigation, 99.5% of comprehensive-preference users experienced an improvement in user satisfaction, while 0.5% experienced a decline.
(2)
Analysis of Charging Station Operation Level
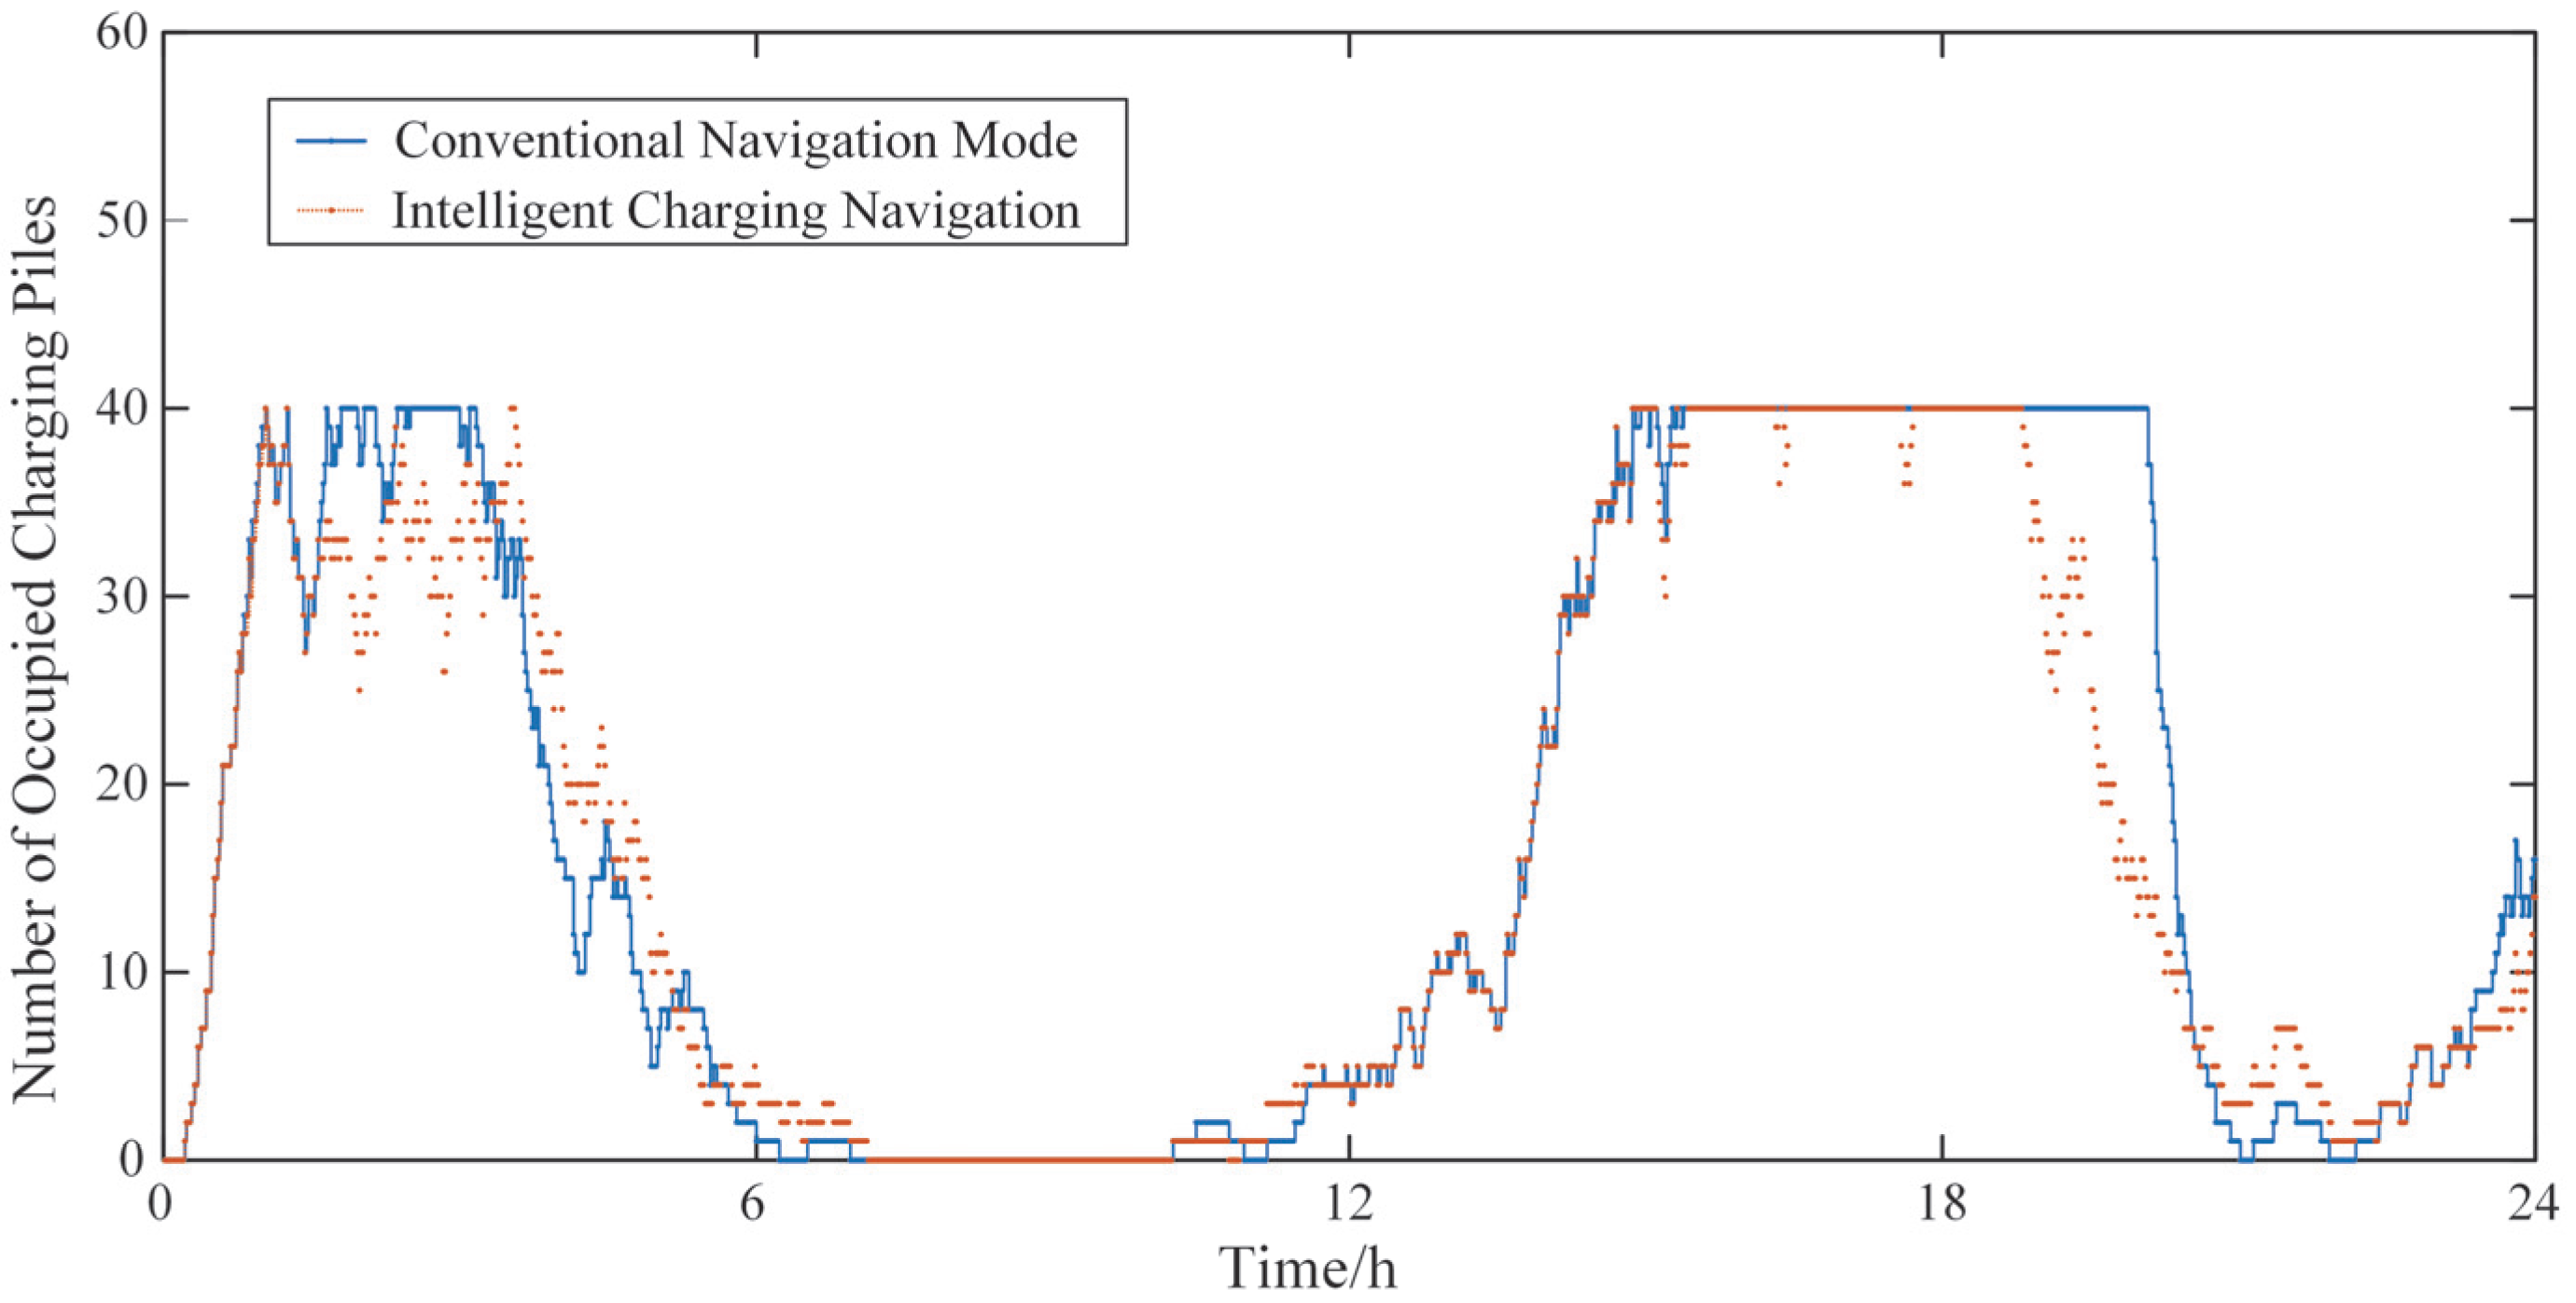
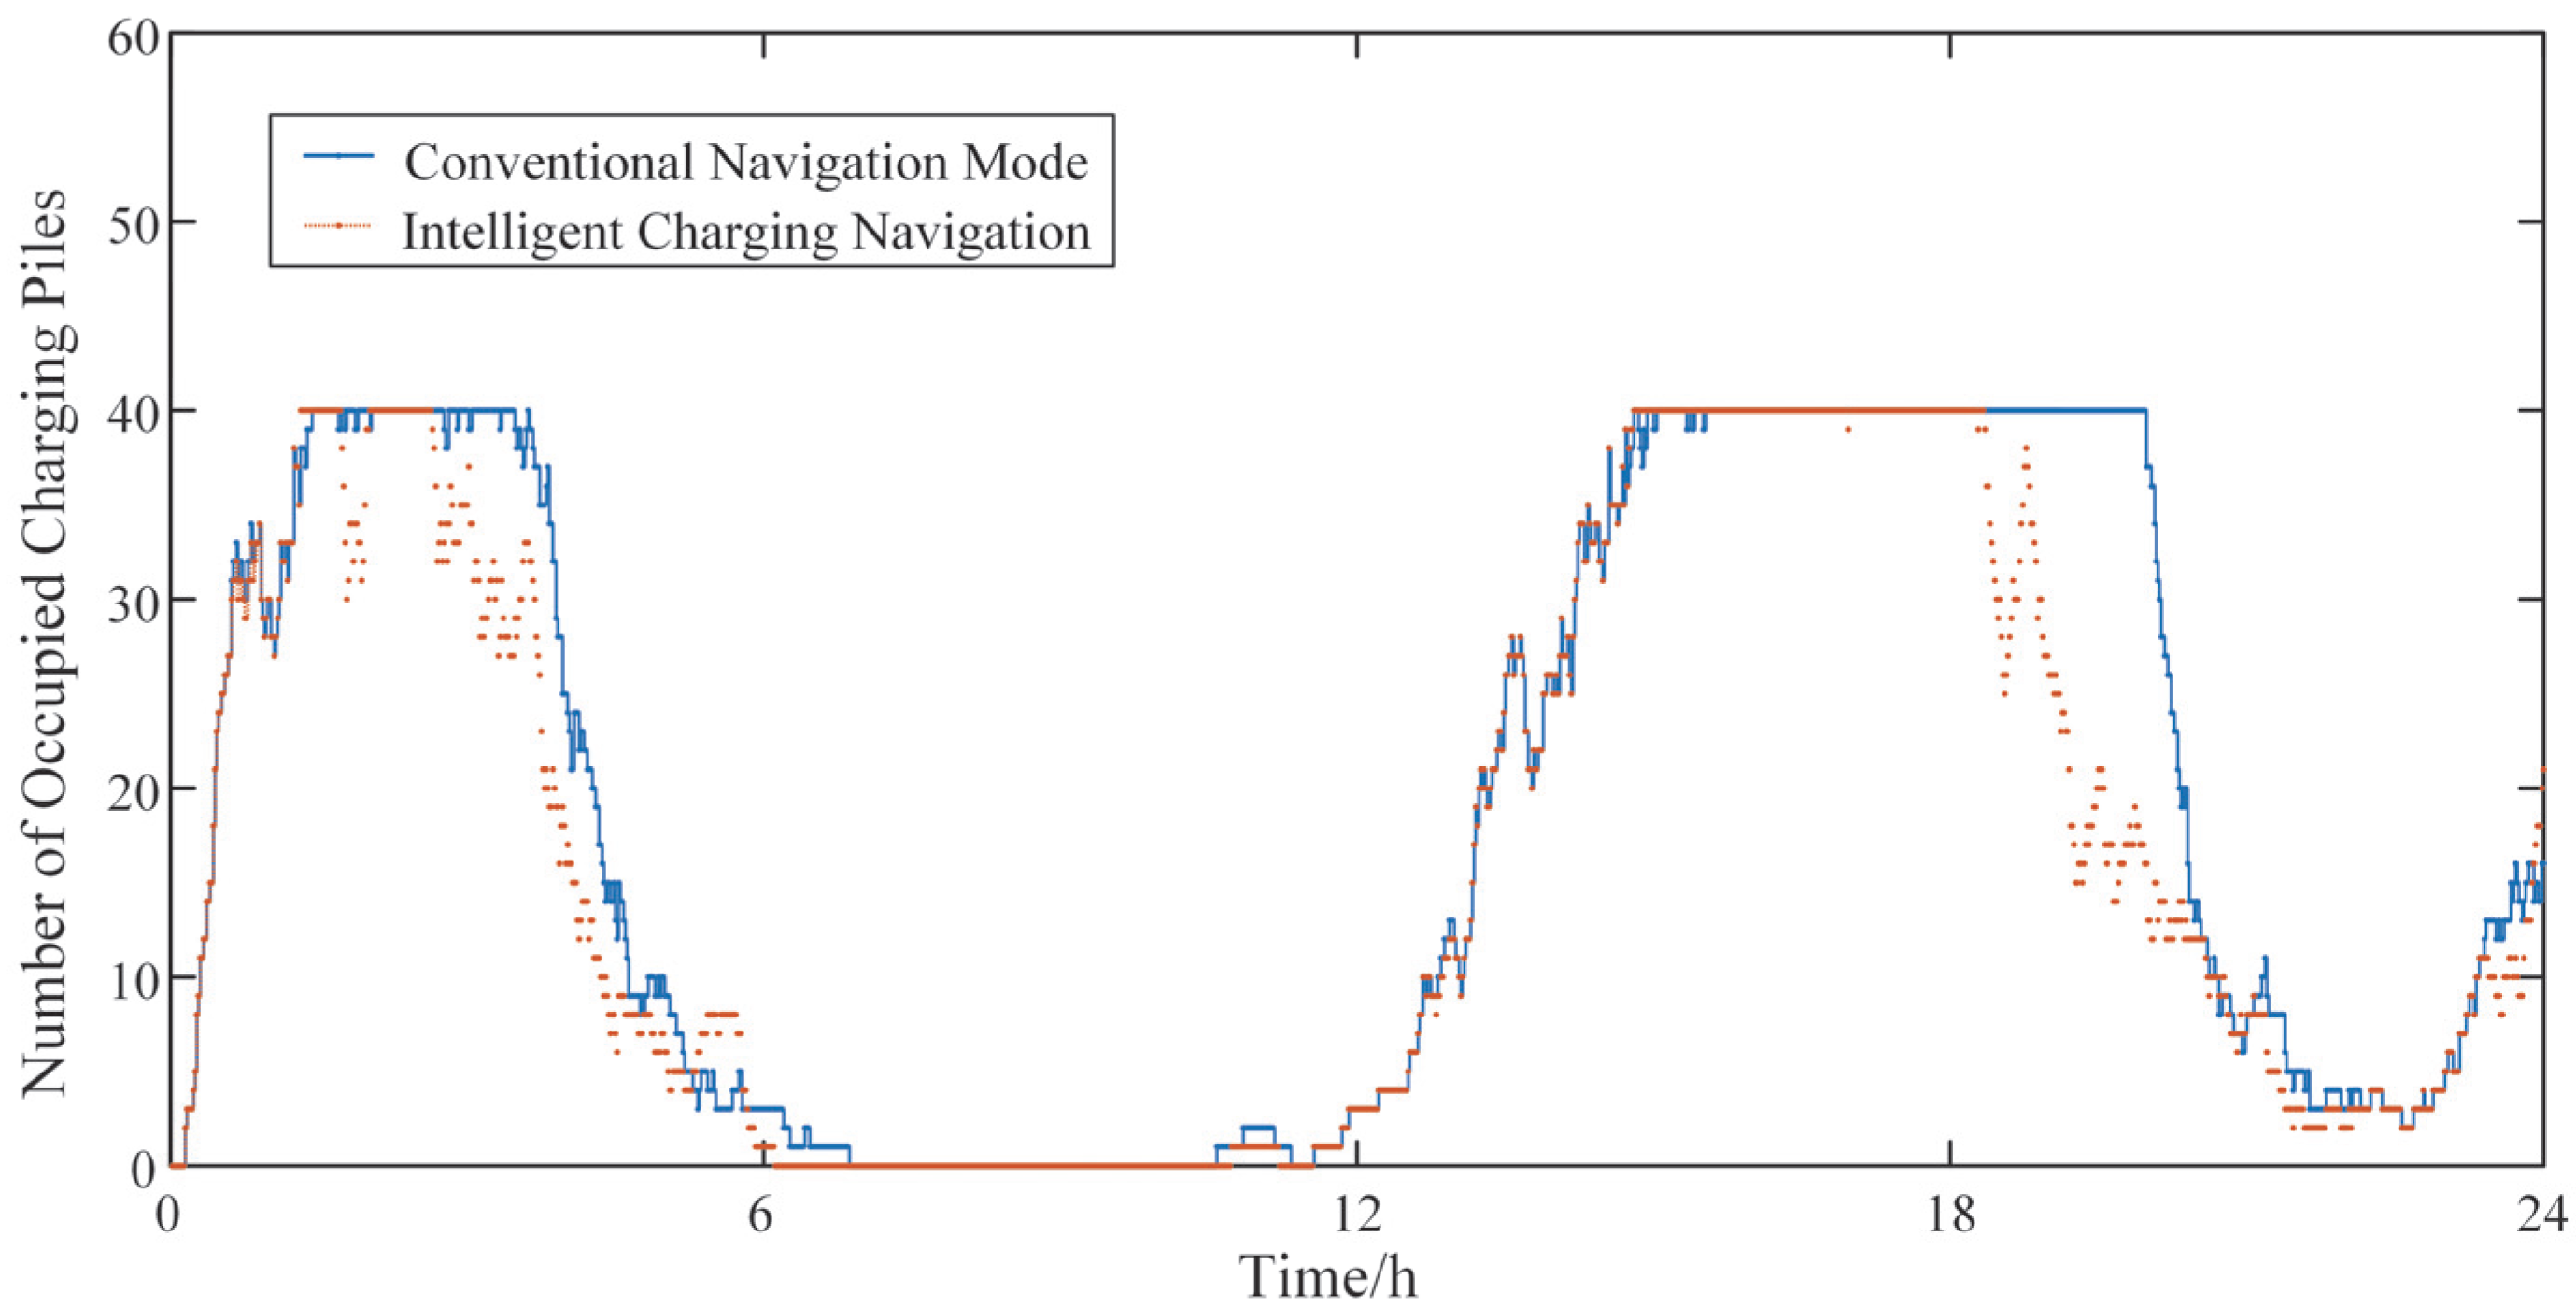
To better analyze the operation level of the two charging stations in the case study and to demonstrate the superiority of reservation-based charging services, the portion of each charging pile’s idle interval of less than 10 min is defined as a non-insertable state (as shown in Figure 5). In the statistics, this portion is recorded as occupied time, because although the pile is not actively working, it cannot accept new electric vehicle connections. Based on this definition, the occupancy status of charging piles at stations A and B under the conventional navigation mode and the intelligent charging navigation mode is obtained, as shown in Figure 10 and Figure 11. As shown in Figure 10, under intelligent charging navigation, the occupied time of charging piles at station A is significantly reduced during peak charging demand periods. Compared with the conventional navigation mode, the total occupied time of charging piles at station A decreases from 25,230 min to 23,859 min, meaning that the average daily utilization rate of each charging pile drops from 43.8% to 41.4%. Figure 11 shows a variation trend similar to that in Figure 10. The occupied time of charging piles at station B decreases from 27,250 min to 23,939 min, with the average daily utilization rate per pile dropping from 47.3% to 41.6%. This indicates that after adopting intelligent charging navigation, charging stations in the region can accommodate more electric vehicles for charging. This result provides a useful reference for planning studies of charging stations.
Furthermore, statistics of all user orders show that under the conventional navigation mode, the total operating revenue of stations A and B is 1.15978 million CNY, with 0.56770 million CNY and 0.59208 million CNY for stations A and B, respectively. Under the intelligent charging navigation mode, the total operating revenue of stations A and B is 1.15538 million CNY, a decrease of 0.4%, with 0.55813 million CNY for station A and 0.59725 million CNY for station B, corresponding to a decrease of 1.7% and an increase of 0.9%, respectively. This change in revenue primarily stems from the intelligent navigation strategy’s redistribution of user traffic. Some vehicles that were originally concentrated at Station A during peak periods were redirected to other stations or more appropriate time slots, which alleviated peak-time congestion but also led to a slight decrease in Station A’s charging volume during high-price peak hours, resulting in a modest revenue reduction.
Overall, the difference in station revenue between the two modes is relatively small. However, the intelligent charging navigation strategy enhances the overall vehicle accommodation capacity of the region, mitigates resource imbalance, and extends the effective planning horizon of charging stations.
(3)
Analysis of Distribution Network Voltage Indices
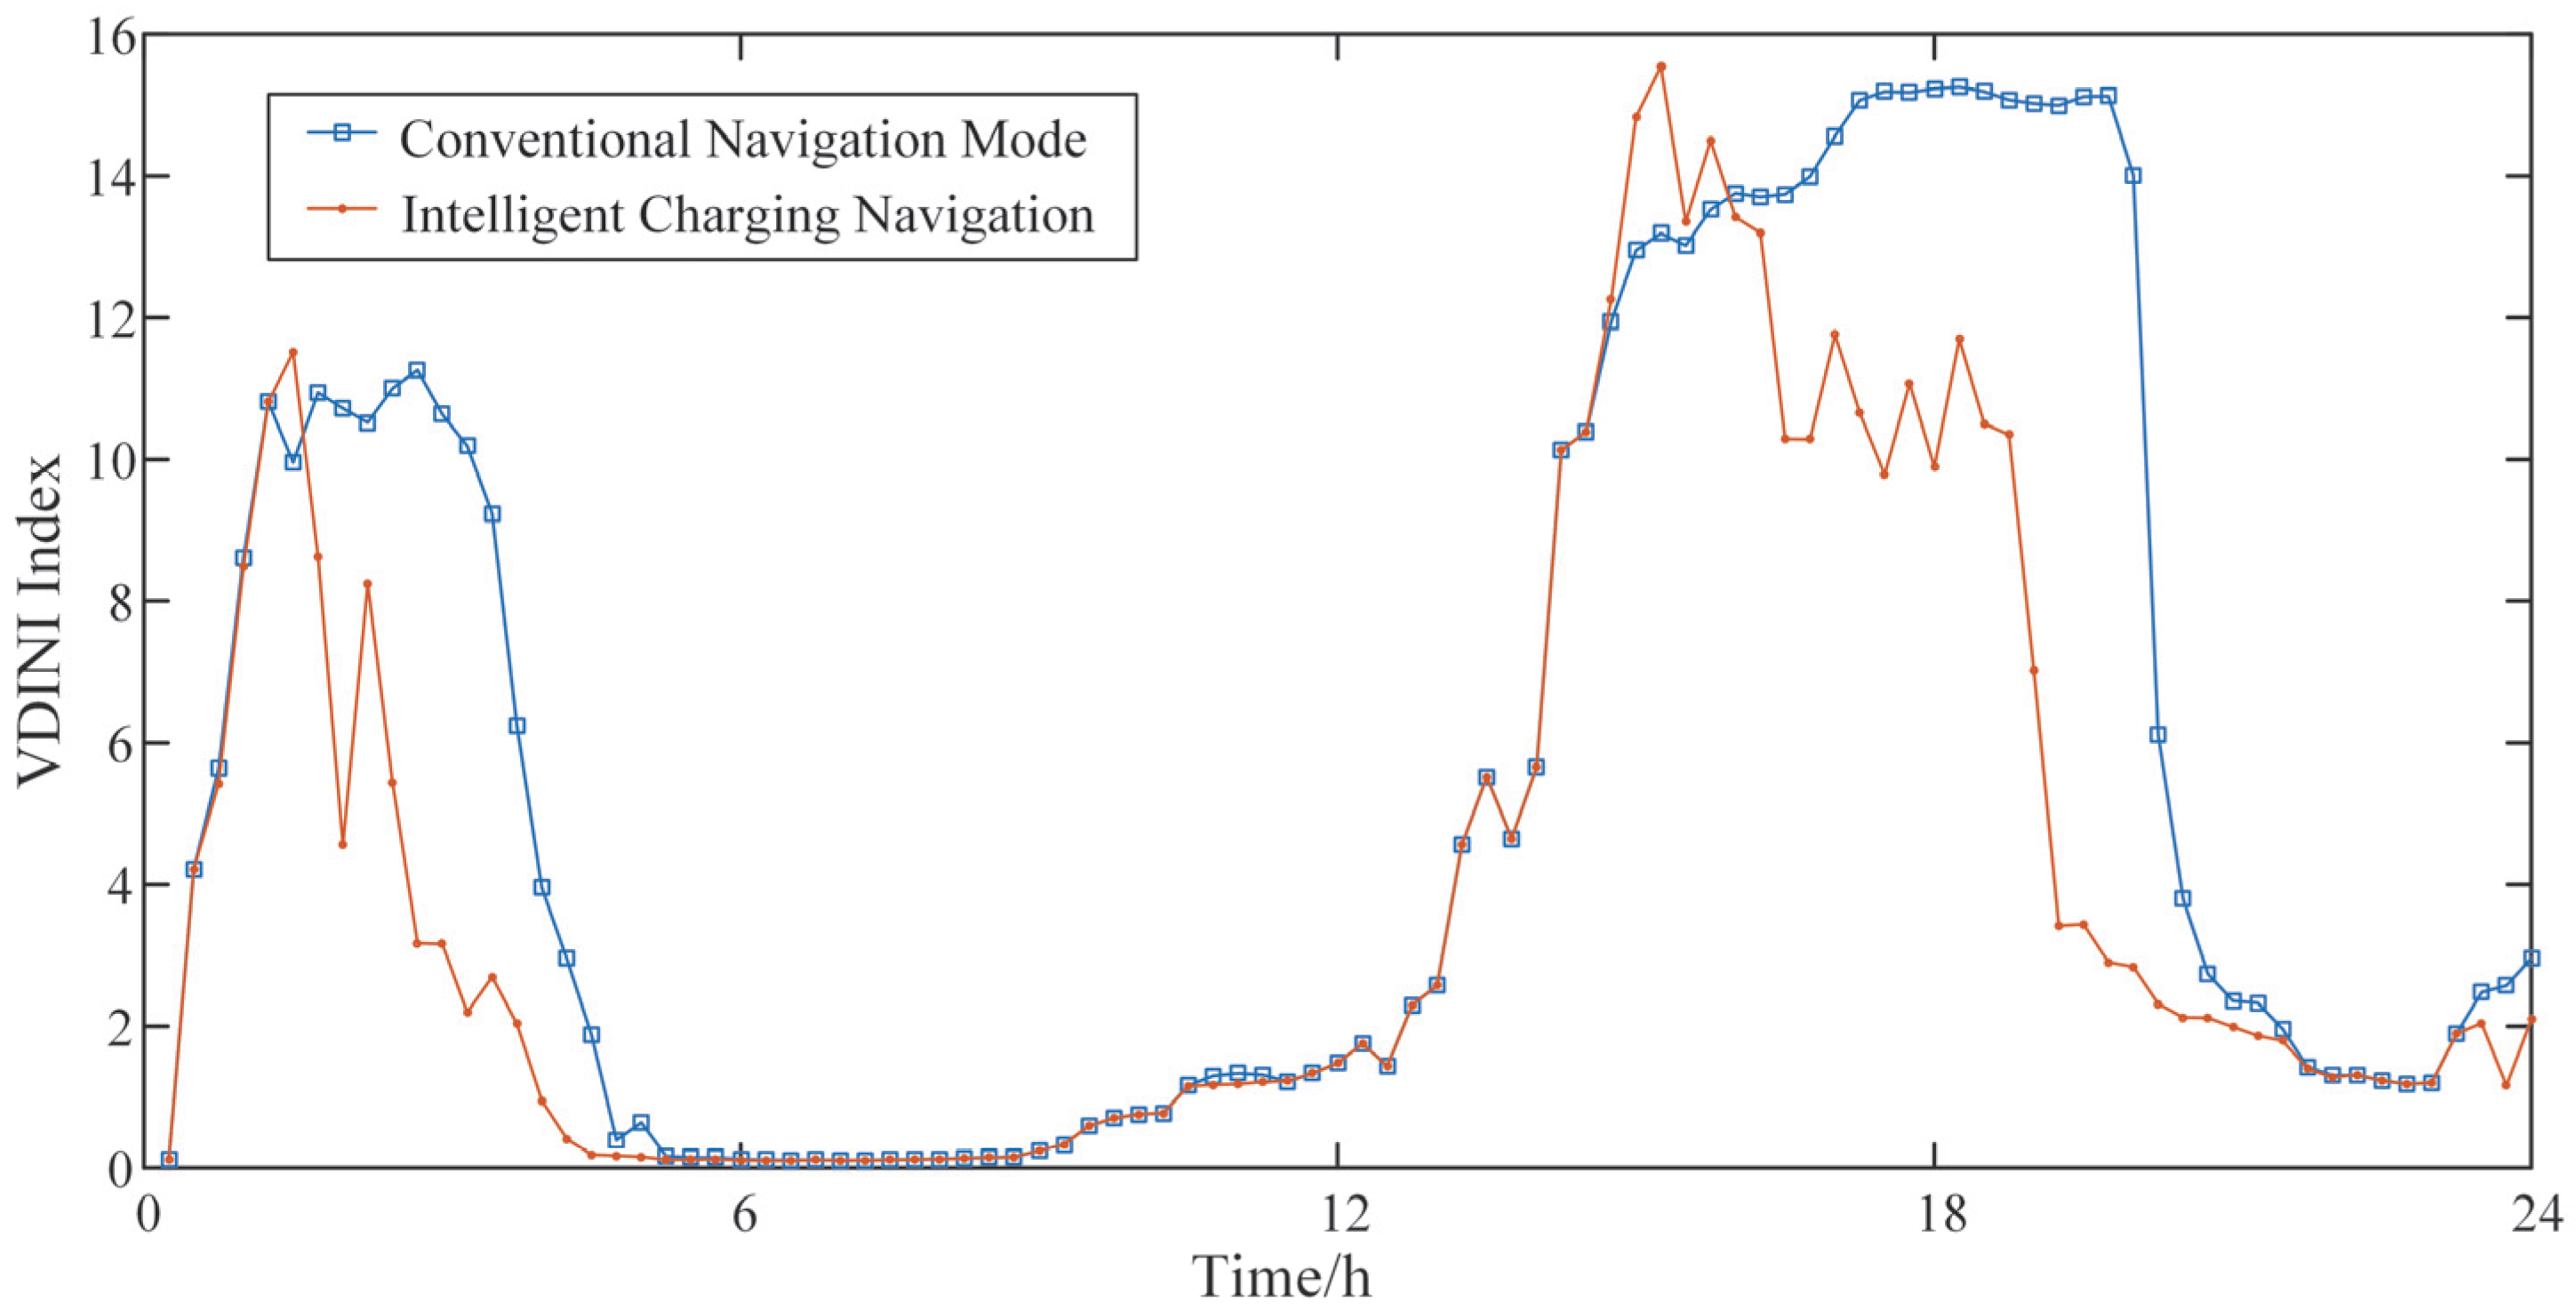
To quantify the overall deviation of voltage distribution in the power network, this study introduces the Voltage Deviation Index based on Node Importance (VDINI). This index comprehensively accounts for both the magnitude of voltage deviations at each node and their relative importance within the network, thereby providing a more holistic representation of the overall voltage distribution deviation. A smaller VDINI value indicates that the voltages are closer to their nominal levels and more evenly distributed, whereas a larger value reflects more significant voltage deviations. The distribution network supply voltage deviation index (VDINI), based on node criticality, is used to indirectly evaluate changes in distribution network operating conditions. A comparison of VDINI variations under the conventional navigation mode and the intelligent charging navigation mode is shown in Figure 12. After adopting intelligent charging navigation, the node voltages of the distribution network are improved to some extent. The average VDINI decreases from 5.7831 to 4.1211, a reduction of 29%, while the peak increases from 15.2578 to 15.5489, an increase of 1.9%. The reason is that, compared with a single navigation strategy, intelligent charging navigation provides users with more diverse choices, thereby improving the overall daily distribution of node voltages. However, due to the dynamic dispatching model, user charging becomes more concentrated during peak periods, which leads to a deterioration of voltage indices during these times.
To further verify the positive impact of the proposed system on distribution network operation, additional analyses were conducted on voltage deviation rates, node violation rates, and minimum node voltage levels. The results show that under intelligent charging navigation, the voltage deviation rates of distribution network nodes during peak periods generally decreased by approximately 15–20%; the proportion of nodes exceeding voltage limits across the network dropped from 6.3% to 3.8%; and the minimum node voltage level increased by about 0.7%. These results are consistent with the VDINI trends, further demonstrating the effectiveness of intelligent charging navigation in improving voltage distribution and alleviating local voltage violations in the distribution network.

4.2. Strategy Validation and Comparative Analysis Based on a Real Traffic Network

4.2.1. Simulation Process and Parameter Settings

To further verify the applicability and advantages of the proposed method under realistic structural conditions, this study adopts a typical 25 km × 25 km urban traffic network of a city center from Reference [28] and couples it with the IEEE-33-node distribution network [29] to construct a traffic–power integrated simulation environment. According to Reference [28], the number of vehicles entering the fast-charging process is between 1500 and 2000. To ensure fairness in the comparative analysis, the total number of deployed vehicles is adjusted so that the number of fast-charging vehicles naturally generated by the probabilistic model falls within the same order of magnitude as that reported in Reference [28], approximately 1660 vehicles. Based on this integrated simulation platform, the dynamic evolution of traffic flow and the spatiotemporal distribution of charging demand can be jointly characterized, enabling a comprehensive assessment of EV charging behavior under different strategies and their impacts on distribution network operating conditions.

4.2.2. Results Analysis

Users are numbered according to the chronological order of their charging demand, and the aforementioned simulation process is implemented in MATLAB to simulate EV charging behaviors under both the proposed method and the method in Reference [28]. The simulation results cover three key performance indicators: user queuing time, average charging price, and distribution network voltage deviation. The following analysis focuses on user experience and distribution network voltage aspects.
(1)
User Experience Analysis
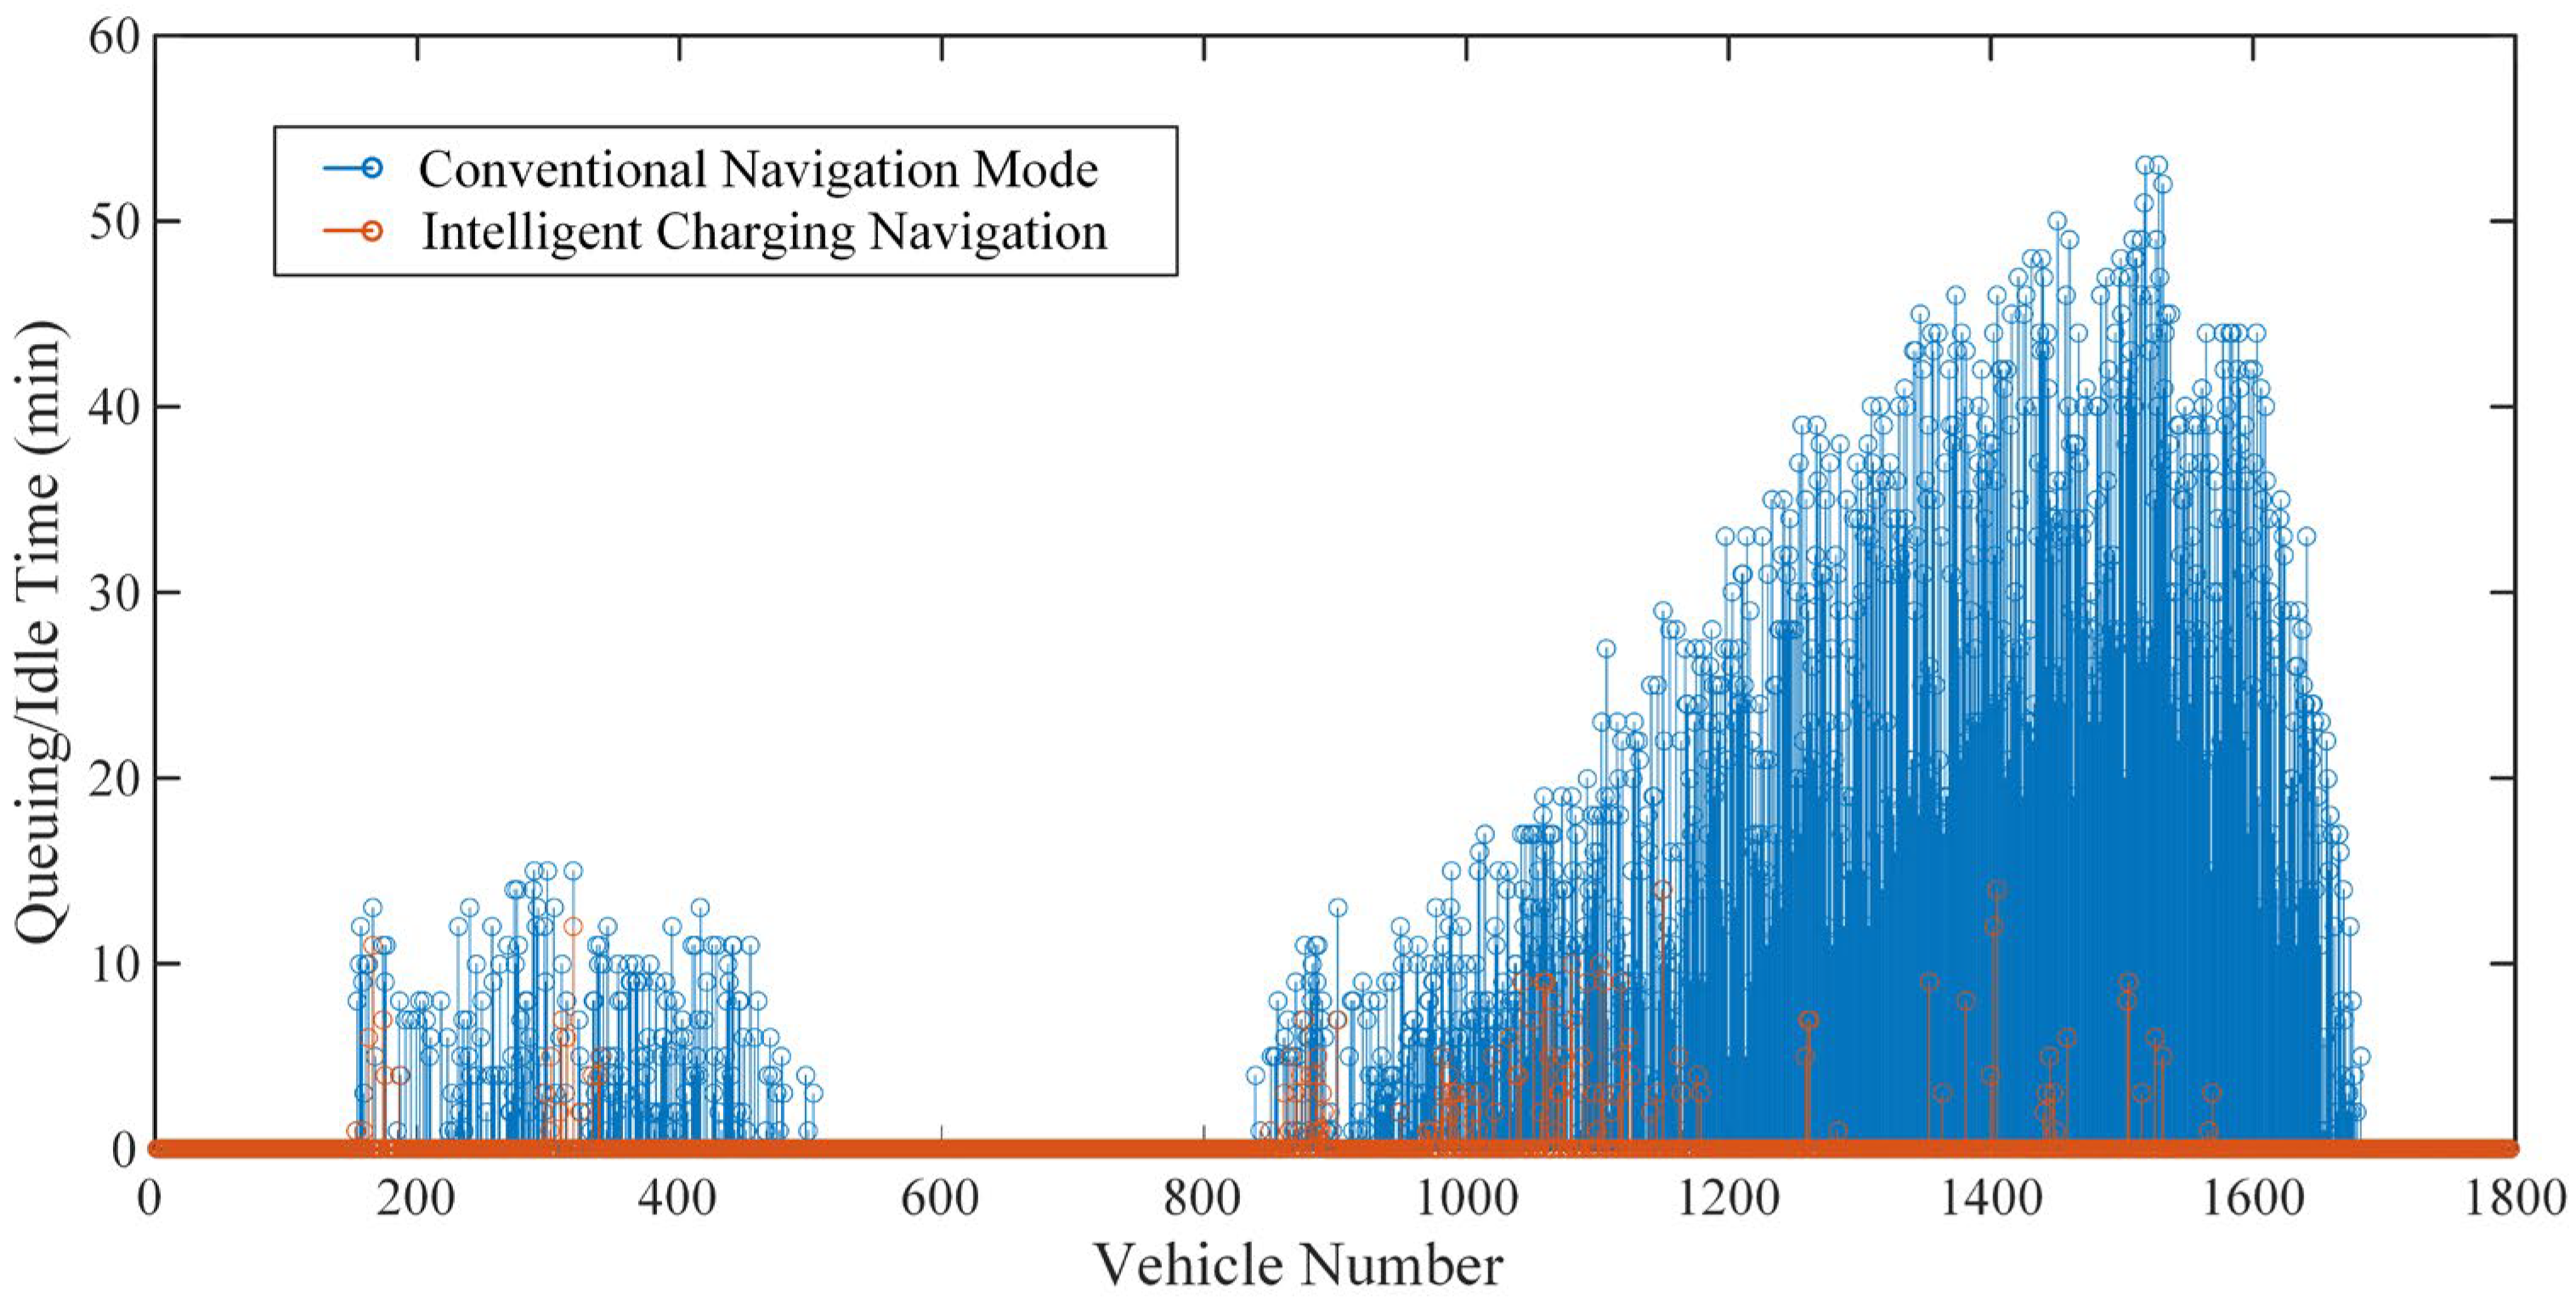
In terms of queuing time, as shown in Figure 13, the overall queuing time of the proposed method is significantly lower than that of the method in Reference [28], with a noticeably reduced curve height. In particular, in the peak region after vehicle number 1200, the orange curve consistently remains at a lower level without the pronounced congestion peaks observed in the blue curve. This demonstrates that the proposed method can effectively alleviate the concentrated accumulation of queuing time under large-scale vehicle arrival scenarios.
In terms of average charging price, as shown in Figure 14, the proposed method results in a slightly higher average price compared with the method in [28]. This is mainly because the proposed strategy prioritizes the fast access of time-sensitive users, leading some vehicles to charge earlier during higher-priced periods, which reflects a rational “time priority–slightly higher price” trade-off. It is worth noting that this price difference is relatively small and does not offset the overall improvement in user experience brought by the significant reduction in queuing time.
(2)
Analysis of Distribution Network Voltage Indices
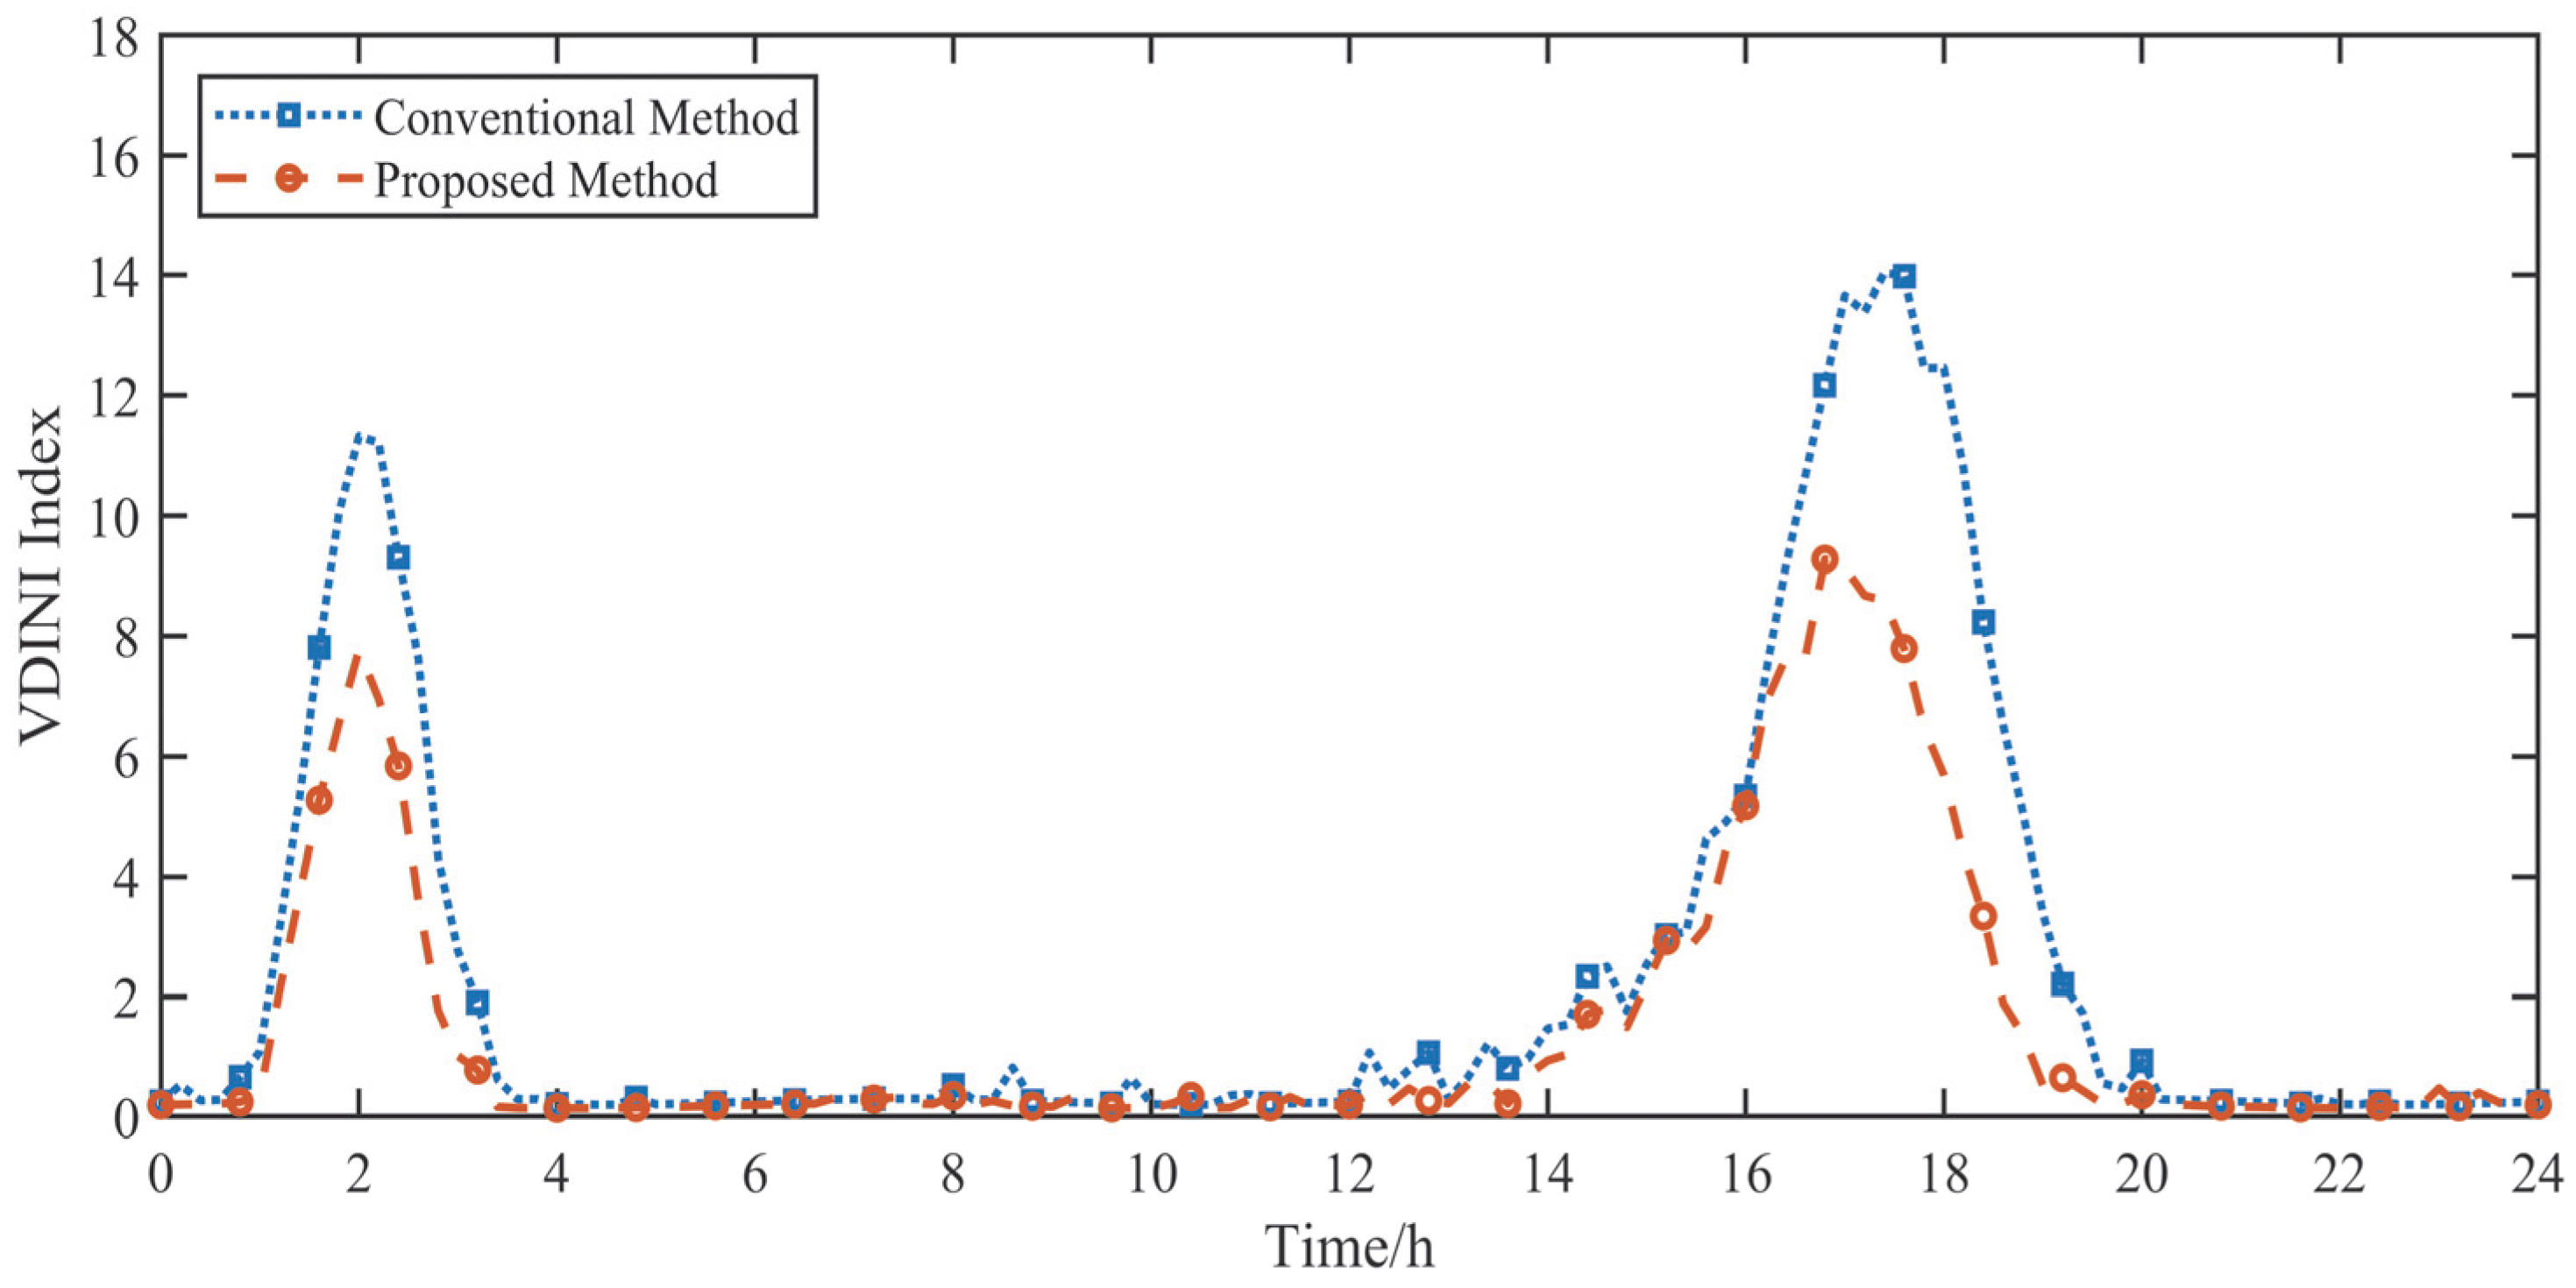
In terms of the VDINI index, as shown in Figure 15, the values under the proposed method are lower than those of the method in [28] during most periods, and the daily average is significantly reduced. This indicates that, under the same load level and distribution network topology, the proposed strategy achieves peak shaving and valley filling through a more rational spatiotemporal distribution of charging loads, thereby improving the overall voltage profile of network nodes and enhancing the operational quality and stability margin of the distribution network.
Overall, the results of the three key indicators show that the proposed method offers significant advantages over the approach in [28] in terms of reducing queuing time and improving distribution network voltage quality. Although the average charging price increases slightly, it remains within a reasonable time–cost trade-off range. In general, the proposed method demonstrates superior overall benefits in enhancing user experience, improving grid friendliness, and increasing charging station resource utilization, thereby providing strong support for the practical implementation of reservation-based charging scheduling strategies in real traffic network environments.

5. Conclusions

This paper proposes a smart charging navigation framework that integrates the power grid, transportation system, charging stations, and in-vehicle navigation terminals. Within the “reservation-based charging plus consumption” service mode, the concept of charging time windows is introduced, and a rolling time-axis dynamic dispatching model is developed. Through multi-scenario simulation verification, the proposed method demonstrates significant advantages across multiple dimensions. The main conclusions are as follows:
(1)
Simulation Results Based on Typical Test Cases
In terms of user experience, smart charging navigation effectively reduces queuing time. Compared with 18,914 min under conventional navigation, the total queuing time is reduced to only 518 min, a decrease of nearly 97 percent. Moreover, 85 percent of time-preference users, about 60.6 percent of cost-preference users, and nearly 99.5 percent of comprehensive-preference users report improved outcomes.
In terms of charging station operation, the framework decreases the average daily occupancy rate of chargers. For Station A, the rate drops from 43.8 percent to 41.4 percent, and for Station B, from 47.3 percent to 41.6 percent. While total operating revenue remains nearly unchanged, the ability of charging stations to accommodate more electric vehicles is enhanced, demonstrating more sustainable infrastructure utilization.
In terms of grid performance, smart charging navigation improves distribution network voltage quality. The mean VDINI index decreases from 5.78 to 4.12, a reduction of about 29 percent, while the peak value increases from 15.26 to 15.55, an increment of about 1.9 percent. This indicates a more balanced voltage distribution overall, though with added stress during peak hours.
(2)
Strategy Validation and Comparative Analysis Based on a Real Traffic Network
In terms of user experience, the proposed method maintains a consistently low queuing time distribution throughout the entire period, with no significant long waiting times observed during peak hours. Overall queuing pressure is greatly alleviated, giving the proposed method a clear advantage over the reference method at congestion peaks. Meanwhile, the average charging price is slightly higher than that of the baseline method, but the difference remains small and falls within a reasonable time–cost trade-off range, without offsetting the overall improvement brought by the reduced queuing time.
In terms of power grid operation, the VDINI index is clearly better than that of the baseline method during most time periods, and the daily average is significantly lower. This indicates that the proposed strategy can improve the overall distribution of node voltages through a more reasonable spatiotemporal allocation of charging loads, thereby enhancing the stability and power quality of the distribution network.
Overall, reservation-based smart charging navigation not only optimizes user experience but also improves charging station efficiency and distribution network performance, providing a sustainable pathway for the large-scale and orderly integration of electric vehicles in future smart cities.

Author Contributions

Conceptualization, Z.C. and X.L.; methodology, Z.C. and D.-E.A.M.; software, Z.C.; validation, X.L. and D.-E.A.M.; formal analysis, Z.C.; investigation, Z.C.; resources, X.L. and H.W.; data curation, Z.C.; writing—original draft preparation, Z.C.; writing—review and editing, X.L. and H.W.; visualization, Z.C.; supervision, X.L. and D.-E.A.M.; project administration, X.L.; funding acquisition, X.L. All authors have read and agreed to the published version of the manuscript.

Funding

This work was supported by the National Natural Science Foundation of China. Project ID: U22B20106.

Data Availability Statement

The raw data supporting the conclusions of this article will be made available by the authors upon reasonable request.

Conflicts of Interest

The authors declare no conflicts of interest.

References

  1. Mao, T.; Lau, W.-H.; Shum, C.; Chung, H.S.-H.; Tsang, K.-F.; Tse, N.C.-F. A Regulation Policy of EV Discharging Price for Demand Scheduling. IEEE Trans. Power Syst. 2018, 33, 1275–1288. [Google Scholar] [CrossRef]
  2. Zhao, J.; Wang, J.; Xu, Z.; Wang, C.; Wan, C.; Chen, C. Distribution Network Electric Vehicle Hosting Capacity Maximization: A Chargeable Region Optimization Model. IEEE Trans. Power Syst. 2017, 32, 4119–4130. [Google Scholar] [CrossRef]
  3. Zhong, W.; Yu, R.; Xie, S.; Zhang, Y.; Yau, D.K.Y. On Stability and Robustness of Demand Response in V2G Mobile Energy Networks. IEEE Trans. Smart Grid 2016, 9, 3203–3212. [Google Scholar] [CrossRef]
  4. Rempel, D.; Cullen, C.; Bryan, M.M.; Cezar, G.V. Reliability of open public electric vehicle direct current fast chargers. Hum. Factors 2024, 66, 2528–2538. [Google Scholar] [CrossRef] [PubMed]
  5. Powell, B.; Johnson, C. Impact of Electric Vehicle Charging Station Reliability, Resilience, and Location on Electric Vehicle Adoption; National Renewable Energy Laboratory (NREL): Golden, CO, USA, 2024.
  6. Weng, Z.; Zhou, J.; Song, X.; Jing, L. Research on orderly charging strategy for electric vehicles based on electricity price guidance and reliability evaluation of microgrid. Electronics 2023, 12, 4876. [Google Scholar] [CrossRef]
  7. Zhong, J.; Liu, J.; Zhang, X. Charging Navigation Strategy for Electric Vehicles Considering Empty-Loading Ratio and Dynamic Electricity Price. Sustain. Energy Grids Netw. 2023, 34, 100987. [Google Scholar] [CrossRef]
  8. Chis, A.; Lunden, J.; Koivunen, V. Reinforcement Learning-Based Plug-in Electric Vehicle Charging with Forecasted Price. IEEE Trans. Veh. Technol. 2017, 66, 3674–3684. [Google Scholar] [CrossRef]
  9. Contreras-Ocana, J.E.; Sarker, M.R.; Ortega-Vazquez, M.A. Decentralized Coordination of a Building Manager and an Electric Vehicle Aggregator. IEEE Trans. Smart Grid 2016, 9, 2625–2637. [Google Scholar] [CrossRef]
  10. Cupelli, M.; Ponci, F.; Sulligoi, G.; Vicenzutti, A.; Edrington, C.S.; El-Mezyani, T.; Monti, A. Power Flow Control and Network Stability in an All-Electric Ship. Proc. IEEE 2015, 103, 2355–2380. [Google Scholar] [CrossRef]
  11. Doerry, N.; Amy, J.; Krolick, C. History and the Status of Electric Ship Propulsion, Integrated Power Systems, and Future Trends in the U.S. Navy. Proc. IEEE 2015, 103, 2243–2251. [Google Scholar] [CrossRef]
  12. Iversen, E.B.; Moller, J.K.; Morales, J.M.; Madsen, H. Inhomogeneous Markov Models for Describing Driving Patterns. IEEE Trans. Smart Grid 2013, 8, 581–588. [Google Scholar] [CrossRef]
  13. Nunna, H.S.V.S.K.; Battula, S.; Doolla, S.; Srinivasan, D. Energy Management in Smart Distribution Systems with Vehicle-to-Grid Integrated Microgrids. IEEE Trans. Smart Grid 2016, 9, 4004–4016. [Google Scholar] [CrossRef]
  14. Zhao, Z.; Lee, C.K.M.; Yan, X.; Wang, H. Reinforcement learning for electric vehicle charging scheduling: A systematic review. Transp. Res. Part E Logist. Transp. Rev. 2024, 190, 103698. [Google Scholar] [CrossRef]
  15. An, D.; Cui, F.; Kang, X. Optimal scheduling for charging and discharging of electric vehicles based on deep reinforcement learning. Front. Energy Res. 2023, 11, 1273820. [Google Scholar] [CrossRef]
  16. Kamrani, A.S.; Dini, A.; Dagdougui, H.; Sheshyekani, K. Multi-agent deep reinforcement learning with online and fair optimal dispatch of EV aggregators. Mach. Learn. Appl. 2025, 19, 100620. [Google Scholar] [CrossRef]
  17. Chen, G.; Yang, L.; Cao, X. A deep reinforcement learning-based charging scheduling approach with augmented Lagrangian for electric vehicles. Appl. Energy 2025, 378, 124706. [Google Scholar] [CrossRef]
  18. Kumar, P.; Channi, H.K.; Kumar, R.; Rajiv, A.; Kumari, B.; Singh, G.; Singh, S.; Dyab, I.F.; Lozanović, J. A comprehensive review of vehicle-to-grid integration in electric vehicles: Powering the future. Energy Convers. Manag. X 2025, 25, 100864. [Google Scholar] [CrossRef]
  19. Al-Shehari, T.; Kadrie, M.; Alfakih, T.; Alsalman, H.; Kuntavai, T.; Vidhya, R.G.; Dhanamjayulu, C.; Shukla, S.; Khan, B. Blockchain with secure data transactions and energy trading model over the internet of electric vehicles. Sci. Rep. 2024, 14, 19208. [Google Scholar] [CrossRef]
  20. Wang, S.M. On several issues of reservation services. Syst. Eng. Theory Pract. 1995, 15, 32–37. [Google Scholar]
  21. Johari, M.; Keyvan-Ekbatani, M.; Leclercq, L.; Ngoduy, D.; Mahmassani, H.S. Macroscopic network-level traffic models: Bridging fifty years of development toward the next era. Transp. Res. Part C Emerg. Technol. 2021, 131, 103334. [Google Scholar] [CrossRef]
  22. Yu, B.; Jin, P.H.; Yang, Z.Z. A two-phase heuristic algorithm for solving the multi-depot vehicle routing problem with time windows. Syst. Eng. Theory Pract. 2012, 32, 1793–1800. [Google Scholar]
  23. Li, Z.; Lei, D.Y. Optimization model and algorithm for multi-depot vehicle scheduling. J. Transp. Eng. 2004, 4, 83–86. [Google Scholar]
  24. Li, M.; Guo, Q.; Liu, H.L. Research on logistics distribution problem with multiple depots and multiple distribution centers. Comput. Eng. Appl. 2007, 43, 202–208. [Google Scholar]
  25. Li, X.Y.; Tian, P. Vehicle routing problem with time windows and stochastic times: Model and algorithm. Syst. Eng. Theory Pract. 2009, 29, 81–91. [Google Scholar]
  26. Ding, Q.L.; Hu, X.P.; Li, Y.X. Hybrid ant colony algorithm for solving vehicle routing problem with time windows. Syst. Eng. Theory Pract. 2007, 27, 98–104. [Google Scholar]
  27. Shihong, X.; Hongzhi, Z.; Dong, S.; Xiusheng, G.; Xiangning, L.; Zhengtian, L.; Hui, H.; Shu, S.; Quan, S.; Zhixun, W. Pricing Strategy for Fast-Charging Load in Smart Cities. In Proceedings of the Chinese Society for Electrical Engineering, Shanghai, China, 27–29 October 2020; Volume 40, pp. 3187–3201. [Google Scholar]
  28. Hongming, Y.; Ming, L.; Fushuan, W.; Youjun, D.; Qing, Q.; Junhua, Z. Electric Vehicle Path Selection and Charging Navigation Strategy Based on Real-Time Traffic Information Perception. Autom. Electr. Power Syst. 2017, 41, 106–113. [Google Scholar]
  29. Shu, S.; Jinwen, S.; Xiangning, L.; Xianshan, L. Intelligent Charging Navigation for Electric Vehicles. Proc. China Electrotech. Soc. 2013, 33, 59–67. [Google Scholar]
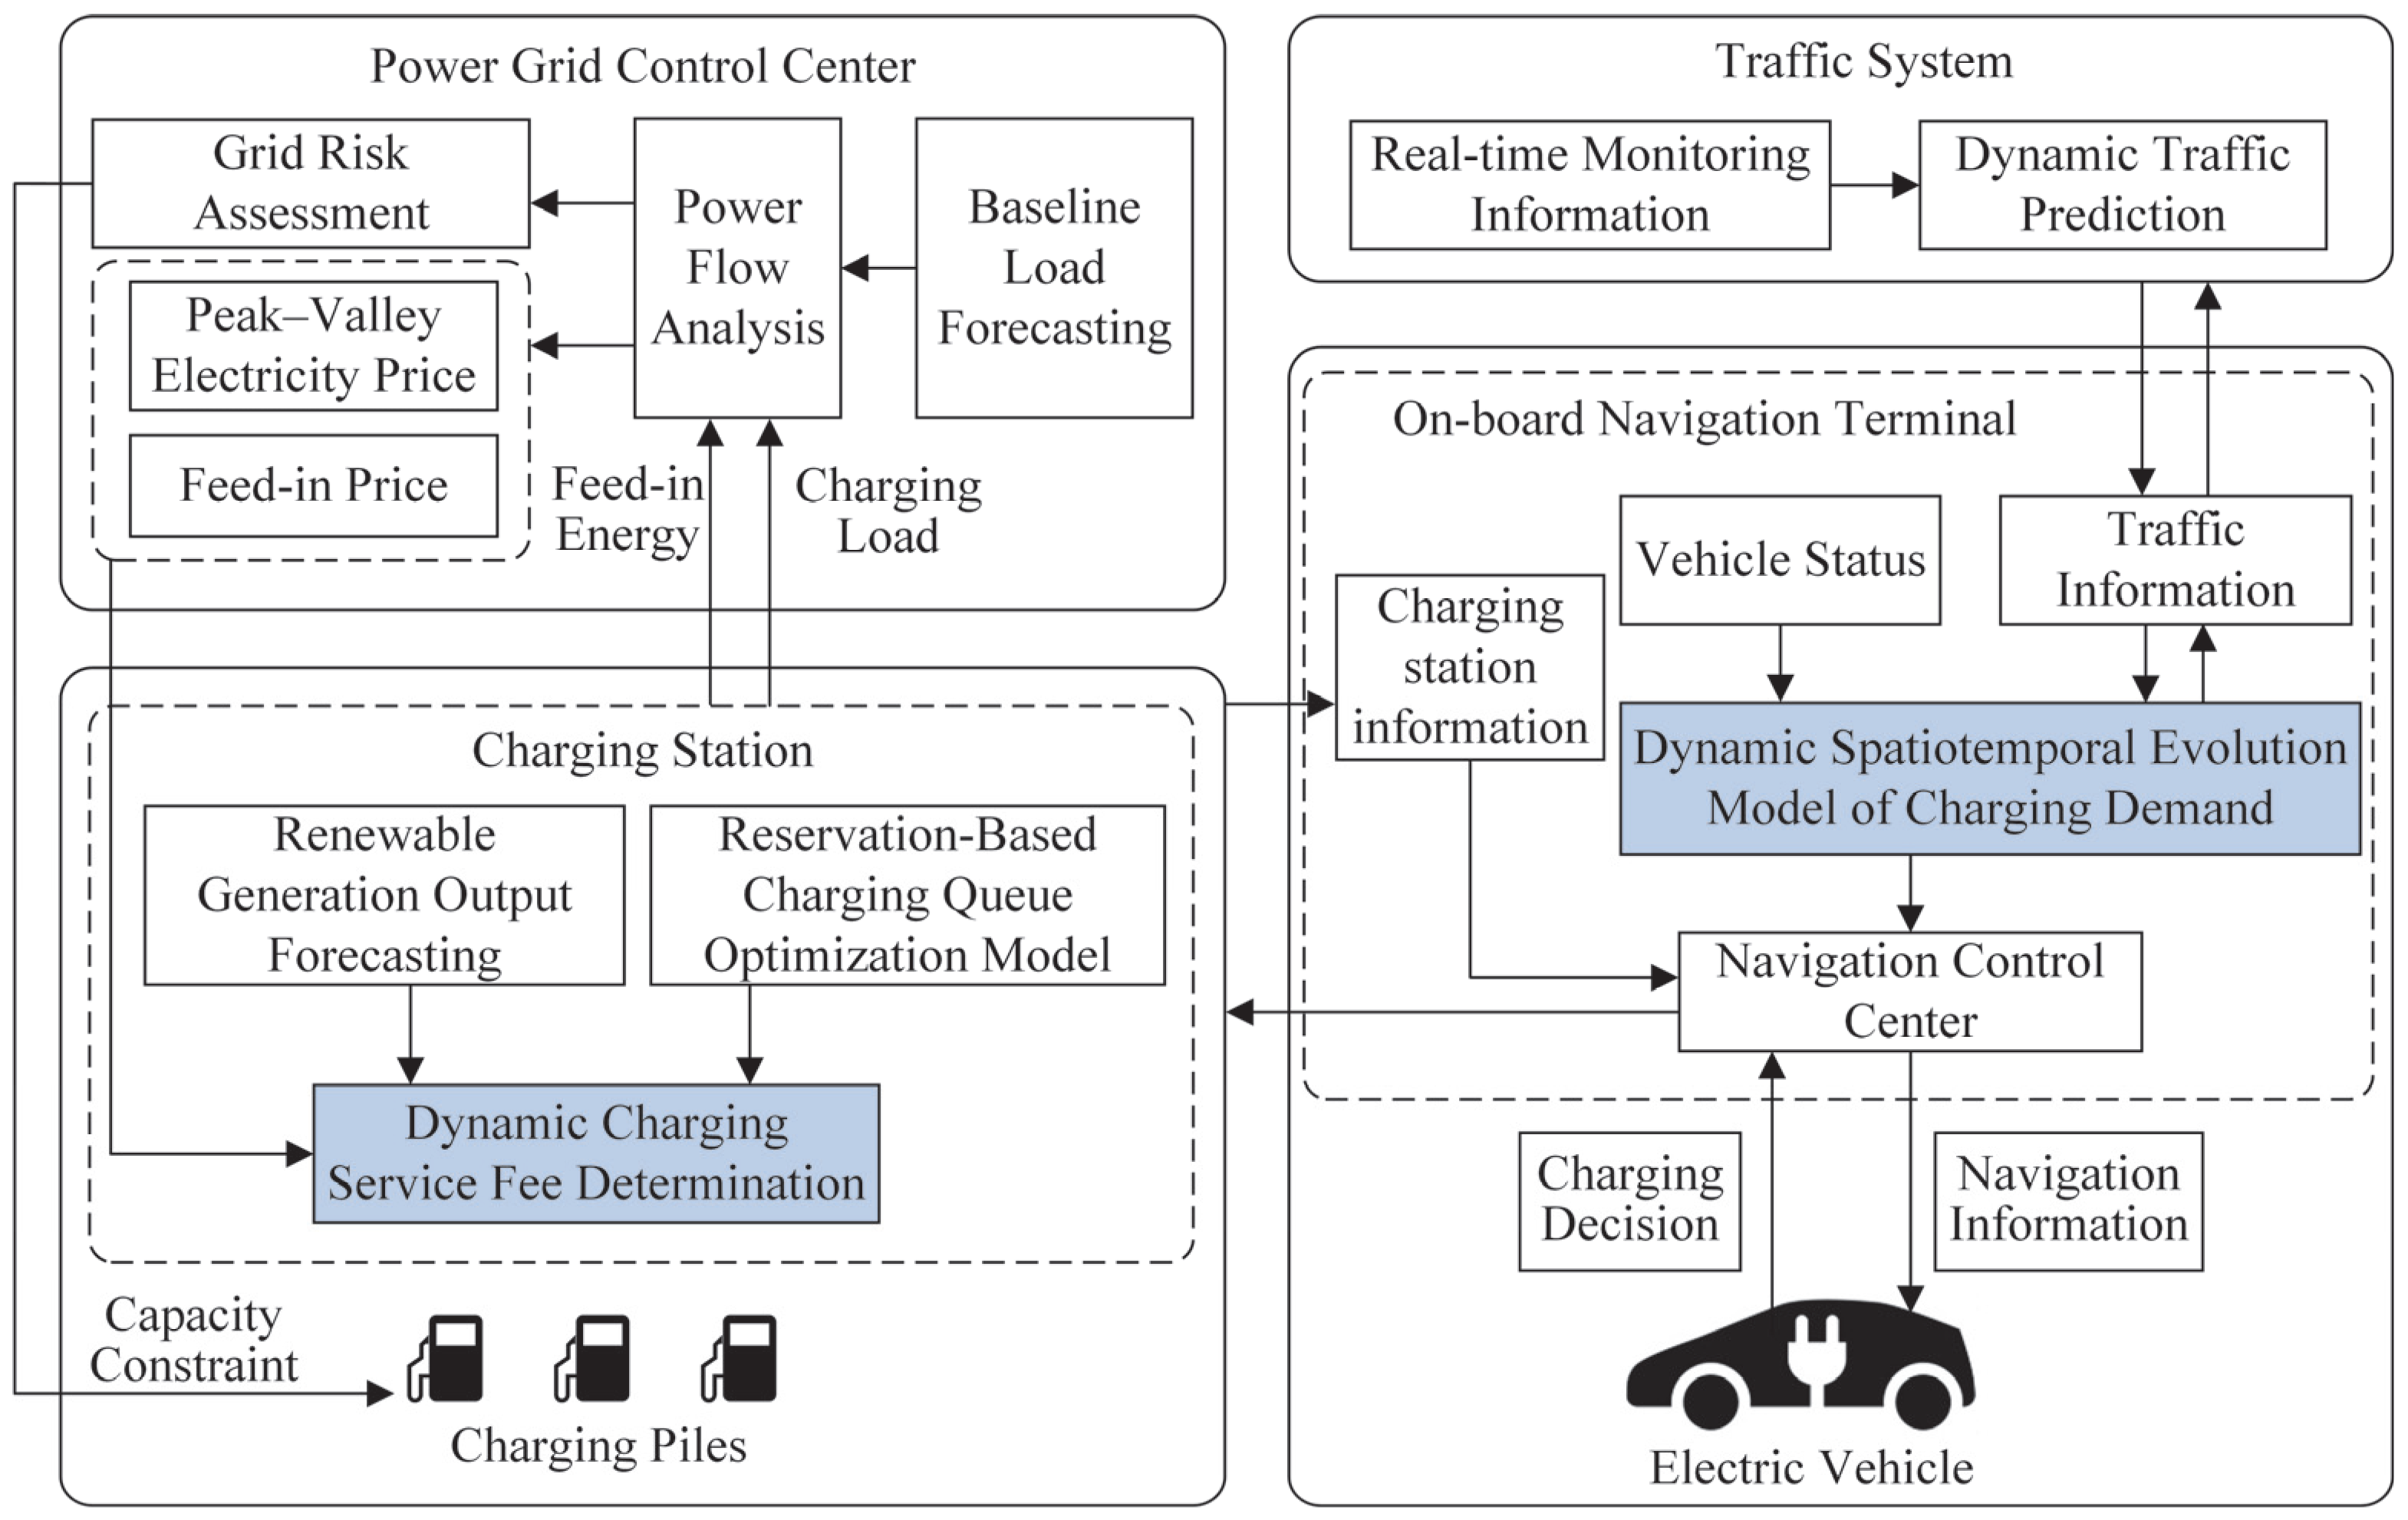
Figure 1. Intelligent charging navigation architecture.
Smartcities 08 00178 g001
Figure 2. Reservation charging service system.
Smartcities 08 00178 g002
Figure 3. Time varying rolling time domain mechanism for determining flow charts.
Smartcities 08 00178 g003
Figure 4. Dynamic processing of time axis.
Smartcities 08 00178 g004
Figure 5. Schematic diagram of charging pile status in charging station in dynamic dispatch model.
Smartcities 08 00178 g005
Figure 6. Starting time of electric vehicle charging under two modes.
Smartcities 08 00178 g006
Figure 7. Average charging price of electric vehicles under two modes.
Smartcities 08 00178 g007
Figure 8. Two modes of queuing/empty window time for electric vehicles.
Smartcities 08 00178 g008
Figure 9. Three kinds of users with different decisions of charging under navigation.
Smartcities 08 00178 g009
Figure 10. Charging mode occupancy status of charging station A under two modes.
Smartcities 08 00178 g010
Figure 11. Charging mode occupancy status of charging station B under two modes.
Smartcities 08 00178 g011
Figure 12. VDINI index change in distribution network under two modes.
Smartcities 08 00178 g012
Figure 13. Comparison of user queuing time distributions under the two methods.
Smartcities 08 00178 g013
Figure 14. Comparison of average charging prices under the two methods.
Smartcities 08 00178 g014
Figure 15. Comparison of VDINI indices of the distribution network under the two methods.
Smartcities 08 00178 g015
Table 1. Member integration response index.
Variable SymbolDefinitionUnit
i Expected duration of a single charging sessionh
x 1 Total number of reservation requeststimes
x 2 Number of failed reservation acceptancestimes
x 3 Number of on-time arrivalstimes
x 4 Number of late arrivalstimes
x 5 Number of no-showstimes
Disclaimer/Publisher’s Note: The statements, opinions and data contained in all publications are solely those of the individual author(s) and contributor(s) and not of MDPI and/or the editor(s). MDPI and/or the editor(s) disclaim responsibility for any injury to people or property resulting from any ideas, methods, instructions or products referred to in the content.