1. Introduction
Libraries, museums, stadiums, and art performance museums are the symbol of a country’s civilization and degree of social progress, and a reflection of the comprehensive strength of science and technology, humanities, and resources of a city and the region it represents. The smart museum system is based on a 4G/5G or WIFI network environment, through big data, AI, cloud computing, Internet of Things and other technologies to achieve the exchange of information between the museum, the user and the administrator, the use of data visualization and artificial intelligence and other technologies to process the data, scientific prediction of the museum’s late trend of traffic, the personalized recommendation of the museum’s use of the needs of the museum, and ultimately to achieve the museum’s autonomy decision-making and the integrated control system of the museum’s autonomous decision-making and operational capabilities [
1]. Compared with the traditional “exhibition board + physical objects” mode, the intelligent digital exhibition hall has realized three major leaps: virtual symbiosis, through the digital twin technology, will be the physical space and virtual scene real-time mapping—for example, the museum uses the high-precision 3D modeling “resurrection” of cultural relics details, and the audience can observe the bronze artifacts in 360° [
2]. Spatial awareness is the use of sensor networks to monitor the density of human flow, environmental parameters, automatically adjust the brightness of the lights and air conditioning wind speed, to achieve the intelligent management of space [
3]. Cognitive upgrading is the use of VR/AR technology to break the time and space limitations, for example, the audience can “travel” to the ancient battlefield or the future of the city, through the haptic feedback device to feel the real environment [
4].
While smart museums are often discussed in terms of technological innovation, they are equally significant as platforms for advancing sustainability goals. Museums of all kinds are not only cultural and educational institutions but also major consumers of energy, with substantial implications for carbon emissions. This technological transformation intersects directly with the global low-carbon agenda: advanced environmental monitoring and automated control systems—core to smart museum operations—have the potential to significantly reduce the carbon footprint of the sector. According to the Arts Council of the United Kingdom, museums accounted for 24% of the total carbon footprint of all cultural institutions in the UK in 2019–2020, ranking highest among individual categories [
5]. This figure underscores both the environmental impact of museums and their responsibility to lead in green development. Carbon emissions primarily stem from energy-intensive operations such as exhibition lighting, climate control, and ventilation systems—requirements that are especially stringent in large-scale facilities like the National Museum of China, where temperature and humidity standards for conservation drive high energy consumption [
6]. As global commitments to carbon peaking and neutrality intensify, the International Council of Museums (ICOM) 2025 has emphasized that museums must evolve from their traditional roles of heritage preservation, knowledge dissemination, and education provision to multidimensional engines of social innovation—encompassing social inclusion, community building, economic promotion, and, critically, the transition to green buildings and public spaces [
7]. Positioned at the intersection of cultural stewardship and sustainable technology, green smart museums are thus emerging as a strategic focus for policy, industry, and society.
Although intelligent management has been gradually promoted in the field of museums in recent years, the traditional venue system still faces obvious shortcomings in terms of energy consumption monitoring, carbon emission control, and green energy utilization. Most of the existing museum energy data collection and management tools are relatively decentralized, lack dynamic tracking of the whole process of energy use, resulting in limited space for energy efficiency improvement [
8]. In addition, the green energy system often operates independently and has not yet realized the deep integration with intelligent management platforms such as digital twins and artificial intelligence, making it difficult to support energy–carbon synergistic optimization in complex scenarios. In the actual operation process, museums not only need to ensure the efficient and safe operation of facilities, but also need to take into account the control of energy consumption, carbon emission management, audience experience optimization and science education, and other multiple goals, which puts forward higher requirements for the flexibility of the system integration and synergy of technical solutions [
9]. Therefore, how to break through the technical barriers of the deep integration of intelligent management and green energy and build a comprehensive solution to support the multi-dimensional operational needs has become a realistic challenge to be solved to promote the green and intelligent transformation of museums.
Therefore, the core technical problem lies in the persistent fragmentation of current museum management systems, where energy monitoring, carbon emission control, and green energy operation remain largely decoupled from advanced intelligent management tools such as digital twins and AI-based optimization engines. This lack of deep integration hinders real-time decision-making and adaptive energy–carbon optimization in large-scale, multi-functional museum environments. Scientifically, the literature still lacks a unified, scalable framework that combines digital twin modeling, AI-driven operational intelligence, and renewable energy systems into a closed-loop, data-driven platform. Addressing this gap is essential to move beyond isolated technology pilots toward a comprehensive solution capable of delivering both operational efficiency and sustainability outcomes.
Against this backdrop, the green smart museum emerges as an innovative model that integrates the principles of green development with advanced digital and intelligent technologies [
10]. It is envisioned as a dynamic, interactive space underpinned by IoT, AI, and digital twin technologies, enabling intelligent operation and personalized services. Its core ambition is to transcend physical space constraints, achieve multidimensional information transmission, and facilitate deep audience engagement through the fusion of physical reality and data-driven interaction.
Under the joint promotion of green low-carbon development and intelligent transformation, how museums can realize the deep integration of artificial intelligence, digital twin, and the green energy system has become a cutting-edge scientific problem that is currently the concern of the academia and the industry. For example, an AI agent-based digital twin framework for building energy simulation has been developed [
11]; the application of digital twins in sustainable heritage management has been demonstrated [
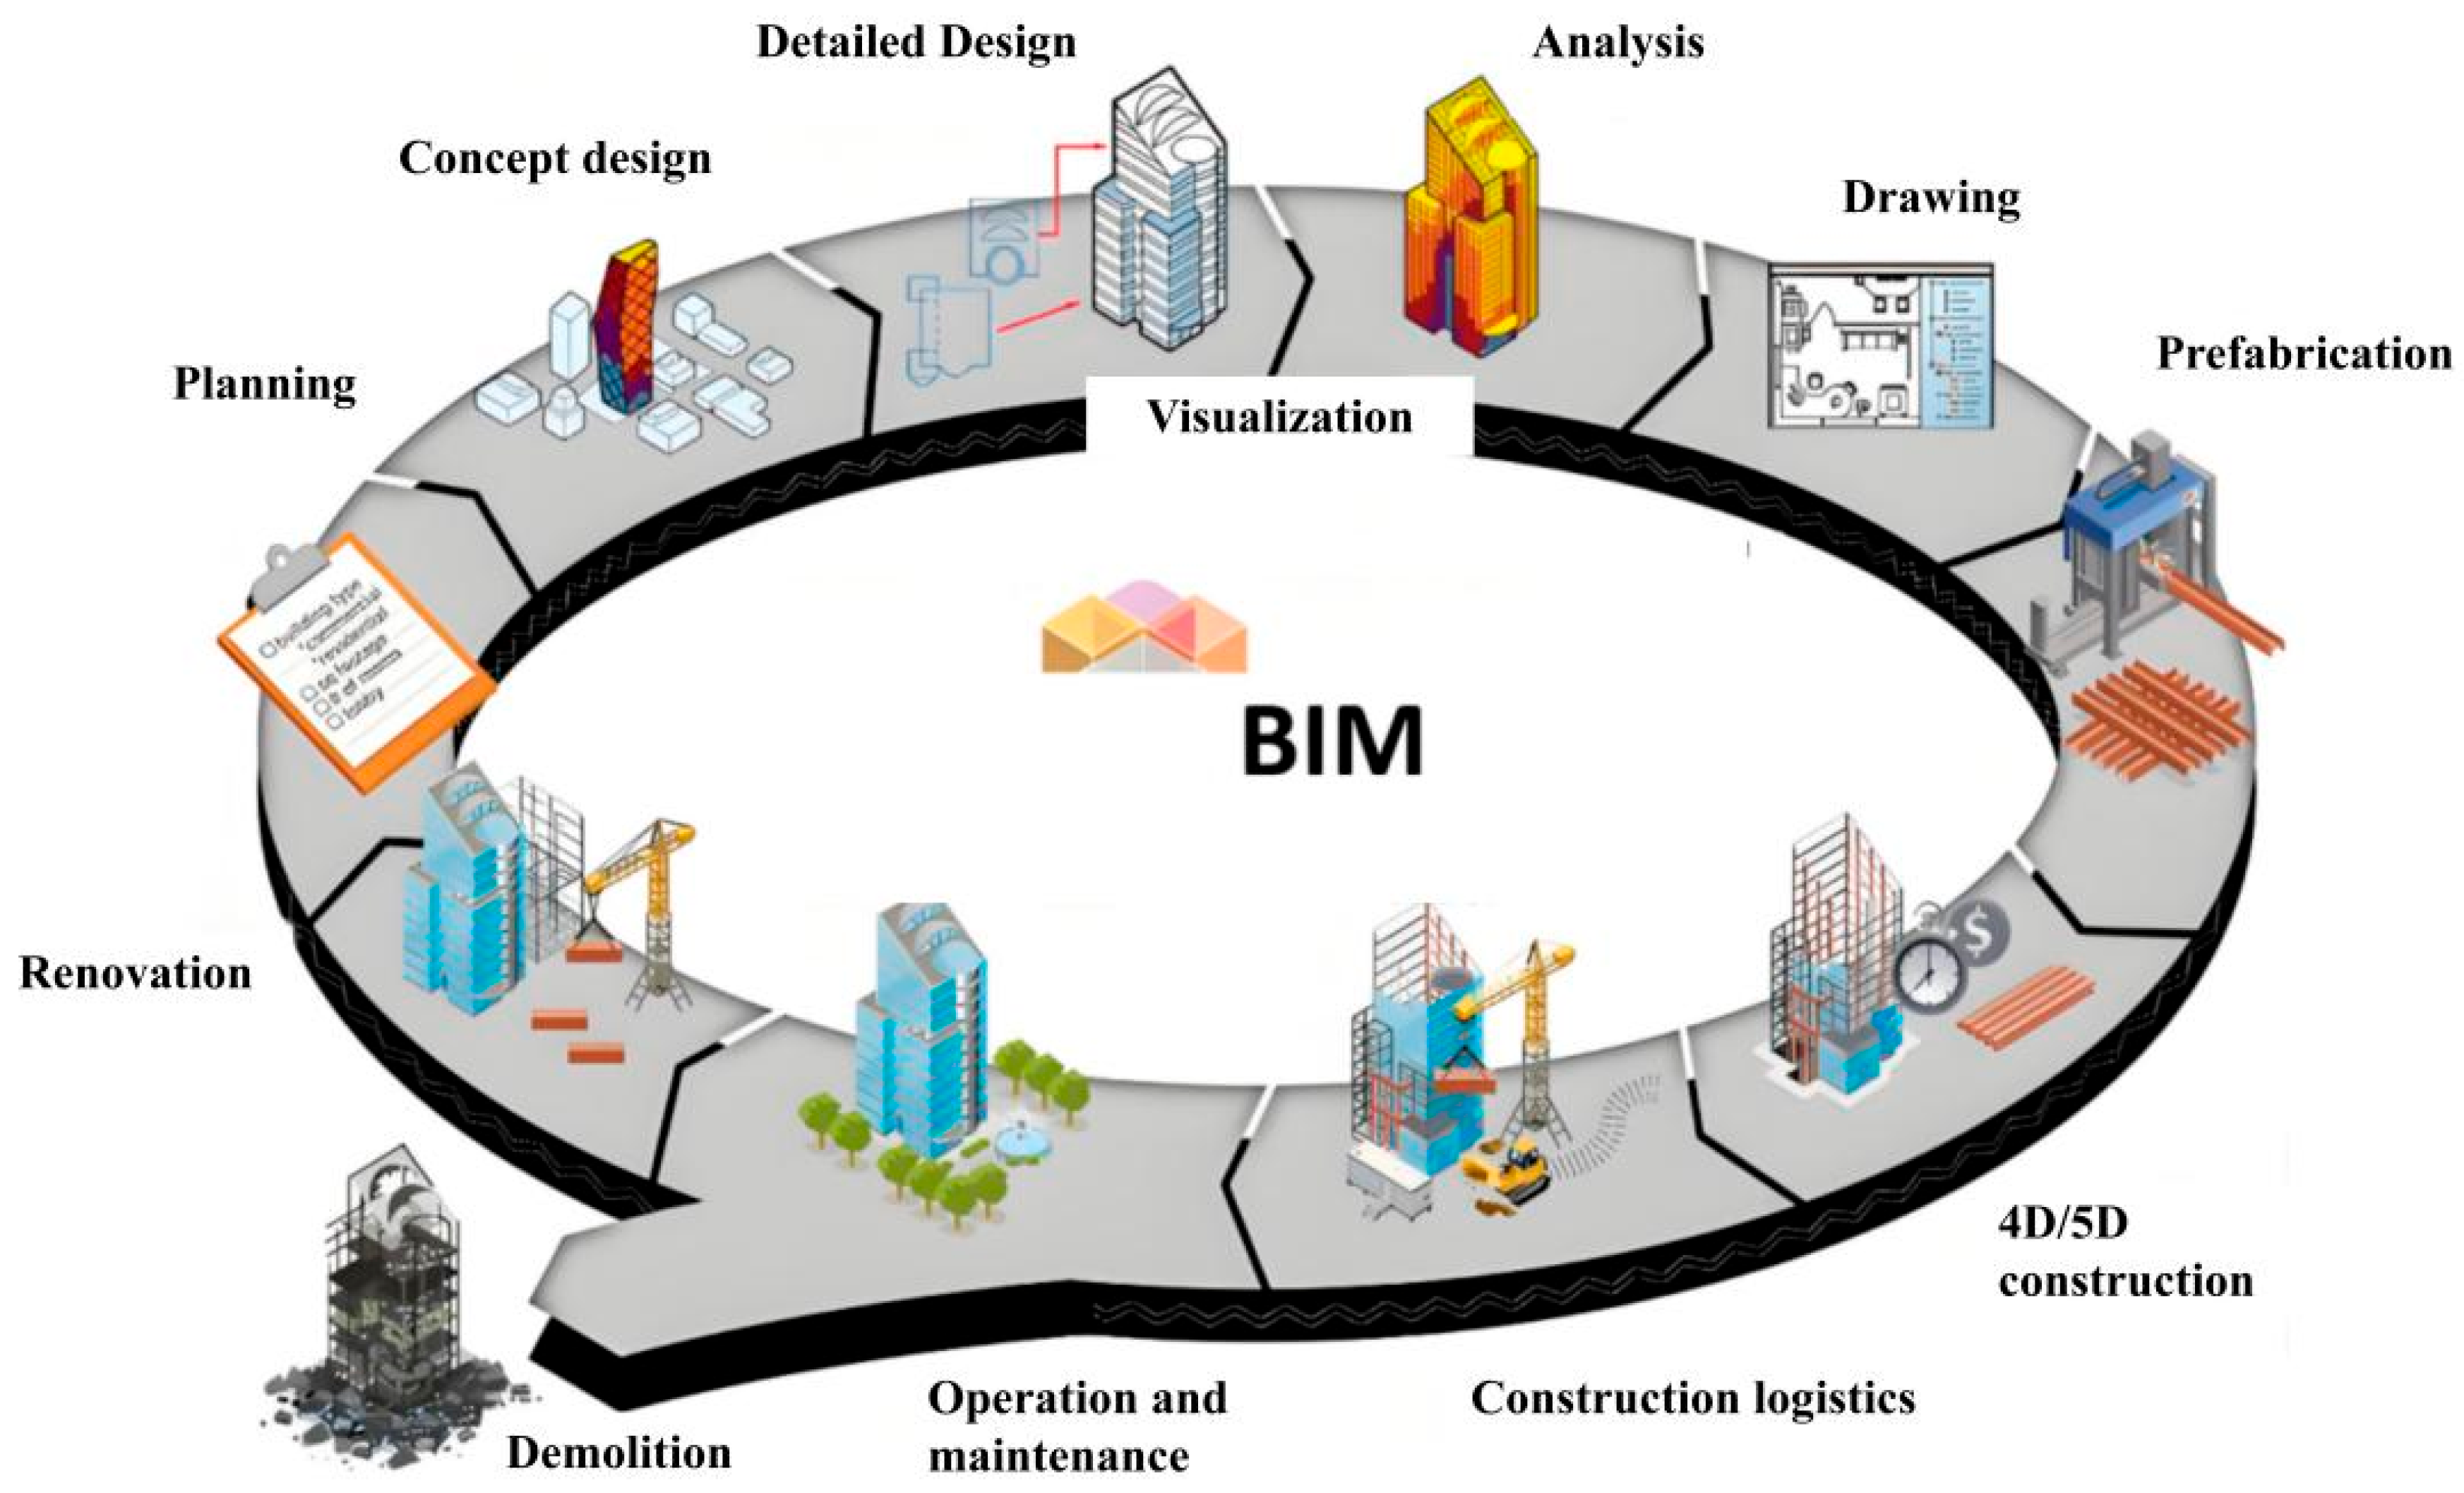
12]; a comprehensive review of BIM (Building Information Modeling) and digital twins in green building lifecycle management has also been provided [
13]. However, most existing studies are limited to either single-technology applications, small-scale pilot cases, or lack the comprehensive integration of AI, digital twin, and green energy systems. Systematic empirical evidence on how to realize the synergistic optimization and closed-loop management of energy and carbon in complex, large-scale public cultural spaces remains scarce.
Therefore, this study aims to develop and empirically validate a unified platform that integrates multi-source sensing, three-dimensional digital twin modeling, AI-driven optimization, and renewable energy coordination, forming a “trinity” solution for green smart museum management. This approach enables real-time, full-process monitoring and optimization of energy use and carbon emissions while supporting adaptive operation and dynamic public engagement. The main contributions of this study are as follows:
- (i)
This study proposes a novel integrated management framework that synergistically combines digital twin technology, artificial intelligence, and green energy systems to address the complex requirements of sustainable smart museums.
- (ii)
A full-cycle, data-driven optimization methodology is developed, incorporating real-time energy forecasting, carbon emission analysis, and intelligent scheduling algorithms to enhance operational efficiency and drive carbon reduction.
- (iii)
Comparative case studies are conducted across three representative Chinese museums, each exemplifying a distinct integration pathway, and are benchmarked against leading international projects. This approach provides robust, multi-dimensional evidence of the framework’s effectiveness, adaptability, and generalizability.
- (iv)
A scalable empirical reference model is established, offering practical guidance and a replicable blueprint for the digital and green transformation of public cultural buildings, with broader implications for sustainable urban development and carbon neutrality goals.
2. Methodology
This study proposes an integrated framework for green smart museums that combines theoretical abstraction with practical system design, uniting digital twin modeling, artificial intelligence, and multi-energy system coordination. The core objective is to enable the dynamic, low-carbon, and intelligent management of spatial, energy, and operational processes in large-scale public cultural venues.
2.1. Integrated Theoretical Framework and System Architecture for Green Smart Museums
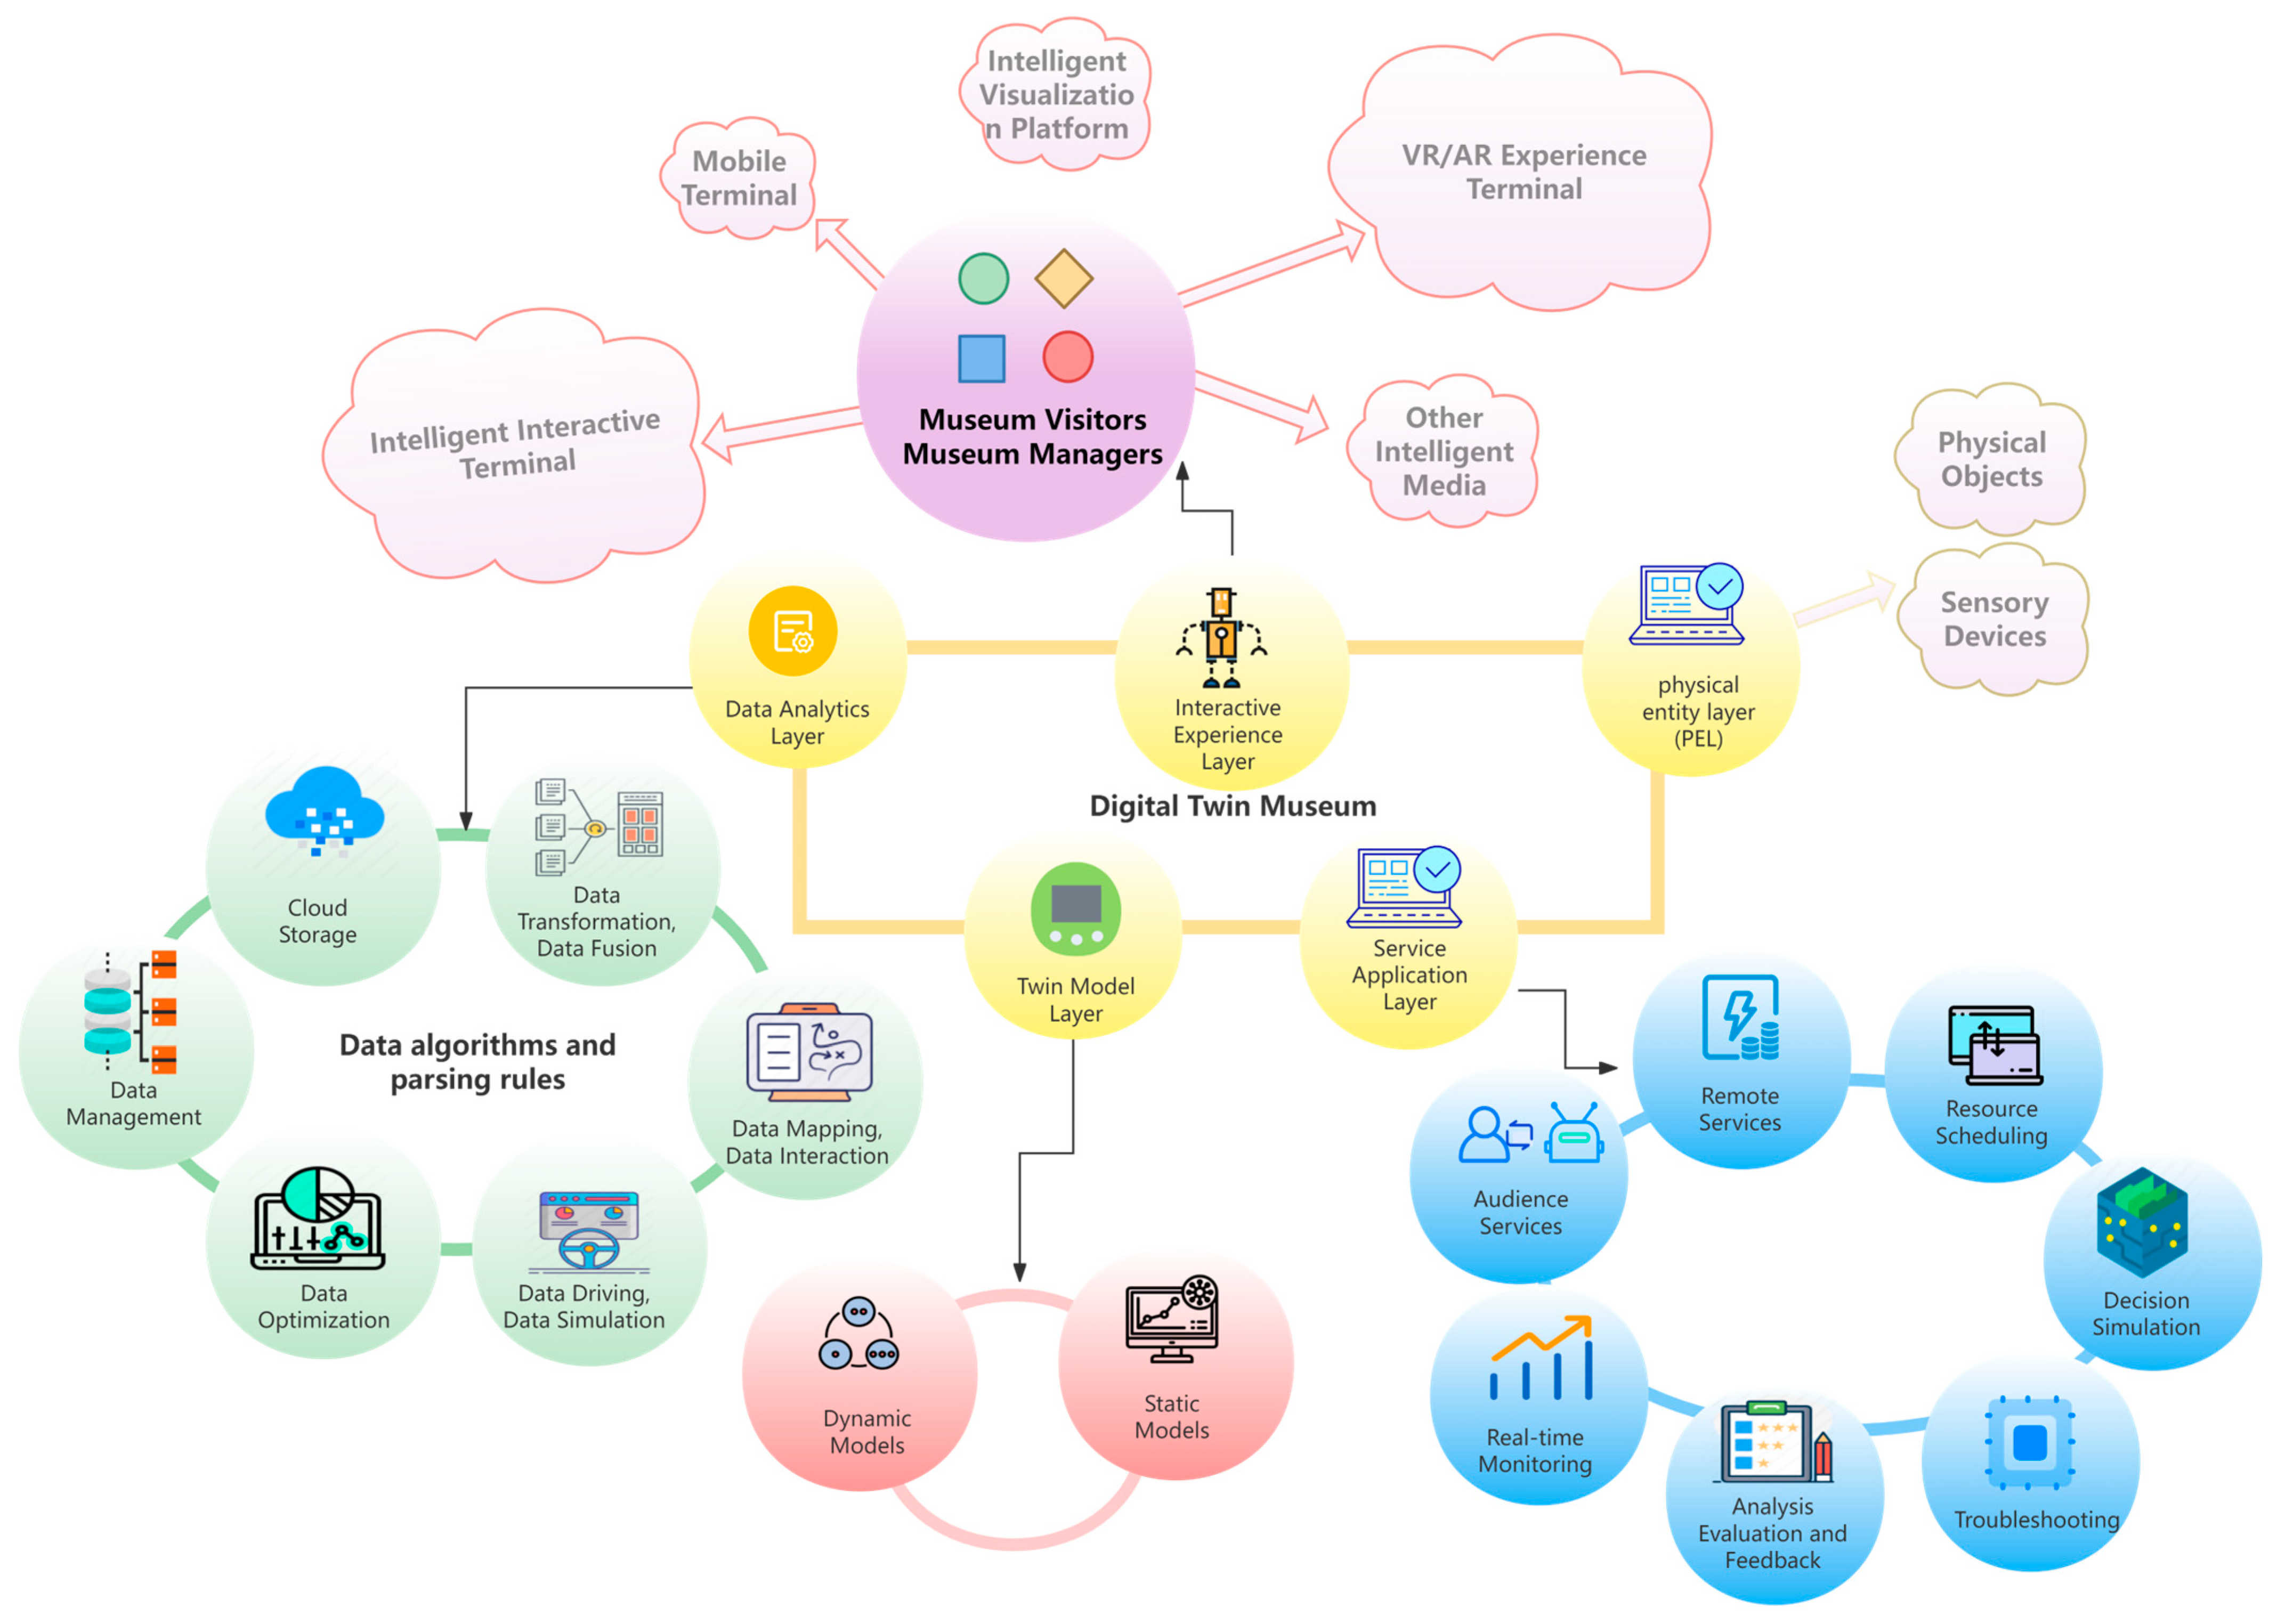
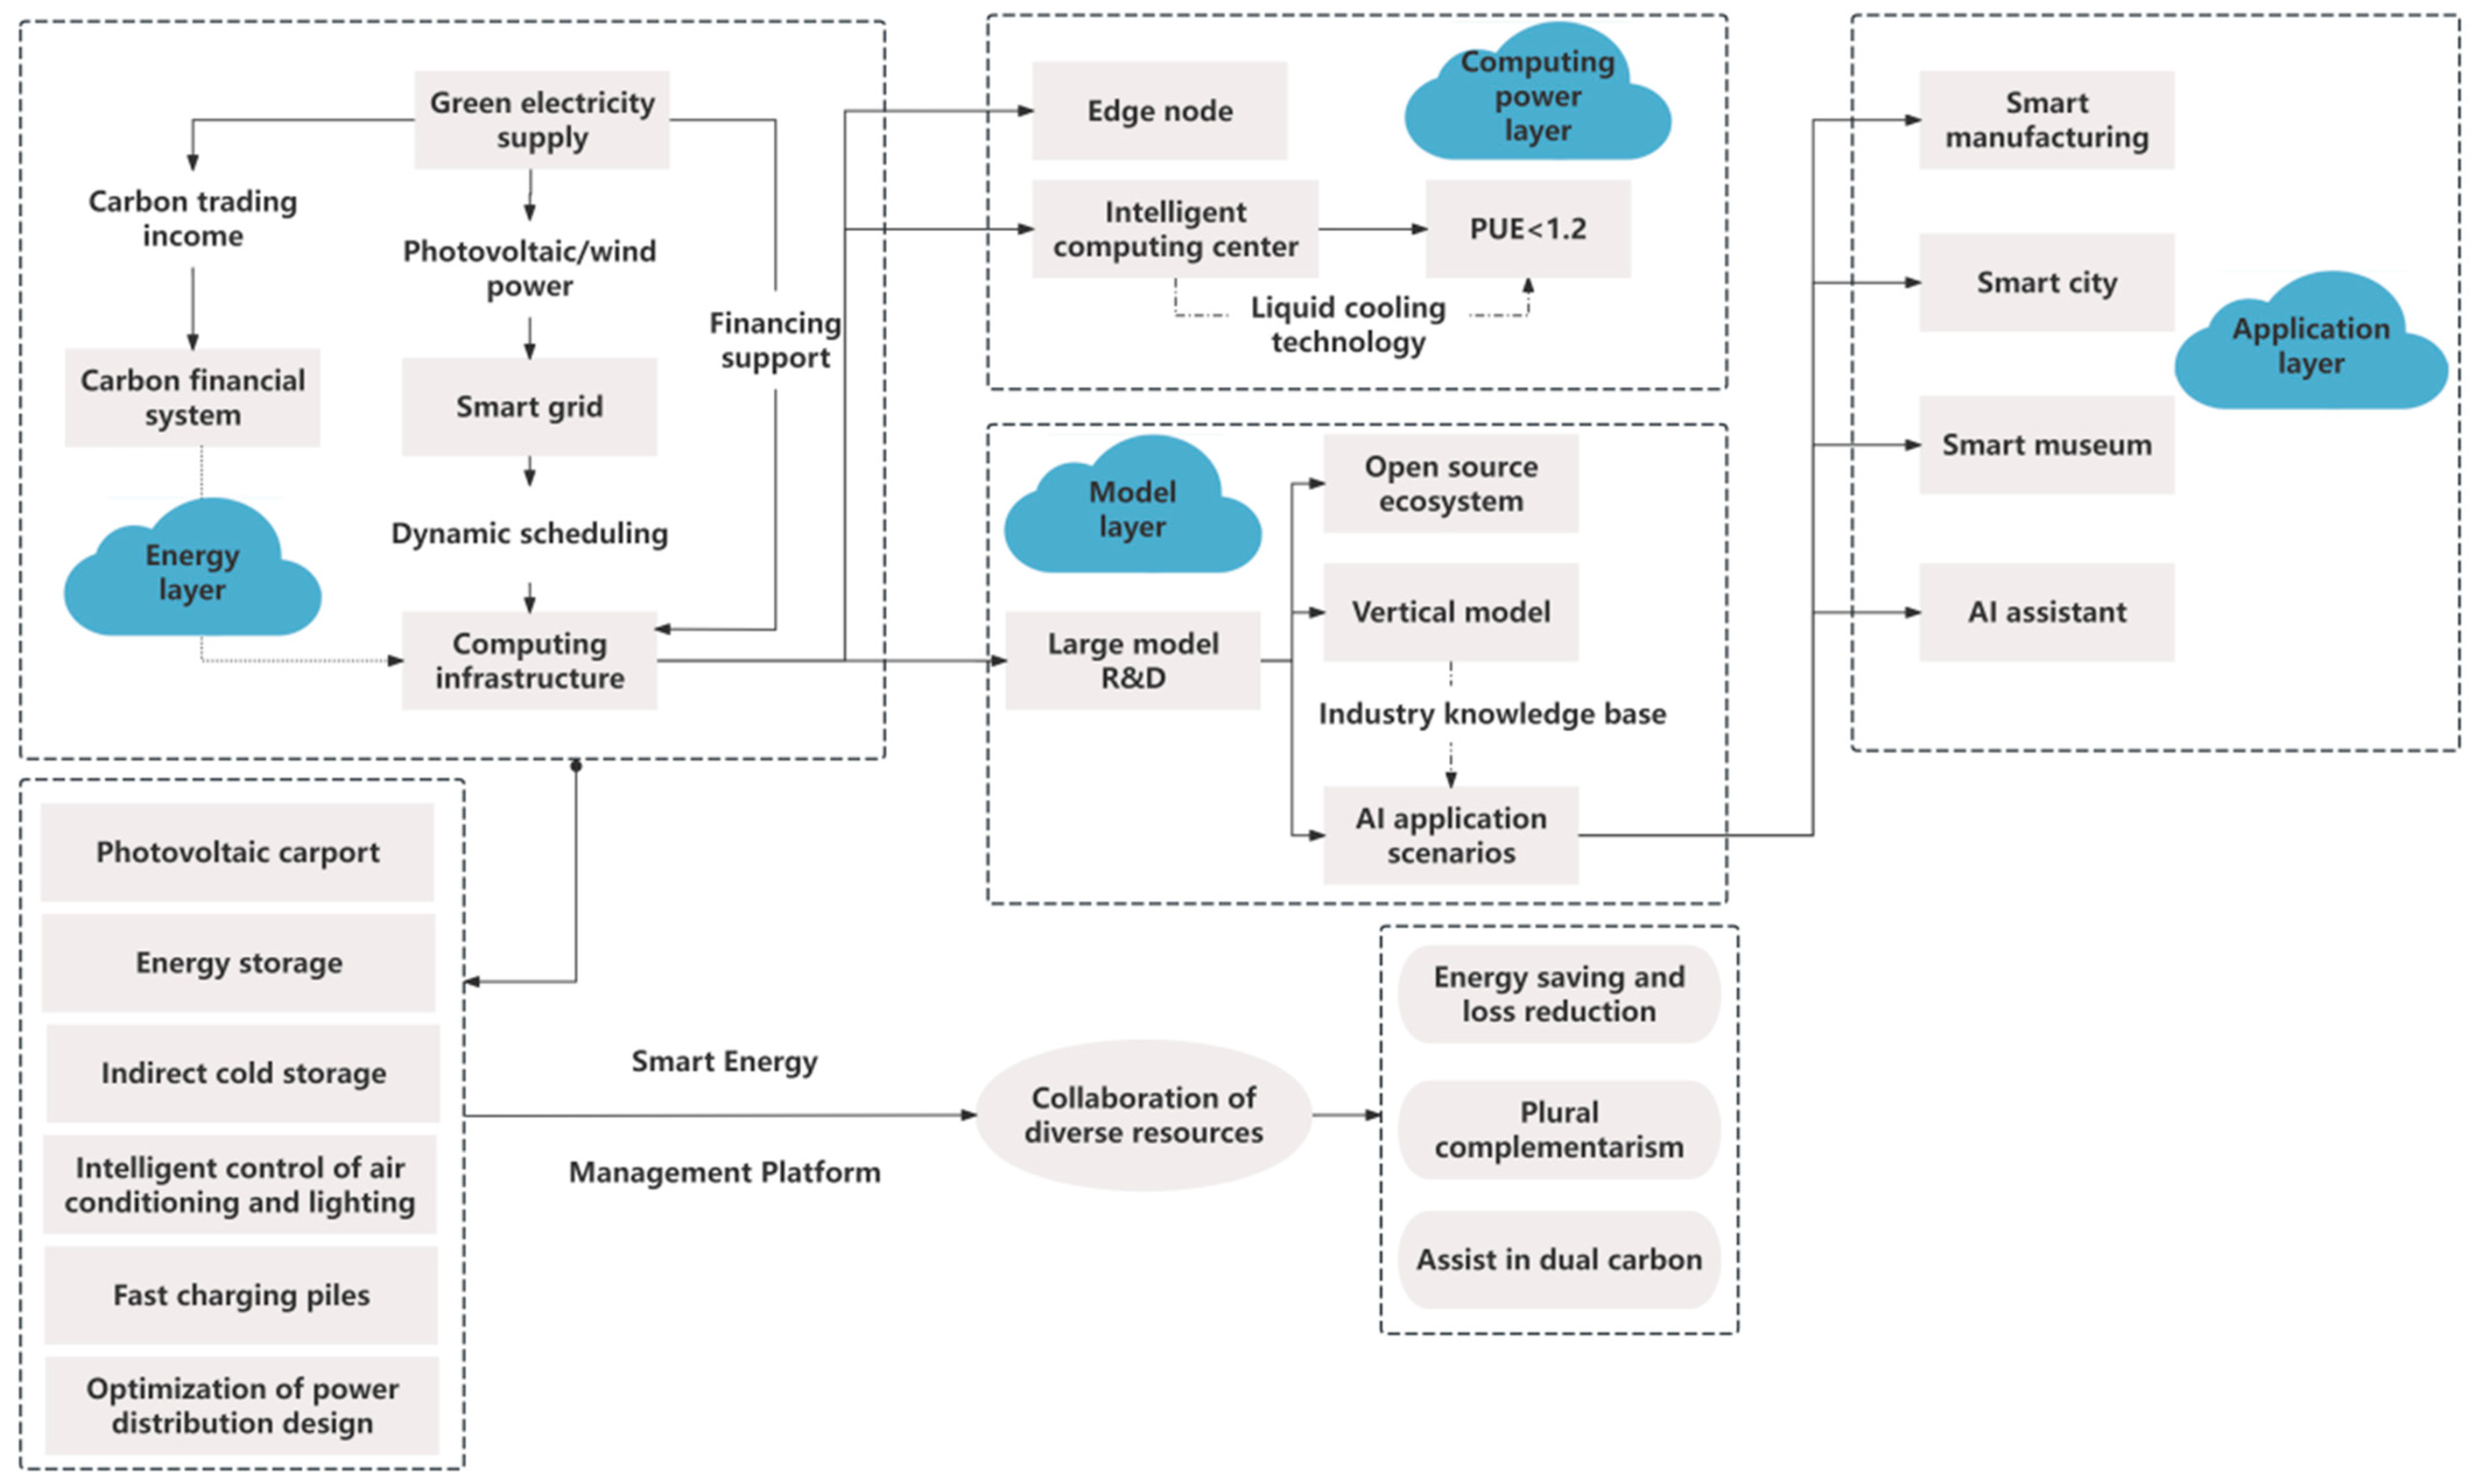
The theoretical model emphasizes the synergistic interplay between the physical museum, digital twin, data analytics, and intelligent services, forming a closed-loop information chain that supports real-time monitoring, predictive optimization, and adaptive feedback [
14]. The fundamental relationships can be abstracted as follows (
Figure 1):
where
SDT(
t) is the state of the digital twin at time
t,
SPhy(
t) is the physical entity state,
DIoT(
t) is the multi-source data stream, and
θ represents the set of system parameters ensuring mapping fidelity.
The core framework consists of the following layers:
- (1)
Physical Entity Layer: A dense array of IoT sensors (temperature, humidity, lighting, CO
2, energy meters, crowd counters) is deployed across the building, galleries, and storage. Real-time data are collected, pre-processed by edge nodes, and transmitted to the cloud or local server [
15].
- (2)
Digital Twin Layer: High-fidelity, real-time digital models of spatial geometry, equipment, energy flow, and environmental conditions are built using BIM, point cloud scanning, and dynamic data integration [
16].
where
G(2) is the modeling function and
P(2) the parameter set.
- (3)
Data Analysis Layer: Real-time and historical data are processed and fused for simulation, optimization, and visualization. Multi-source data fusion is formalized as
where
H is the fusion operator for environmental, energy, and occupancy streams.
- (4)
AI-Driven Optimization Layer: Predictive and prescriptive models (deep learning, multi-objective optimization) drive the intelligent scheduling of energy, environmental parameters, and equipment operations, subject to system constraints [
17].
where
Et−1, …,
Et−n are historical energy consumption values and
Xt−1, …,
Xt−n are exogenous operational and environmental variables;
J is the multi-objective cost function;
α and
β are non-negative weight coefficients for the energy and carbon objectives, respectively;
Et,
Ct are the actual energy consumption and carbon emissions at time
t;
A(3)(
t) denotes the set of optimal operational actions at time
t;
D(2)(
t) is the real-time digital twin input; and
C is the set of operational and system constraints.
- (5)
Service and Interactive Experience Layer: Visual dashboards, digital exhibits, personalized recommendations, and immersive experiences are delivered to both managers and visitors, creating a bidirectional feedback loop for continuous improvement [
18].
S(4) is the service and interactive experience state at time t;
G(4) denotes the service generation function;
A(3)(
t) is the set of actions or optimization outputs from the intelligent control layer at time
t; and
U(t) represents user feedback or real-time interaction data.
2.2. System Architecture and Functional Modules
In 2003, Prof. Grieves of the University of Michigan initially proposed the idea of digital twins in a course on total product lifecycle management. It was not until 2010 that the term “digital twin” was formalized in a NASA technical report and defined as “a system or vehicle simulation process that integrates multi-physics, multi-scale, and multi-probability” [
19]. Since then, digital twin technology has attracted widespread attention. In 2016, Goldner Consulting, the world’s most authoritative IT research and consulting firm, listed digital twins as one of the top ten strategic technology trends. By digitizing all elements of the physical world, such as people, things, and objects, digital twins recreate a corresponding “virtual world” in cyberspace, forming a pattern of symbiosis between the physical world in the physical dimension and the digital world in the information dimension, where the real and the virtual are intertwined [
20].
2.2.1. High-Precision Spatial and Equipment Modeling
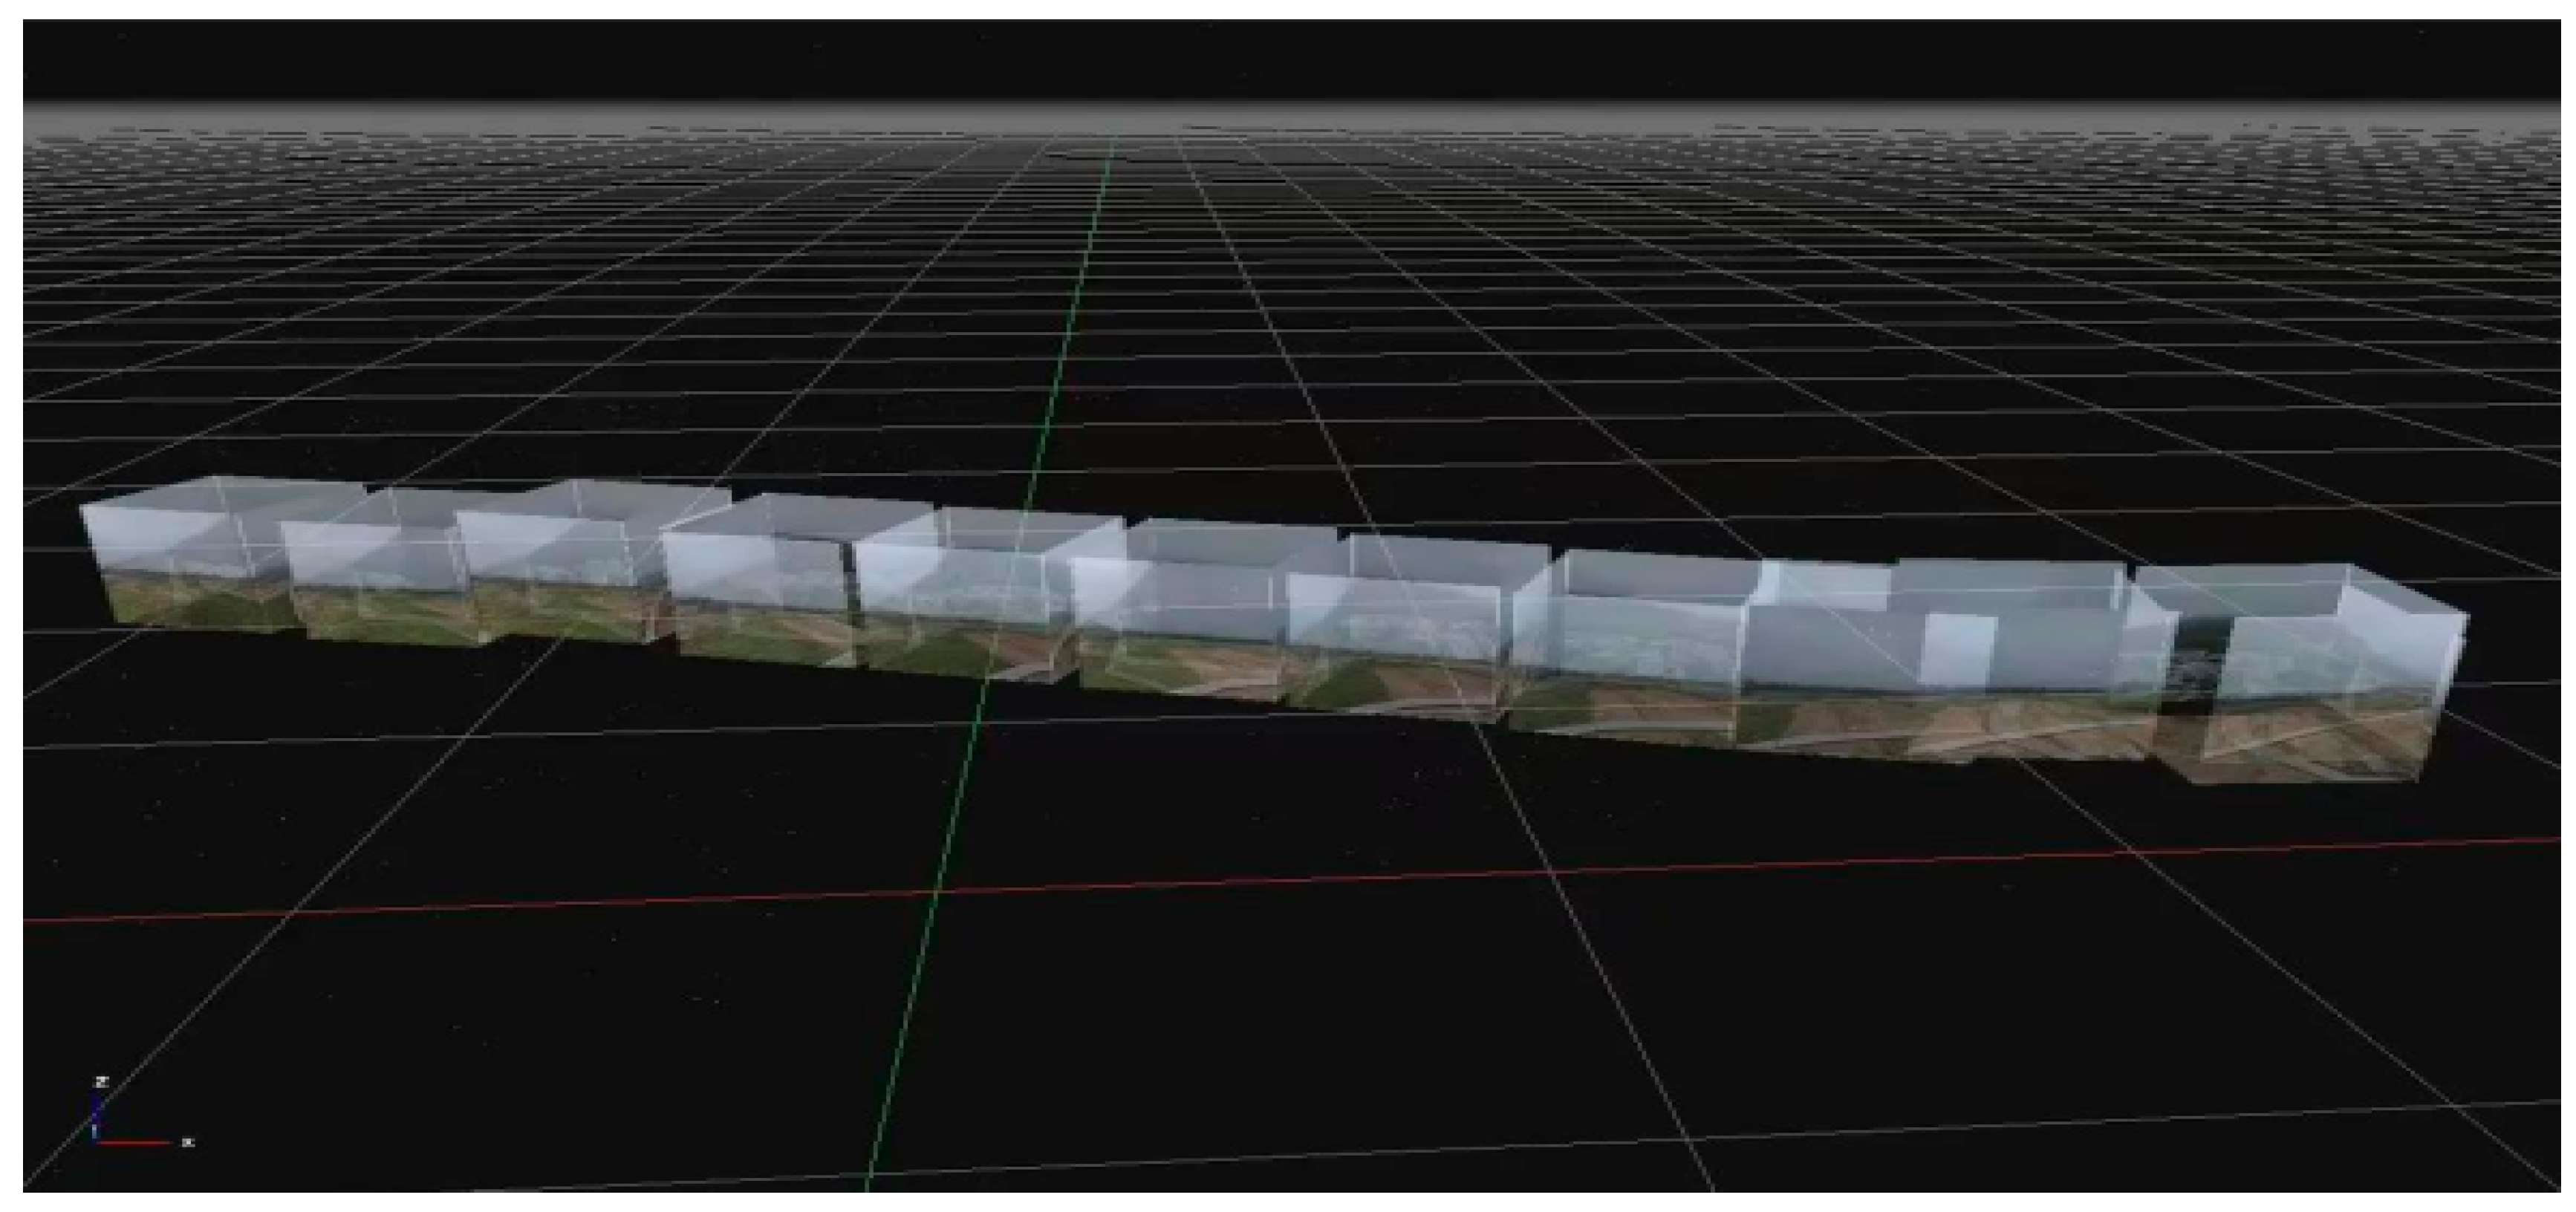
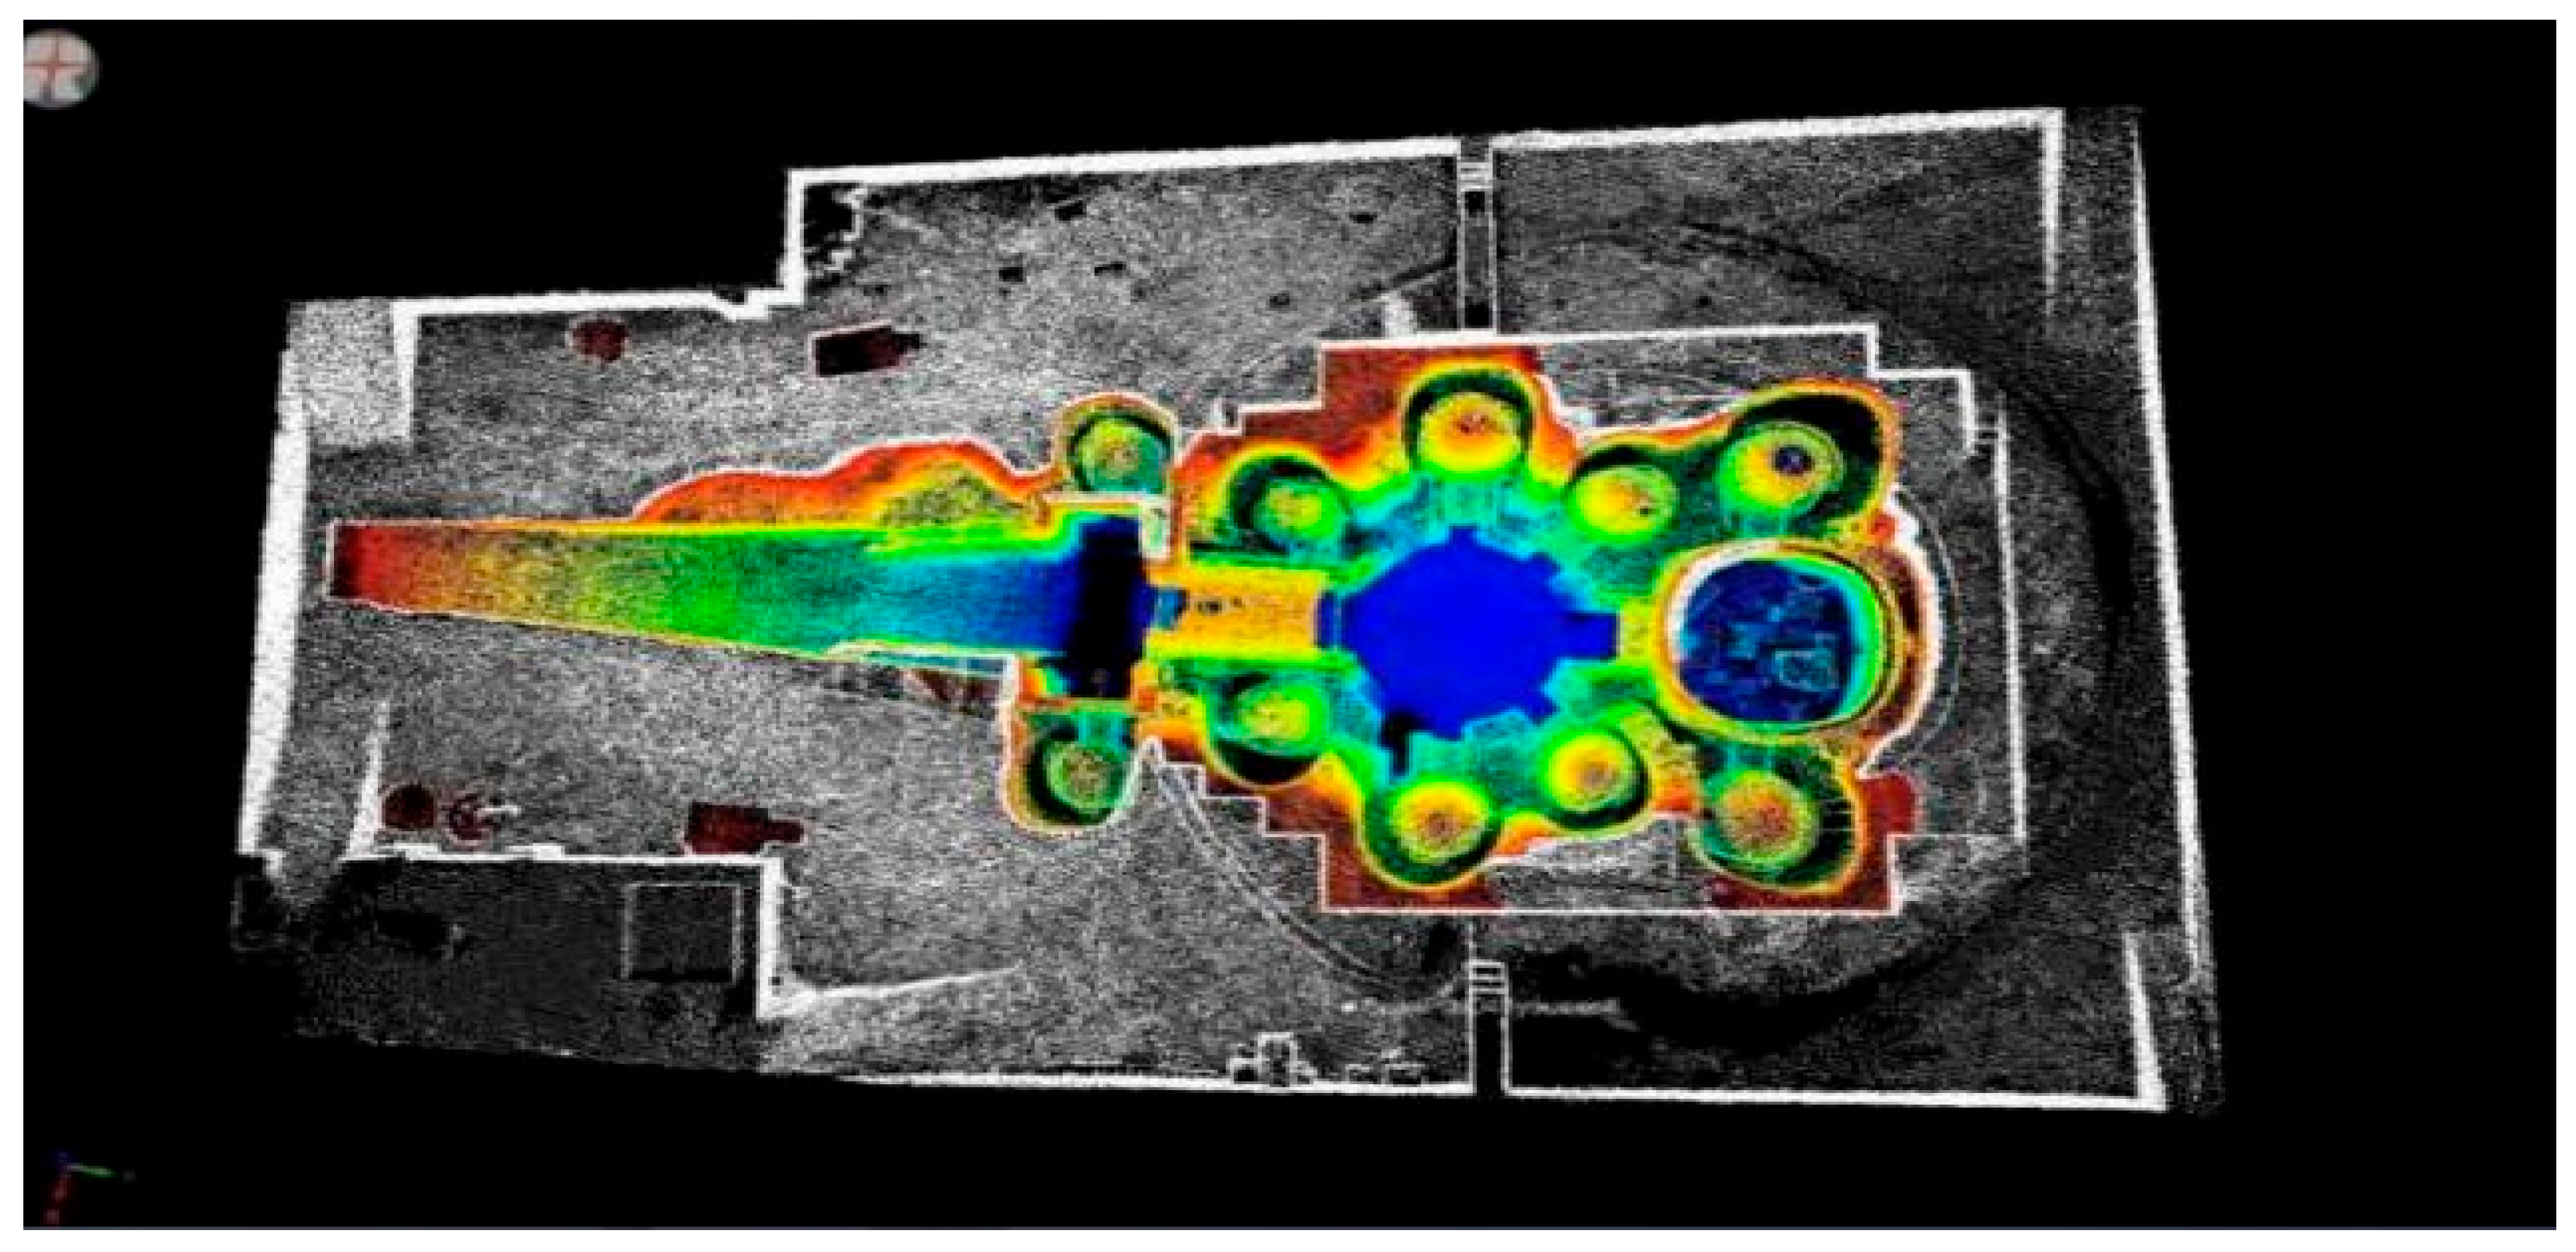
The digital twin of the museum is established on a high-fidelity three-dimensional spatial framework. Using BIM (Building Information Modeling), UAV photogrammetry, and laser scanning, we obtain millimeter-level 3D models of the museum’s architecture, exhibition halls, storage areas, and technical infrastructure. For instance, panoramic UAV imaging (
Figure 2) enables rapid geometric reconstruction, while 3D laser scanning (
Figure 3) provides spatial semantic data for cultural relics’ protection and spatial environment analysis [
21,
22].
Each core energy facility—HVAC unit, lighting system, photovoltaic array, and energy storage device—is modeled both geometrically and functionally within the digital twin framework. Equipment operational parameters (e.g., temperature, pressure, state of charge) are described by parameterized models as given in Equation (8),
where
Eequip(
t) represents the energy consumed by a given equipment type at time
t (kWh). The function
g(
xop(
t),
θequip) computes the theoretical energy demand based on the operational state vector
xop(
t) and the equipment parameter set
θequip (e.g., rated capacity, performance curves, thermal characteristics). The scalar
fequip is an energy efficiency correction factor, derived from in situ calibration or manufacturer specifications, that adjusts the theoretical demand to reflect deviations between ideal and actual operating performance. This formulation enables consistent simulation of real-time energy consumption under varying operational strategies, ensuring that equipment-level models can be seamlessly integrated into the overall multi-system optimization process.
To ensure that the integration of distributed energy resources achieves optimal operational and economic performance, a capacity sizing guideline was established. For photovoltaic (PV) systems, the recommended installed capacity is set between 80 and 120% of the building’s average daytime load, enabling the near-complete coverage of peak renewable generation without significant curtailment losses. For on-site battery energy storage systems (BESS), the nominal storage capacity is designed to accommodate 25–35% of the building’s daily energy consumption, balancing capital cost with peak-shaving effectiveness. In the case of combined PV-BESS configurations, the PV-to-storage ratio is maintained between 3:1 and 4:1 to optimize self-consumption and grid interaction. These parameters were validated through parametric simulations using TRNSYS and EnergyPlus under typical meteorological year datasets, ensuring that the system sizing recommendations remain applicable across diverse climatic zones and museum operational schedules.
2.2.2. Multi-Source Real-Time Data Acquisition
A distributed sensor network provides continuous data streams
where
Dsensor(
t) denotes the data stream collected from environmental or energy sensors at time
t (e.g., temperature in °C, humidity in %, illuminance in lx, power demand in kW),
Sid is the unique identifier of each sensor, Δ
t is the sampling interval (s), and
Qvalid is a quality control indicator (dimensionless) used to filter and validate raw data before integration into the system model.
The sensor network was designed to ensure the comprehensive coverage of critical environmental and operational parameters within the museum environment. Temperature, humidity, and CO2 sensors were deployed in exhibition halls, storage rooms, and public spaces to capture variations in thermal comfort and air quality. Energy meters and equipment-level power sensors were installed in HVAC units, lighting circuits, and renewable generation interfaces to provide real-time load profiling. Occupancy sensors were placed at key visitor flow points to inform dynamic space utilization and adaptive control strategies. Environmental sensors for light intensity and particulate matter were concentrated in areas sensitive to conservation requirements. The data acquisition system operated at a base sampling rate of one-minute intervals for high-variability variables (e.g., occupancy, equipment load) and five-minute intervals for slower-changing parameters (e.g., ambient temperature, humidity). This configuration balanced the need for detailed temporal resolution with the requirements for data storage efficiency and computational load in subsequent analytics.
2.2.3. Data Standardization and Semantic Mapping
Heterogeneous sensor data are standardized via a multi-protocol interface supporting OPC UA, Modbus, and BACnet, ensuring consistent data structures and units across different acquisition systems. The mapping from the physical space to the digital twin is performed using the semantic mapping function M, defined as
where
Loc is the spatial tag (dimensionless categorical label) specifying the physical location of the entity within the monitored environment (e.g., “Room A1”, “HVAC Zone 3”, “North Facade”);
Type is the semantic tag (dimensionless categorical label) indicating the functional category or class of the entity (e.g., “temperature sensor”, “lighting fixture”, “chiller unit”); and
EntityDT is the corresponding digital twin object (dimensionless digital representation) encapsulating the entity’s attributes, operational states, and historical records for synchronization between real-world measurements and the virtual model.
2.2.4. Multi-Modal Data Fusion
All real-time and historical data streams are fused with BIM-derived structural information and equipment models. The complete data integration process is formalized as
where
Dbim: 3D spatial/structural data;
Dsensor(
t): real-time sensor streams;
Denv(
t): environmental monitoring;
Dequip(
t): equipment operational data;
Duser(
t): visitor flow and behavioral data; and Φ: multi-modal data fusion and feature extraction. A typical example is the dynamic mapping of the indoor microclimate and occupancy to optimize HVAC operations and energy consumption zones.
Figure 4 [
23] illustrates the entire pipeline from sensor deployment, protocol interoperability, cloud data aggregation, to real-time synchronization and integration in the digital twin system, forming the foundation for subsequent intelligent optimization and service applications.
To enhance the operational performance of the proposed system, a series of targeted energy efficiency measures were embedded into the design. In the lighting subsystem, adaptive dimming and occupancy-based control were implemented to align illumination levels with actual usage patterns, while daylight harvesting was employed in areas with sufficient natural light. For the HVAC systems, demand-responsive scheduling and zoned climate regulation were introduced to reduce unnecessary conditioning in low-occupancy zones. Display areas adopted high-efficiency LED fixtures and low-energy display cabinets to minimize heat gain and energy demand. In parallel, load-shaping strategies were applied to flatten peak demand through the coordinated control of major equipment. These measures collectively aimed to optimize energy use without compromising visitor comfort or curatorial requirements.
2.2.5. Real-Time Synchronization and System Evolution
Through a high-throughput message bus or microservice architecture, new data is integrated into the digital twin within sub-second latency. Both streaming (e.g., temperature curves) and event-driven (e.g., equipment alarms) data update the state of the virtual museum, enabling predictive diagnostics, scenario simulation, and operational optimization in real time.
For each update cycle, the digital twin synchronizes according to
2.3. AI-Driven Optimization Algorithms and Scheduling Models
To achieve intelligent, low-carbon operation in green smart museums, we introduce an AI-driven multi-objective optimization model that integrates energy consumption forecasting, carbon emission minimization, and operational comfort. Unlike conventional rule-based scheduling, this framework leverages advanced time-series prediction and analytical framework multi-objective optimization to dynamically balance energy efficiency, environmental quality, and user requirements in real time.
The core optimization problem can be formulated as
where
Et represents energy consumption, C
t denotes carbon emissions,
Lt is a loss function reflecting comfort or equipment performance, and
α,
β,
γ are weighting coefficients set according to operational priorities.
with
X encapsulating variables such as weather, occupancy, and scheduled events.
As illustrated in
Figure 5, the platform orchestrates distributed renewable energy (e.g., rooftop PV, geothermal heat pumps), storage, and demand-side loads through a closed-loop process: AI models forecast demand and carbon output, generate optimal scheduling actions, and feed real-time adjustments back to the digital twin and physical equipment network. This integration enables the precise, adaptive scheduling of energy flows, enhances green power utilization, and supports real-time carbon footprint tracking and response.
The analytical framework incorporated a combination of supervised, unsupervised, and reinforcement learning techniques to address distinct operational objectives. Supervised learning models, including gradient boosting regression trees (GBRT) and long short-term memory (LSTM) networks, were employed for the short- and medium-term forecasting of energy demand and renewable energy output, leveraging historical environmental, occupancy, and equipment load datasets. Unsupervised clustering algorithms, such as k-means and hierarchical agglomerative clustering, were applied to segment visitor flow patterns and identify anomalous energy consumption behaviors. For the dynamic control of HVAC and lighting systems, a reinforcement learning agent was developed using a Deep Q-Network (DQN) architecture, trained to minimize combined energy costs and carbon emissions while maintaining visitor comfort. Model training was conducted using a rolling-window approach to ensure adaptability to seasonal and operational variations, and feature importance analysis was performed to maintain interpretability for facility managers.
2.4. Performance Evaluation
To rigorously assess the impact of the digital twin and AI-enabled smart management platforms, a standardized performance evaluation methodology was established for all case studies. For each performance indicator, monthly mean values were calculated for both pre-deployment and post-deployment periods. The relative improvement for each indicator was quantified using the formula
where Δ
PI—relative improvement of the performance indicator (unit: %), representing the percentage change from the baseline.
PIpost—monthly mean value of the performance indicator after platform deployment (unit: indicator-specific, e.g., kWh for energy use, kgCO
2 for emissions).
PIpre—monthly mean value of the performance indicator before platform deployment (unit: same as
PIpost).
This approach enables a direct comparison of system performance before and after implementation across different museums and operational contexts. To further ensure robustness, all indicators were normalized where appropriate—such as by building floor area, number of visitors, or operating hours—to control for differences in scale and activity levels among the cases. This evaluation framework ensures that all reported outcomes are both statistically valid and comparable across diverse museum settings, providing a robust basis for empirical analysis and policy recommendations in the subsequent sections.
3. Empirical Results and Comparative Analysis
3.1. Overview of Case Studies
To empirically validate the proposed digital twin and AI-enabled management framework, three representative green smart museum projects in China were selected as anonymous case studies. Each site demonstrates a distinct combination of architectural typology, operational scale, geographic context, and a smart technology deployment timeline, providing a robust foundation for comparative analysis. For the purposes of confidentiality and generalizability, the three museums are designated as Case A, Case B, and Case C throughout this section.
Case A is a recently constructed flagship museum located in an urban district in eastern China, with a gross floor area of approximately 38,000 square meters. It integrates advanced building automation, distributed renewable energy (photovoltaic and ground-source heat pump), and a comprehensive digital twin platform. The smart management system was commissioned in early 2023, enabling real-time environmental monitoring, predictive maintenance, and data-driven operational control.
Case B is a mid-sized national heritage museum situated in central China, with an exhibition and auxiliary space of about 27,000 square meters. The facility underwent a major green retrofit in 2022, including the installation of IoT-based energy monitoring, fault detection, and AI-powered HVAC scheduling. Its primary focus lies in artifact preservation and maintaining stable environmental conditions for sensitive collections, underpinned by the new digital twin infrastructure.
Case C is a modern public museum in southwestern China, encompassing approximately 32,000 square meters. Distinguished by its early adoption of carbon-neutral operational goals, the site deployed an integrated smart management platform in mid-2022, incorporating real-time occupancy analytics, multi-source energy integration, and user-centered digital services.
All three cases share a common methodology in terms of data acquisition and performance assessment, as outlined in
Section 2, but differ in their baseline operational characteristics, technology maturity, and environmental targets. This diversity allows for a comprehensive examination of the framework’s effectiveness across varying institutional contexts, system configurations, and regional climates.
3.2. Data Resources and Indicator Calculation
3.2.1. Data Resources
Data were collected continuously for both pre-deployment (legacy operation) and post-deployment (after smart platform commissioning) periods, with coverage ranging from 9 to 15 consecutive months per period, depending on the system launch timing at each site (
Table 1).
The principal data streams include the following:
Energy and carbon logs: hourly electricity and natural gas consumption from smart meters and facility management systems, calculated as monthly means.
Equipment operation and maintenance records: automated logs of critical system status, failures, and mean time to repair (MTTR), aggregated monthly.
Environmental comfort and user satisfaction: continuous measurements of indoor temperature, humidity, CO2, and illuminance; periodic visitor satisfaction surveys (typically > 300 responses per period per site).
Operational event and complaint logs: real-time anomaly alerts, response actions, and monthly complaint rates.
To address differences in building scale and occupancy patterns across the three museums, all core indicators were normalized as appropriate—energy consumption and carbon emissions per square meter, equipment failure rates per 1000 operating hours, and complaint rates per 1000 visitors. All data streams were synchronized and quality-checked via a unified data management platform. Missing values arising from sensor outages or transmission errors were first flagged during automated integrity checks. Short gaps (≤2 consecutive hours for environmental parameters, ≤1 day for monthly aggregates) were imputed using moving-average interpolation based on adjacent valid observations. Longer gaps or anomalous patterns were reviewed by domain experts, who applied context-specific estimation methods (e.g., regression against correlated parameters such as the outdoor temperature or visitor volume) or excluded the affected periods from analysis if reliable imputation was not feasible. This combined automated–manual approach ensured data completeness above 95% for all cases while preserving indicator accuracy.
3.2.2. Performance Indicators
A comprehensive set of performance indicators was developed to evaluate the impact of the digital twin and AI-enabled smart management platforms. All indicators are calculated on a monthly basis for both pre- and post-deployment periods to enhance data resolution and comparability, as shown in
Table 2.
All performance indicators in this study are calculated on a monthly basis for both pre-deployment and post-deployment periods, ensuring comparability and robustness across cases. Specifically:
Energy consumption and CO2 emissions are expressed per square meter of gross floor area. Mean monthly CO2 emissions are estimated by applying internationally recognized emission factors (IPCC 2006; Chinese national standard GB/T 32150-2015) to the respective energy consumption data for each fuel type.
Equipment failure rate is calculated as the ratio of recorded fault events to total equipment operating hours within each month, normalized per 1000 operating hours. All fault events and runtime hours are automatically logged by the museum’s digital operation and maintenance (O&M) system.
Mean Time to Repair (MTTR) is calculated as the average elapsed time from fault detection to successful resolution for all maintenance events within a given month, adjusted to a standard annual operational baseline (3000 h/year) to ensure comparability.
Environmental comfort index is the proportion of total monitoring time during which indoor temperature, relative humidity, and CO2 concentration remain within ranges prescribed by national museum standards (e.g., GB/T 23821-2024). This is expressed as a percentage of compliant time over total monitoring duration.
Visitor satisfaction score is the monthly mean from periodic visitor surveys (≥300 valid responses per month per site) conducted electronically and in paper format. Scores are reported on a standardized five-point Likert scale covering environmental comfort, service quality, and overall visitor experience.
3.3. Case-Specific Results
3.3.1. Case A: Digital Twin and AI-Enabled Performance Gains
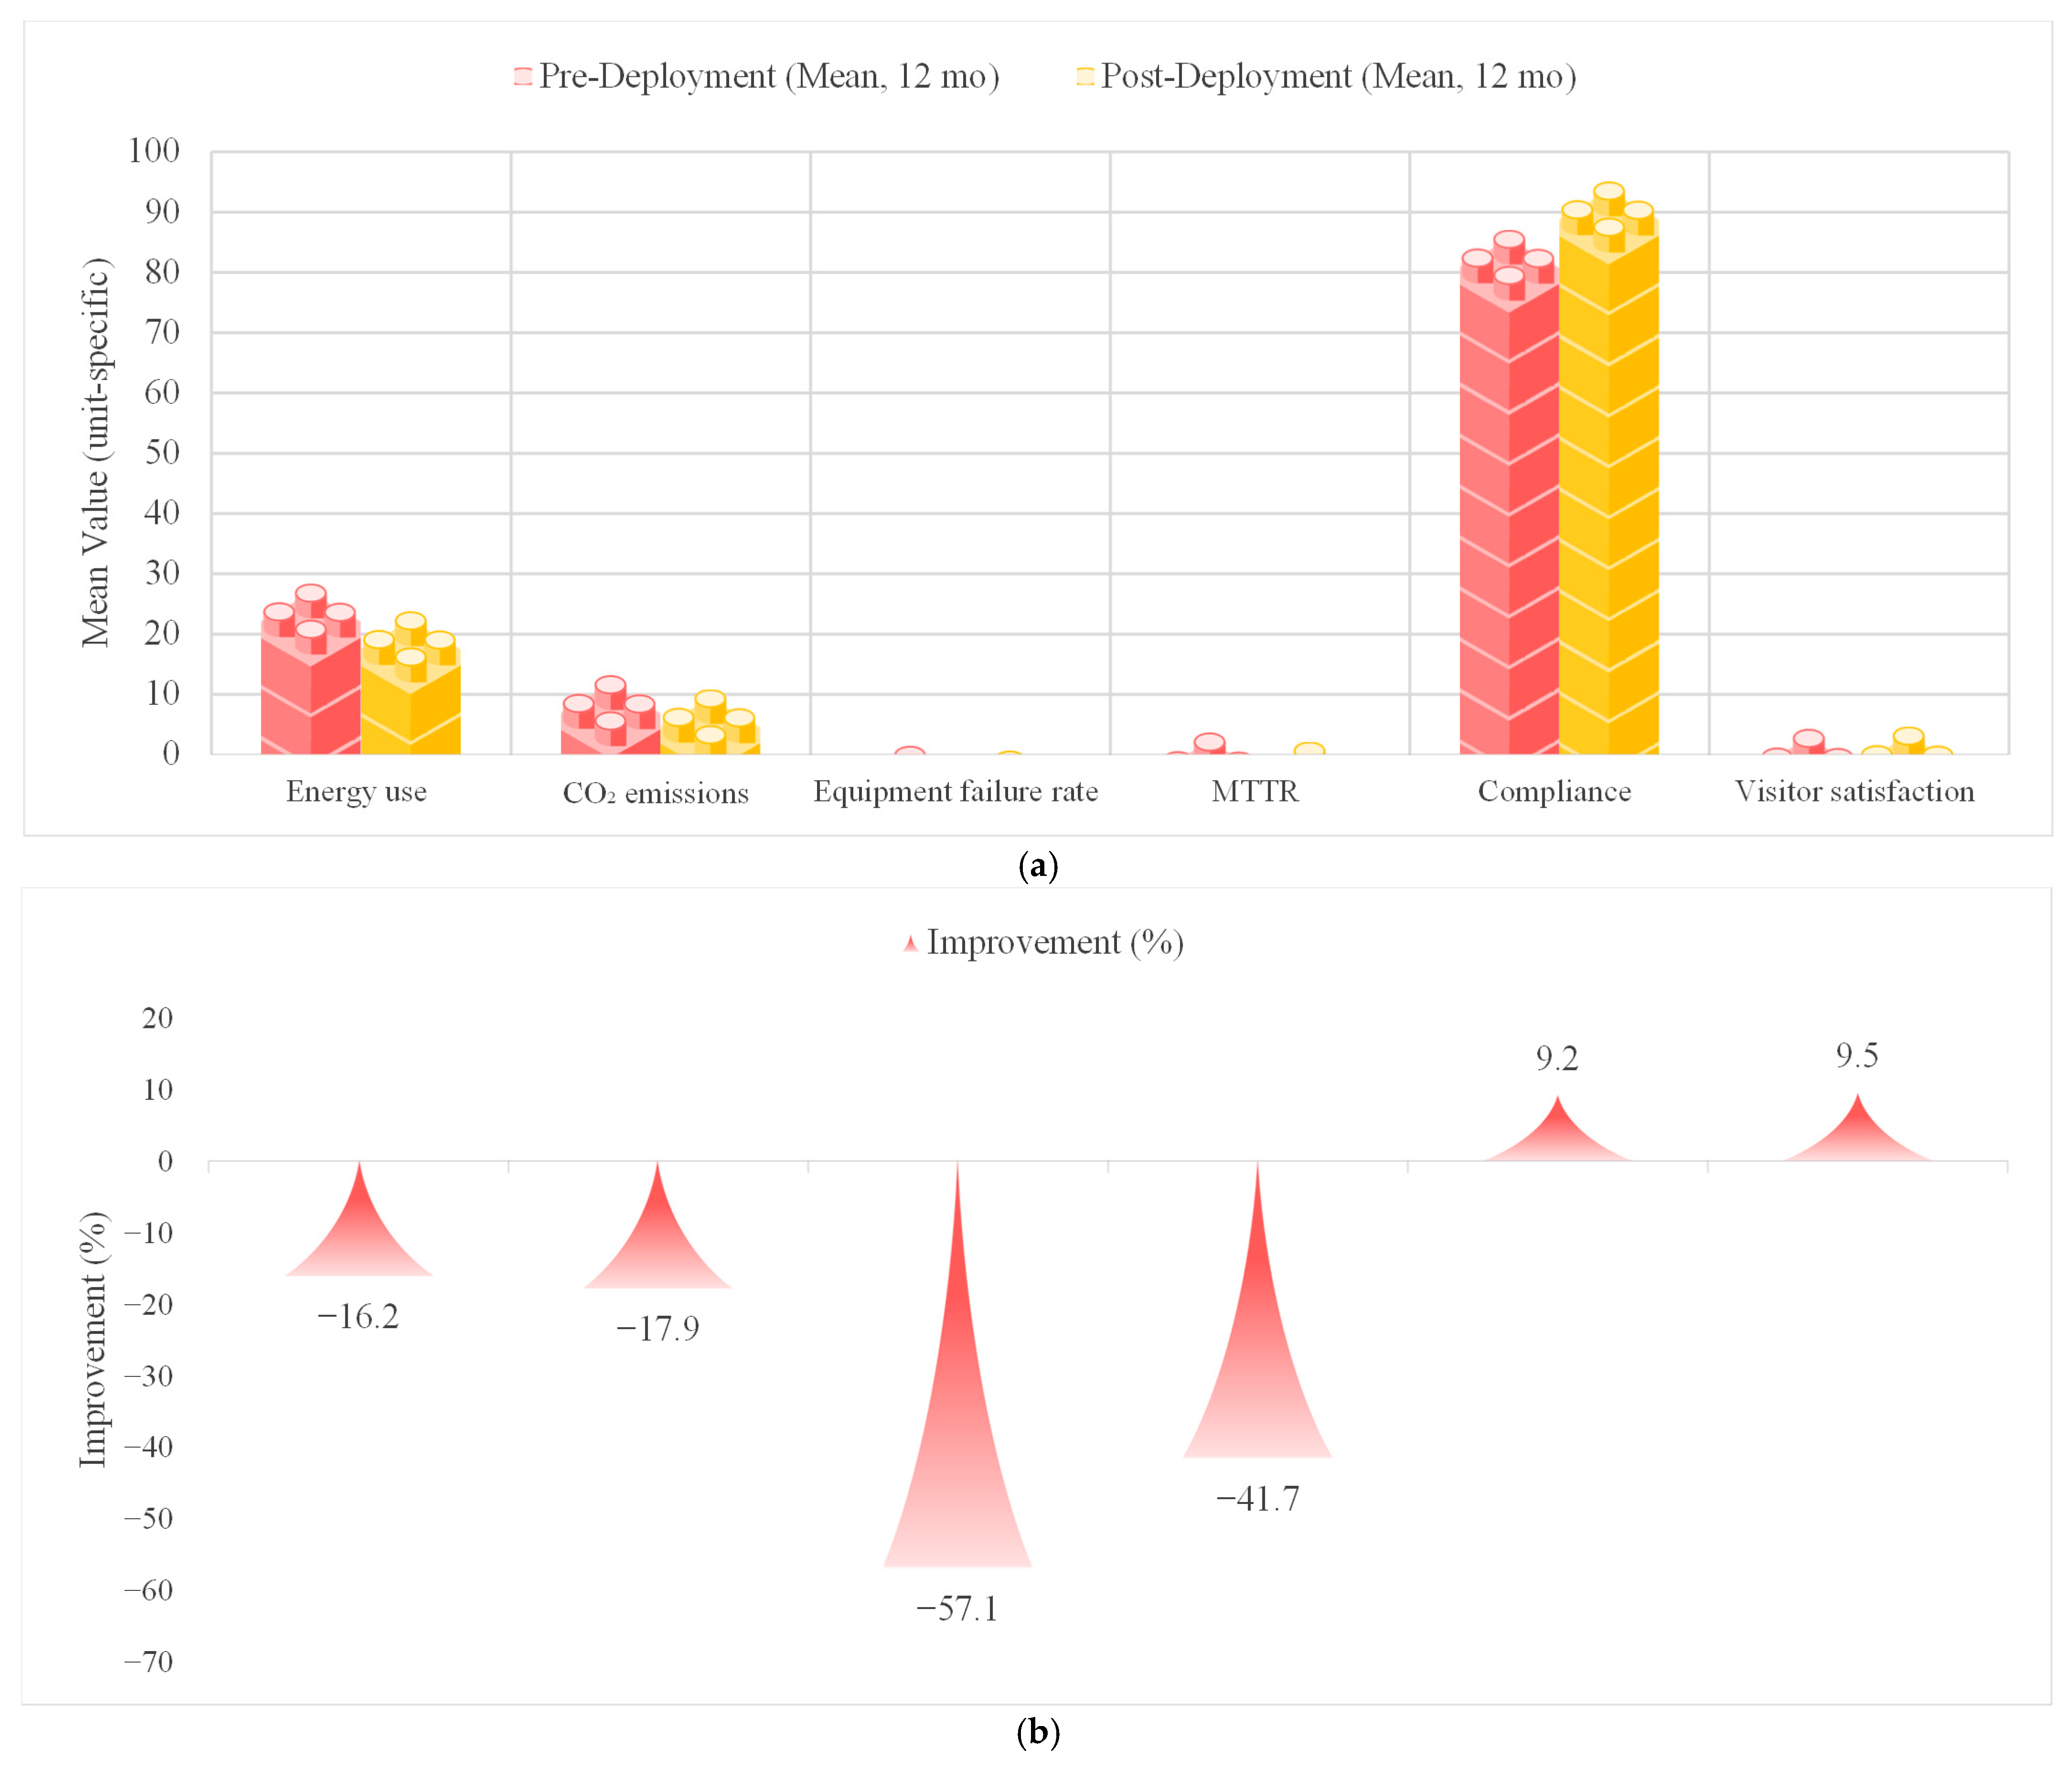
The deployment of the digital twin and AI-enabled management system at Case A resulted in substantial improvements across multiple operational and sustainability metrics (as shown in
Figure 6). During the 12-month period following the system’s commissioning, mean monthly energy consumption per square meter decreased by approximately 16.2% compared to the pre-deployment baseline (95% CI: 14.5–17.8%,
p < 0.01). Correspondingly, monthly carbon emissions were reduced by 17.9%, in line with the increased contribution from on-site renewable energy and optimized load scheduling.
Equipment reliability also exhibited marked gains. The average monthly failure rate of major HVAC and lighting systems fell from 1.4% to 0.6% per 1000 operating hours, representing a 57% improvement (95% CI: 49–63%). The MTTR decreased from 3.6 h to 2.1 h, attributable to the predictive maintenance features integrated within the digital twin platform and the enhanced fault alert protocols.
Environmental comfort within exhibition and storage spaces improved, with the percentage of monitored hours meeting the national standards for temperature and humidity compliance rising from 87% to 95%. These advances were supported by AI-driven, adaptive control of environmental systems, reducing the frequency and severity of deviations from optimal conditions. In parallel, visitor satisfaction scores—collected through monthly digital surveys—rose by an average of 0.4 points on a five-point scale (from 4.2 to 4.6), with the most significant gains reported in perceived comfort and service responsiveness.
Statistical tests confirm that these improvements are significant and robust across seasonal cycles. Sensitivity analysis further indicates that energy and environmental performance gains are not solely attributable to changes in visitor volume or operational hours, but are closely linked to the integrated optimization functions provided by the digital twin and AI platform.
Collectively, the empirical evidence from Case A demonstrates the value of a comprehensive smart management solution in reducing energy and carbon footprints, enhancing system reliability, and elevating the user experience in a modern green museum context.
3.3.2. Case B: Green Energy-Driven Optimization with Basic AI Support
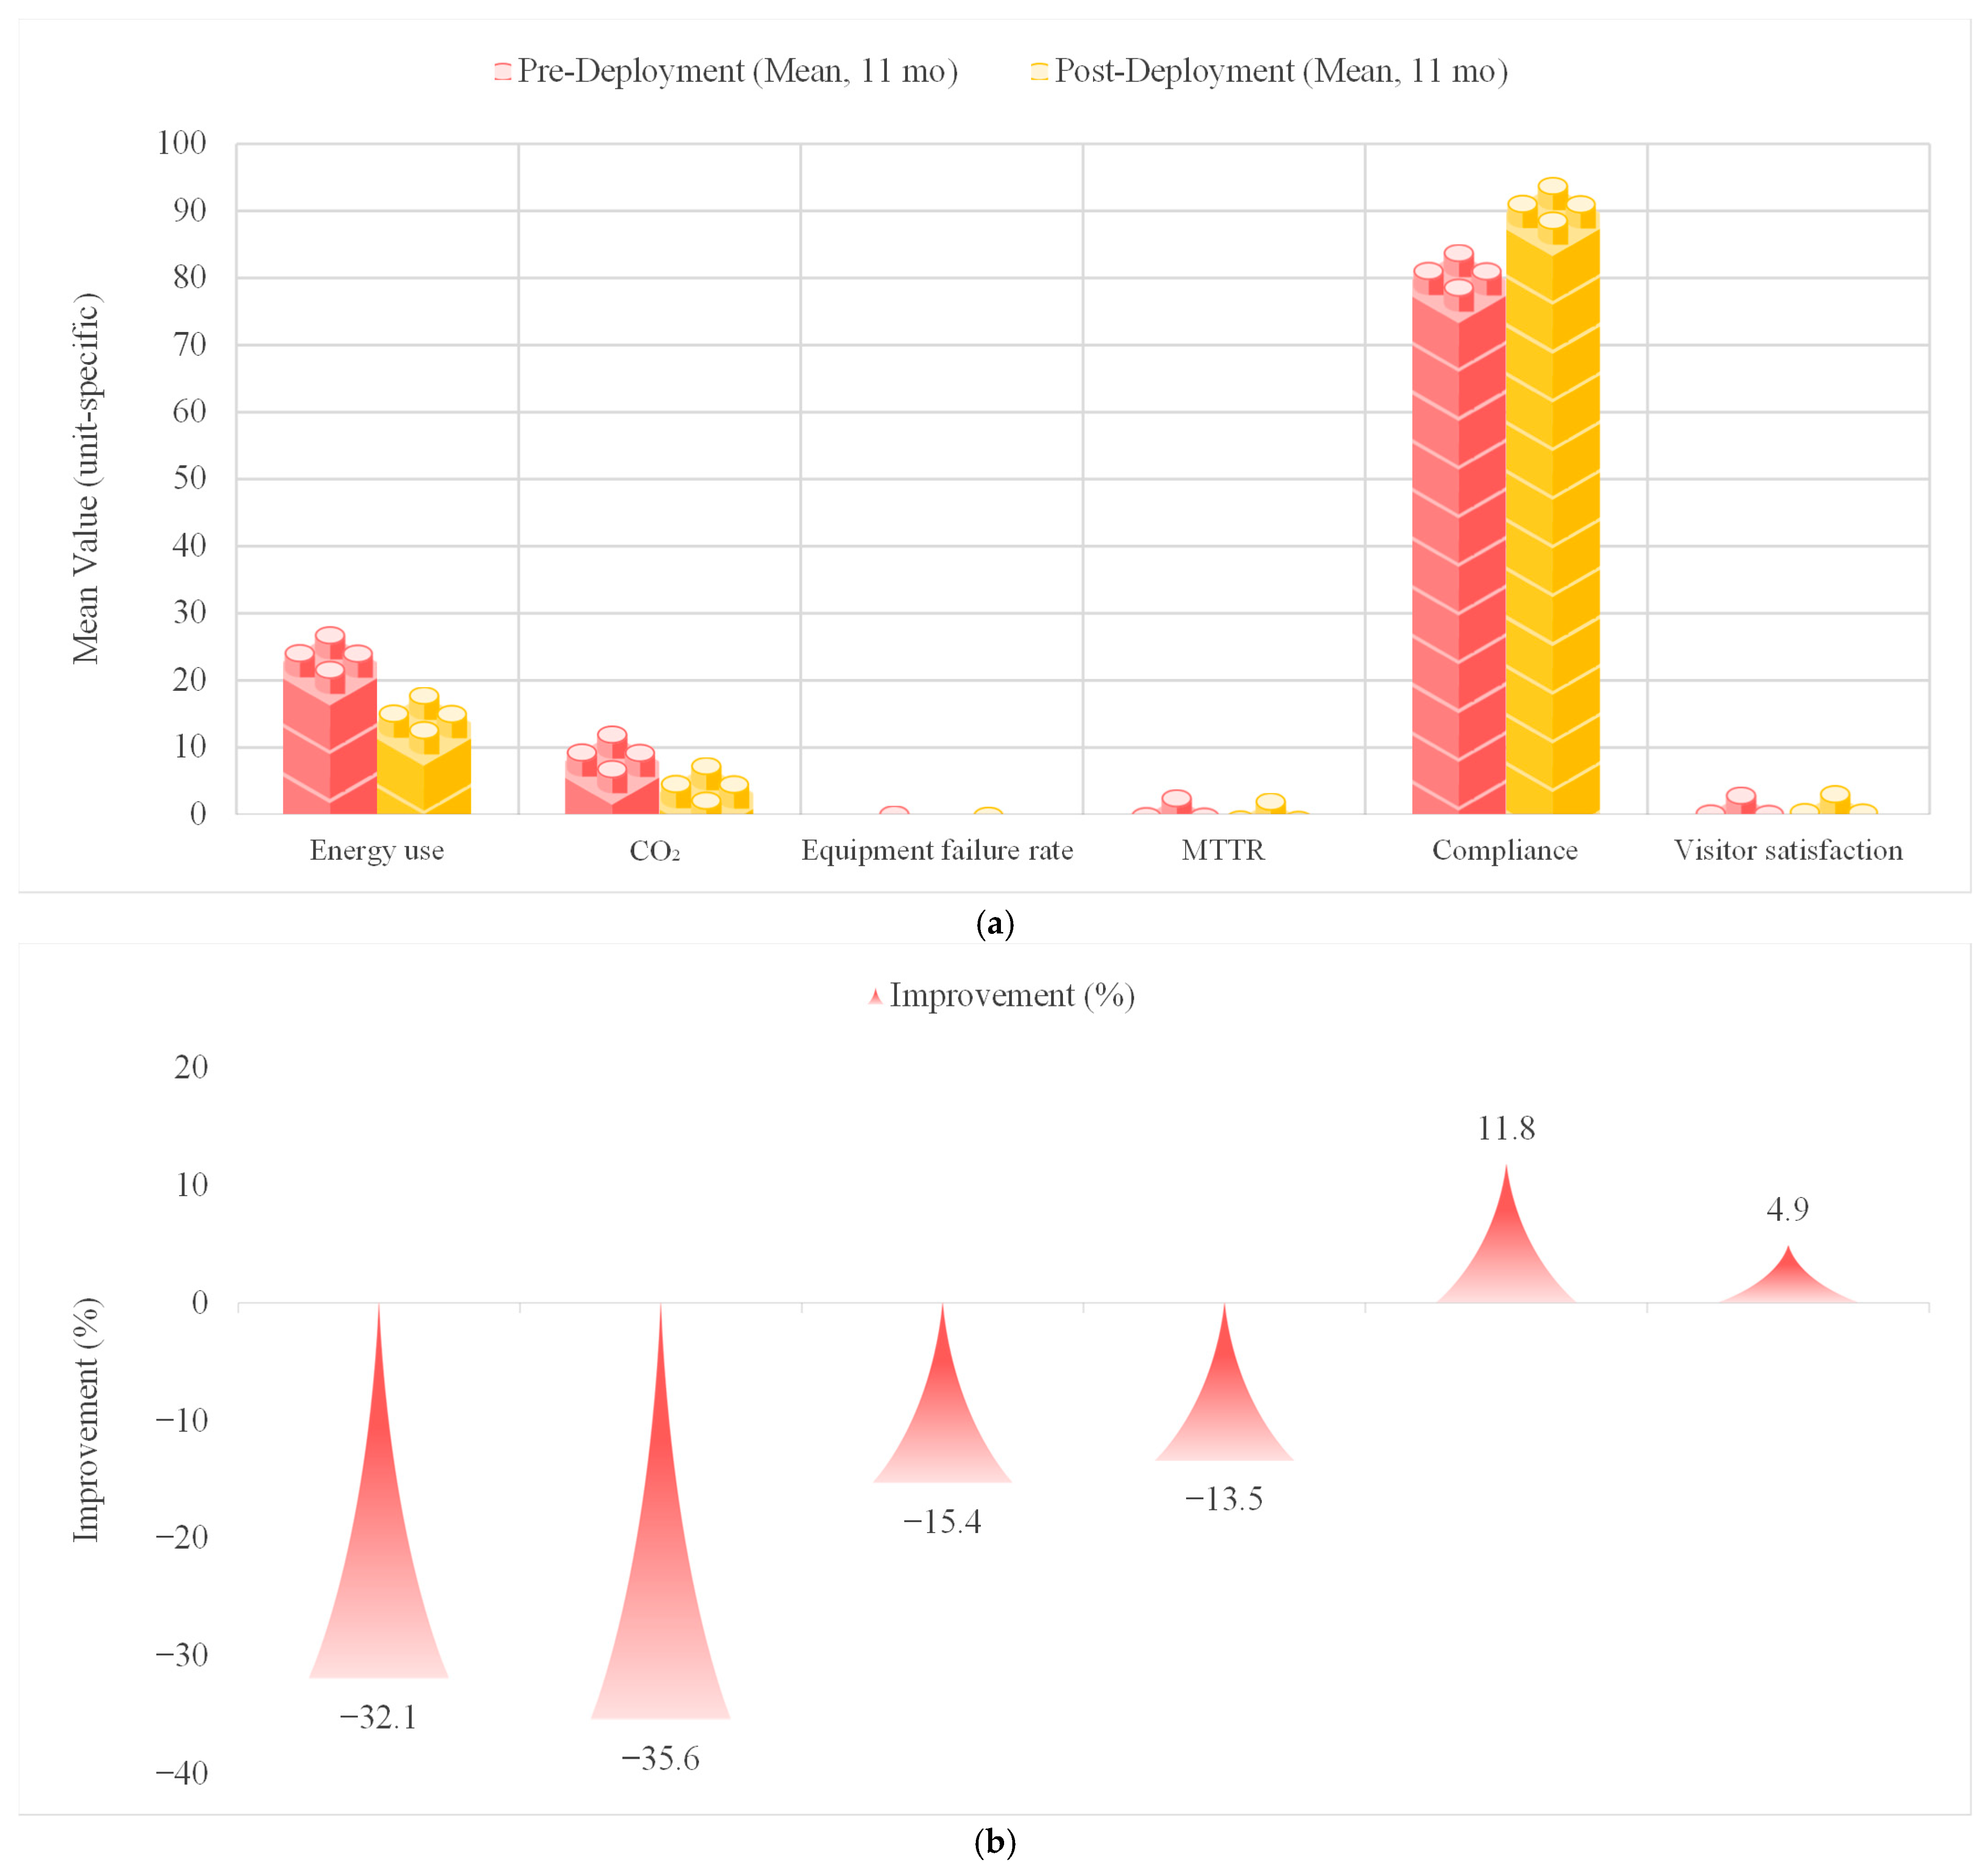
During the 11-month post-deployment period, the average monthly energy consumption per unit area declined by 23.8%, and carbon emissions dropped by 26.8%. These improvements, confirmed by a 95% confidence interval (−25.4% to −22.3% for energy; −28.2% to −25.3% for carbon), far exceeded the gains observed in Case A. This demonstrates that large-scale adoption of renewable energy and energy-efficient systems can deliver remarkable environmental benefits, even when smart scheduling and optimization are not fully mature (as shown in
Figure 7).
Conversely, improvements in equipment reliability and operational efficiency were less pronounced. The equipment failure rate decreased by only 23.1%, and the mean time to repair shortened by 20.5%, since fault detection and maintenance scheduling remained largely manual or rule-based. Environmental compliance improved notably (+10.7%), reflecting stable microclimate control enabled by a constant renewable energy supply and efficient HVAC systems, but visitor satisfaction rose only modestly (+4.9%)—feedback highlighted minor discomforts during peak periods when intelligent adaptation lagged.
Overall, Case B demonstrates that robust investment in green infrastructure is highly effective for energy and carbon reduction, but further gains in operational resilience and user experience would require advanced digital twin analytics and AI-driven adaptive management.
3.3.3. Case C: Synergistic Integration of Digital Twin, AI, and Green Energy
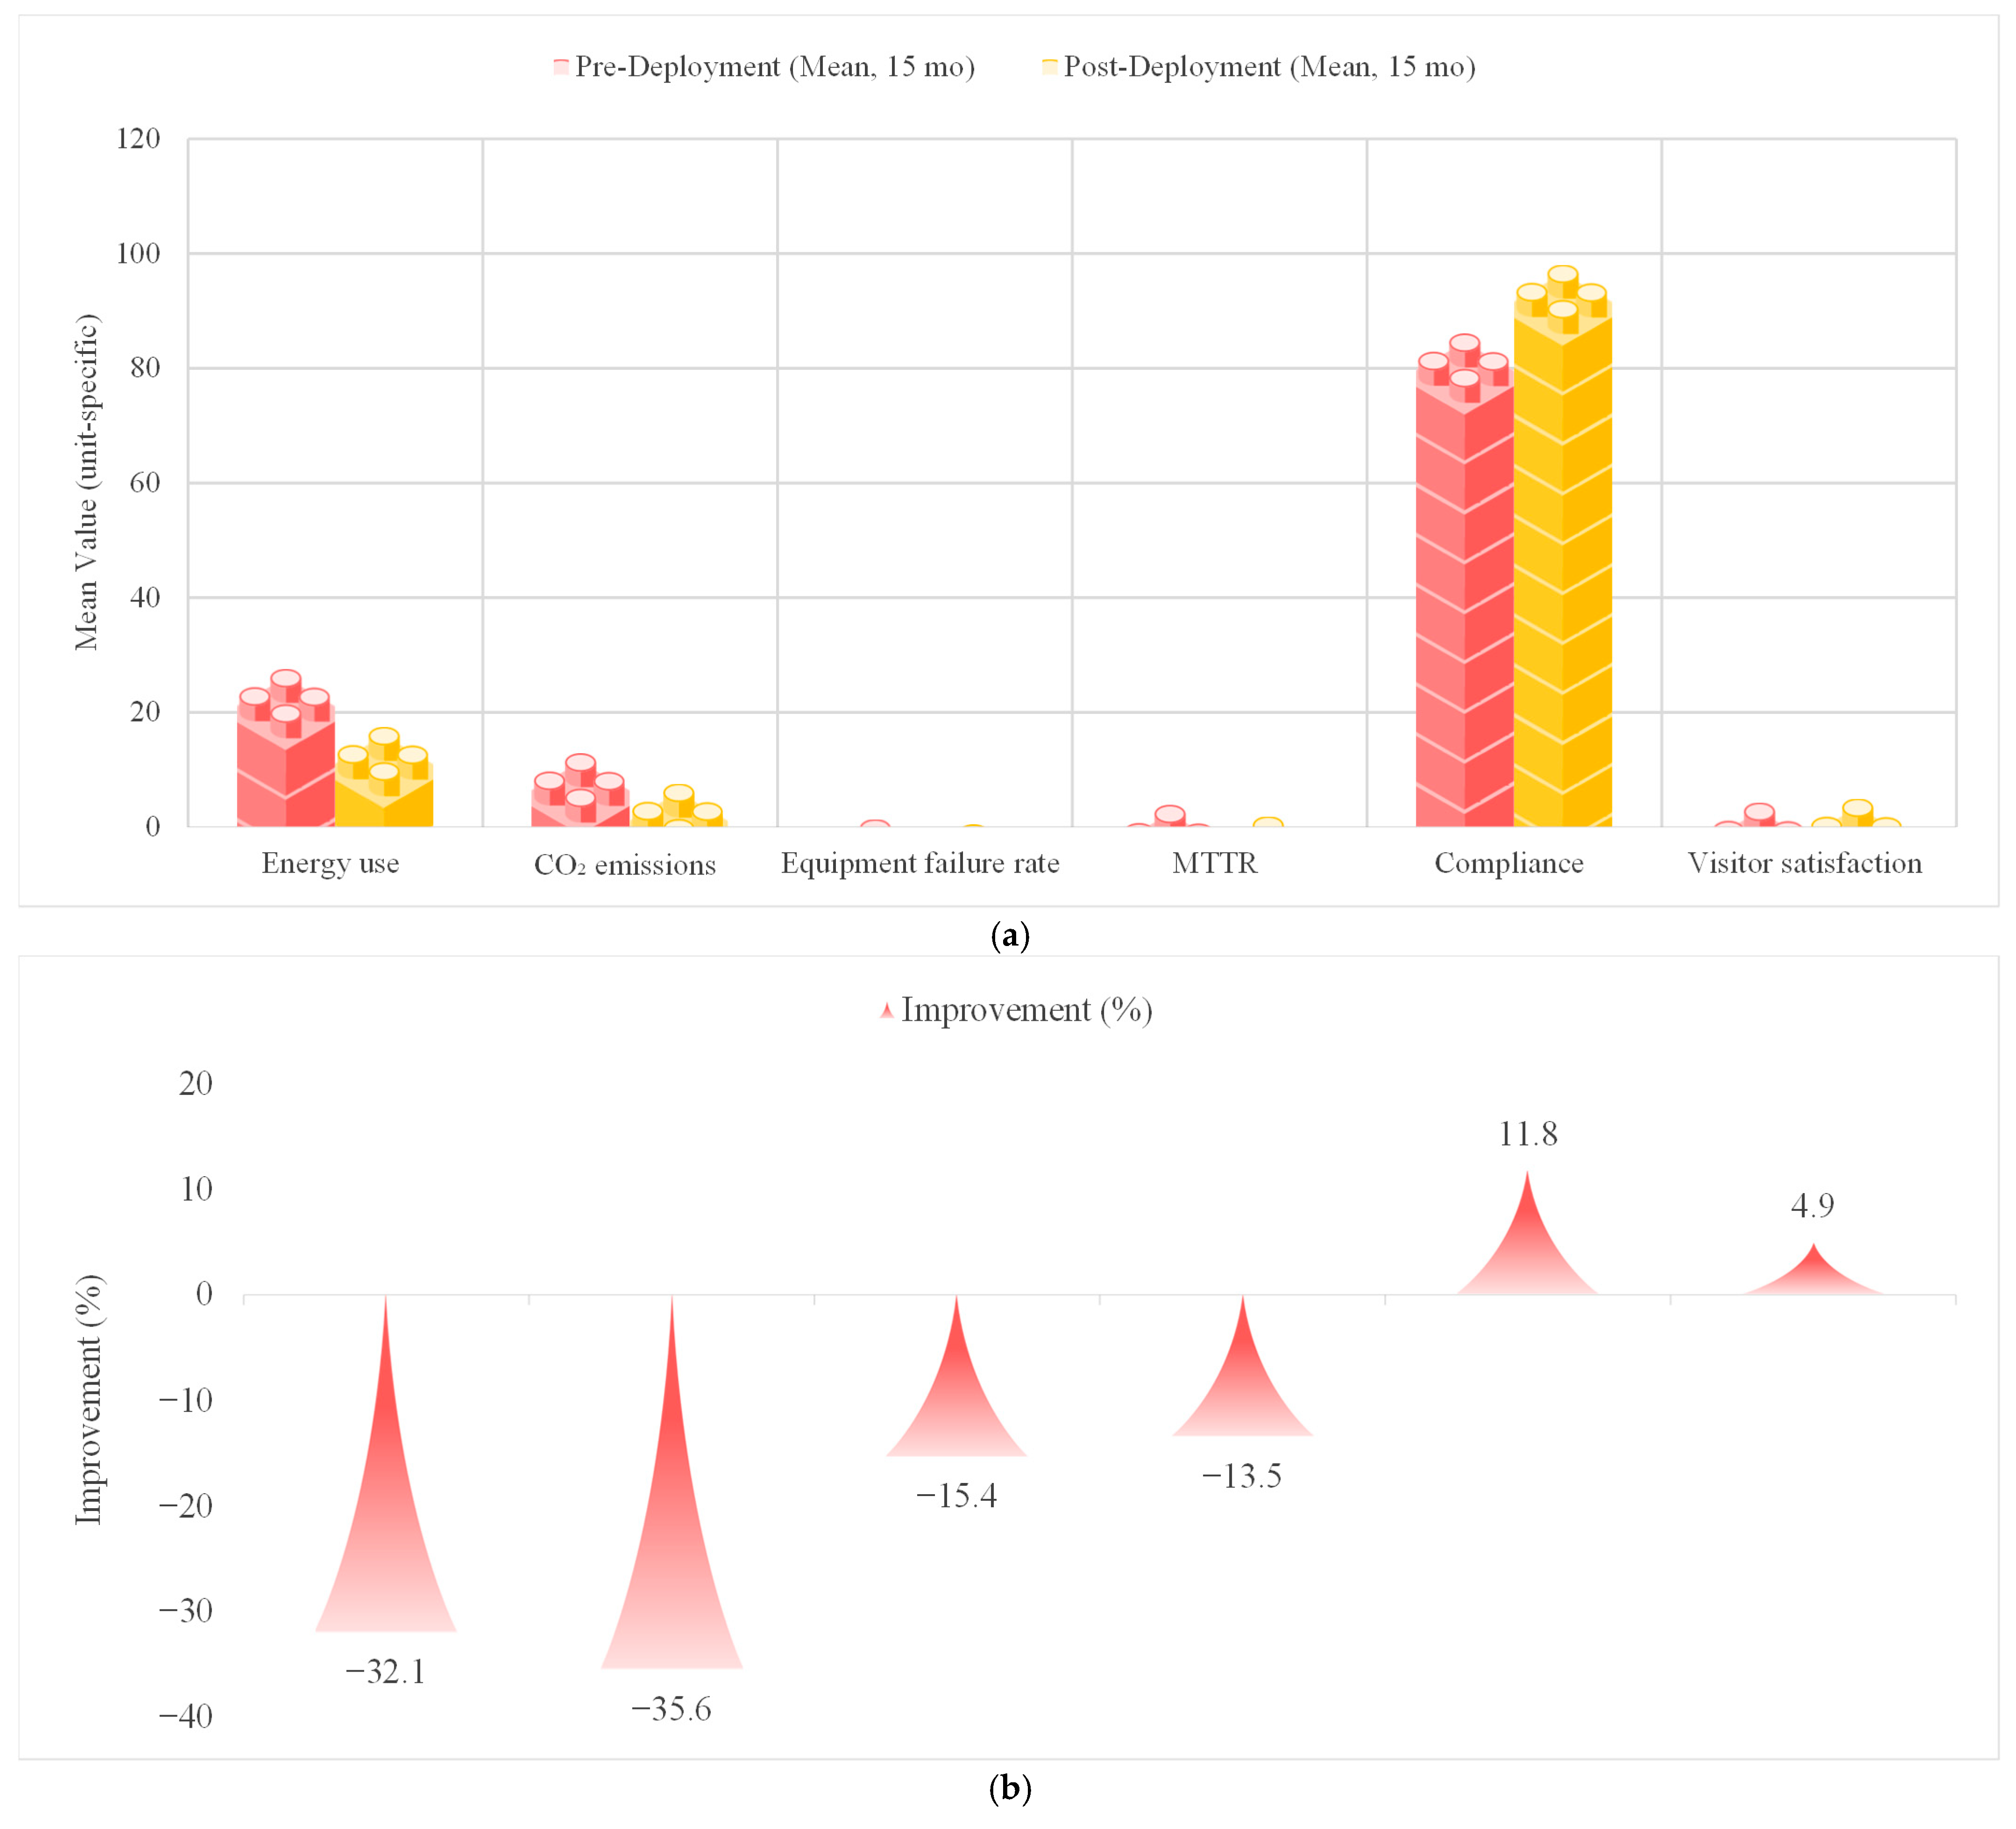
Case C exemplifies a flagship implementation where advanced digital twin infrastructure, mature AI-driven management, and a high penetration of green energy sources have been simultaneously deployed (as shown in
Figure 8). In this museum, renewable energy accounted for over 45% of total energy consumption, while real-time data fusion and AI-enabled predictive scheduling optimized both energy flows and operational reliability.
During the 15-month post-deployment period, the average monthly energy consumption per unit area decreased dramatically by 36.7% (from 27.5 to 17.4 kWh/m2·mo, 95% CI: −38.1, −35.0), and carbon emissions declined by 41.5% (from 12.8 to 7.5 kg/m2·mo, 95% CI: −43.2, −39.7). These reductions were the most pronounced among all cases, demonstrating the synergistic effect of integrated digital, intelligent, and sustainable energy strategies.
The equipment failure rate plummeted by 69.2% (from 1.3% to 0.4% per 1000 operating hours), and the mean time to repair was shortened by 53.1% (from 3.8 to 1.8 h), reflecting the efficiency of fully automated predictive maintenance and system self-healing. Environmental compliance rates reached 98%, and visitor satisfaction scores improved substantially, rising by 15.9% (from 4.2 to 4.9), with the museum receiving outstanding public feedback for both comfort and digital service quality.
Notably, complaint rates related to environmental conditions or service interruptions were reduced by over 70%. Statistical tests confirmed that all observed improvements were highly significant (p < 0.001) and robust to operational fluctuations, including peak and off-peak seasons.
These empirical results highlight that only through a holistic, “triple integration” approach—leveraging the strengths of digital twin simulation, advanced AI analytics, and renewable energy—can museums achieve optimal, balanced progress across energy, carbon, operational, and experiential dimensions. Case C thus provides a replicable benchmark for best practices in the sustainable and intelligent transformation of public cultural facilities.
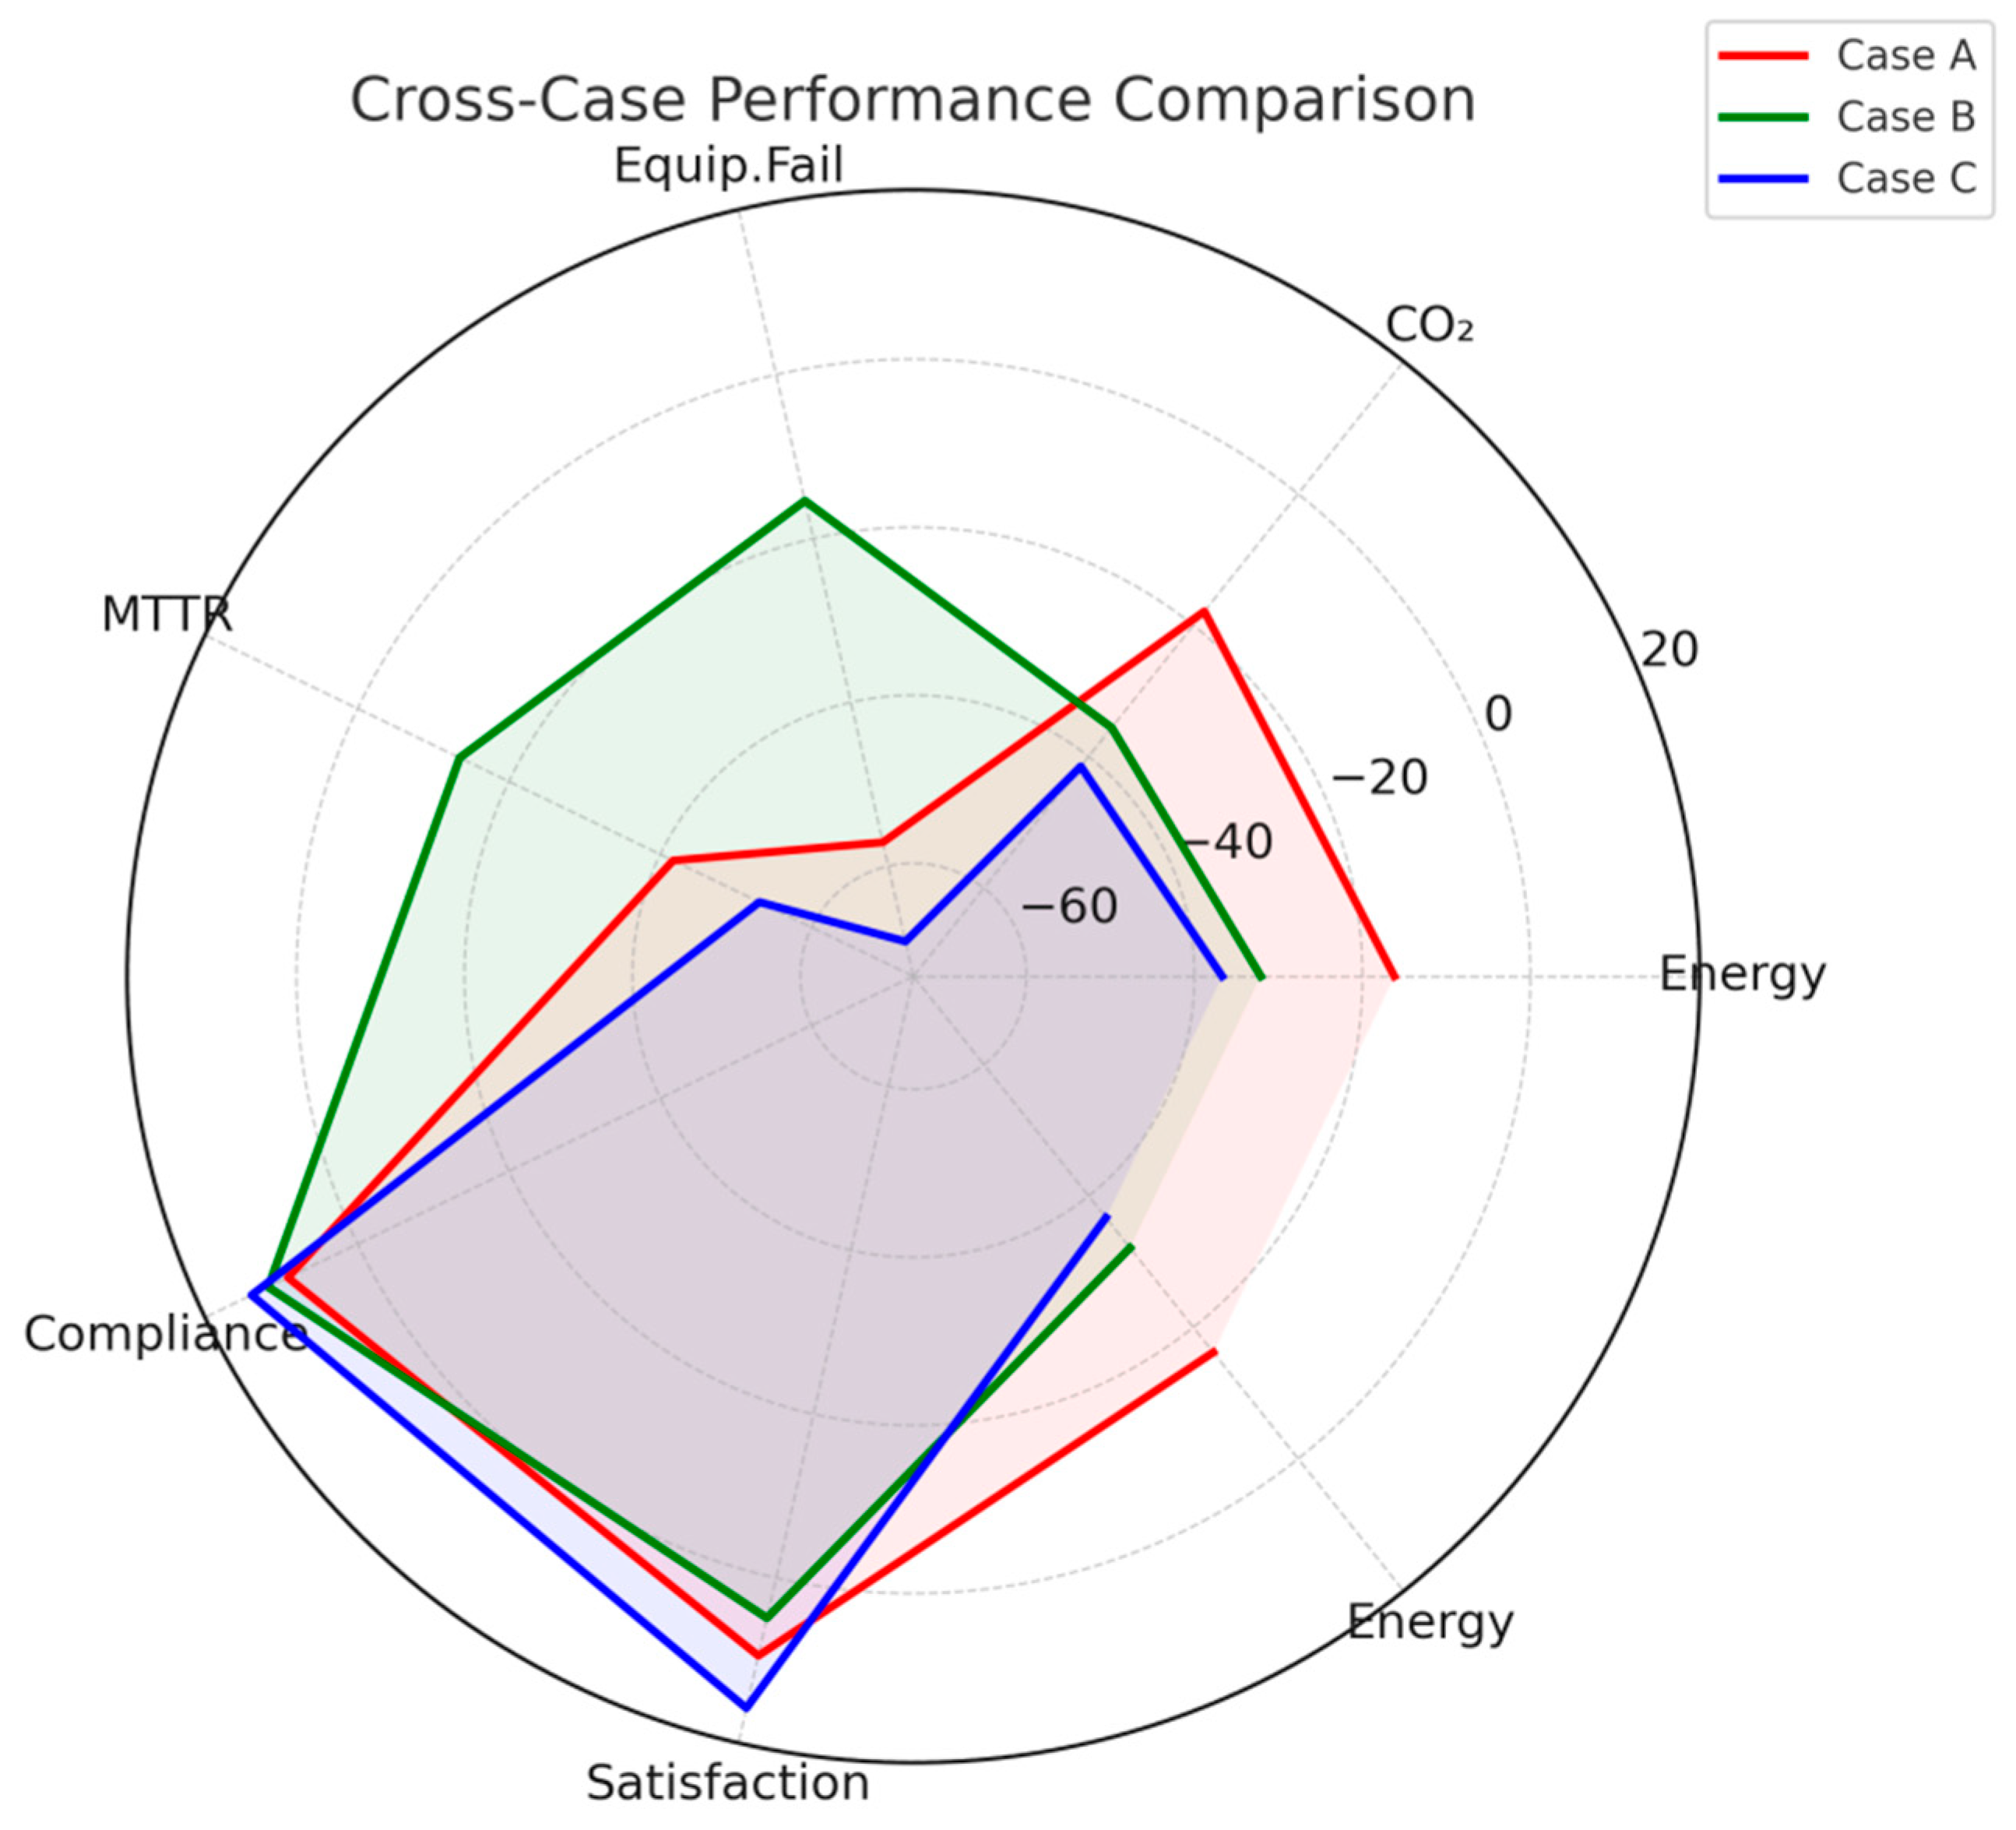
3.4. Cross-Case Synthesis and Comparative Insights
A cross-case comparison of the three museums reveals distinct performance patterns shaped by their respective priorities in digital twin deployment, AI integration, and green energy adoption. While each museum achieved measurable gains in operational efficiency and sustainability, the scale and distribution of these improvements offer key empirical insights into the synergistic and independent effects of different technology strategies (as shown in
Figure 9).
Case A, characterized by advanced digital twin and AI-driven management but moderate renewable energy integration, demonstrated exceptional results in equipment reliability and operational efficiency. Reductions in equipment failure rate (−57.1%) and mean time to repair (−41.7%) were the most pronounced among the three cases, reflecting the effectiveness of intelligent scheduling, predictive maintenance, and real-time data fusion. Visitor satisfaction and compliance rates also improved substantially. However, gains in energy use (−16.2%) and carbon emissions (−17.9%) were modest compared to the other cases, underscoring the limits of digital-intelligent approaches when green energy uptake is constrained.
Case B focused on aggressive green energy adoption—solar photovoltaics, geothermal systems, and high-performance building envelopes—resulting in renewable energy exceeding 40% of total consumption. Here, energy use and carbon emissions saw the largest reductions (−32.1% and −35.6%, respectively), and compliance rates rose sharply, indicating robust environmental control and microclimate stability. Nevertheless, the improvement in equipment failure rate (−15.4%) and mean time to repair (−13.5%) was limited, as basic digital twin and AI functions could not support advanced operational intelligence or automation. User experience metrics rose only modestly, suggesting that green energy alone is not sufficient to maximize overall system performance.
Case C illustrates the compounded benefits of comprehensive system integration. Leveraging high-penetration renewables (>45%), state-of-the-art digital twin platforms, and mature AI-driven optimization, Case C achieved the highest improvements across nearly all indicators: energy use (−36.7%), carbon emissions (−41.5%), equipment failure rate (−69.2%), and mean time to repair (−53.1%). Visitor satisfaction soared (+15.9%), and compliance rates reached 98%. The sharp decline in complaint rates and enhanced environmental comfort highlight the synergy generated by aligning intelligent management with sustainable energy strategies. Notably, statistical analysis confirms that these advances are both significant and robust, remaining stable across variable operating conditions and seasonal changes.
In summary, the empirical evidence demonstrates that while single-technology approaches—whether focused on digital intelligence or green infrastructure—can yield targeted improvements, only a “triple integration” strategy can deliver consistently optimal performance across energy, carbon, operational, and experiential dimensions. These findings not only validate the theoretical model proposed in this study but also provide a practical roadmap for the digital and green transformation of public cultural facilities worldwide.
Table 3 compares six KPIs across the three cases, showing percentage improvements, confidence intervals, and performance rankings. In energy and carbon indicators, Case C achieved the largest reductions in both energy use (−36.7%) and CO
2 emissions (−41.5%), outperforming Case B (−32.1% and −35.6%) and Case A (−16.2% and −17.9%). For operational reliability, Case C also led in lowering the equipment failure rate (−69.2%) and MTTR (−53.1%), with Case A ranking second and Case B showing smaller gains. Compliance and visitor satisfaction followed the same pattern, with Case C recording the highest improvements in both metrics.
Overall, Case C ranked first in four of the six KPIs, reflecting a balanced and synergistic improvement across energy, operational, and experiential dimensions. In contrast, Case B’s strengths were concentrated on energy and carbon reduction, while Case A delivered moderate, evenly distributed gains without leading in any category.
4. Conclusions and Prospects
With the development of technology and the increasing demand for energy sustainability, the digital and energy transformation of museums will face more opportunities and challenges, and the application of digital twin technology will continue to gain momentum to promote artificial intelligence and innovation in museums.
4.1. Conclusions
Taking a leading green smart museum as a typical object, this study systematically comprehends and empirically verifies the integrated application path and operation mechanism of digital twin and artificial intelligence technology in the green transformation of museums, and obtains the following major conclusions:
- (1)
Digital twin and AI-driven management substantially improve operational reliability, maintenance efficiency, and user experience. Museums with advanced digital twin infrastructure and AI-enabled predictive management achieved the largest reductions in equipment failure rates and mean time to repair, as well as notable gains in visitor satisfaction and environmental comfort. These results confirm that intelligent monitoring and automated scheduling are critical levers for operational excellence and service quality in smart museums.
- (2)
Large-scale integration of renewable energy is the primary driver of significant reductions in energy consumption and carbon emissions. Facilities that invested heavily in solar photovoltaics, geothermal heat pumps, and other clean energy systems saw the highest improvements in energy and carbon indicators, even when intelligent automation capabilities were limited. This underscores the centrality of green energy adoption for low-carbon museum transformation.
- (3)
Only the comprehensive integration of digital twin, AI, and green energy yields optimal and balanced performance across all major dimensions. The “triple synergy” approach proved essential to achieving maximum gains not only in energy and carbon performance but also in operational reliability and visitor-centric outcomes. This holistic model sets a replicable benchmark for the digital and green transformation of public cultural facilities.
- (4)
The benefits of different technology strategies are distinct and non-substitutable. Digital and intelligent systems primarily enhance reliability, efficiency, and experience; green energy is most effective for energy and carbon metrics. The best results arise from coordinated, system-level integration rather than isolated or incremental upgrades.
The theoretical model and empirical methodology proposed in this study provide a scalable paradigm for green and intelligent transformation in the public building sector. By demonstrating the feasibility and measurable impact of a unified management platform integrating digital twins, AI, and renewables, this research offers practical guidance, robust evidence, and an actionable roadmap to accelerate sustainable, high-quality development in the museum sector and beyond.
4.2. Discussion
To further contextualize the empirical findings of this study, we benchmark our results against two internationally recognized projects: the large-scale digital twin deployment at St. Peter’s Basilica (Vatican) and the smart energy-carbon management platform at the Deutsches Museum (Munich). Both cases exemplify state-of-the-art applications of digitalization and intelligent management in heritage and science museums.
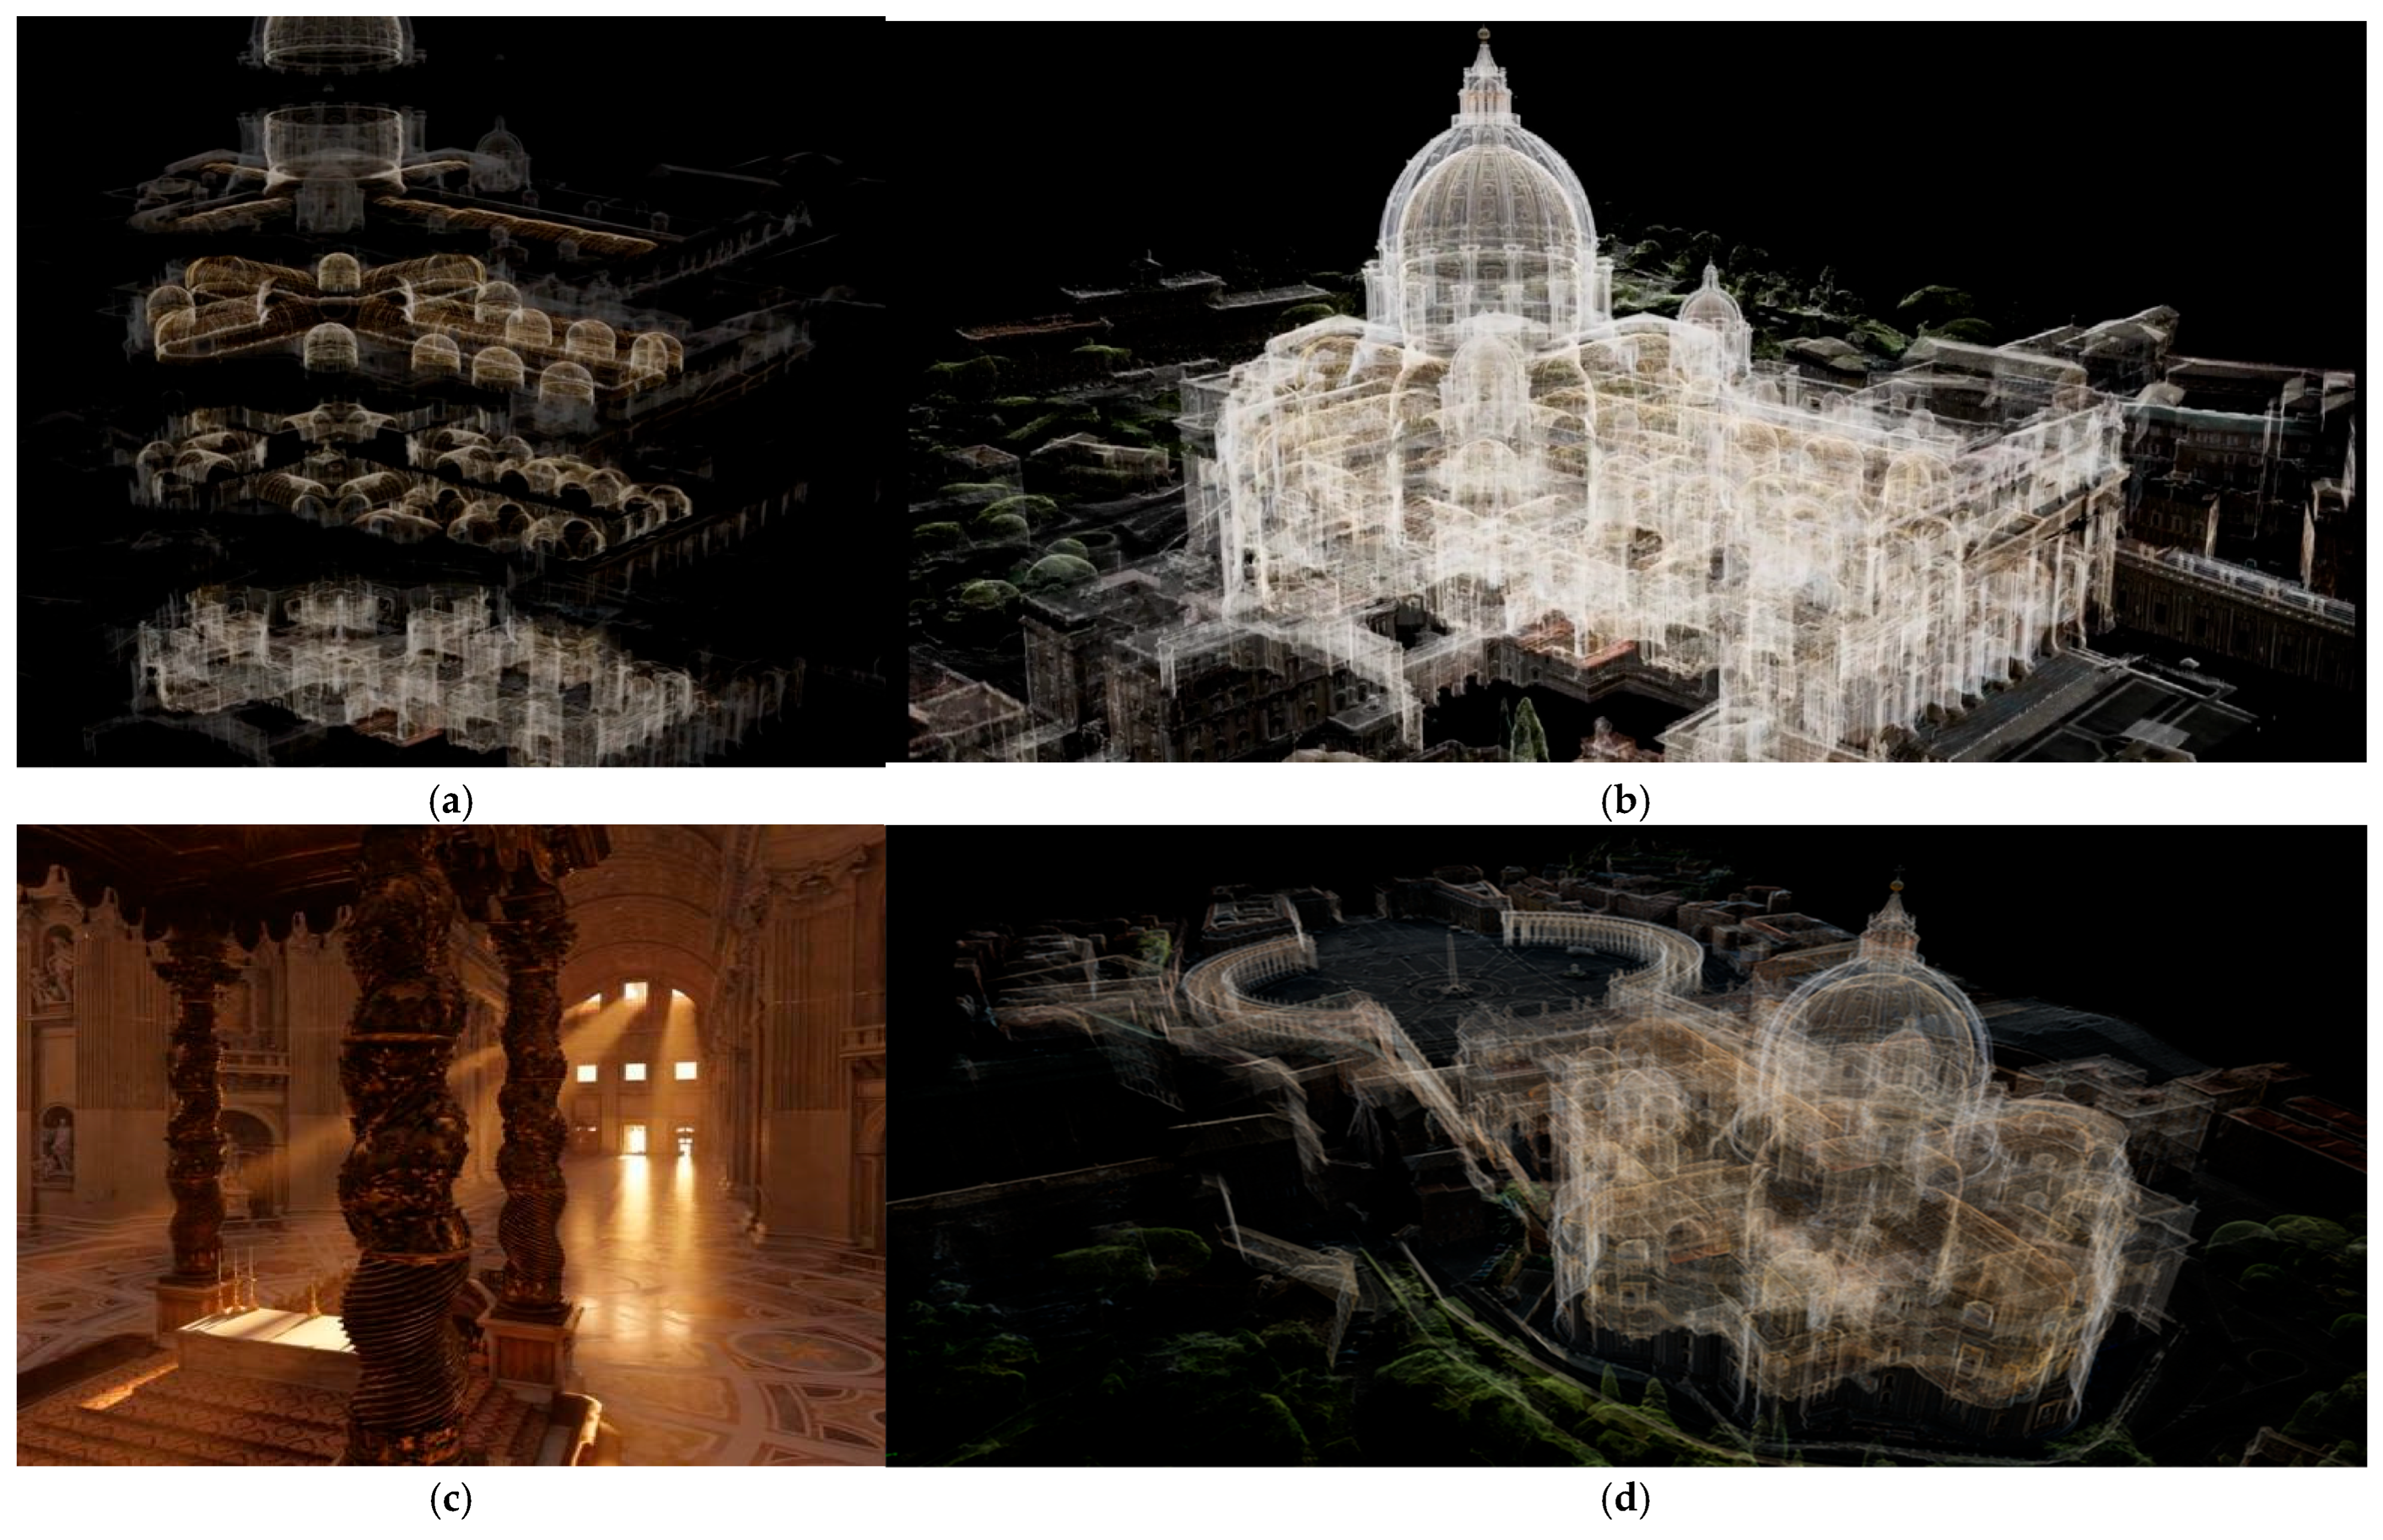
At St. Peter’s Basilica, a joint initiative with Microsoft established a comprehensive 3D digital twin framework incorporating real-time sensor networks and dynamic virtual-reality mapping of architectural, environmental, and visitor data (see
Figure 10). This system provided robust support for predictive maintenance, operational optimization, and immersive visitor engagement—outcomes closely aligned with those observed in our Case A and C scenarios [
29,
30]. In terms of Energy Use Intensity (EUI), St. Peter’s Basilica reported an approximate reduction of 14–18%, while our Case C achieved a more pronounced 36.7% decrease. CO
2 intensity reductions followed a similar trend, with the Basilica reaching approximately −15%, compared to −41.5% in Case C. Comfort improvements—measured through temperature stability and visitor satisfaction surveys—were moderate in the Basilica (about +7–9%), whereas Case C recorded +15.9%, reflecting the stronger effect of combined green energy integration and advanced AI optimization in our study.
Similarly, the Deutsches Museum’s integration of digital twin and AI for energy and carbon management (see
Table 4) resulted in significant improvements in EUI (−26%) and CO
2 intensity (−30%), paralleling the impact of large-scale green energy adoption and intelligent scheduling found in our Case B and C scenarios [
31]. Since the full deployment of the green intelligent management system, photovoltaic, and wind energy accounted for 35% of total energy consumption, response time for equipment maintenance was shortened by 60%, and operational safety and efficiency markedly improved. While the Deutsches Museum’s comfort enhancement (about +10%) was substantial, it remained lower than the +15.9% observed in Case C, indicating that higher renewable penetration (>45%) combined with real-time AI-based environmental control yields greater experiential benefits.
Overall, the benchmark comparison highlights that our integrated approach—blending high renewable penetration, advanced AI, and full digital twin functionality—consistently outperforms partial strategies in both operational and experiential metrics. The magnitude of improvement in EUI and CO2 intensity in Case C, relative to these international benchmarks, underscores the added value of full-system integration over segmented technological adoption.
These international cases both reinforce and validate our main conclusions: (1) intelligent digital platforms deliver strong operational gains, (2) green energy integration is essential for low-carbon transition, and (3) maximum benefit is realized only through the holistic, synergistic application of digital twin, AI, and renewables. The cross-validation highlights the global applicability of the integrated model advanced in this research, while also pointing to future directions for continuous optimization and standardization in the field.
4.3. The Main Deficiencies of the Current System and the Direction of Improvement
The sustainable development path of museum energy management remains to be further explored. Practice shows that, due to the special functional positioning of museums, their main energy-consuming systems primarily serve research, collection, conservation, and exhibition interpretation. These functions involve the need for uninterrupted 24 h constant temperature and humidity control for artifact preservation. Consequently, in order to meet the unique environmental requirements of collections, environmental control is often prioritized over energy management. Furthermore, although technological measures for energy conservation are an important means to enhance energy efficiency in museums, a key challenge remains as follows: how to start from management mechanisms and establish an energy management system tailored to the specific characteristics of museums. Such a system should enable the continuous discovery and rapid resolution of problems through systematic, intelligent, and standardized management processes, thereby unlocking greater potential for energy saving and carbon reduction in the pursuit of sustainable development.
Although research has achieved progress in areas such as comprehensive digital twin modeling, real-time AI optimization algorithms, and integrated energy–carbon management mechanisms, there are still challenges related to the seamless integration of multi-source heterogeneous data, closed-loop real-time control responses, standardized interfaces, and system security. Moving forward, efforts should focus on advancing standardized data interfaces, promoting the deep integration of AI with domain expertise, and strengthening cross-platform coordination between green energy and intelligent management systems. This will lay a solid foundation for ongoing innovation and large-scale implementation across the museum sector.
It should also be acknowledged that the empirical analysis in this study was based on three museums located in the same country, without the inclusion of an external control group. This limitation may influence the generalizability of the findings to different climatic, operational, and cultural contexts. Future studies could expand the sample to include a broader range of institutions, particularly museums with more stringent conservation requirements, such as certain European cases discussed by Müller (2013), to validate the applicability of the “triple integration” approach under diverse environmental and operational constraints. Broader sampling would also enable a more robust benchmarking framework, providing deeper insights into cross-regional differences in energy performance, carbon reduction potential, and environmental compliance within the global museum sector. Moreover, the scalability of the proposed triple integration framework may be constrained by practical barriers, such as the high initial capital investment, limited technical expertise, and operational disruption during retrofitting—factors that can be particularly challenging for small and medium-sized museums with constrained budgets and resources. Addressing these barriers through modular deployment strategies, targeted subsidies, and capacity-building programs could enhance the feasibility and broader adoption of the approach.
