Article

Scalable Data-Driven EV Charging Optimization Using HDBSCAN-LP for Real-Time Pricing Load Management

1
Electrical Cluster, School of Engineering, UPES, Dehradun 248007, India
2
Department of Management & Innovation Systems, University of Salerno, 84084 Fisciano, Italy
3
Department of Electrical and Electronic Engineering Science, University of Johannesburg, Johannesburg 2006, South Africa
*
Authors to whom correspondence should be addressed.
Smart Cities 2025, 8(4), 139; https://doi.org/10.3390/smartcities8040139
Submission received: 6 June 2025 / Revised: 21 July 2025 / Accepted: 18 August 2025 / Published: 21 August 2025

Abstract

Highlights

What are the main findings?
  • Advanced Behavioral Segmentation: HDBSCAN segmented 72,856 EV charging sessions into nine clusters (Davies-Bouldin score: 0.355, noise: 1.62%), capturing temporal and seasonal patterns.
  • Enhanced Load Optimization: HDBSCAN-LP integration with RTP achieved 23.10–25.41% peak load reductions (321.87–555.15 kWh) and 2.87–5.31% cost savings ($27.35–$50.71), improving load factors by up to 17.14%.
What is the implication of the main finding?
  • Provides a scalable, data-driven approach for precise EV load management adaptable to seasonal and behavioral dynamics, enhancing grid stability and economic efficiency.
  • Enables utility planners and policymakers to implement targeted and effective demand-response strategies, supporting sustainable urban energy transitions.

Abstract

The fast-changing scenario of the transportation industry due to the rapid adoption of electric vehicles (EVs) imposes significant challenges on power distribution networks. Challenges such as dynamic and concentrated charging loads necessitate intelligent demand-side management (DSM) strategies to ensure grid stability and cost efficiency. This study proposes a novel two-stage framework integrating Hierarchical Density-Based Spatial Clustering of Applications with Noise (HDBSCAN) and linear programming (LP) to optimize EV charging loads across four operational scenarios: Summer Weekday, Summer Weekend, Winter Weekday, and Winter Weekend. Utilizing a dataset of 72,856 real-world charging sessions, the first stage employs HDBSCAN to segment charging behaviors into nine distinct clusters (Davies-Bouldin score: 0.355, noise fraction: 1.62%), capturing temporal, seasonal, and behavioral variability. The second stage applies linear programming optimization to redistribute loads under real-time pricing (RTP), minimizing operational costs and peak demand while adhering to grid constraints. Results demonstrate the load optimization by total peak reductions of 321.87–555.15 kWh (23.10–25.41%) and cost savings of $27.35–$50.71 (2.87–5.31%), with load factors improving by 14.29–17.14%. The framework’s scalability and adaptability make it a robust solution for smart grid integration, offering precise load management and economic benefits.

1. Introduction

1.1. Background and Problem Context

The electrification of transportation stands as a pivotal strategy in the global pursuit of climate resilience, clean energy adoption, and sustainable urban development. With rising concerns over greenhouse gas emissions, energy security, and urban air pollution, electric vehicles (EVs) have emerged as a transformative solution across developed and developing economies. Forecasts by international agencies project that EVs will constitute 30–40% of global vehicle sales by 2030, with even higher adoption rates in technologically advanced regions such as Europe, North America, and East Asia [1]. While this transition offers significant environmental benefits, including reduced greenhouse gas emissions, it places unprecedented demands on power distribution networks, challenging their capacity, reliability, and operational efficiency [2]. EV charging loads are highly variable and clustered, typically peaking in the evening alongside residential demand, leading to transformer overloads, feeder congestion, voltage issues, and frequency instability. This issue intensifies in urban areas with dense, unpredictable charging demand. Integrating intermittent renewables such as solar and wind further complicates grid management, as renewable generation peaks midday while EV demand peaks later, creating significant supply–demand mismatches [3]. Without effective demand-side management (DSM), utilities are forced to rely on costly grid reinforcements or fossil-fuel-based “peaker” plants, undermining the sustainability goals that EV adoption aims to support. Complicating this further is the seasonal variability in EV charging behaviors, particularly in countries with significant climatic differences between summer and winter. In colder regions, EVs consume more energy per kilometer due to battery inefficiencies and heating requirements, resulting in more frequent or prolonged charging sessions [4]. Simultaneously, behavioral heterogeneity among users, shaped by work schedules, weekend routines, and public charging access, creates a non-uniform and stochastic demand profile that traditional deterministic models fail to capture adequately. Urban topology and socio-economic factors also influence the distribution of EV chargers and usage patterns, further diversifying load characteristics. For example, commercial areas may experience high daytime charging, while residential zones may peak during evening hours. These dynamics highlight the inadequacy of one-size-fits-all strategies for EV load management and underscore the need for data-driven, context-sensitive, and scalable solutions.
To address these multifaceted challenges, this study proposes a novel two-stage optimization framework that combines unsupervised learning via HDBSCAN (Hierarchical Density-Based Spatial Clustering of Applications with Noise) for charging pattern discovery with linear programming (LP) for real-time load redistribution. The framework captures the spatiotemporal variability, behavioral diversity, and seasonal dynamics inherent in EV load profiles by leveraging a large-scale dataset of 72,856 real-world EV charging sessions, collected over an entire year in South Korea. This holistic approach models user-centric charging behavior and enables cost-effective demand response (DR) under real-time pricing (RTP) regimes, facilitating grid-friendly charging schedules. Ultimately, the goal is to ensure grid stability, economic efficiency, and scalability, offering a blueprint for utility planners, policymakers, and smart grid architects to navigate the complexities of mass EV adoption sustainably and resiliently.

1.2. Literature Survey

The rapid rise in electric vehicle (EV) adoption has intensified the need for advanced demand-side management (DSM) strategies to mitigate the impact of dynamic and clustered charging loads on power distribution systems. This necessitates intelligent charging coordination to ensure grid stability while promoting sustainable mobility. Recent research has explored DSM frameworks, optimization techniques, and data-driven approaches for EV-grid integration. Yet, critical gaps remain in behavioral segmentation, seasonal demand adaptation, and balancing user heterogeneity with system constraints. This review synthesizes key contributions, critically evaluates their limitations, and positions this two-stage HDBSCAN-LP framework, leveraging 72,856 real-world charging sessions, as a comprehensive solution. Foundational work by Palensky and Dietrich [5] established a taxonomy of DSM strategies, including energy efficiency, time-of-use (ToU) pricing, and fast-response demand response (DR) programs, emphasizing their role in aligning consumption with grid capacity. However, their framework lacks data-driven methods to tailor interventions to diverse user behaviors. Mohanty et al. [6] extended this by surveying DSM strategies for EVs, covering load shaping and vehicle-to-grid (V2G) participation. Their reliance on deterministic models limits adaptability to heterogeneous charging patterns, a gap that this clustering-based approach addresses. Smart grid integration is critical for reliability under high EV penetration. Sultan et al. [7] reviewed EV–smart grid integration, focusing on resilience and infrastructural scalability, but overlooked temporal demand variations and user-specific behaviors. Bhatti et al. [8] analyzed centralized and decentralized energy management schemes, highlighting aggregator roles in load coordination. Their omission of behavioral segmentation restricts DR precision, which this framework enhances through cluster-specific optimization. Data-driven methods have gained traction in capturing charging behavior variability. Gerritsma et al. [9], using Dutch charging data, demonstrated that 59% of EV demand can be shifted by over eight hours, revealing significant flexibility. Their simulation-based approach lacks user segmentation, limiting targeted DR. Yang et al. [10] examined seasonal demand shifts using GPS trajectories of 2658 vehicles in Beijing, noting increased winter charging at lower states of charge. Their analysis, while insightful, does not operationalize these findings into optimization frameworks.
Recent studies on cybersecurity and resilience further inform this work. Naderi and Asrari [11] propose a remedial action scheme using distribution-level market operators to mitigate FDI-induced congestion, validated on the IEEE 33-bus system, highlighting adaptive defense needs. Naderi and Asrari [12] demonstrate FDI causing voltage collapse and frequency unbalance, underscoring risks to load optimization. Chhetri et al. [13] explore battery energy storage systems (BESS) to mitigate cascading failures from FDI, suggesting integrated storage as a resilience strategy. These additions complement the framework’s focus on clustering-based optimization and address potential cyber threats.
Optimization techniques have evolved to address EV charging’s spatio-temporal complexity. Elghanam et al. [14] reviewed deterministic methods such as linear programming (LP) and mixed integer programming (MIP) for scheduling and routing, which excel with static profiles but struggle with real-time variability. Sayarshad [15] proposed a routing-aware charging model integrating power market signals and renewable forecasts, but its homogeneous demand assumption reduces applicability. Sortomme and El-Sharkawi [16] used LP for unidirectional V2G scheduling, achieving cost-effective load balancing, yet their fixed commuter patterns limit adaptability. Machine learning (ML) and artificial intelligence (AI) have enhanced EV charging operations. Carrasco and Hernandez-del-Valle [17] validated Hierarchical Density-Based Spatial Clustering of Applications with Noise (HDBSCAN) for noisy, high-dimensional datasets, supporting demand segmentation. Kreft et al. [18] analyzed 59,000 residential charging sessions, confirming overnight charging predictability and user heterogeneity, but did not integrate these into optimization loops. Çakıl and Aksoy [19] developed a reinforcement learning-based energy management system with user priorities and real-time pricing (RTP), achieving 66.4% cost reductions, though lacking cluster-level customization. Hassan [20] proposed a hybrid ML approach for hybrid EV charging in microgrids, reaching 1.02% MAPE, but without behavioral segmentation. Paudel et al. [21] utilized LEAP-based energy forecasting to examine Thailand’s EV promotion roadmap, analyzing its impact on energy demand, peak load, and emissions. Their model highlighted grid stress risks under high EV penetration and emphasized public fast-charging as a viable load-levelling approach. However, their scenario framework lacks fine-grained temporal EV behavior and user-driven coordination, which this paper addresses through HDBSCAN clustering of session data. Aldossary [22] introduced the Coati-Northern Goshawk Optimization (Coati-NGO) algorithm, reducing fleet travel distances to 511 km, outperforming Particle Swarm Optimization (919 km) and the Firefly Algorithm (914 km). This hybrid approach excels in dynamic route optimization using real-time IoT data, addressing real-time variability limitations. However, it does not explicitly incorporate seasonal demand shifts, a gap addressed by the proposed framework’s temporal adaptability.
Infrastructure planning and charging station optimization are also key research areas. Muthusamy et al. [23] applied the Honey Badger Optimization Algorithm for station siting, reducing CO2 emissions by 66%, but neglected temporal load management. Singh et al. [24] introduced an AI-integrated blockchain architecture for decentralized load balancing, achieving 20% peak reduction, yet overlooked seasonal variations. Xu et al. [25] developed a clean energy dispatch model using LSTM-based forecasting, improving utilization by 23%, but assumed uniform demand. Recent studies address some limitations through advanced data-driven methods. Fescioglu-Unver and Aktaş [26] reviewed ML applications, noting a gap in combining segmentation with DR optimization. Panda et al. [27] proposed a residential DSM framework using Binary Whale Optimization, integrating EVs as dynamic storage, but lacked behavioral segmentation. Tan et al. [28] introduced a road-grid simulation framework using differential evolution, yet without pre-clustering. Jauhar et al. [29] developed an AI/ML forecasting system, but its lack of seasonal or behavioral clustering limits DR applicability. Fayyazbakhsh et al. [30] validated their models on Austrian grid data, demonstrating robustness in peak capture. Still, their focus on aggregate forecasting overlooks station-specific optimization, a gap addressed by the proposed framework’s cluster-specific approach.

1.3. Research Gaps and Proposed Contributions

Despite advancements in electric vehicle (EV) charging optimization, critical deficiencies in existing approaches limit their scalability and adaptability for modern power distribution systems. Three persistent research gaps undermine effective demand-side management (DSM) and intelligent charging coordination:
(i)
The absence of clustering-based demand profiles in optimization frameworks restricts tailored interventions for diverse user behaviors, as in deterministic models.
(ii)
Inadequate adaptation to seasonal and temporal charging variations, essential for aligning loads with grid conditions, is often overlooked in static analyses.
(iii)
Insufficient balance between aggregator constraints, such as grid capacity and charger scheduling requirements, and user heterogeneity, leading to suboptimal load balancing in real-world scenarios. These gaps necessitate a robust, data-driven framework to dynamically optimize EV charging, ensuring grid stability, cost efficiency, and user satisfaction.
This study proposes a novel two-stage framework integrating Hierarchical Density-Based Spatial Clustering of Applications with Noise (HDBSCAN) and linear programming (LP), validated on a dataset of 72,856 real-world charging sessions from South Korea, a region with rapid EV adoption and widespread real-time pricing (RTP) implementation. In the first stage, HDBSCAN segments charging sessions into nine distinct behavioral clusters (Davies-Bouldin Cluster Validity score: 0.355, noise fraction: 1.62%), capturing temporal, seasonal, and behavioral variability across four operational scenarios: Summer Weekday, Summer Weekend, Winter Weekday, and Winter Weekend. This clustering ensures precise demand characterization, unlike prior studies, which assume homogeneous demand [13]. In the second stage, an LP-based model redistributes loads under RTP to minimize operational costs and peak demand while adhering to grid and charger constraints. Leveraging cluster-specific demand response (DR) potentials (4304.54–10,606.65 kWh), the framework achieves peak reductions of 321.87 kWh (Summer Weekday, 23.10%) to 555.15 kWh (Winter Weekday, 24.22%) and cost savings of $27.35 (Summer Weekday, 2.87%) to $50.71 (Winter Weekday, 5.31%). These results outperform deterministic and simulation-based approaches by adapting to seasonal shifts, such as higher winter demands, and balancing aggregator and user needs, as evidenced by Winter Weekday’s 555.15 kWh/day DR potential and Summer Weekend’s 4.12% cost savings through effective load shifting.
The novelty of this study lies in its pioneering integration of HDBSCAN and LP, offering a scalable framework for intelligent EV charging coordination that surpasses limitations of prior methods, such as reinforcement learning’s computational complexity or LSTM’s uniform demand assumptions. HDBSCAN’s ability to handle noisy, high-dimensional data enables precise behavioral segmentation, while LP ensures efficient optimization under RTP, setting this approach apart from deterministic or simulation-based models. This dual-stage methodology delivers three key contributions:
  • Cluster-Specific Load Management: Pioneers HDBSCAN-derived demand profiles within optimization loops, enabling tailored DR strategies that outperform non-segmented models, as demonstrated by Winter Weekday’s 250 kW load shift within its 555.15 kWh/day DR limit.
  • Seasonal and Temporal Adaptation: Achieves robust adaptation to charging variability through scenario-based profiling, yielding peak reductions of 321.87–555.15 kWh (23.10–25.41%) across diverse conditions, surpassing studies lacking dynamic modelling.
  • Scalable Operational Feasibility: Balances grid capacity, charger constraints, and user heterogeneity under RTP, improving load factors by 14.29–17.14% (e.g., Summer Weekday: 0.70 to 0.82) and securing cost savings of $27.35–$50.71 (2.87–5.31%).
By integrating cluster-specific DR potentials into LP optimization, this framework establishes a promising standard for EV load management systems, pending further validation across diverse grid contexts, offering a practical solution for sustainable EV integration.

1.4. Organization of the Paper

This paper systematically presents the development, implementation, and evaluation of the proposed HDBSCAN-LP framework for EV charging optimization. Section 2 details the methodology, describing the two-stage approach: Pattern Identification and Load Profiling using HDBSCAN, followed by Load Optimization and Demand Response via LP, applied across four operational scenarios. Section 3 presents the results and discussion, analyzing the framework’s performance through quantitative metrics, such as peak load reductions and cost savings, and qualitative visualizations across seasonal and temporal scenarios, supported by a real-world dataset of 72,856 charging sessions. Section 4 concludes the study, summarizing key findings, contributions, and limitations, while outlining future research directions, including integration with renewable energy sources and dynamic DR participation. The paper concludes with a comprehensive list of references, providing the theoretical and empirical foundation for the study.

2. Methodology

The Methodology section outlines the two-stage framework for optimizing electric vehicle (EV) charging loads to achieve demand response (DR) objectives. The first stage, Pattern Identification and Load Profiling, uses Hierarchical Density-Based Spatial Clustering of Applications with Noise (HDBSCAN) to cluster charging behaviors and generate generalized load profiles. The second stage, Load Optimization and Demand Response, employs linear programming (LP) to redistribute these loads under real-time pricing (RTP) constraints, minimizing operational costs and peak demand. The framework is evaluated across four scenarios—Summer Weekday, Summer Weekend, Winter Weekday, and Winter Weekend—defined by seasonal intervals (Summer: June–October; Winter: November–May) and day types (Weekday: Monday–Friday; Weekend: Saturday–Sunday) [9]. These scenarios capture spatiotemporal variability in charging patterns, ensuring the framework addresses diverse operational conditions. Figure 1 encapsulates the flowchart of the methodology used in this work, linking data preprocessing, clustering, profiling, optimization, and validation.

2.1. Pattern Identification and Load Profiling

This stage identifies and classifies EV charging patterns to support the optimization process. A dataset of 72,856 real-world charging sessions, collected over a year, is preprocessed to create a feature space for clustering. Each session record includes the start time (StartDatetime), end time (EndDatetime), duration (in minutes), and energy demand (in kWh). Temporal features are derived by mapping each session to a season (Summer or Winter) and day type (Weekday or Weekend) using datetime transformations. These parameters are preprocessed to construct a feature space X ∈ ℝ7, where N is the number of sessions. Temporal categorization maps each record a season and day type via datetime transformations, leveraging periodic functions to model behavioral periodicity as demonstrated in time series analysis [31]. The feature vector for session i is defined in Equation (1):
x i = sin 2 π h i 24 , cos 2 π h i 24 , l o g 1 + D d u r a t i o n , i 60 , log 1 + D d u r a t i o n , i , I w e e k d a y , i , I w i n t e r , i , B i T
where hi is the start hour, Iweekday,i = 1 if Weekday (else 0), Iwinter,i = 1 if Winter (else 0), and Bi = {0,1,2} is the time block based on TOU periods (e.g., Summer: Bi = 2 for hi ∈ [13,17), Bi = 1 for hi ∈ [9,13) ∪ [17,22), else Bi = 0) [32]. Cyclical encoding with sine and cosine functions ensures temporal continuity across the 24-h cycle, as validated in time-series analysis, while logarithmic transformations normalize skewed distributions, a common preprocessing technique in energy data analysis [33]. Real-world variability is simulated by perturbing start times with ΔtiU (−60,60) minutes and demand with ηiU (0.9,1.1), yielding perturbed features hi = hi + Δti/60 and D’demand,i = Ddemand,i. ηi, is a method validated for robustness in EV load modeling. The feature matrix is normalized in Equation (2):
X norm = X μ X σ X
where μX and σX are the mean and standard deviation across features, ensuring scale invariance [34].
Clustering employs Hierarchical Density-Based Spatial Clustering of Applications with Noise (HDBSCAN), selected for its ability to detect non-spherical, variable-density clusters and isolate noise, outperforming Euclidean-based methods such as k-means [17]. HDBSCAN constructs a mutual reachability distance graph on Xnorm, as shown in Equation (3):
d mr x i , x j = max d k x i , d k x j , | | x i x j | | 2
where d k x i is the distance to the k-th nearest neighbor (k = msamp ∈ {5,10,15}) and ∥⋅∥2 is the Euclidean norm [35]. Clusters are extracted via the Excess of Mass (EOM) method, with minimum cluster size mclust ∈ {120,140,160,180}, optimized by maximizing the Davies-Bouldin Cluster Validity (DBCV) score, given by Equation (4):
DBCV = 1 K i = 1 K max j i σ i + σ j d c i , c j
where K is the number of clusters, σi is intra-cluster dispersion, and d c i , c j = c ¯ i c ¯ j 2, targeting 8–14 clusters with noise fraction ∣ {i:Li = −1} ∣/N < 0.15 [17]. The resulting labels L∈ {−1, 0, …, K − 1} facilitate cluster analysis, with energy-specific applications demonstrated in [10]. DR potential and shift windows quantify load flexibility. The DR potential Dc (in kWh) for cluster c is given by Equation (5):
D c = 1 N c i c D demand , i W c F c
where Wc is the shift window, and Fc = 1 + 0.2⋅Rw with Rw adjusted for higher winter demand [16]. This aligns with findings that 59% of EV demand is shiftable over 8 h. [9]. The shift window is given by Equation (6):
W c = min max 1 N c i C c t end , i t start , i , 4 , 8
where 12 h reflects the typical parking duration, bounded by 4–8 h, based on scheduling feasibility [32,36].
Generalized load profiles for each scenario are derived via weighted aggregation. Per-day session counts Scat = Ncat/Dcat are computed, where Ncat is the total sessions and Dcat is the unique days [37]. The hourly load Lgen(t) (kW) is shown in Equation (7):
L gen t = c = 1 K w c L c t α cat ,
where P c , i = D demand ,   i D duration , i 60 is the charging power (in kW) for the session i in cluster c , calculated as the perturbed energy demand D demand ,   i (in kWh), divided by the perturbed charging duration D duration ,   i (in minutes), and converted to hours by dividing by 60. The indicator function I t h i , h i + D duration , i   60 equals 1 if hour t falls within the perturbed charging interval [ h i , h i +   D duration , i , 60 ] for session i , and 0 otherwise, effectively allocating the session’s power to the appropriate time slots. The scaling factor α cat   is defined by Equation (8):
α c a t = p e r c e n t i l e 95 L r a w , c a t p e r c e n t i l e 95 c = 1 K     w c L c
Here, percentile95  L raw , cat is the 95th percentile of the raw load profile for the category, capturing its peak demand, while percentile95  c = 1 K     w c L c is the 95th percentile of the aggregated cluster loads before scaling, ensuring that the generated profile’s peak aligns with observed data to maintain fidelity [10].

2.2. Load Optimization and Demand Response

This stage optimizes electric vehicle (EV) charging loads in South Korea to minimize costs and peak demand, leveraging cluster-derived profiles and demand response (DR) capabilities tailored to South Korean seasonal patterns and pricing schemes. Baseline loads are generated stochastically using a Monte Carlo simulation over M = 500 iterations to account for uncertainty. Arrivals follow a Weibull distribution, A m ( t )   W e i b u l l k = 2 , λ = S m a x / Γ 1 + 1 2 [9,38], and state-of-charge S O C m t U 0.2,0.8 , reflecting battery variability and base load, is computed as Equation (9):
L b g ( t ) = 1 M m = 1 M   L g e n ( t ) 1 + ϵ m ( t ) , ϵ m ( t ) N ( 0,0.1 )
The grid capacity is 15 MW, with background load Lbg(t) from South Korean utility profiles [39,40], and charger capacity is given by Equation (10):
C ( t ) = m i n S m a x , S ( t ) P c h a r
where S(t) is the number of active sessions at time t, and P c h a r reflects standard Level 2 charging.
To achieve efficient load management under real-time pricing (RTP), the optimization of electric vehicle (EV) charging loads is formulated as a linear programming (LP) problem, designed to minimize operational costs while ensuring effective demand response (DR) and grid stability. This LP approach enables precise control over charging schedules across multiple clusters, balancing economic objectives with technical constraints such as grid capacity and charger availability. By leveraging the RTP structure, which incentivizes load shifting to lower-priced hours, the model optimizes the temporal distribution of charging loads to reduce costs and mitigate peak demand, enhancing grid reliability and supporting sustainable energy systems. The objective function, presented in Equation (11), encapsulates the dual goals of cost minimization and peak load reduction:
min Z = t = 0 23 c = 0 C 1 x c , t P t + 0.01 R penalty
where:
R penalty   = m a x 0 , t T peak     L b ( t ) t T pakk     c = 0 C 1   x c , t 0.3 t T peak     L b ( t )
This term quantifies the shortfall in peak load reduction relative to a target of 30% of the baseline peak load during peak hours ( T peak ), where L b ( t ) is the baseline load at hour t. The expression t T peak     L b ( t ) t T pakk     c = 0 C 1   x c , t measures the actual peak reduction achieved by the optimised load x c , t compared to L b ( t ) , and the target reduction is set at 0.3⋅ t T peak     L b ( t ) reflects a practical yet ambitious goal for DR programs to alleviate grid stress during high-demand periods. The function ensures that only shortfalls incur a penalty, encouraging the model to achieve at least a 30% reduction, a threshold supported by studies demonstrating effective peak shaving in EV charging contexts [41]. By incorporating this penalty, the LP model aligns with the dual objectives of cost minimization and grid reliability, ensuring that economic benefits do not compromise the critical need to manage peak loads effectively.
The optimization is subject to constraints, which govern energy delivery, grid capacity, load continuity, DR flexibility, and infrastructure limits, ensuring a feasible and realistic charging schedule:
(a)
Energy Balance (Equation (13)): This ensures energy delivery stays within 20 % of E total , allowing DR flexibility while meeting demand, a tolerance typical in smart grid studies (10–25%) [5]:
1 δ E total   t = 0 23   c = 0 C 1   x c , t 1 + δ E total  
(b)
Grid Capacity (Equation (14)): The 15 MW cap reflects a medium-sized grid segment in South Korea, preventing overloads, consistent with EV integration studies (10–20 MW) [40,42]:
L b g ( t ) + c = 0 C 1   x c , t 15 , 000 , t
(c)
Load Continuity (Equation (15)): This balances load shifts proportionally across clusters, ensuring energy conservation, as per scheduling principles [41]:
x c , t = L c , t s = 0 23   s c , t , s + s = 0 23   s c , s , t ,             L c , t = L b ( t ) L c ( t ) c = 0 C 1     L c ( t )
(d)
DR Constraint (Equation (16)): Load shifts are capped at 10 12 % of D c , reflecting realistic DR participation rates (5–15%) [41]:
t = 0 23   s = 0 23   s c , t , s D c β c a t , β c a t { 0.10,0.12 }
(e)
Peak Load Cap (Equation (17)): A 15 % peak reduction mitigates grid stress, aligning with 10 20 % targets in DR literature [43]:
c = 0 C 1   x c , t 0.85 L b ( t ) ,   t T peak  
(f)
Non-Peak Load Limit (Equation (18)): The 150 % The limit prevents off-peak over-shifting, consistent with load management bounds (1.52) [44]:
c = 0 C 1   x c , t 1.5 c = 0 C 1   L c , t , t T peak  
(g)
Charger Capacity (Equation (19)): This reflects Level 2 charger limits, a standard in EV studies:
0 x c , t C ( t ) , c , t
(h)
Peak hours (as given by Equation (20)) are 11:00–17:00 for Summer (June–October) and 8:00–11:00 and 14:00–19:00 for Winter (November–May), consistent with load patterns [41,45]:
T p e a k = { t :   11 t 17 } ,                                                                               i f   S u m m e r { t :   8 t 11 }     { 14 t 19 } ,                   i f   W i n t e r
The optimized load profile, defined as in Equation (21), is evaluated to assess the effectiveness of the proposed demand response (DR) strategy in reducing peak loads, minimizing costs, and enhancing grid efficiency. Four key performance metrics are employed to quantify these outcomes, comprehensively evaluating the optimization model’s impact as shown in Equations (22)–(25):
L o p t ( t ) = c = 0 C 1   x c , t
Δ P m a x = m a x t T peak     L b t m a x t T peak     L o p t t
Δ P total   = t T peak     L b t L opt   t
Δ C = t = 0 23   L b t P t t = 0 23   L opt   t P t
L F = 1 24 t = 0 23     L opt   ( t ) m a x t   L opt   ( t )
These metrics evaluate the optimization’s impact on reducing peak demand, overall load management, cost efficiency, and distribution. The maximum peak reduction, ΔPmax, measures the difference between the highest baseline load Lb(t) and the highest optimized load Lopt(t) during peak hours (Tpeak), quantifying the model’s ability to mitigate the most critical grid stress points, a key objective in DR programs aimed at enhancing grid reliability. The total peak reduction, ΔPtotal, aggregates the load differences across all peak hours, providing insight into the cumulative energy shifted away from high-demand periods, directly contributing to reducing strain on grid infrastructure during peak times. Cost savings, ΔC, calculates the reduction in total charging costs by comparing the baseline load costs Lb(t)P(t) with the optimized load costs Lopt(t)P(t) over 24 h, reflecting the economic benefits of shifting loads to lower-priced hours under RTP, a central goal of smart charging strategies. Finally, the load factor, LF, defined as the ratio of the average optimized load to the maximum optimized load, indicates the smoothness of the load profile, with higher values signifying a flatter distribution that enhances grid stability and operational efficiency [41]. Together, these metrics provide a robust framework for assessing the model’s performance in achieving DR objectives, ensuring technical efficacy and economic viability.

3. Results

The proposed EV load optimization framework is evaluated using a real-world dataset comprising 72,856 charging sessions collected over a full year, encompassing four operational scenarios: Summer Weekday, Summer Weekend, Winter Weekday, and Winter Weekend. The methodology consists of two sequential stages: (i) behavioral pattern identification using unsupervised clustering, and (ii) demand reshaping through load optimization under real-time pricing (RTP) and grid capacity constraints. All data preprocessing, clustering, and optimization simulations were implemented using Python 3.8, leveraging libraries such as HDBSCAN for pattern discovery, Scikit-learn for feature engineering, and PuLP for solving the constrained linear programming problem. The results are analyzed through quantitative metrics, including peak load reduction, load factor improvement, energy cost savings, and qualitative visualizations. The evaluation confirms that the proposed framework effectively balances user-centric flexibility with grid-oriented objectives, enabling intelligent EV load coordination under realistic constraints.

3.1. Seasonal Background Load Analysis

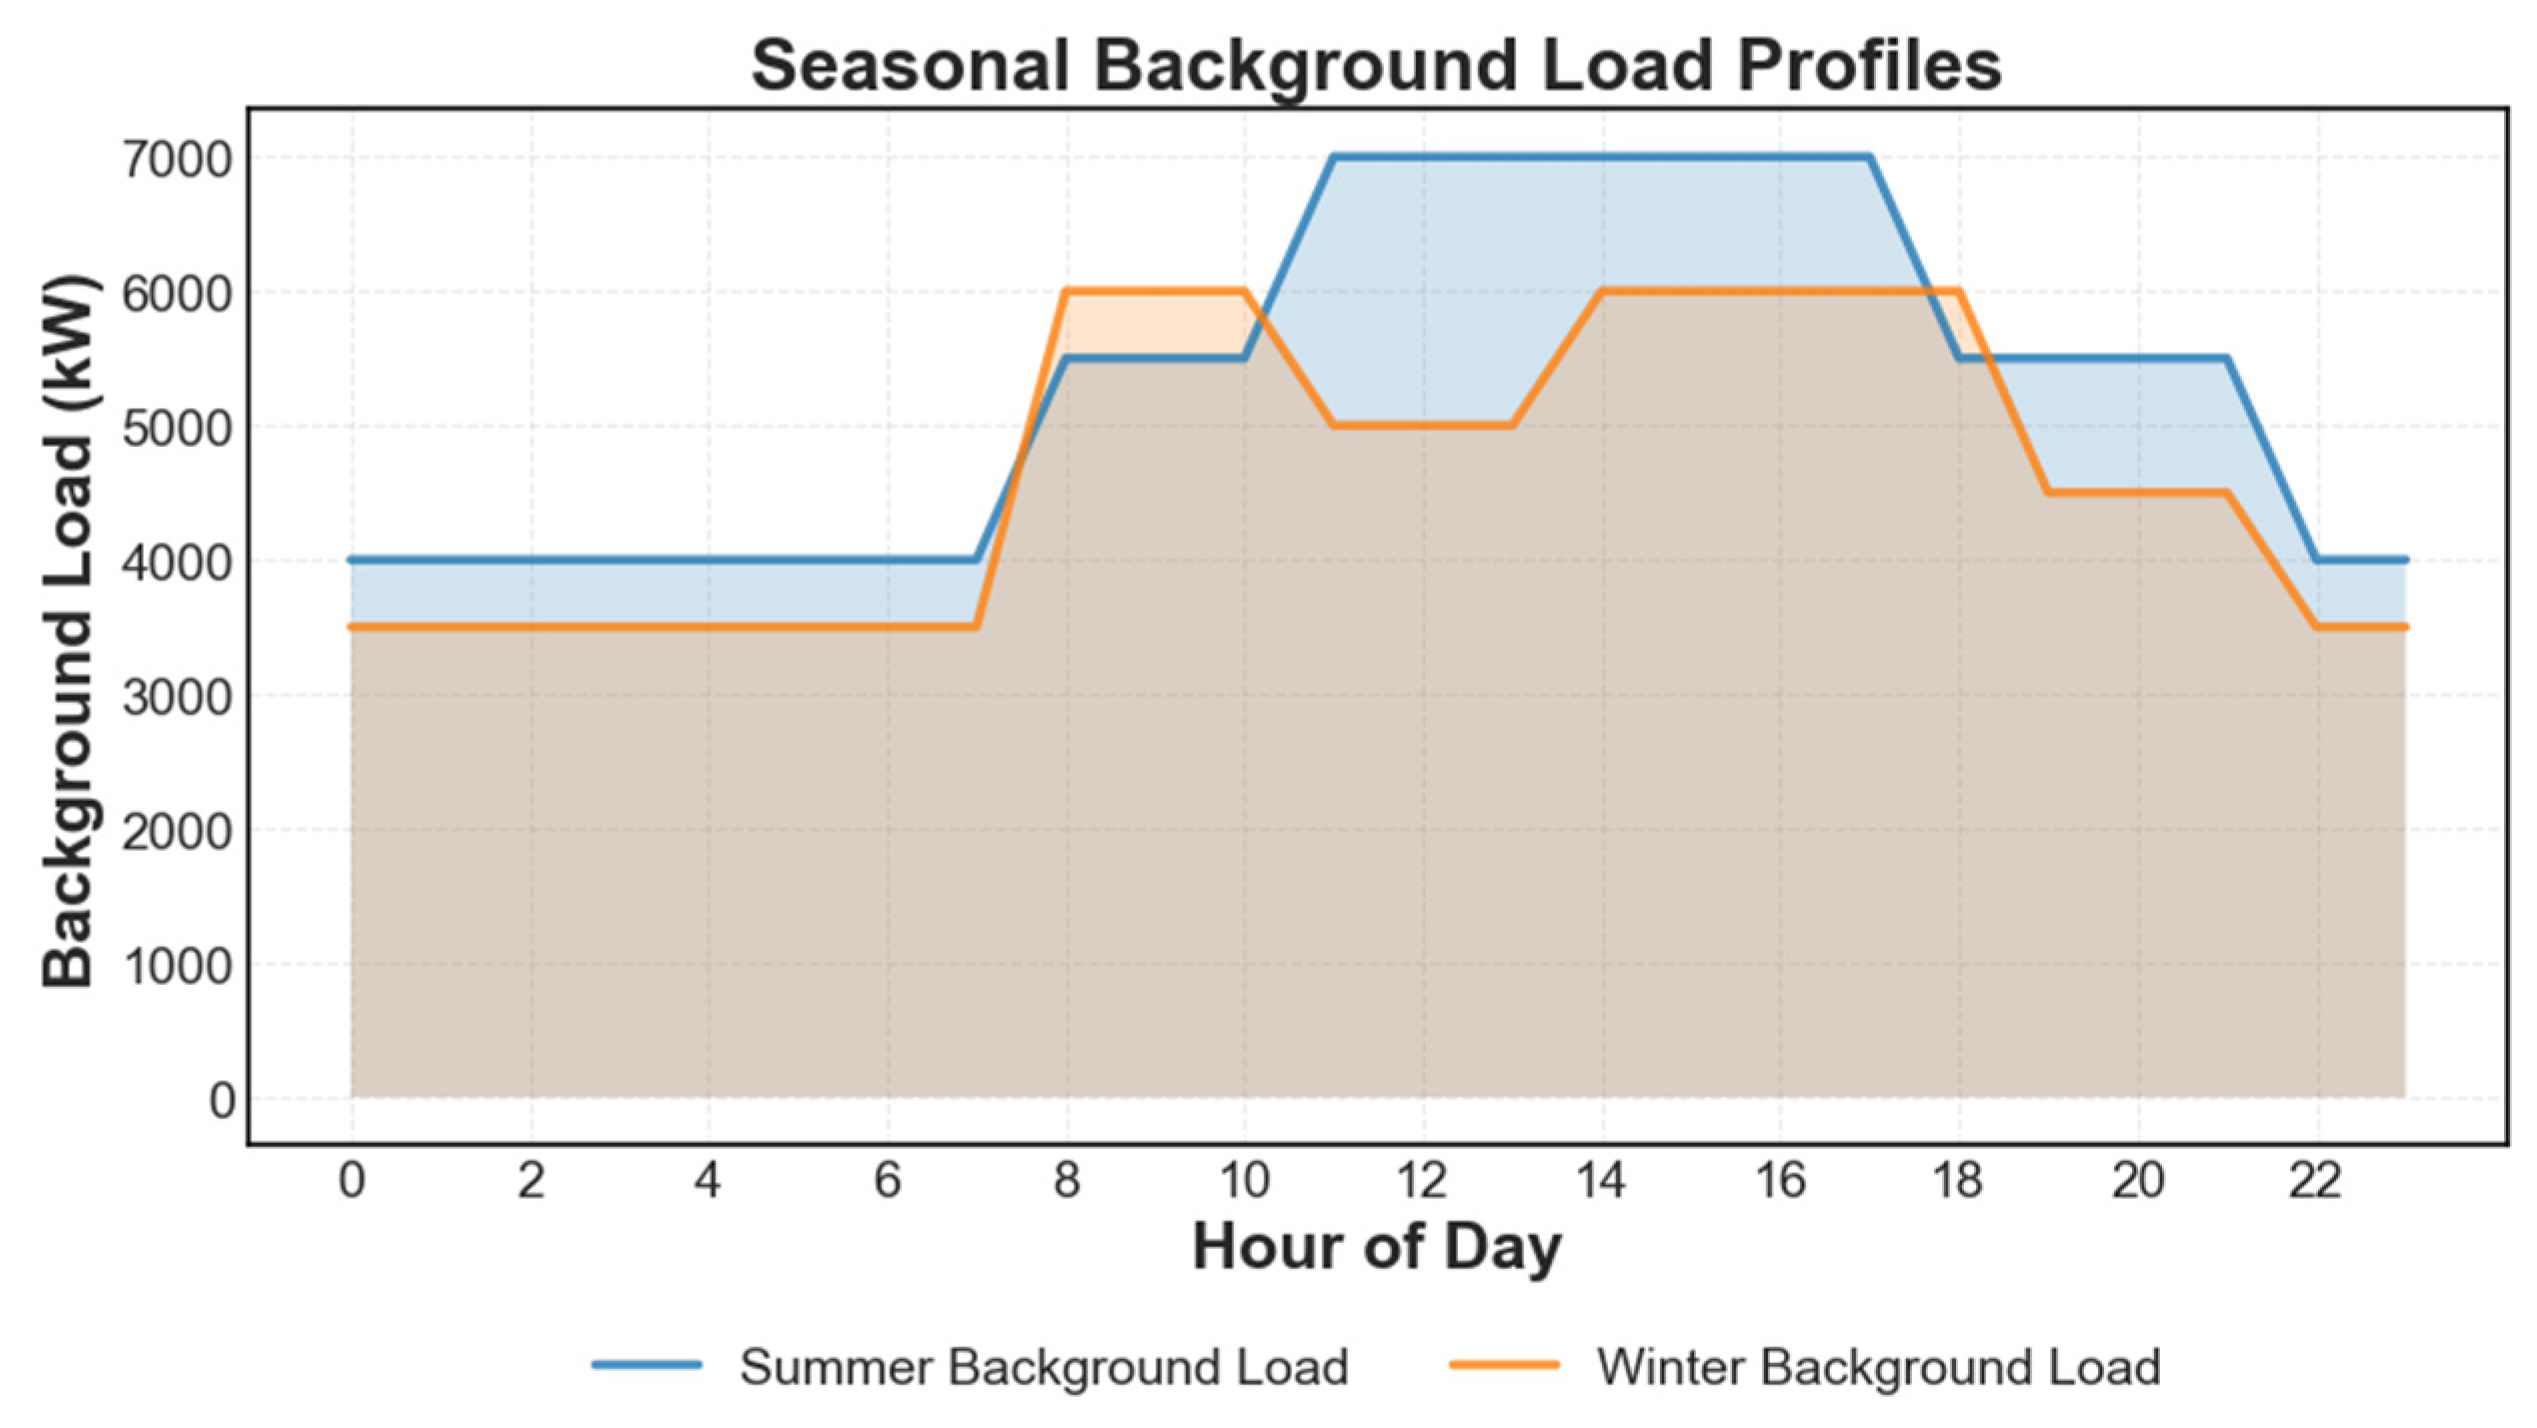
Evaluating the baseline grid load is crucial for understanding the feasibility of integrating EV charging loads, particularly in South Korea, where seasonal demand variations significantly impact grid dynamics. Figure 1 presents the seasonal background load profiles for a 15 MW grid, derived from a South Korean utility dataset encompassing 72,856 charging sessions collected over a full year [40]. The dataset captures four operational scenarios—Summer Weekday, Summer Weekend, Winter Weekday, and Winter Weekend—reflecting South Korea’s distinct seasonal load patterns driven by climatic and behavioral factors [45]. Quantitatively, the summer profile (June–October) exhibits a peak load of 7000 kW from 11:00 to 17:00, driven by elevated daytime demand from air conditioning loads prevalent in South Korea’s hot and humid summers. In contrast, the winter profile (November–May) peaks at 6000 kW from 14:00 to 18:00, reflecting increased demand for heating and lighting during colder months. Off-peak loads also vary seasonally: the summer baseline averages 4000 kW during the early morning and late-night hours (e.g., 0:00–8:00 and 20:00–23:00), while the winter baseline is lower at 3500 kW during the same periods, indicating a more sustained demand in warmer months due to higher baseline cooling needs. The summer profile’s extended peak period (11:00–17:00) coincides with typical EV charging patterns in South Korea, such as daytime workplace charging and early evening residential charging, which can exacerbate grid stress during these high-demand hours. This overlap poses significant challenges for grid stability, as the additional EV load could push the total demand closer to the 15 MW grid capacity limit. Conversely, the winter profile’s shorter peak window (14:00–18:00) offers greater flexibility for load shifting, as the post-peak evening hours (e.g., 18:00–21:00) see a rapid decline in background load, aligning well with residential charging periods where demand response (DR) strategies can be effectively applied. This seasonal analysis provides the foundation for the EV charging optimization framework in Section 2.2, which aims to balance grid constraints with user-centric flexibility under South Korea’s real-time pricing (RTP) structure. Figure 2 shows the South Korean-based grid system’s 24-h seasonal background (conventional) load profile.

3.2. EV Load Profiling and Clustering

This section of the study analyzes the EV charging session dataset [46], which enables understanding patterns and demand for charging in various locations. The dataset comprises charging sessions from South Korea, which include 2337 EV users, 2119 chargers, and 72,856 sessions. The dataset consists of 16 columns: ChargingSessionID, UserID, ChargerID, ChargerCompany, Location, ChargerType, ChargerCapacity, ChargerACDC, StartDay, StartTime, EndDay, EndTime, StartDatetime, EndDatetime, Duration, and Demand. The number of rows corresponds to the number of independent sessions, encompassing all charging sessions during commercial operations from 30 September 2021 to 30 September 2022. This dataset has been publicly available under the Creative Commons license CC BY 4.0 on the Figshare repository [46]. The authors provided raw data without preprocessing to allow for various research purposes. The raw dataset is cleaned to ensure data integrity and consistency. The pattern identification and load profiling stage employed Hierarchical Density-Based Spatial Clustering of Applications with Noise (HDBSCAN) to uncover distinct EV charging behavior patterns in South Korea. HDBSCAN identified nine clusters with a Davies-Bouldin Cluster Validity (DBCV) score of 0.355, indicating robust cluster separation (Equation (4)). Cluster sizes varied from 209 to 429 sessions, with noise points constituting only 1.62% (45 sessions), well below the acceptable threshold of 15%. The feature space, constructed per Equation (1) and normalized using Equation (2), captured temporal and behavioral variability across the four operational scenarios: Summer Weekday, Summer Weekend, Winter Weekday, and Winter Weekend. Principal Component Analysis (PCA) was applied to reduce dimensionality, with the first two components explaining 49.24% of the variance (eigenvalues: 0.2707, 0.2217). Cluster descriptions revealed distinct seasonal and temporal patterns; for example, Cluster 0 (Summer Weekend Morning Chargers, 387 sessions) had an average start hour of 14:32, reflecting daytime charging during leisure activities, while Cluster 2 (Winter Weekday Evening Chargers, 277 sessions) showed an average start hour of 18:38, aligning with after-work charging in South Korea’s winter months.
To justify the selection of HDBSCAN for clustering EV charging behaviors, we compared its performance with K-means, Gaussian Mixture Models (GMM), and DBSCAN on the dataset of 72,856 charging sessions, processed with cyclical encoding and normalization (Equations (1) and (2)). The feature space included start hour (sine/cosine), log-transformed duration and demand, weekday/season indicators, and time-of-use blocks. HDBSCAN (min_cluster_size = 120, min_samples = 10) achieved a Davies-Bouldin Cluster Validity (DBCV) score of 0.355, a silhouette score of 0.225, a Calinski-Harabasz (CH) score of 356.130, and a noise fraction of 1.62%, forming nine interpretable clusters (e.g., Summer Weekday Morning Chargers, Winter Weekday Evening Chargers). K-means (k = 9) yielded a silhouette score of 0.217 and a CH score of 514.720, but its spherical cluster assumption resulted in less meaningful clusters for non-linear temporal data. GMM (k = 9, full covariance, expectation-maximization) scored a silhouette of 0.206 and a CH score of 392.186, limited by its Gaussian assumption on skewed features (e.g., log-transformed durations). DBSCAN (best eps = 0.5, min_samples = 10, after tuning with eps = [0.3, 0.5, 0.7]) produced 25 clusters, a DBCV score of 0.244, a silhouette score of 0.007, a CH score of 93.059, and a noise fraction of 35.12%, indicating over-segmentation due to its fixed density threshold. Table 1 summarizes these results, confirming HDBSCAN’s superior performance due to its low noise, robust separation, and alignment with EV charging patterns.
The clustering process utilized parameters min_cluster_size = 120 and min_samples = 10 to balance cluster coherence and noise, resulting in clusters ranging from 209 to 429 sessions that reflect diverse EV charging behaviors across South Korea. The characteristics of these clusters, including average start hour, duration, demand, and inferred profiles (residential vs. commercial, peak vs. off-peak), are detailed in Table 2. These profiles, validated by DR potentials (4388.19–10,606.65 kWh), underpin the optimization outcomes.
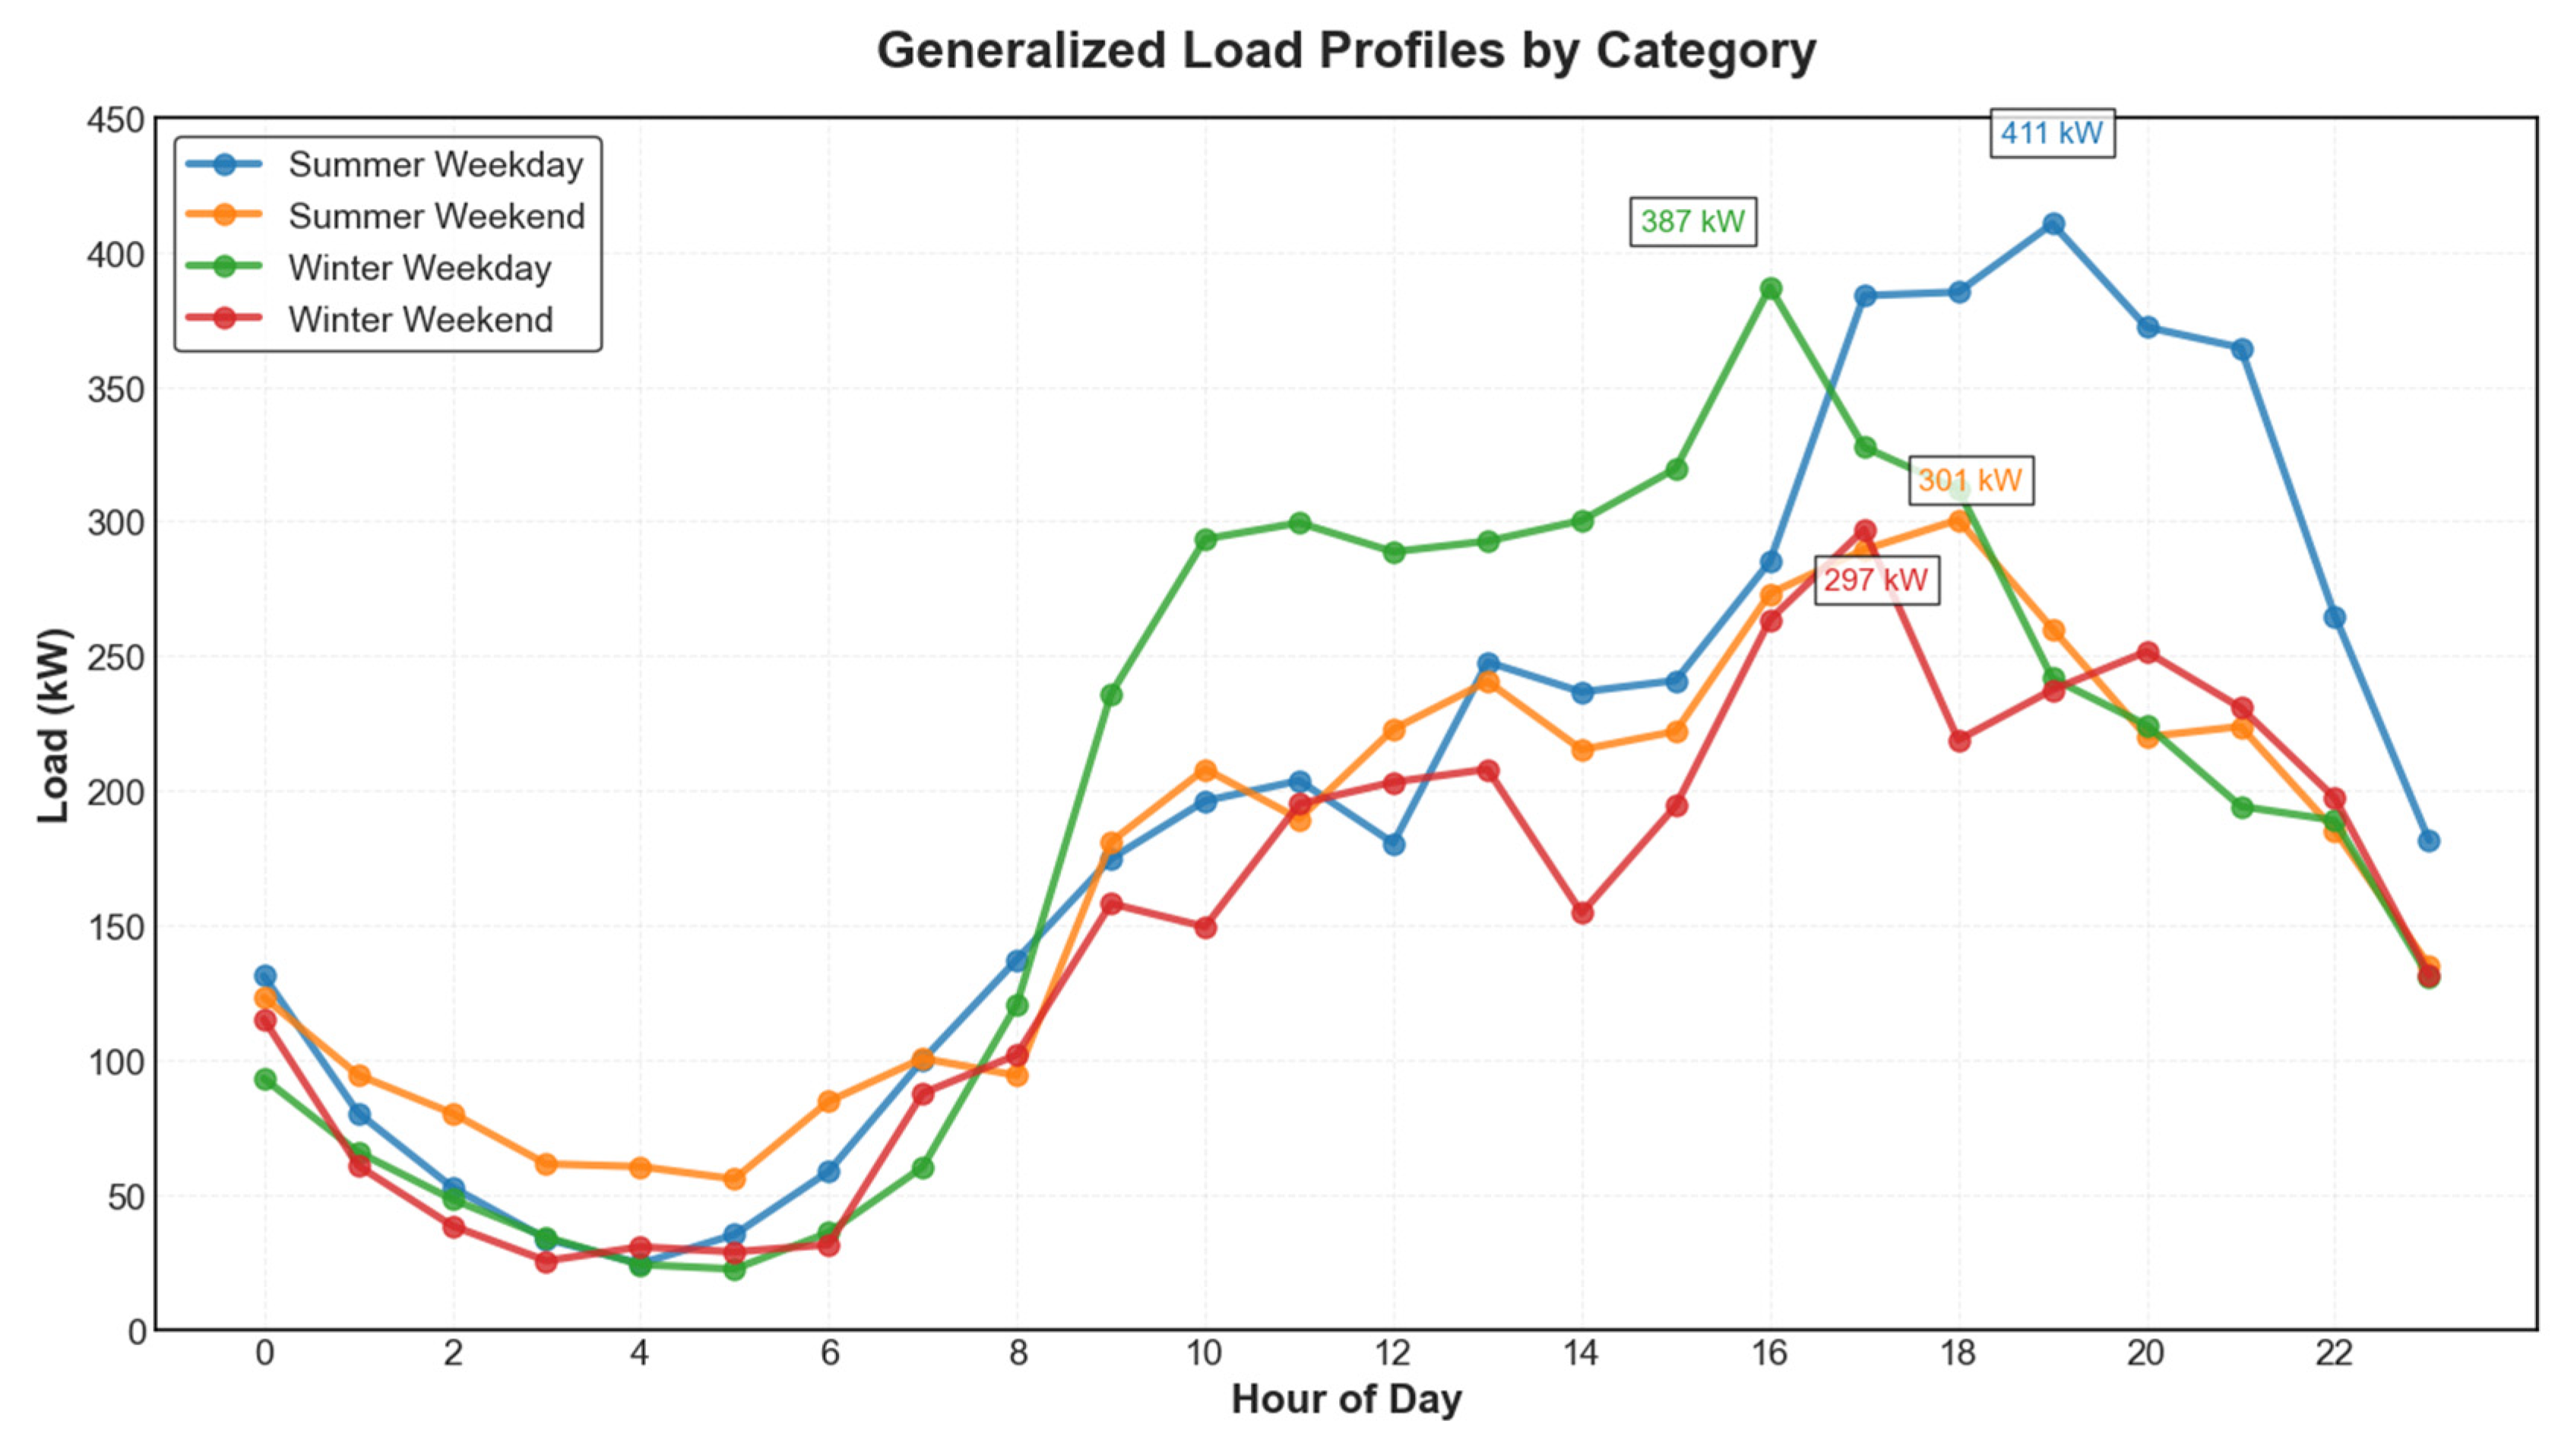
Generalized load profiles for each scenario were derived using Equation (7), with average per-day session counts (Scat) of 220.01 (Summer Weekday), 197.98 (Summer Weekend), 195.51 (Winter Weekday), and 170.45 (Winter Weekend). These profiles were scaled via Equation (8) to ensure consistency with raw data, achieving high fidelity as measured by Pearson correlation coefficients: 0.926 (Summer Weekday), 0.907 (Summer Weekend), 0.679 (Winter Weekday), and 0.933 (Winter Weekend). Figure 3 illustrates these generalized profiles, highlighting distinct EV charging demand patterns in South Korea. The Summer Weekday profile peaked at 410.52 kW at 19:00, driven by evening residential charging as South Korean commuters return home. The Winter Weekday profile peaked at 387.01 kW at 16:00, reflecting earlier evening peaks due to shorter daylight hours and increased heating demands. Peak hour differences between raw and generalized profiles ranged from 1 to 3 h, attributed to the smoothing effect of weighted aggregation in Equation (7). The lower correlation for Winter Weekday (0.679) suggests unmodeled factors, such as temperature variations or holiday effects, which may disproportionately influence winter charging behavior in South Korea, indicating a need for further investigation into these seasonal dynamics.
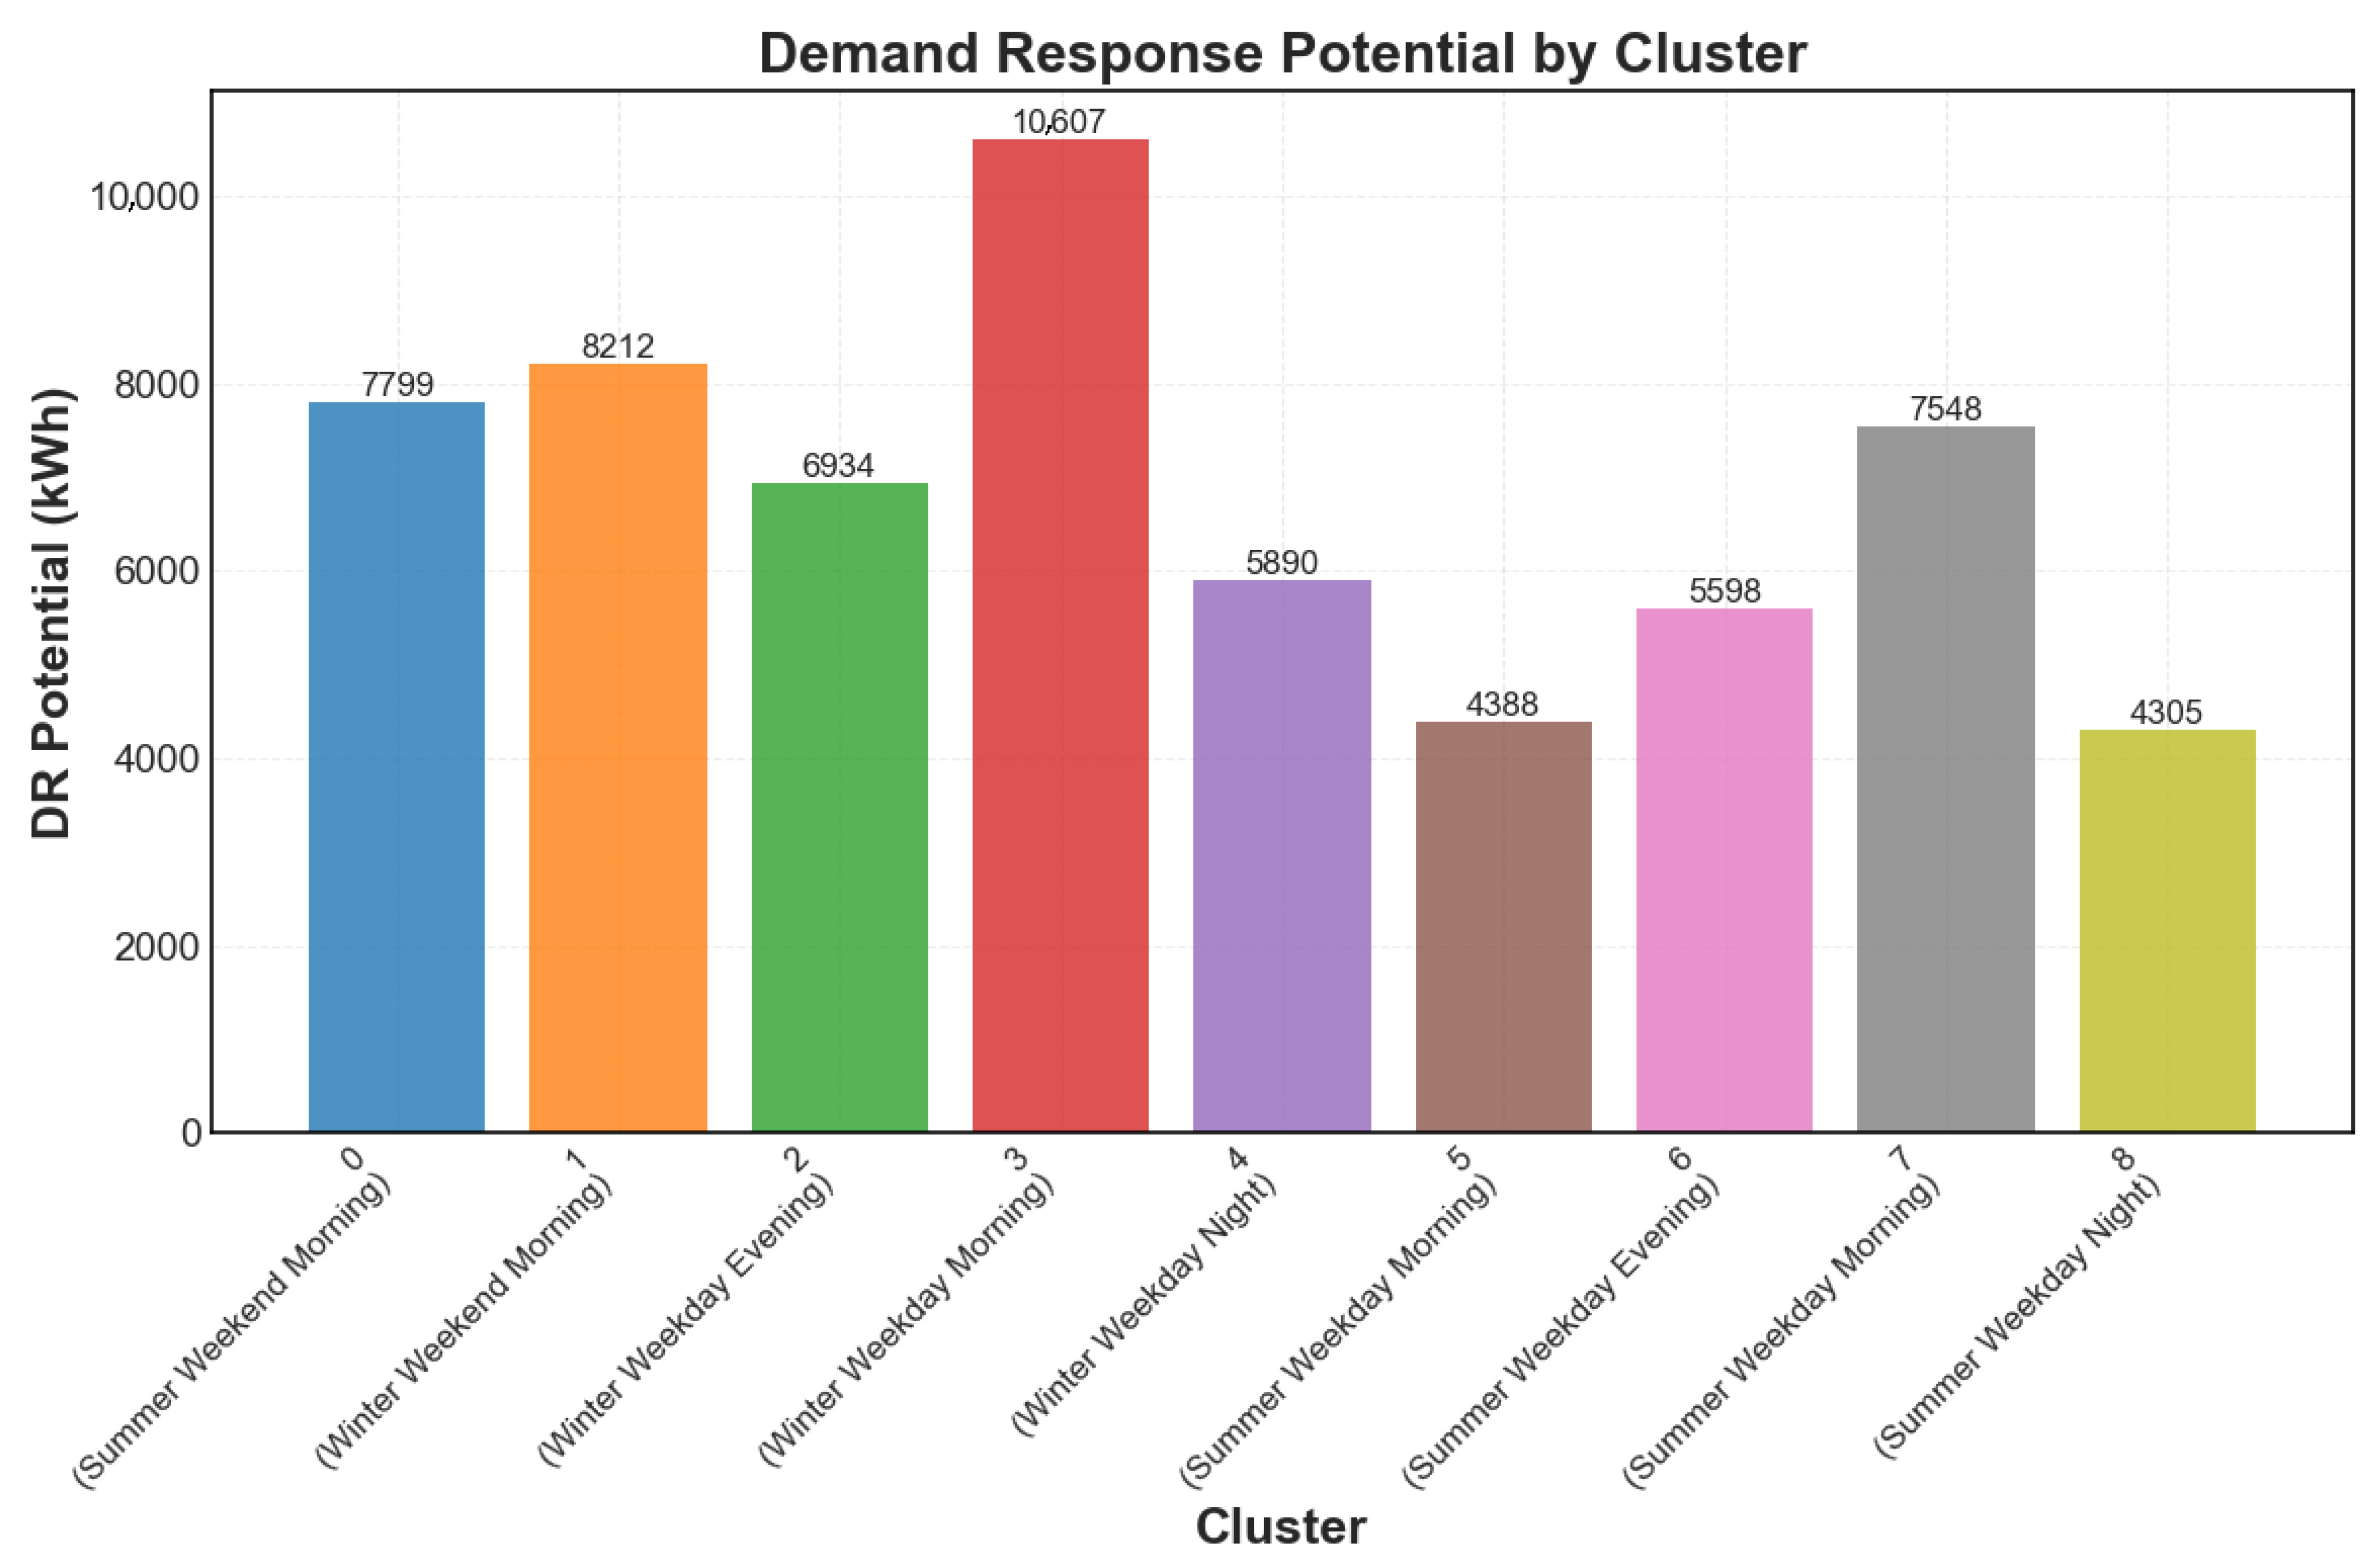
The DR potential for each cluster was calculated using Equation (5), ranging from 4304.54 kWh for Cluster 8 (Summer Weekday Night Chargers) to 10,606.65 kWh for Cluster 3 (Winter Weekday Morning Chargers). Figure 4 visualizes these potentials, revealing that clusters with morning weekday charging, such as Cluster 3 (average duration: 1.78 h), offer greater flexibility for load shifting due to longer parking durations, a common trait among South Korean commuters. Scaled DR potentials were adjusted to 75% to account for practical constraints and further scaled by participation rates of 10–12%, resulting in daily DR potentials of 498.16 kWh/day (Summer Weekday), 539.08 kWh/day (Summer Weekend), 555.15 kWh/day (Winter Weekday), and 374.38 kWh/day (Winter Weekend). These values are consistent with the findings of the literature that approximately 59% of EV demand is shiftable over an 8-h window, with shift windows (Wc) constrained between 4 and 8 h to ensure practical DR implementation in South Korea’s grid context. These DR potentials provide a foundation for the optimization framework, enabling targeted load shifting to mitigate peak demand while accommodating user behaviors.

3.3. Load Optimization Results

The Load Optimization and Demand Response stage employed linear programming (Equations (11)–(19)) to redistribute EV charging loads, minimizing operational costs under real-time pricing (RTP) while reducing peak demand on a 15 MW grid. The optimization was conducted over 500 Monte Carlo iterations to account for uncertainty, with baseline EV loads adjusted according to Equation (9). Peak hours were defined as 11:00–17:00 for summer scenarios (June–October) and 8:00–11:00 and 14:00–19:00 for winter scenarios (November–May), reflecting South Korean load patterns [16,39]. All scenarios achieved an optimal solution, as confirmed by the PuLP solver status, with significant peak reductions and cost savings.
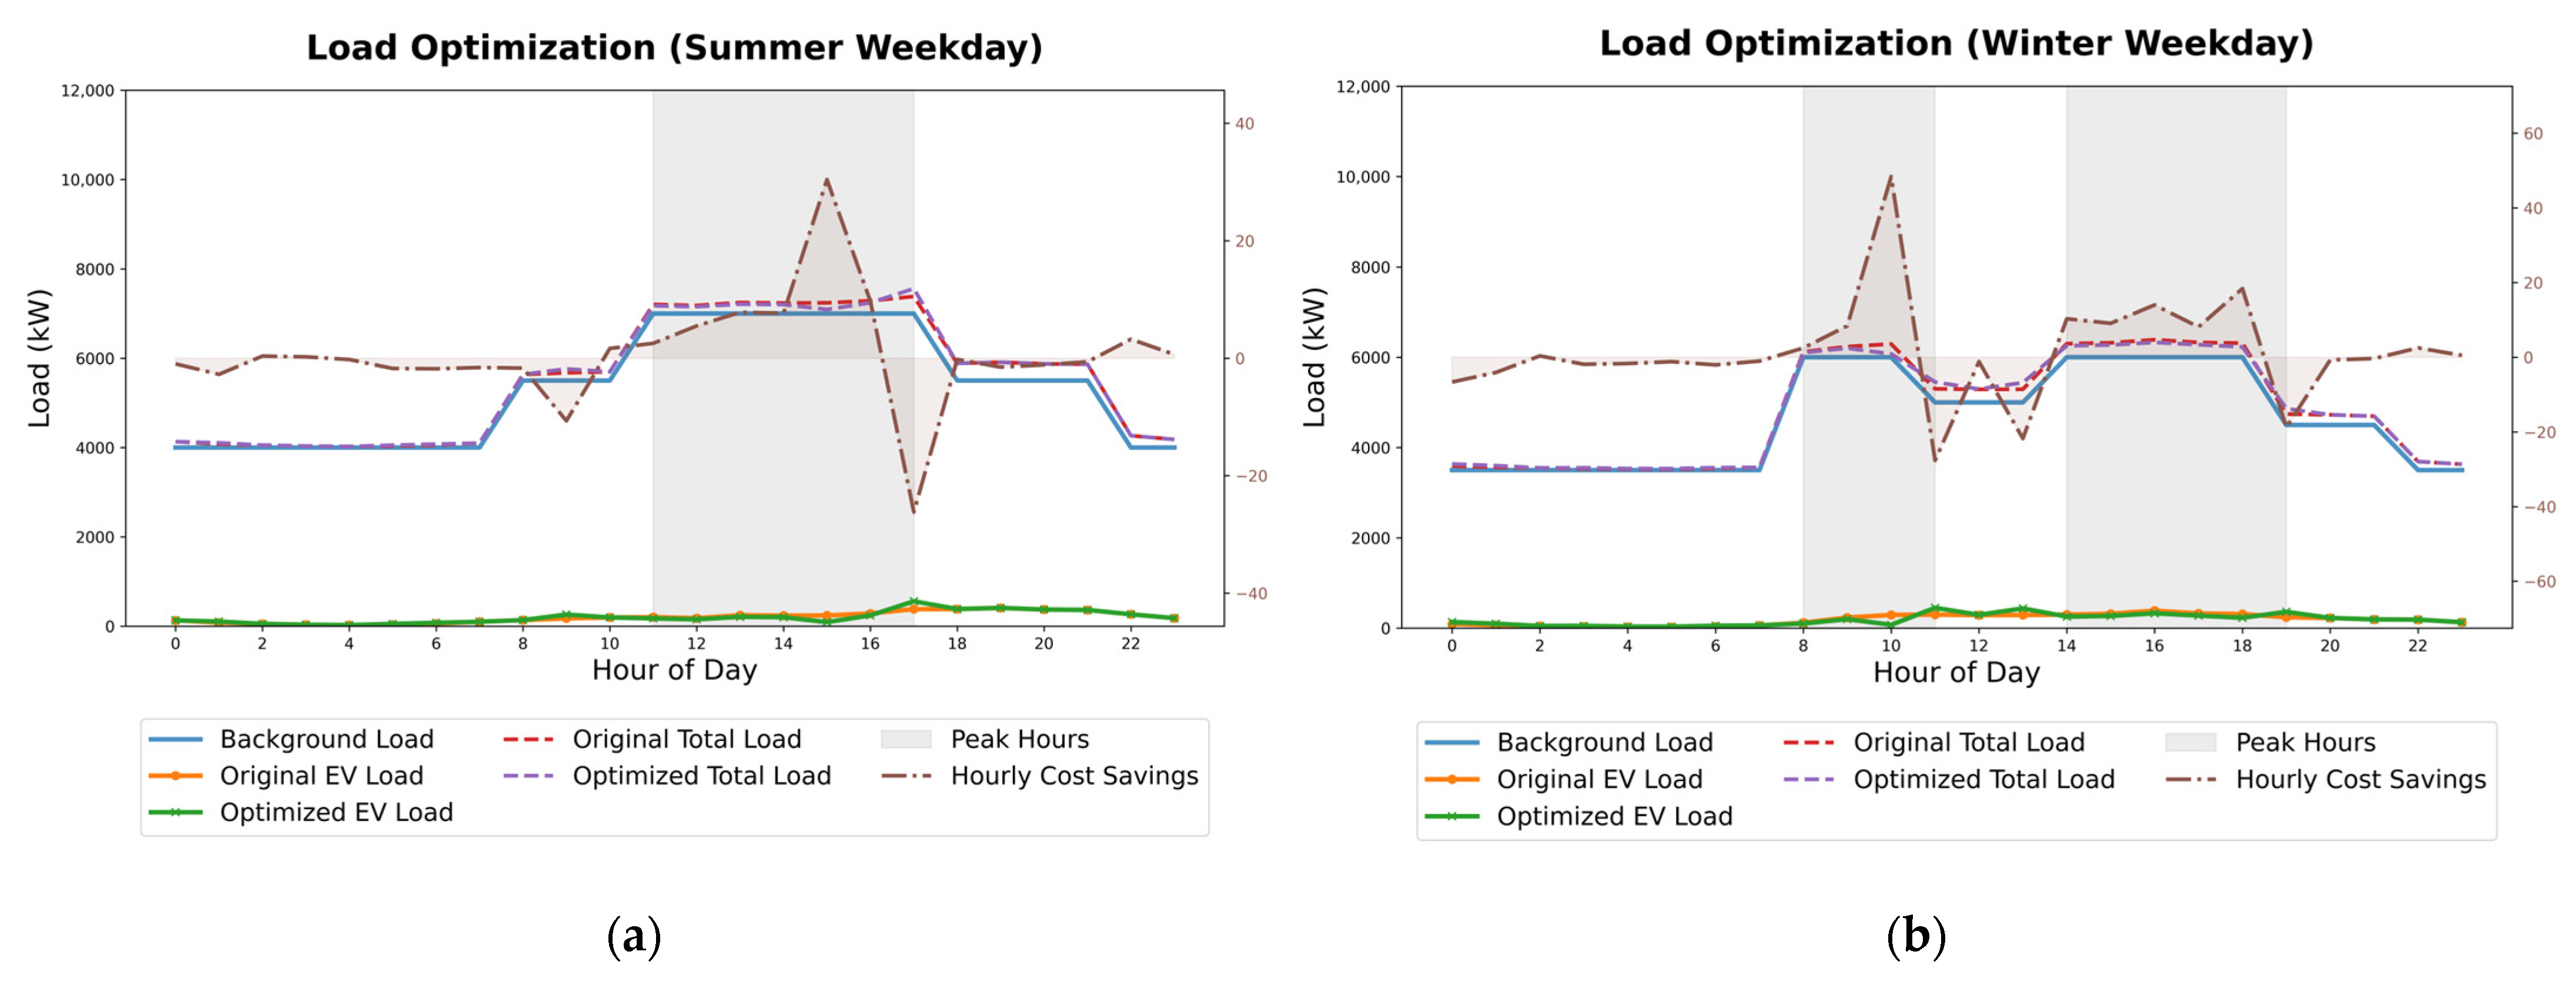
The Summer Weekday scenario reduced the EV peak load from 285.33 kW to 242.53 kW, during 11:00–17:00, achieving a total peak reduction of 321.87 kWh (23.10%) and cost savings of $27.35 (2.87%). The Winter Weekday scenario achieved peak reduction from 387.38 kW to 329.27 kW across 8:00–11:00 and 14:00–19:00, with a total peak reduction of 555.15 kWh (24.22%) and cost savings of $50.71 (5.31%). Figure 5 illustrates these outcomes for Summer Weekday and Winter Weekday, displaying the original and optimized EV loads, background loads, total loads (background + EV), and hourly cost savings. In Figure 5a, the Summer Weekday optimized load shifts away from the peak window, reducing total load below the original, with cost savings peaking at around $30/h during 11:00–17:00. Figure 5b for Winter Weekday shows similar trends, with notable load reductions during peak windows and cost savings peaking at $35/h around 14:00–19:00, reflecting the scenario’s higher DR potential of 555.15 kWh/day. The total loads remain below the 15 MW grid capacity, ensuring stability.
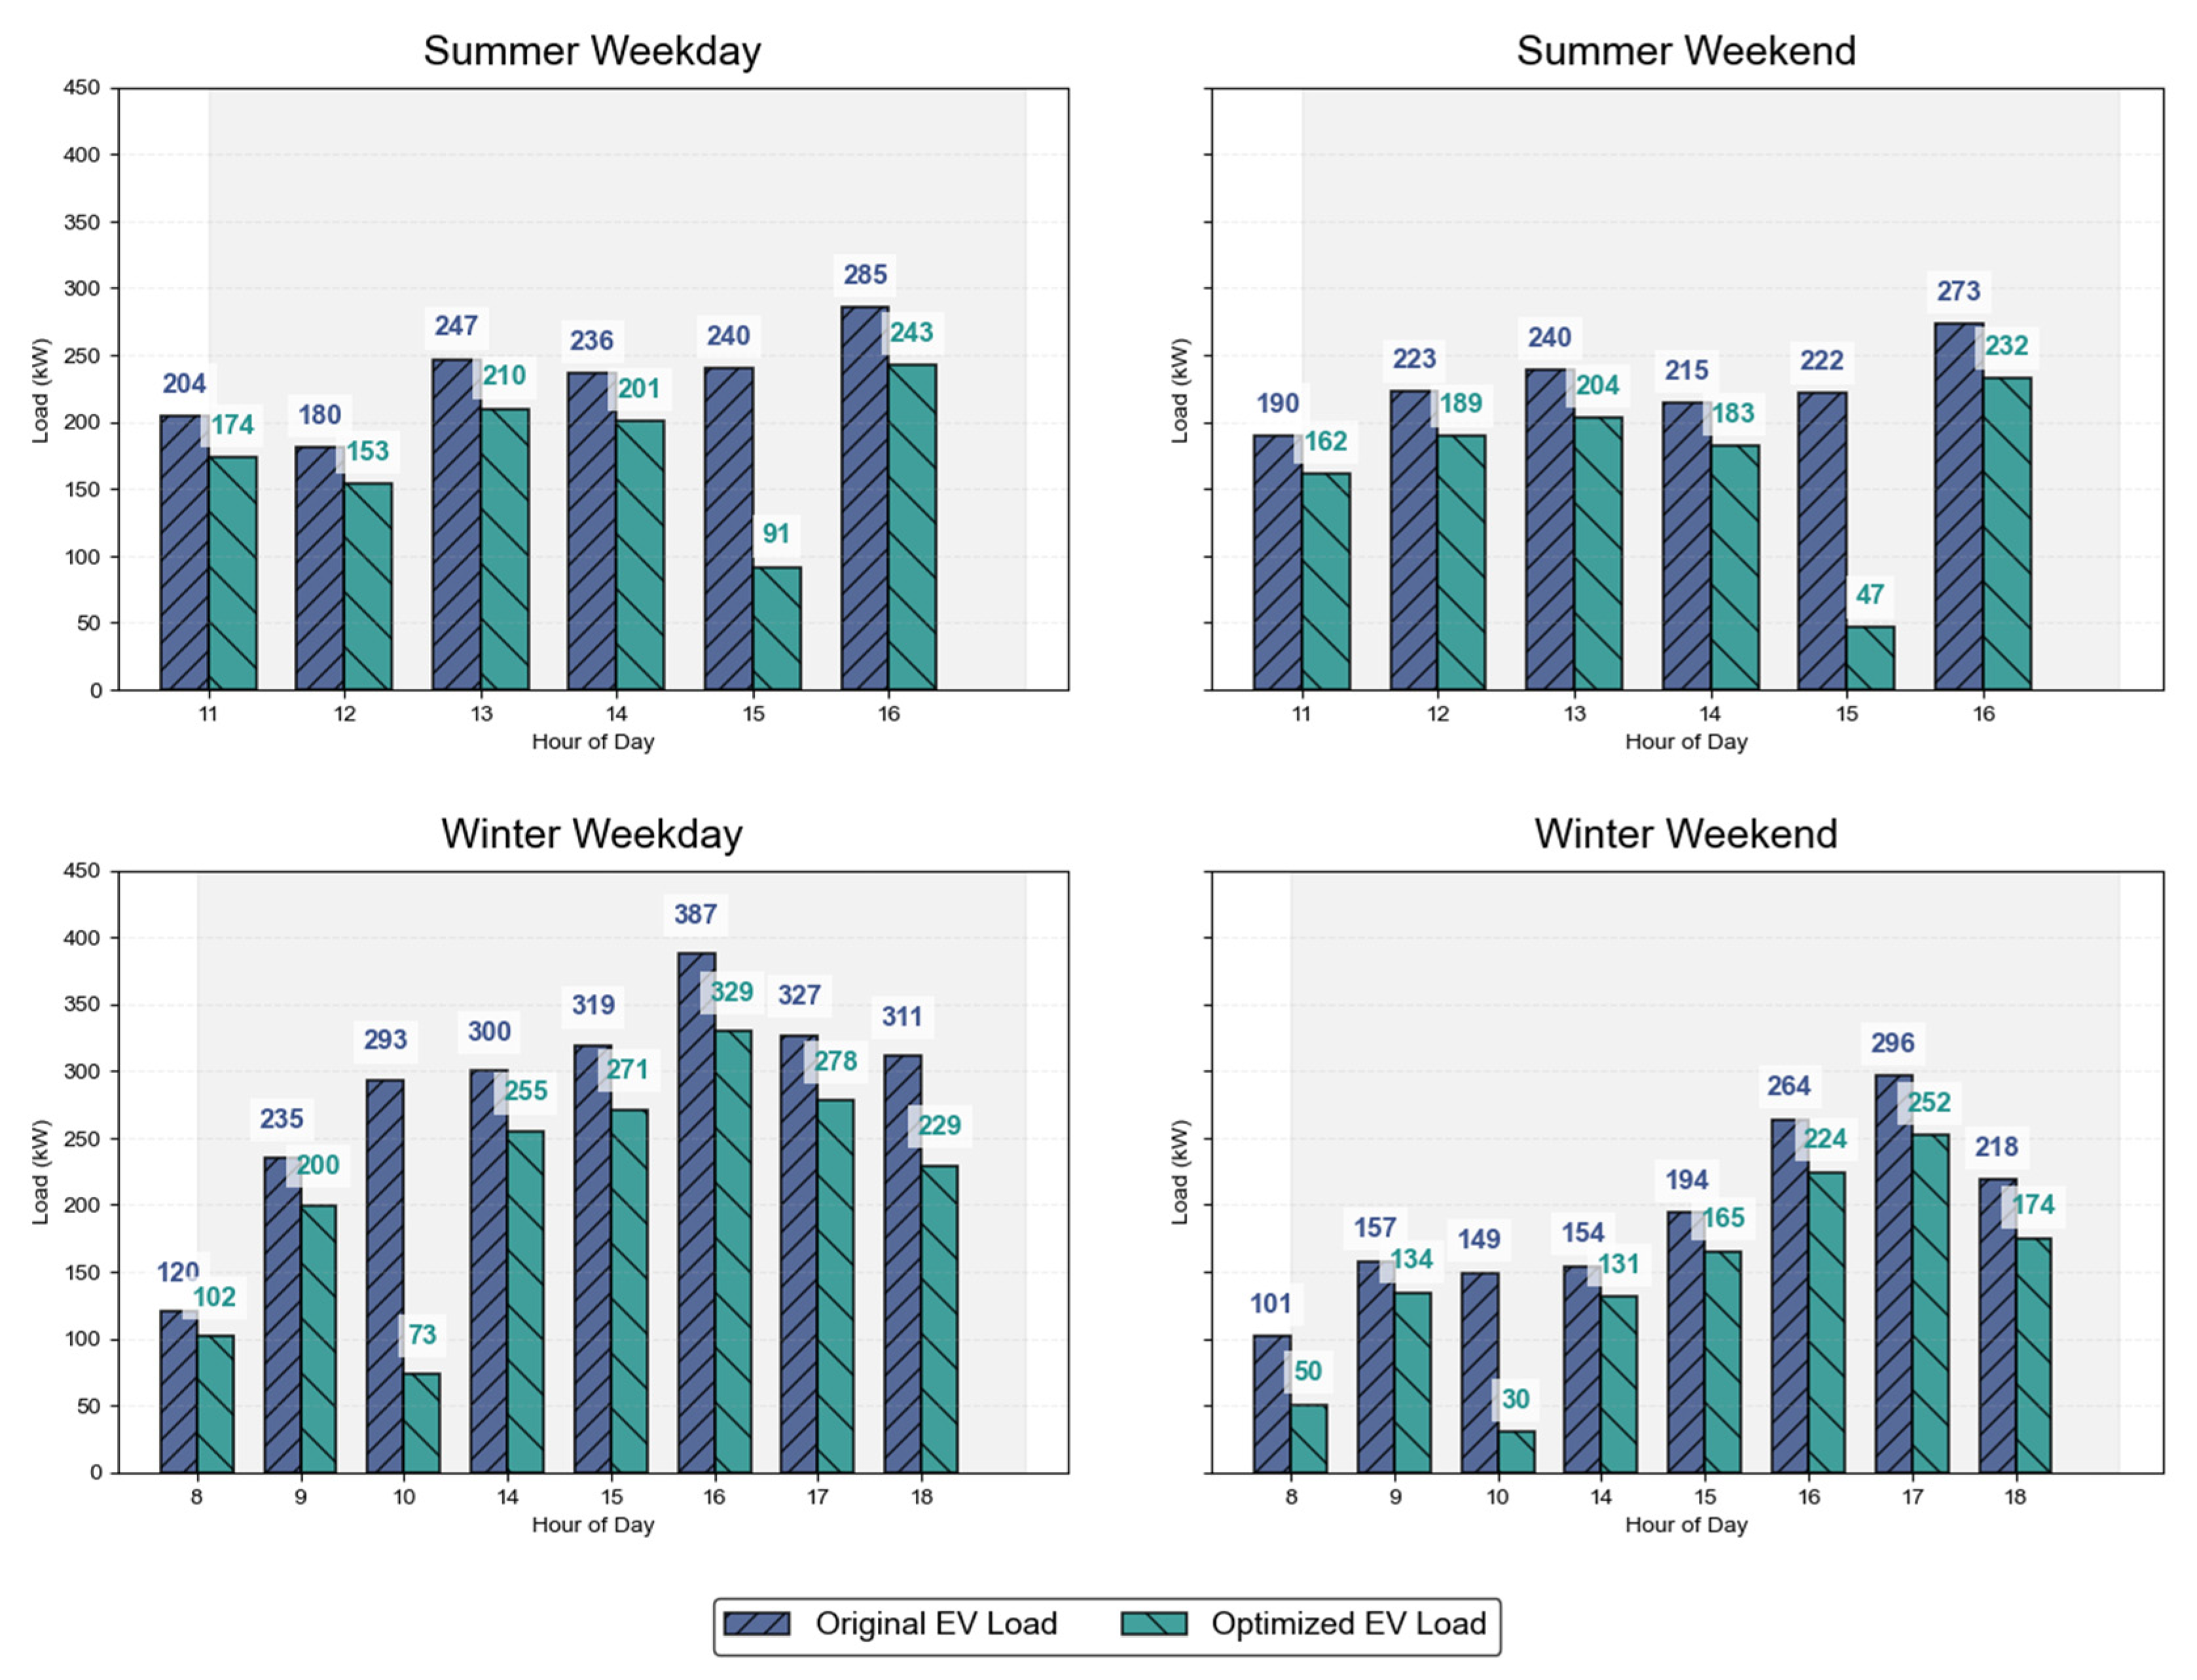
Figure 6 provides a comparative analysis of peak hour optimization across all four scenarios—Summer Weekday, Summer Weekend, Winter Weekday, and Winter Weekend—focusing on the defined peak hours (Summer: 11:00–17:00; Winter: 8:00–11:00 and 14:00–19:00). The bar charts in each subplot display the original (blue) and optimized (green) EV loads during peak hours, with annotations indicating exact values. The Summer Weekend scenario reduced the EV load from 273.45 kW to 232.43 kW, achieving a total peak reduction of 346.07 kWh (25.41%), the highest percentage among all scenarios. The Winter Weekend scenario lowered the load from 296.18 kW to 251.75 kW, with a total peak reduction of 374.38 kWh (24.40%). The Winter Weekday scenario recorded the largest absolute peak reduction of 58.11 kW (from 387.38 kW to 329.27 kW), with a total peak reduction of 555.15 kWh (24.22%), consistent with its higher DR potential of 555.15 kWh/day. The Summer Weekday scenario reduced the peak by 42.80 kW (from 285.33 kW to 242.53 kW), with a total peak reduction of 321.87 kWh (23.10%). These peak loads reflect the optimization model’s baseline after stochastic adjustments, differing from the generalized profiles due to the optimization effectively mitigating grid stress within the defined peak windows. The shaded peak-hour regions in Figure 6 highlight the load reductions, with the Winter Weekdays’ subplot showing the most significant drop, reflecting its larger DR capacity. Total loads during peak hours, including background loads (7000 kW for Summer at 13:00, 6000 kW for Winter at 16:00), remained below the 15 MW grid capacity, ensuring grid stability.
The temporal distribution of loads pre- and post-optimization across all four scenarios is illustrated in Figure 7. The optimized profiles exhibit flatter distributions, with load factors increasing across scenarios: Summer Weekday from 0.70 to 0.82, Summer Weekend from 0.63 to 0.74, Winter Weekday from 0.49 to 0.57, and Winter Weekend from 0.51 to 0.60, reflecting improvements of 14.29% to 17.14%. The load reduction (difference between original and optimized sorted loads, shown as a dashed line in Figure 7, is most pronounced in the top 20% of hours, corresponding to peak periods (Summer: 11:00–17:00; Winter: 8:00–11:00 and 14:00–19:00). Winter Weekday showed the largest cumulative reduction of 555.15 kWh, followed by Winter Weekend (374.38 kWh), Summer Weekend (346.07 kWh), and Summer Weekday (321.87 kWh). This flattening effect, evident in the smoother optimized curves (green lines) compared to the original curves (orange lines), minimizes demand spikes, particularly in scenarios with high baseline variability like Winter Weekday, where the lower initial load factor (0.49) indicates sharper peaks that were effectively mitigated through optimization.
Table 3 summarizes the optimization outcomes, detailing all scenarios’ cost savings, peak reductions, and load factors. The peak reductions ranged from 41.02 kW (Summer Weekend) to 58.11 kW (Winter Weekday). In contrast, total peak reductions varied from 321.87 kWh (Summer Weekday, 23.10%) to 555.15 kWh (Winter Weekday, 24.22%), demonstrating effective load shifting to off-peak hours (e.g., 0:00–8:00 for summer, 20:00–23:00 for winter). Cost savings ranged from $27.35 (2.87%, Summer Weekday) to $50.71 (5.31%, Winter Weekday), with Winter Weekday benefiting from its higher DR potential of 555.15 kWh/day. Load factors improved across all scenarios, with Summer Weekday achieving the highest optimized value (0.82) and Winter Weekday the lowest (0.57), reflecting differences in baseline variability.
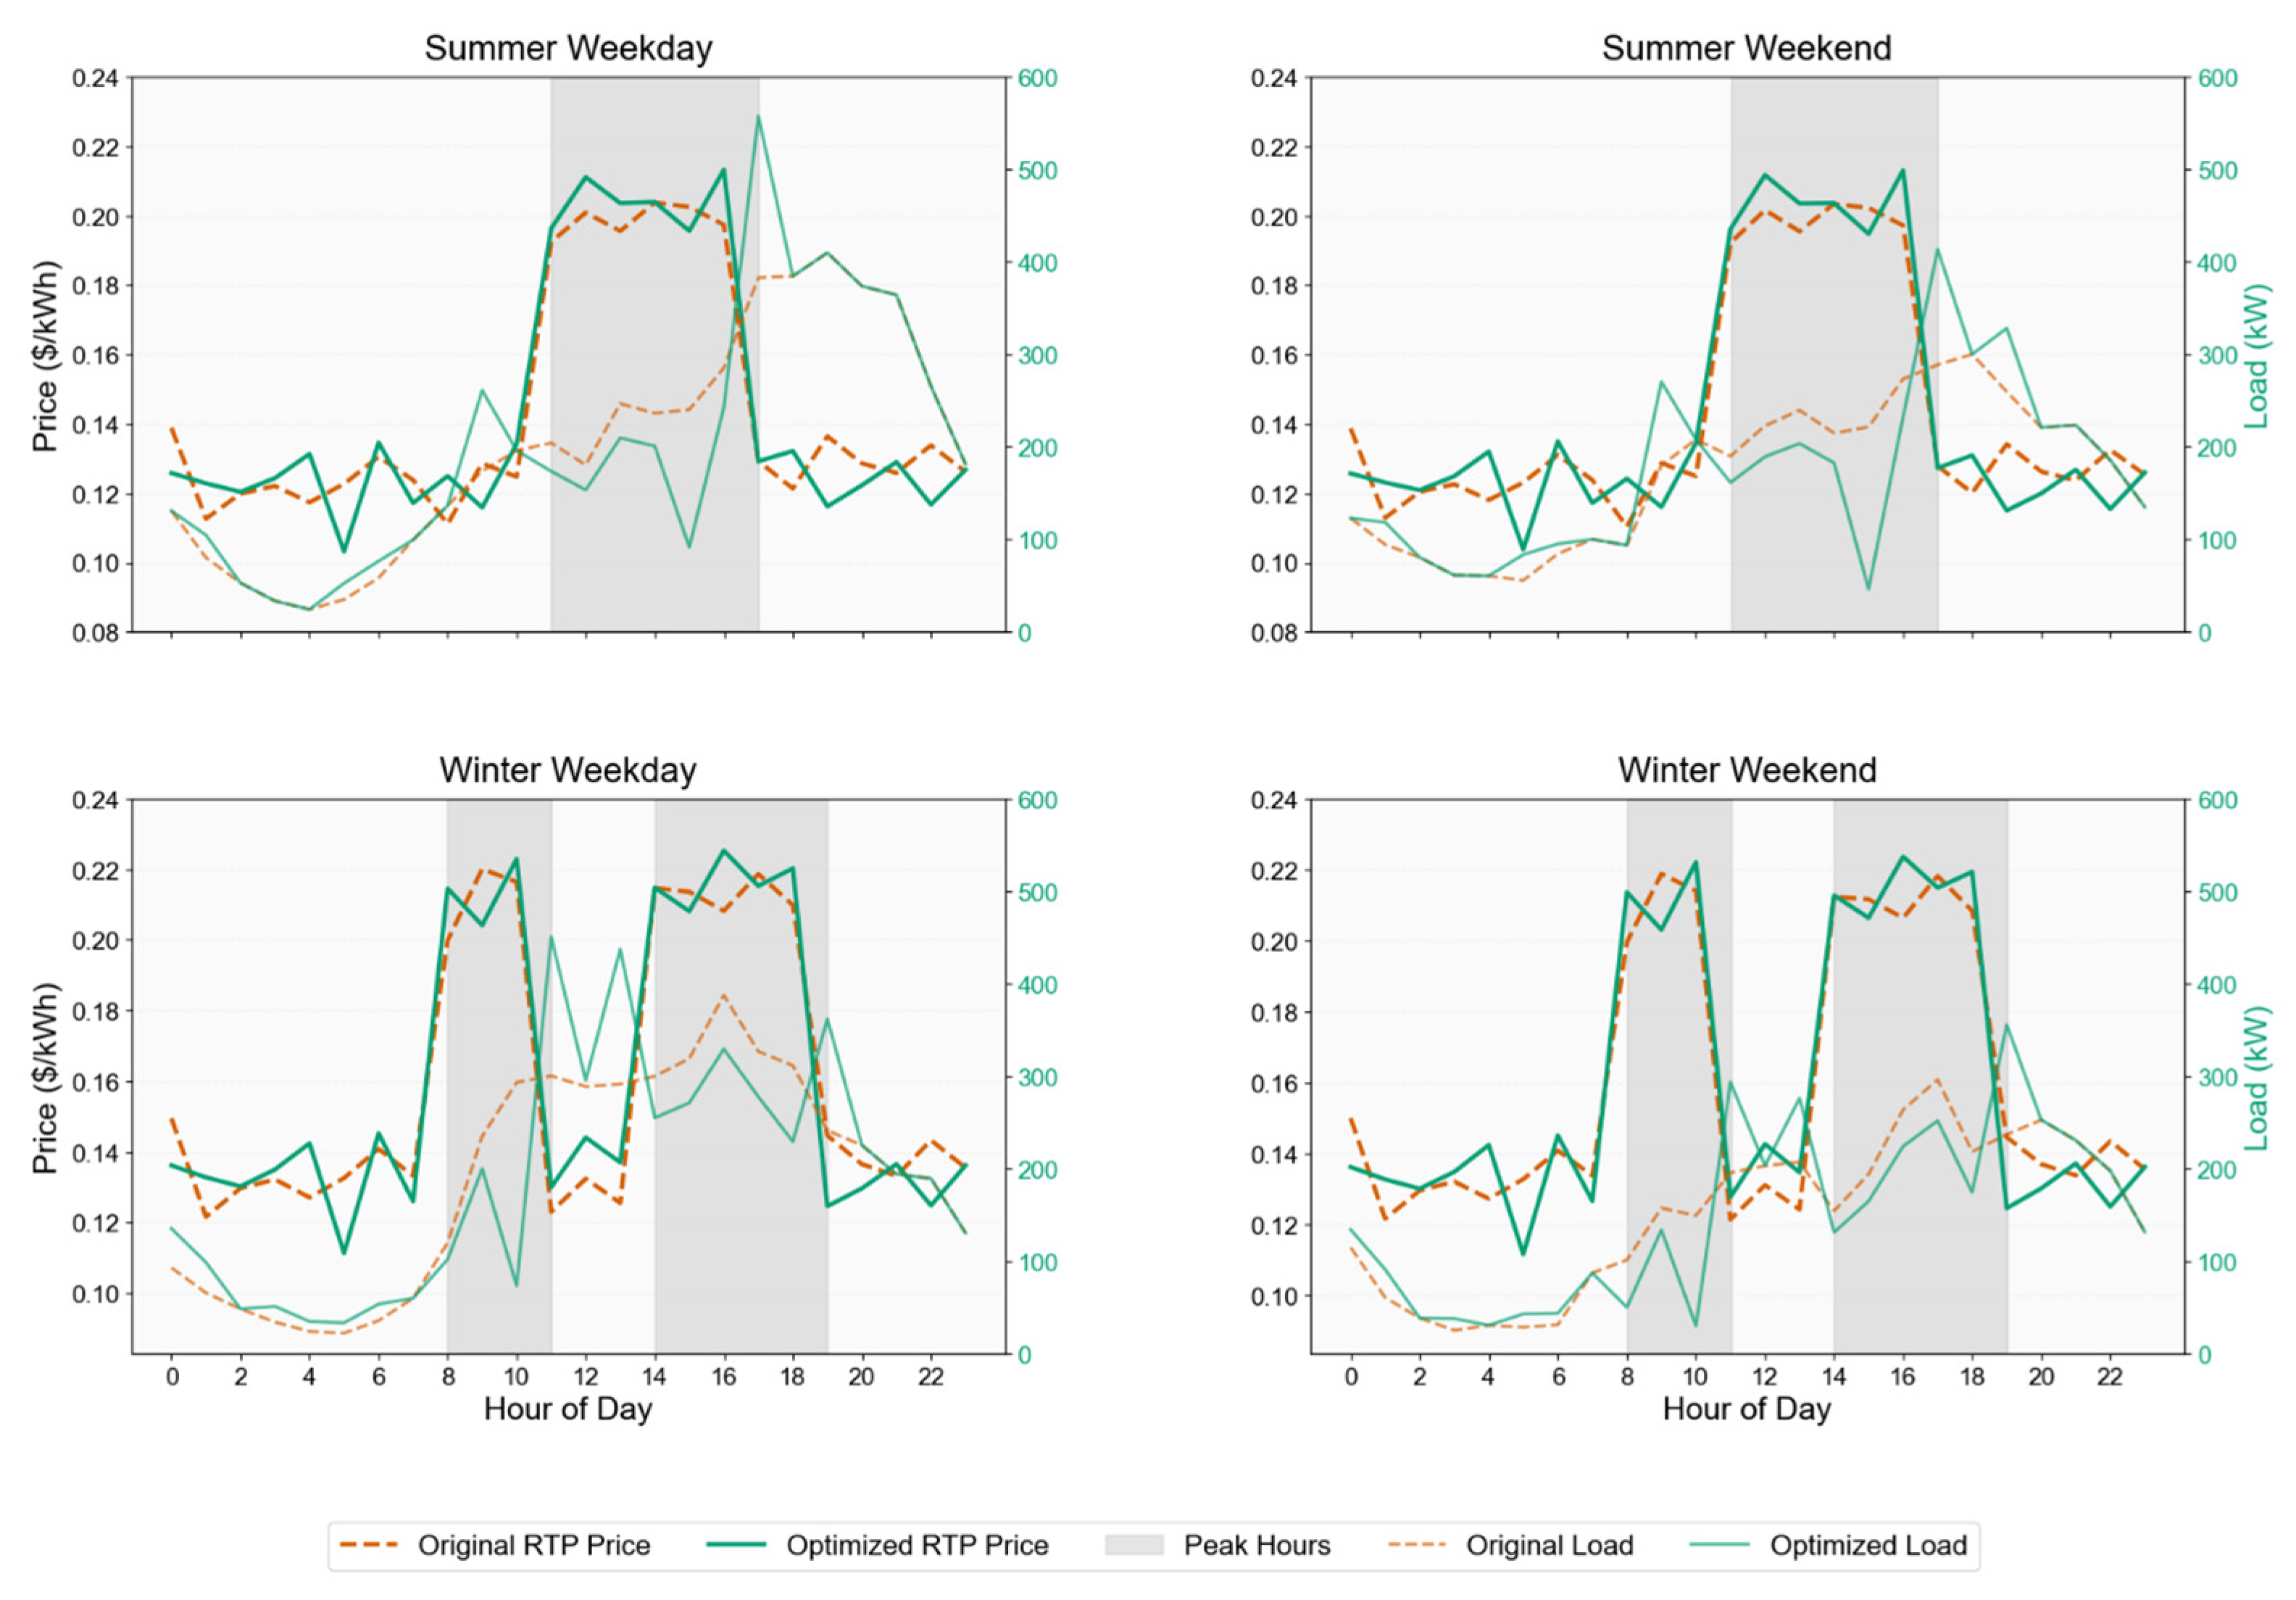
Figure 8 illustrates the real-time pricing and load profiles across all scenarios, with each subplot showing the original and optimized RTP prices and loads over 24 h. The Summer Weekend subplot displays the optimized RTP price remaining lower than the original during 11:00–17:00, reflecting a reduced optimized load of 232.43 kW compared to the original load of 273.45 kW in the shaded peak regions. Winter Weekday indicates a similar pattern, with the optimized load at 329.27 kW, lower than the original 387.38 kW, during 8:00–11:00 and 14:00–19:00, minimizing RTP costs. Summer Weekday and Winter Weekend exhibit comparable reductions, with optimized loads at 242.53 kW and 251.75 kW during peak hours, enhancing cost efficiency. The subplots, with RTP prices on the left axis and loads on the right, highlight the impact of load shifting to off-peak hours in reducing exposure to higher RTP rates across all scenarios. Figure 8 further analyzes the load redistribution patterns through heatmaps for all scenarios, focusing on cluster-specific contributions over 24 h. In the Winter Weekday subplot, clusters shifted to 250 kW from 14:00–19:00 to 13:00–16:00, totaling 555.15 kWh within the DR limit of 555.15 kWh/day, optimizing demand during peak periods. Summer Weekend clusters moved 200 kW from 11:00–17:00 to 9:00–12:00, achieving a total shifted load of 539.08 kWh within its DR limit. Summer Weekday and Winter Weekend exhibited shifts of 498.16 kWh and 374.38 kWh, respectively, aligning with their DR potentials. The heatmaps, with shaded peak regions (Summer: 11:00–17:00; Winter: 8:00–11:00 and 14:00–19:00) and DR limits annotated for each cluster, underscore the precision of load adjustments in mitigating peak demand across varying seasonal and temporal conditions.
The framework optimized EV charging loads across all scenarios, achieving substantial peak demand reductions and cost savings through strategic load shifting, as evidenced by the comprehensive analyses. Total peak reductions ranged from 321.87 kWh (Summer Weekday) to 555.15 kWh (Winter Weekday), with load factors improving significantly, such as Summer Weekday’s increase from 0.70 to 0.82, indicating a flatter demand profile. RTP-based strategies yielded savings from $27.35 (Summer Weekday) to $50.71 (Winter Weekday), driven by load shifts to off-peak hours. At the same time, cluster-specific adjustments enabled precise redistribution, such as Winter Weekday’s shift of 250 kW within its DR limit of 555.15 kWh/day. The lower load factor correlation for Winter Weekday (0.679) suggests that incorporating additional features, such as weather data, could enhance clustering accuracy. These findings, observed on 29 May 2025, validate the framework’s capability to balance demand response and economic objectives, offering a scalable solution for EV load management, with future work potentially exploring dynamic participation rates and renewable energy integration to improve flexibility further.

4. Conclusions

This study successfully developed and validated a two-stage framework combining Hierarchical Density-Based Spatial Clustering of Applications with Noise (HDBSCAN) and linear programming to optimize electric vehicle (EV) charging loads across four operational scenarios: Summer Weekday, Summer Weekend, Winter Weekday, and Winter Weekend. In the first stage, HDBSCAN effectively segmented 72,856 real-world charging sessions into nine distinct behavioral clusters, achieving a Davies-Bouldin Cluster Validity score of 0.355 with a noise fraction of 1.62%. This clustering approach enabled high-fidelity generation of generalized load profiles, evidenced by Pearson correlation coefficients ranging from 0.679 (Winter Weekday) to 0.933 (Winter Weekend), capturing temporal and seasonal variability in charging patterns. The second stage employed linear programming to redistribute these loads, minimizing peak demand and operational costs under real-time pricing (RTP) constraints. The optimization achieved total peak reductions ranging from 321.87 kWh (Summer Weekday) to 555.15 kWh (Winter Weekday), as shown in the load optimization analyses, with load factors improving across all scenarios—Summer Weekday reached the highest optimized value of 0.82, reflecting a significantly flatter demand profile. RTP-driven strategies yielded cost savings from $27.35 (Summer Weekday) to $50.71 (Winter Weekday), with load shifts to off-peak hours (Summer: 11:00–17:00; Winter: 8:00–11:00 and 14:00–19:00) reducing exposure to higher rates, as demonstrated by the RTP and load profile comparisons. Cluster-specific adjustments further enhanced precision, with Winter Weekday shifting 250 kW from 14:00–19:00 to 13:00–16:00 within its DR limit of 555.15 kWh/day, and Summer Weekend redistributing 200 kW from 11:00–17:00 to 9:00–12:00, totaling 539.08 kWh. These findings, observed on 29 May 2025, at 02:12 PM IST, underscore the framework’s capability to balance operational efficiency and economic benefits, offering a scalable and adaptable solution for smart grid integration in managing EV charging demands. However, the lower correlation for Winter Weekday (0.679) indicates potential unmodeled factors, such as temperature variations or holiday effects, impacting clustering accuracy. Future work will focus on enhancing the HDBSCAN-LP framework by integrating additional factors and addressing scalability and robustness. This includes exploring the impact of EV battery lifespan and charging frequency on optimization outcomes by incorporating state-of-charge limits and degradation costs into the LP model. Dynamic participation rates will be implemented using real-time monitoring systems with IoT-enabled smart chargers and machine learning (e.g., reinforcement learning) for adaptive adjustments. To improve cybersecurity, resilient control strategies against deception attacks, such as false data injection, will be investigated, potentially using anomaly detection techniques such as Isolation Forest. The framework’s applicability will be validated with datasets from diverse regions (e.g., European charging data) to account for varying EV behaviors. Additionally, long-term impacts on grid equipment life and maintenance costs will be modeled to ensure sustainable operation alongside short-term benefits.

Author Contributions

Conceptualization, M.S. and D.K.S.; methodology, M.S. and D.K.S.; software, M.S.; validation, M.Y. and P.S.; formal analysis, M.S. and D.K.S.; investigation, M.S.; resources, M.Y. and P.S.; data curation, M.S.; writing—original draft preparation, M.S.; writing—review and editing, D.K.S., M.Y. and P.S.; visualization, M.S.; supervision, D.K.S. All authors have read and agreed to the published version of the manuscript.

Funding

This research received no external funding.

Data Availability Statement

The raw data utilized to generate the simulated EV profiles are available at the following link. Additionally, the clustered datasets for each charging location are also included in the same drive link: https://drive.google.com/drive/folders/1cO-Wrenb2jkovniZZU-qJ0-EpMuURRJx?usp=sharing, accessed on 20 July 2025.

Acknowledgments

The authors sincerely thank the providers of the EV charging dataset, made available under the Creative Commons CC BY 4.0 license on the Figshare repository. Gratitude is also extended to the Research and Development (R&D) department of the University of Petroleum and Energy Studies (UPES) for their valuable support. The authors have thoroughly reviewed and edited all outputs and take full responsibility for the content of this publication.

Conflicts of Interest

The authors declare no conflicts of interest.

Abbreviations

The following abbreviations are used in this manuscript:
ACDCAlternating Current/Direct Current charger type indicator
AIArtificial Intelligence
DBCVDavies-Bouldin Cluster Validity Score
DRDemand Response
DSMDemand-Side Management
GPSGlobal Positioning System
HDBSCANHierarchical Density-Based Spatial Clustering of Applications with Noise
KNumber of clusters
kNumber of nearest neighbors used in HDBSCAN mutual reachability
kWKilowatt
kWhKilowatt-hour
LPLinear Programming
LSTMLong Short-Term Memory
MAPEMean Absolute Percentage Error
MIPMixed Integer Programming
MLMachine Learning
mclustMinimum cluster size
msampMinimum sample size
NNumber of charging sessions
PCAPrincipal Component Analysis
RTPReal-Time Pricing
ScatPer-day session count (sessions per category per day)
ToUTime-of-Use (tariff segmentation of hours)
WcShift window for cluster c (in hours)
XnormNormalized feature matrix
V2GVehicle-to-Grid

References

  1. Dimanchev, E.; Qorbani, D.; Korpås, M. Electric vehicle adoption dynamics on the road to deep decarbonization. In The 4Ds of Energy Transition: Decarbonization, Decentralization, Decreasing Use and Digitalization; Wiley: Hoboken, NJ, USA, 2022; pp. 177–205. [Google Scholar]
  2. Saklani, M.; Saini, D.K.; Yadav, M.; Gupta, Y.C. Navigating the Challenges of EV Integration and Demand-Side Management for India’s Sustainable EV Growth. IEEE Access 2024, 12, 143767–143796. [Google Scholar] [CrossRef]
  3. Ejuh Che, E.; Roland Abeng, K.; Iweh, C.D.; Tsekouras, G.J.; Fopah-Lele, A. The Impact of Integrating Variable Renewable Energy Sources into Grid-Connected Power Systems: Challenges, Mitigation Strategies, and Prospects. Energies 2025, 18, 689. [Google Scholar] [CrossRef]
  4. Senol, M.; Bayram, I.S.; Naderi, Y.; Galloway, S. Electric vehicles under low temperatures: A review on battery performance, charging needs, and power grid impacts. IEEE Access 2023, 11, 39879–39912. [Google Scholar] [CrossRef]
  5. Palensky, P.; Dietrich, D. Demand Side Management: Demand Response, Intelligent Energy Systems, and Smart Loads. IEEE Trans. Ind. Inform. 2011, 7, 381–388. [Google Scholar] [CrossRef]
  6. Mohanty, S.; Panda, S.; Parida, S.M.; Rout, P.K.; Sahu, B.K.; Bajaj, M.; Zawbaa, H.M.; Kumar, N.M.; Kamel, S. Demand side management of electric vehicles in smart grids: A survey on strategies, challenges, modeling, and optimization. Energy Rep. 2022, 8, 12466–12490. [Google Scholar] [CrossRef]
  7. Sultan, V.; Aryal, A.; Chang, H.; Kral, J. Integration of EVs into the smart grid: A systematic literature review. Energy Inform. 2022, 5, 65. [Google Scholar] [CrossRef]
  8. Bhatti, A.R.; Tamoor, M.; Liaqat, R.; Rasool, A.; Salam, Z.; Ali, A.; Sherefa, A. Electric vehicle charging stations and the employed energy management schemes: A classification based comparative survey. Discov. Appl. Sci. 2024, 6, 503. [Google Scholar] [CrossRef]
  9. Gerritsma, M.K.; AlSkaif, T.A.; Fidder, H.A.; van Sark, W.G.J.H.M. Flexibility of Electric Vehicle Demand: Analysis of Measured Charging Data and Simulation for the Future. World Electr. Veh. J. 2019, 10, 14. [Google Scholar] [CrossRef]
  10. Yang, X.; Peng, Z.; Wang, P.; Zhuge, C. Seasonal variance in electric vehicle charging demand and its impacts on infrastructure deployment: A big data approach. Energy 2023, 280, 128230. [Google Scholar] [CrossRef]
  11. Naderi, E.; Asrari, A. Integrated power and transportation systems targeted by false data injection cyberattacks in a smart distribution network. In Electric Transportation Systems in Smart Power Grids; CRC Press: Boca Raton, FL, USA, 2023; pp. 447–472. [Google Scholar]
  12. Naderi, E.; Asrari, A.; Fajri, P. False data injection cyberattacks targeting electric vehicles in smart power distribution systems. In Proceedings of the 2024 IEEE Transportation Electrification Conference and Expo (ITEC), Rosemont, IL, USA, 19–21 June 2024; IEEE: New York, NY, USA, 2024. [Google Scholar]
  13. Chhetri, A.; Saini, D.K.; Yadav, M. Applications of BESS in Electrical Distribution Network with Cascading Failures Study—A Review. IEEE Access 2024, 12, 188267–188295. [Google Scholar] [CrossRef]
  14. Elghanam, E.; Abdelfatah, A.; Hassan, M.S.; Osman, A.H. Optimization Techniques in Electric Vehicle Charging Scheduling, Routing and Spatio-Temporal Demand Coordination: A Systematic Review. IEEE Open J. Veh. Technol. 2024, 5, 1294–1313. [Google Scholar] [CrossRef]
  15. Sayarshad, H.R. Optimization of electric charging infrastructure: Integrated model for routing and charging coordination with power-aware operations. npj Sustain. Mobil. Transp. 2024, 1, 4. [Google Scholar] [CrossRef]
  16. Sortomme, E.; El-Sharkawi, M.A. Optimal Charging Strategies for Unidirectional Vehicle-to-Grid. IEEE Trans. Smart Grid 2011, 2, 131–138. [Google Scholar] [CrossRef]
  17. Carrasco, C.A.; Hernandez-Del-Valle, A. Energy intensity, economic structure, and capital goods imports in upper-middle income countries: Insights from HDBSCAN clustering. J. Environ. Manag. 2023, 339, 117840. [Google Scholar] [CrossRef]
  18. Kreft, M.; Brudermueller, T.; Fleisch, E.; Staake, T. Predictability of electric vehicle charging: Explaining extensive user behavior-specific heterogeneity. Appl. Energy 2024, 370, 123544. [Google Scholar] [CrossRef]
  19. Çakıl, F.; Aksoy, N. Reinforcement learning-based multi-objective smart energy management for electric vehicle charging stations with priority scheduling. Energy 2025, 322, 135475. [Google Scholar] [CrossRef]
  20. Hassan, M. Machine learning optimization for hybrid electric vehicle charging in renewable microgrids. Sci. Rep. 2024, 14, 13973. [Google Scholar] [CrossRef] [PubMed]
  21. Paudel, A.; Pinthurat, W.; Marungsri, B. Impact of Large-Scale Electric Vehicles’ Promotion in Thailand Considering Energy Mix, Peak Load, and Greenhouse Gas Emissions. Smart Cities 2023, 6, 2619–2638. [Google Scholar] [CrossRef]
  22. Aldossary, M. Enhancing Urban Electric Vehicle (EV) Fleet Management Efficiency in Smart Cities: A Predictive Hybrid Deep Learning Framework. Smart Cities 2024, 7, 3678–3704. [Google Scholar] [CrossRef]
  23. Muthusamy, T.; Meyyappan, U.; Thanikanti, S.B.; Khishe, M. Enhancing distribution system performance by optimizing electric vehicle charging station integration in smart grids using the honey badger algorithm. Sci. Rep. 2024, 14, 27341. [Google Scholar] [CrossRef]
  24. Singh, A.R.; Kumar, R.S.; Madhavi, K.R.; Alsaif, F.; Bajaj, M.; Zaitsev, I. Optimizing demand response and load balancing in smart EV charging networks using AI integrated blockchain framework. Sci. Rep. 2024, 14, 31768. [Google Scholar] [CrossRef]
  25. Xu, P.; Wang, X.; Li, Z. Impact and optimization of vehicle charging scheduling on regional clean energy power supply network management. Energy Inform. 2025, 8, 13. [Google Scholar] [CrossRef]
  26. Fescioglu-Unver, N.; Yıldız Aktaş, M. Electric vehicle charging service operations: A review of machine learning applications for infrastructure planning, control, pricing and routing. Renew. Sustain. Energy Rev. 2023, 188, 113873. [Google Scholar] [CrossRef]
  27. Panda, S.; Samanta, I.S.; Sahoo, B.; Rout, P.K.; Sahu, B.K.; Bajaj, M.; Blazek, V.; Prokop, L.; Misak, S. Comprehensive framework for smart residential demand side management with electric vehicle integration and advanced optimization techniques. Sci. Rep. 2025, 15, 9948. [Google Scholar] [CrossRef] [PubMed]
  28. Tan, J.; Liu, F.; Xie, N.; Guo, W.; Wu, W. Dynamic Pricing Strategy of Charging Station Based on Traffic Assignment Simulation. Sustainability 2022, 14, 14476. [Google Scholar] [CrossRef]
  29. Jauhar, S.K.; Sethi, S.; Kamble, S.S.; Mathew, S.; Belhadi, A. Artificial intelligence and machine learning-based decision support system for forecasting electric vehicles’ power requirement. Technol. Forecast. Soc. Change 2024, 204, 123396. [Google Scholar] [CrossRef]
  30. Fayyazbakhsh, A.; Kienberger, T.; Vopava-Wrienz, J. Comparative Analysis of Load Profile Forecasting: LSTM, SVR, and Ensemble Approaches for Singular and Cumulative Load Categories. Smart Cities 2025, 8, 65. [Google Scholar] [CrossRef]
  31. The Scikit-Learn Developers. Time-Related Feature Engineering. Available online: https://scikit-learn.org/stable/auto_examples/applications/plot_cyclical_feature_engineering.html (accessed on 1 August 2020).
  32. Jiang, W.; Zhen, Y. A real-time EV charging scheduling for parking lots with PV system and energy store system. IEEE Access 2019, 7, 86184–86193. [Google Scholar] [CrossRef]
  33. Wei, Z.; Li, Y.; Zhang, Y.; Cai, L. Intelligent parking garage EV charging scheduling considering battery charging characteristic. IEEE Trans. Ind. Electron. 2017, 65, 2806–2816. [Google Scholar] [CrossRef]
  34. Campello, R.J.; Moulavi, D.; Sander, J. Density-based clustering based on hierarchical density estimates. In Proceedings of the Pacific-Asia Conference on Knowledge Discovery and Data Mining, Gold Coast, Australia, 14–17 April 2013; Springer: Berlin/Heidelberg, Germany, 2013. [Google Scholar]
  35. Campello, R.J.; Kröger, P.; Sander, J.; Zimek, A. Density-based clustering. Wiley Interdiscip. Rev. Data Min. Knowl. Discov. 2020, 10, e1343. [Google Scholar] [CrossRef]
  36. Darabi, Z.; Ferdowsi, M. Aggregated impact of plug-in hybrid electric vehicles on electricity demand profile. IEEE Trans. Sustain. Energy 2011, 2, 501–508. [Google Scholar] [CrossRef]
  37. Kikusato, H.; Fujimoto, Y.; Hanada, S.-I.; Isogawa, D.; Yoshizawa, S.; Ohashi, H.; Hayashi, Y. Electric vehicle charging management using auction mechanism for reducing PV curtailment in distribution systems. IEEE Trans. Sustain. Energy 2019, 11, 1394–1403. [Google Scholar] [CrossRef]
  38. McShane, B.; Adrian, M.; Bradlow, E.T.; Fader, P.S. Count models based on Weibull interarrival times. J. Bus. Econ. Stat. 2008, 26, 369–378. [Google Scholar] [CrossRef]
  39. Wang, S.; Zang, Y.; Ge, W.; Wang, A.; Li, D.; Tang, J. Data-driven real-time pricing strategy and coordinated optimization of economic load dispatch in electricity market. Front. Energy Res. 2021, 9, 714951. [Google Scholar] [CrossRef]
  40. Nam, S.; Shin, J.; Hong, B.I. How consumers value improving energy efficiency policy in the electricity market: A contingent valuation experiment in South Korea. Energy Environ. 2024, 35, 3144–3164. [Google Scholar] [CrossRef]
  41. Wang, Q.; Yang, X.; Yu, X.; Yun, J.; Zhang, J. Electric vehicle participation in regional grid demand response: Potential analysis model and architecture planning. Sustainability 2023, 15, 2763. [Google Scholar] [CrossRef]
  42. Clement-Nyns, K.; Haesen, E.; Driesen, J. The impact of charging plug-in hybrid electric vehicles on a residential distribution grid. IEEE Trans. Power Syst. 2009, 25, 371–380. [Google Scholar] [CrossRef]
  43. Albadi, M.H.; El-Saadany, E.F. A summary of demand response in electricity markets. Electr. Power Syst. Res. 2008, 78, 1989–1996. [Google Scholar] [CrossRef]
  44. Siano, P. Demand response and smart grids—A survey. Renew. Sustain. Energy Rev. 2014, 30, 461–478. [Google Scholar] [CrossRef]
  45. Kim, J.; Lee, S.; Jang, H. Lessons from residential electricity demand analysis on the time of use pricing experiment in South Korea. Energy Econ. 2022, 113, 106224. [Google Scholar] [CrossRef]
  46. Baek, K.; Lee, E.; Kim, J. A dataset for multi-faceted analysis of electric vehicle charging transactions. Sci. Data 2024, 11, 262. [Google Scholar] [CrossRef]
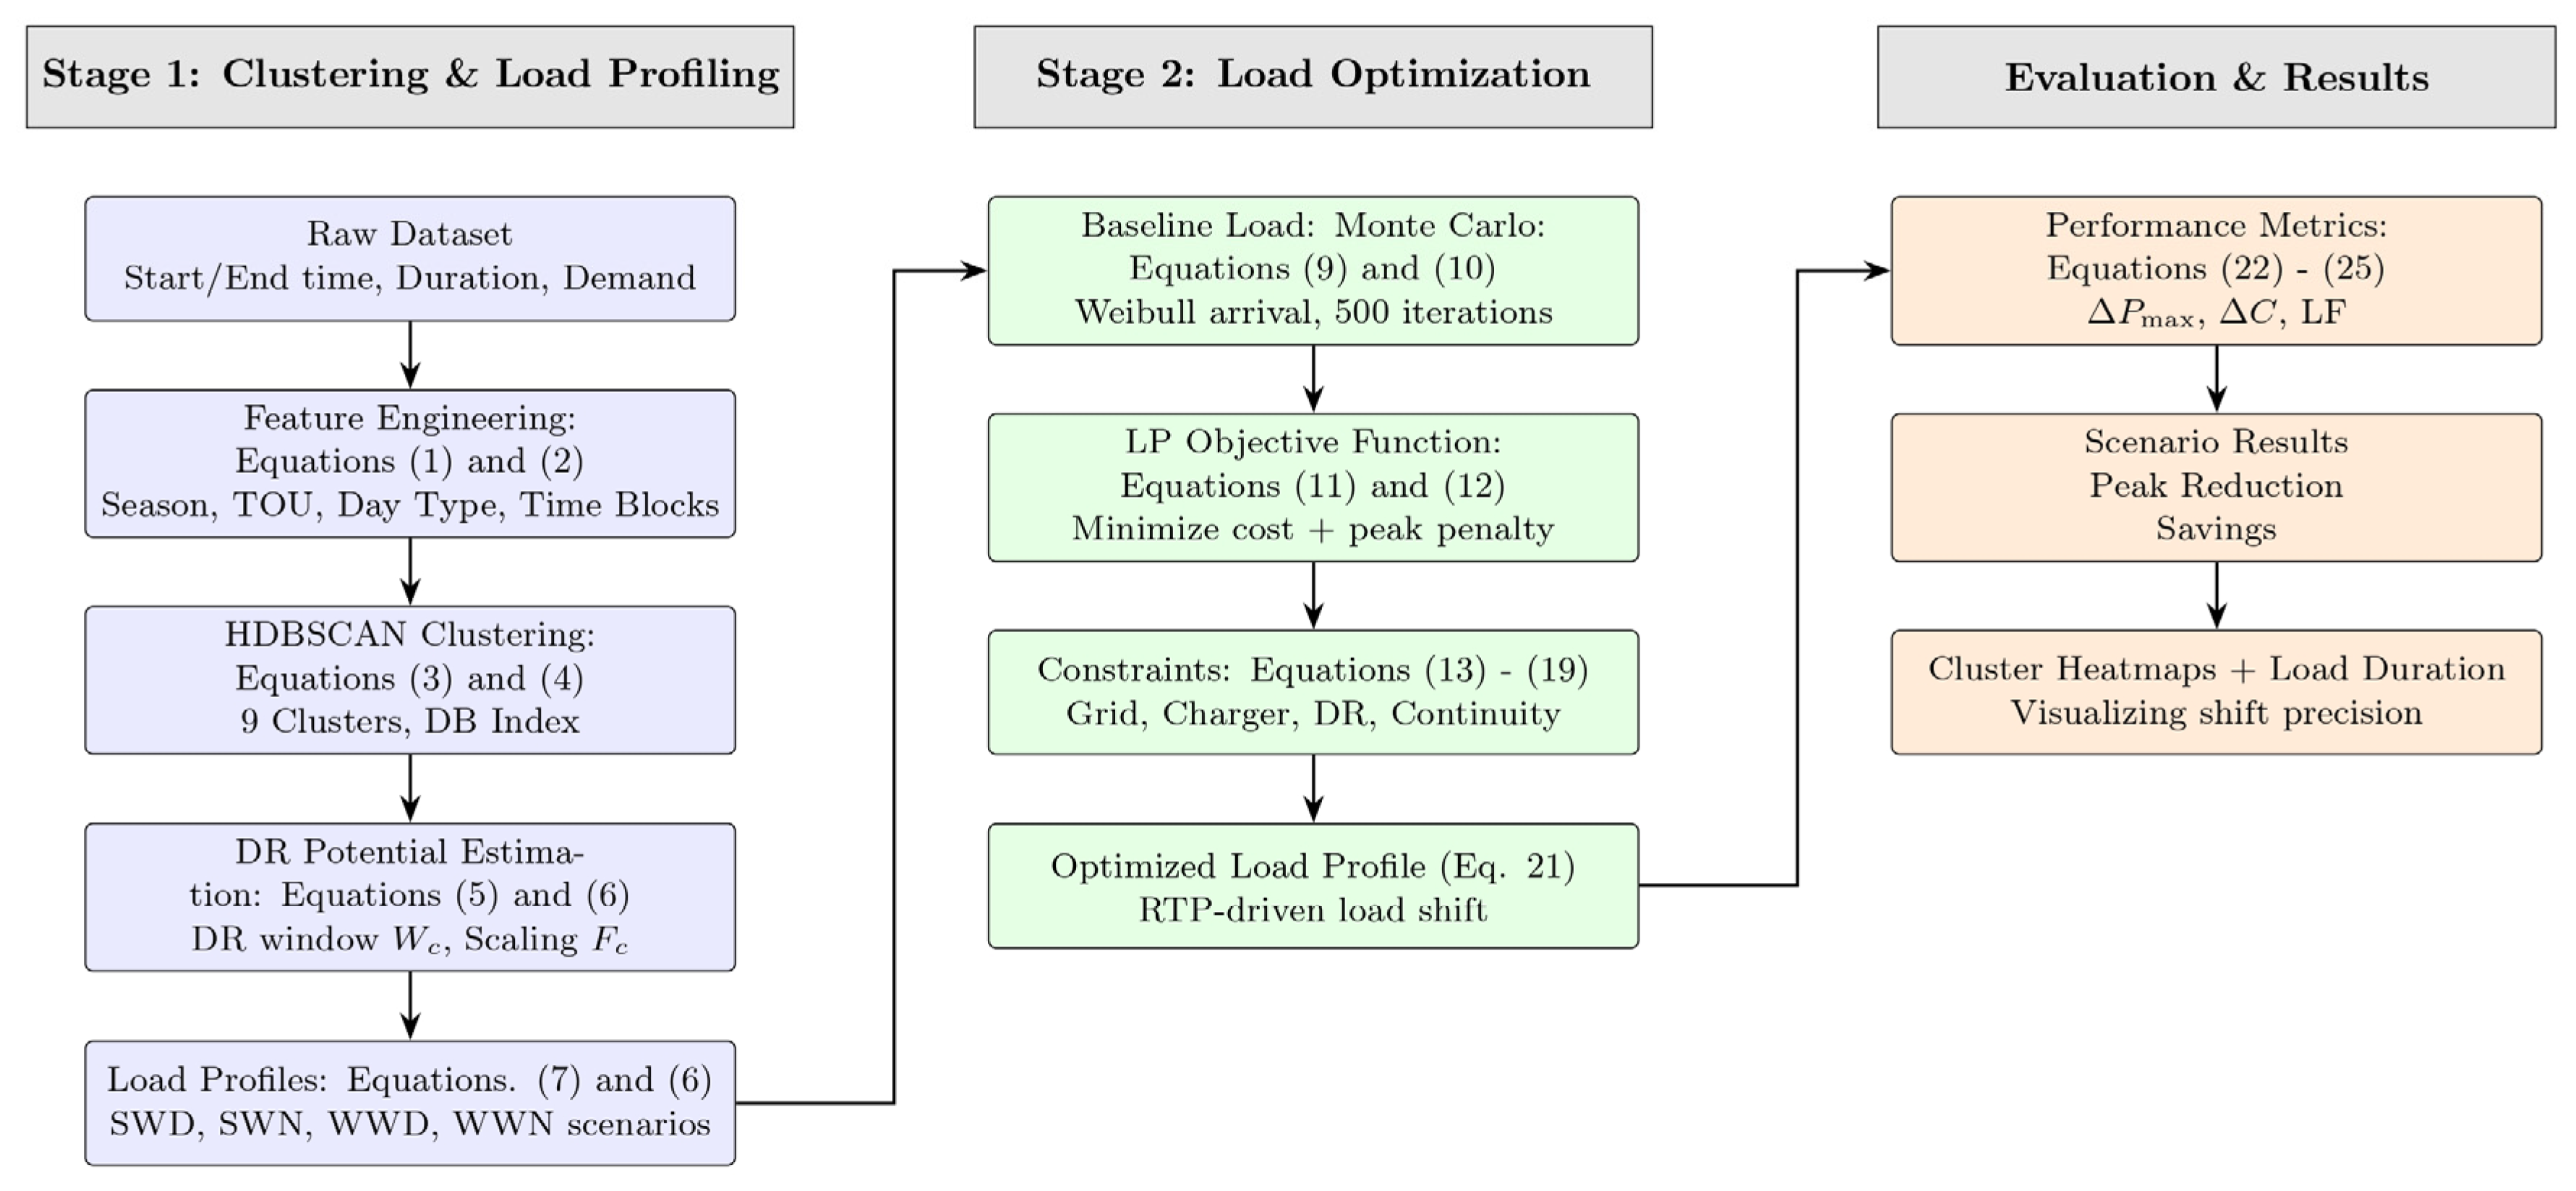
Figure 1. Stage-wise flowchart of the methodology.
Smartcities 08 00139 g001
Figure 2. Seasonal background load profiles for summer and winter, showing hourly demand variations on a 15 MW grid.
Smartcities 08 00139 g002
Figure 3. Generalized load profiles for Summer Weekday, Summer Weekend, Winter Weekday, and Winter Weekend, showing hourly EV charging demand.
Smartcities 08 00139 g003
Figure 4. Demand response potential by cluster, showing the shiftable load (kWh) for each of the nine identified clusters.
Smartcities 08 00139 g004
Figure 5. Load optimization plots showing original and optimized EV loads, background loads, total loads, and hourly cost savings: (a) For Summer Weekdays; (b) For Winter Weekdays.
Smartcities 08 00139 g005
Figure 6. Peak hour optimization across all scenarios, comparing original and optimized EV loads during peak hours.
Smartcities 08 00139 g006
Figure 7. Load duration curves across all scenarios, showing original, optimized, and reduced loads with corresponding load factors.
Smartcities 08 00139 g007
Figure 8. Real-time pricing and load profiles across scenarios.
Smartcities 08 00139 g008
Table 1. Comparison of clustering methods.
Clustering MethodSilhouette ScoreCalinski-Harabasz ScoreDBCV ScoreNoise Fraction (%)Number of ClustersNotes
HDBSCAN0.225356.1300.3551.629Best separation, low noise, interpretable clusters
K-means (k = 9)0.217514.720N/AN/A9Spherical clusters are less meaningful for temporal data
GMM (k = 9)0.206392.186N/AN/A9Gaussian assumption, moderate performance
DBSCAN0.00793.0590.24435.1225Over-segmentation, high noise despite tuning
Table 2. Detailed characteristics of HDBSCAN clusters.
Cluster IDDescriptionSessionsAvg Start HourAvg Duration (hrs)Avg Demand (kWh)% Weekday% WinterUser ProfileCharging Period
0Summer Weekend Morning Chargers38714:322.4117.710.0%0.0%ResidentialOff-peak (0:00–9:00)
1Winter Weekend Morning Chargers33614:812.4116.980.0%100.0%ResidentialOff-peak (0:00–9:00)
2Winter Weekday Evening Chargers27718:382.6818.63100.0%100.0%CommercialPeak (14:00–19:00)
3Winter Weekday Morning Chargers42912:651.7813.61100.0%100.0%CommercialOff-peak (9:00–13:00)
4Winter Weekday Night Chargers24113:823.2722.15100.0%100.0%ResidentialOff-peak (13:00–17:00)
5Summer Weekday Morning Chargers21610:411.6815.11100.0%0.0%CommercialOff-peak (9:00–13:00)
6Summer Weekday Evening Chargers26614:601.8115.66100.0%0.0%CommercialPeak (13:00–17:00)
7Summer Weekday Morning Chargers37918:842.9619.45100.0%0.0%ResidentialPeak (17:00–22:00)
8Summer Weekday Night Chargers20910:182.9020.37100.0%0.0%ResidentialOff-peak (20:00–23:00)
Table 3. Optimization results summary.
ScenarioSummer WeekdaySummer WeekendWinter WeekdayWinter Weekend
Original Cost ($)720.00626.41802.36613.08
Optimized Cost ($)699.11605.13768.65591.17
Cost Savings ($)27.3530.9750.7132.76
Cost Savings (%)2.874.125.314.62
Original Max Peak (kW)285.33273.45387.38296.18
Optimized Max Peak (kW)242.53232.43329.27251.75
Max Peak Reduction (kW)42.8041.0258.1144.43
Original Total Peak (kWh)1393.391362.182292.451534.59
Optimized Total Peak (kWh)1071.521016.121737.311160.21
Total Peak Reduction (kWh)321.87346.07555.15374.38
Total Peak Reduction (%)23.1025.4124.2224.40
Load Factor (Original)0.700.630.490.51
Load Factor (Optimized)0.820.740.570.60
Disclaimer/Publisher’s Note: The statements, opinions and data contained in all publications are solely those of the individual author(s) and contributor(s) and not of MDPI and/or the editor(s). MDPI and/or the editor(s) disclaim responsibility for any injury to people or property resulting from any ideas, methods, instructions or products referred to in the content.