
A Study on Imbalances in Urban Internal Spatial Capacity Allocation Based on High-Precision Population and Land Value Distribution Data

Abstract
Highlights
- The study constructed a composite land value prediction model using multi-source data, producing a high-precision spatial distribution of land values in Shanghai.
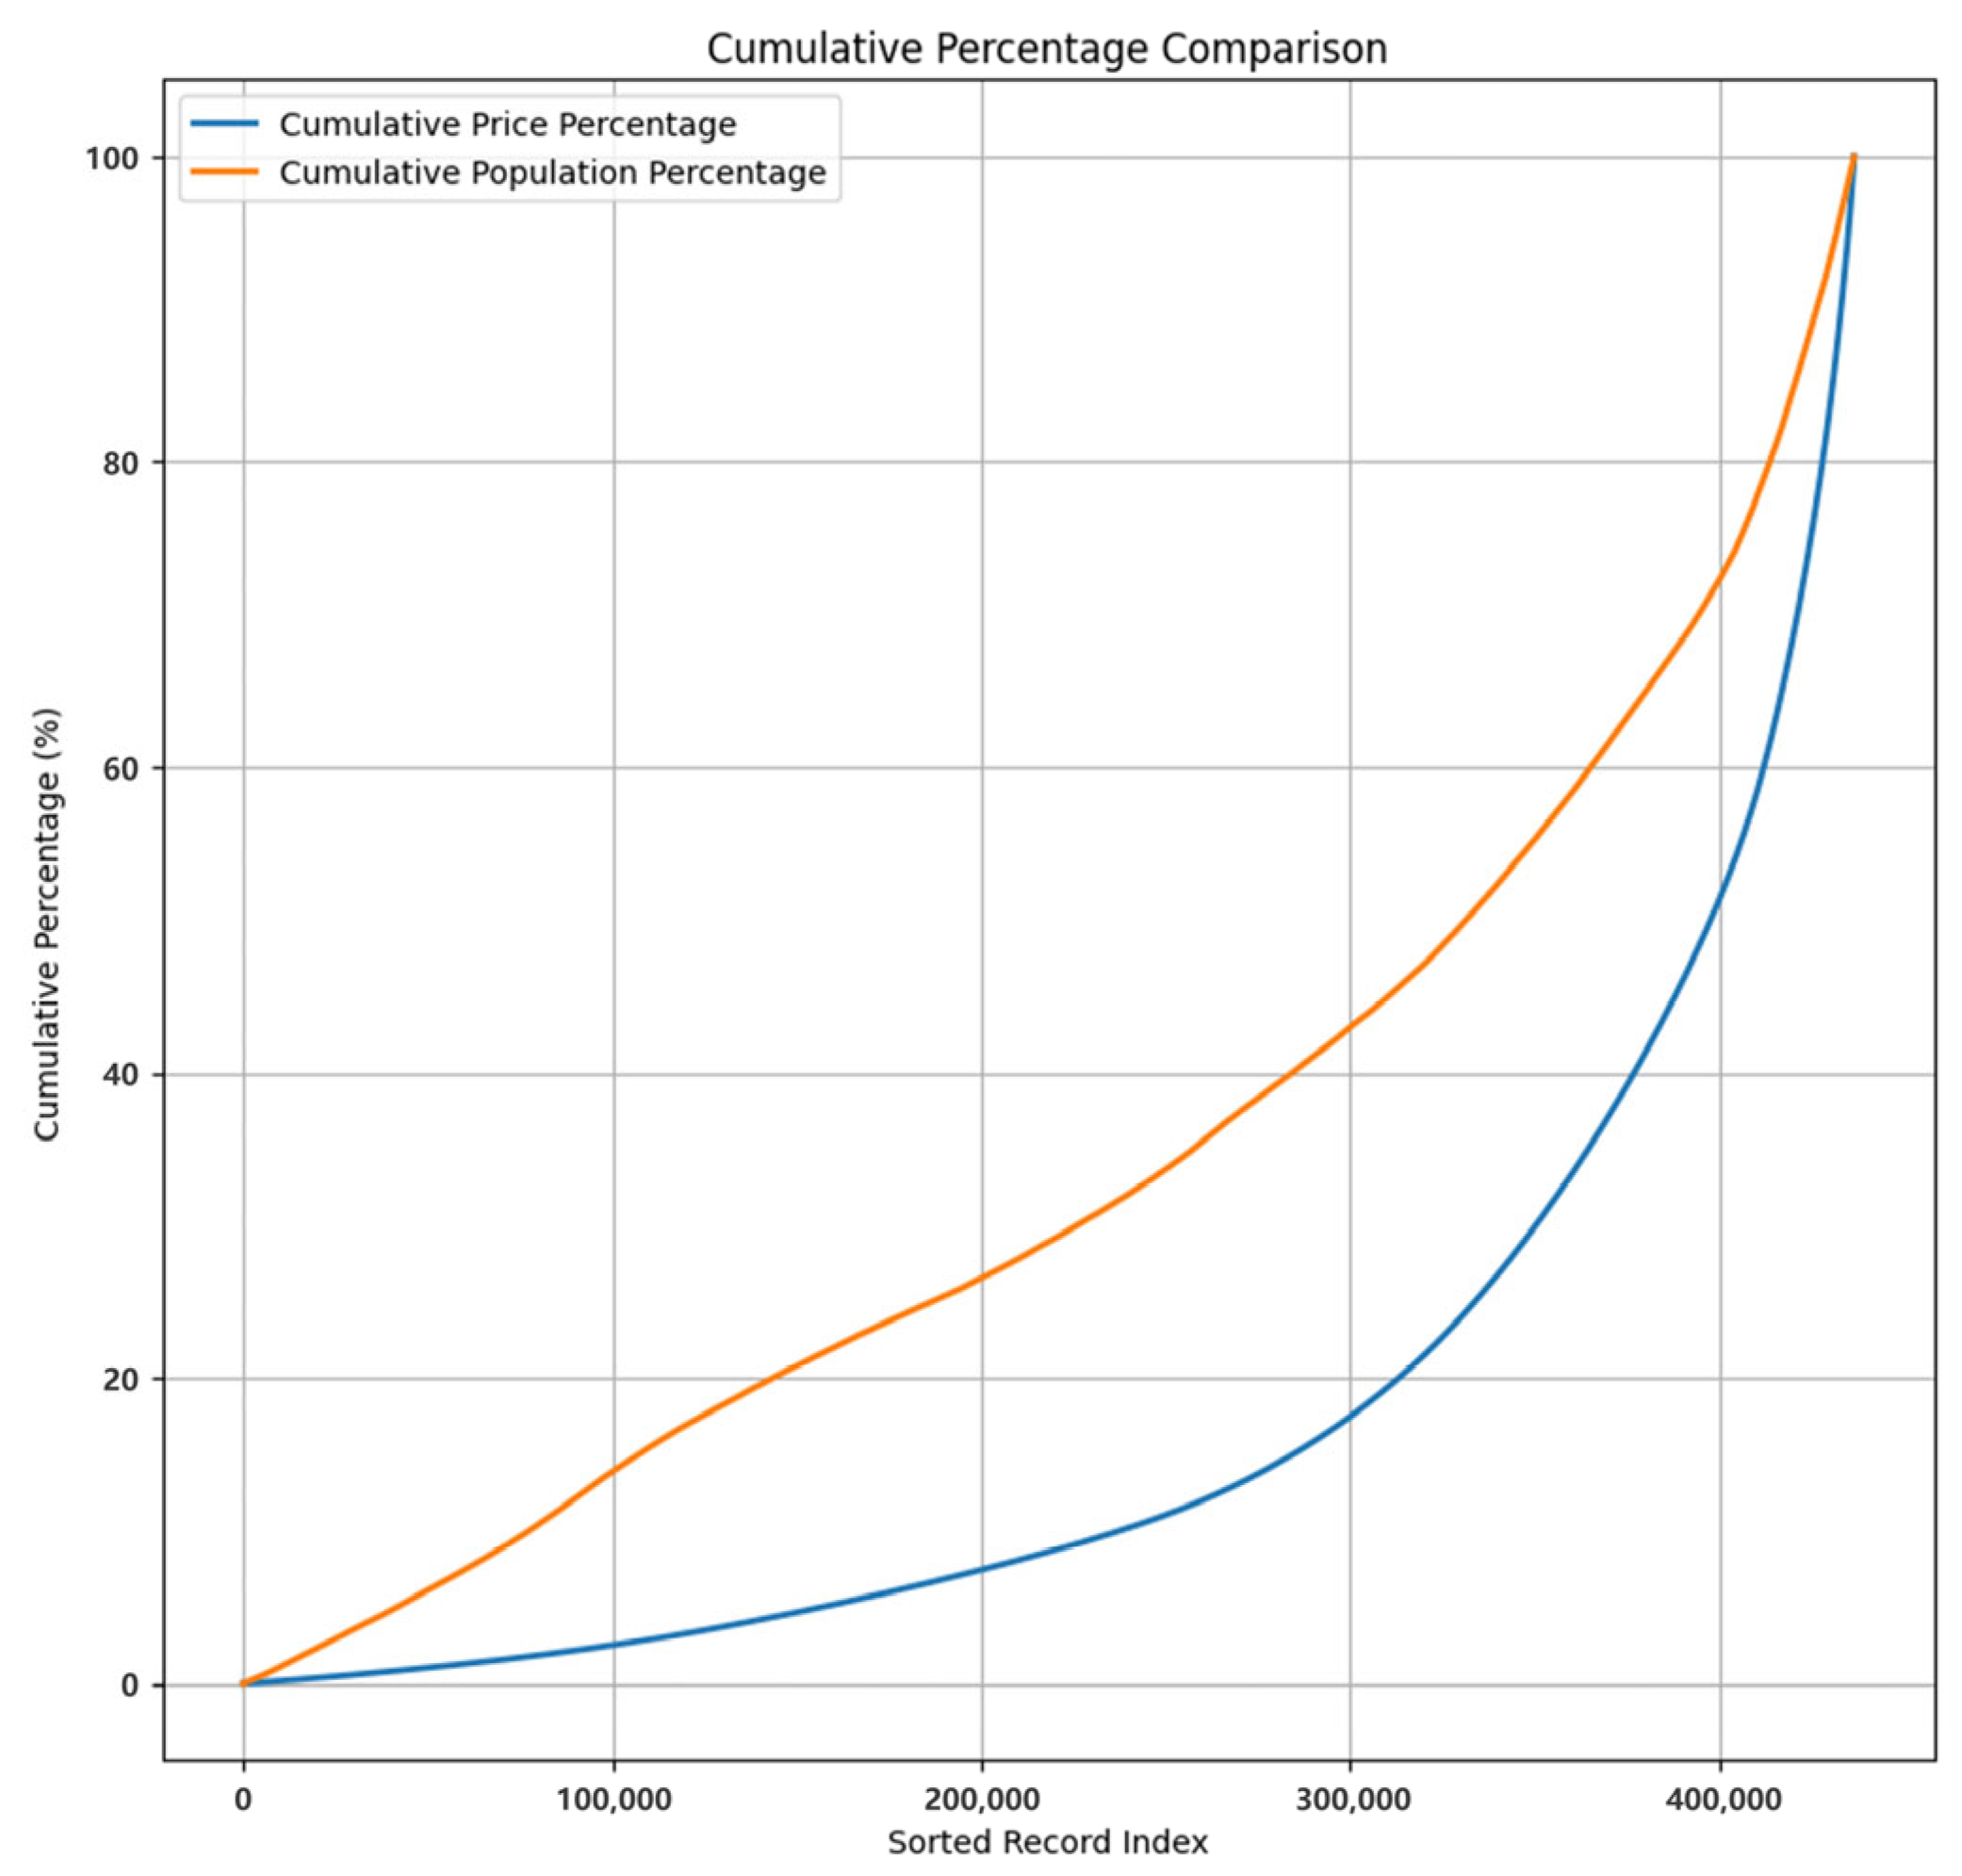
- The study compared the spatial distributions of population density and land values in Shanghai, and the results indicate a clear separation between the two.
- By integrating high-precision data on spatial distributions of population density and land values, the study enhanced the accuracy of identifying urban spatial mismatches, which will serve as a reference for optimizing the allocation of spatial resources.
- The separation between spatial distributions of population density and land values implies that spatial resources are not optimally allocated. This inefficiency could adversely affect urban operational performance and development, and it indicates that there is significant room for adjustments in current urban spatial management policies.
Abstract
1. Introduction
2. Materials and Methods
2.1. Population Raster Data and Correction
2.2. Land Value Prediction Model Construction
2.3. Design of the Spatial Mismatch Index
3. Results
3.1. Population Density Distribution
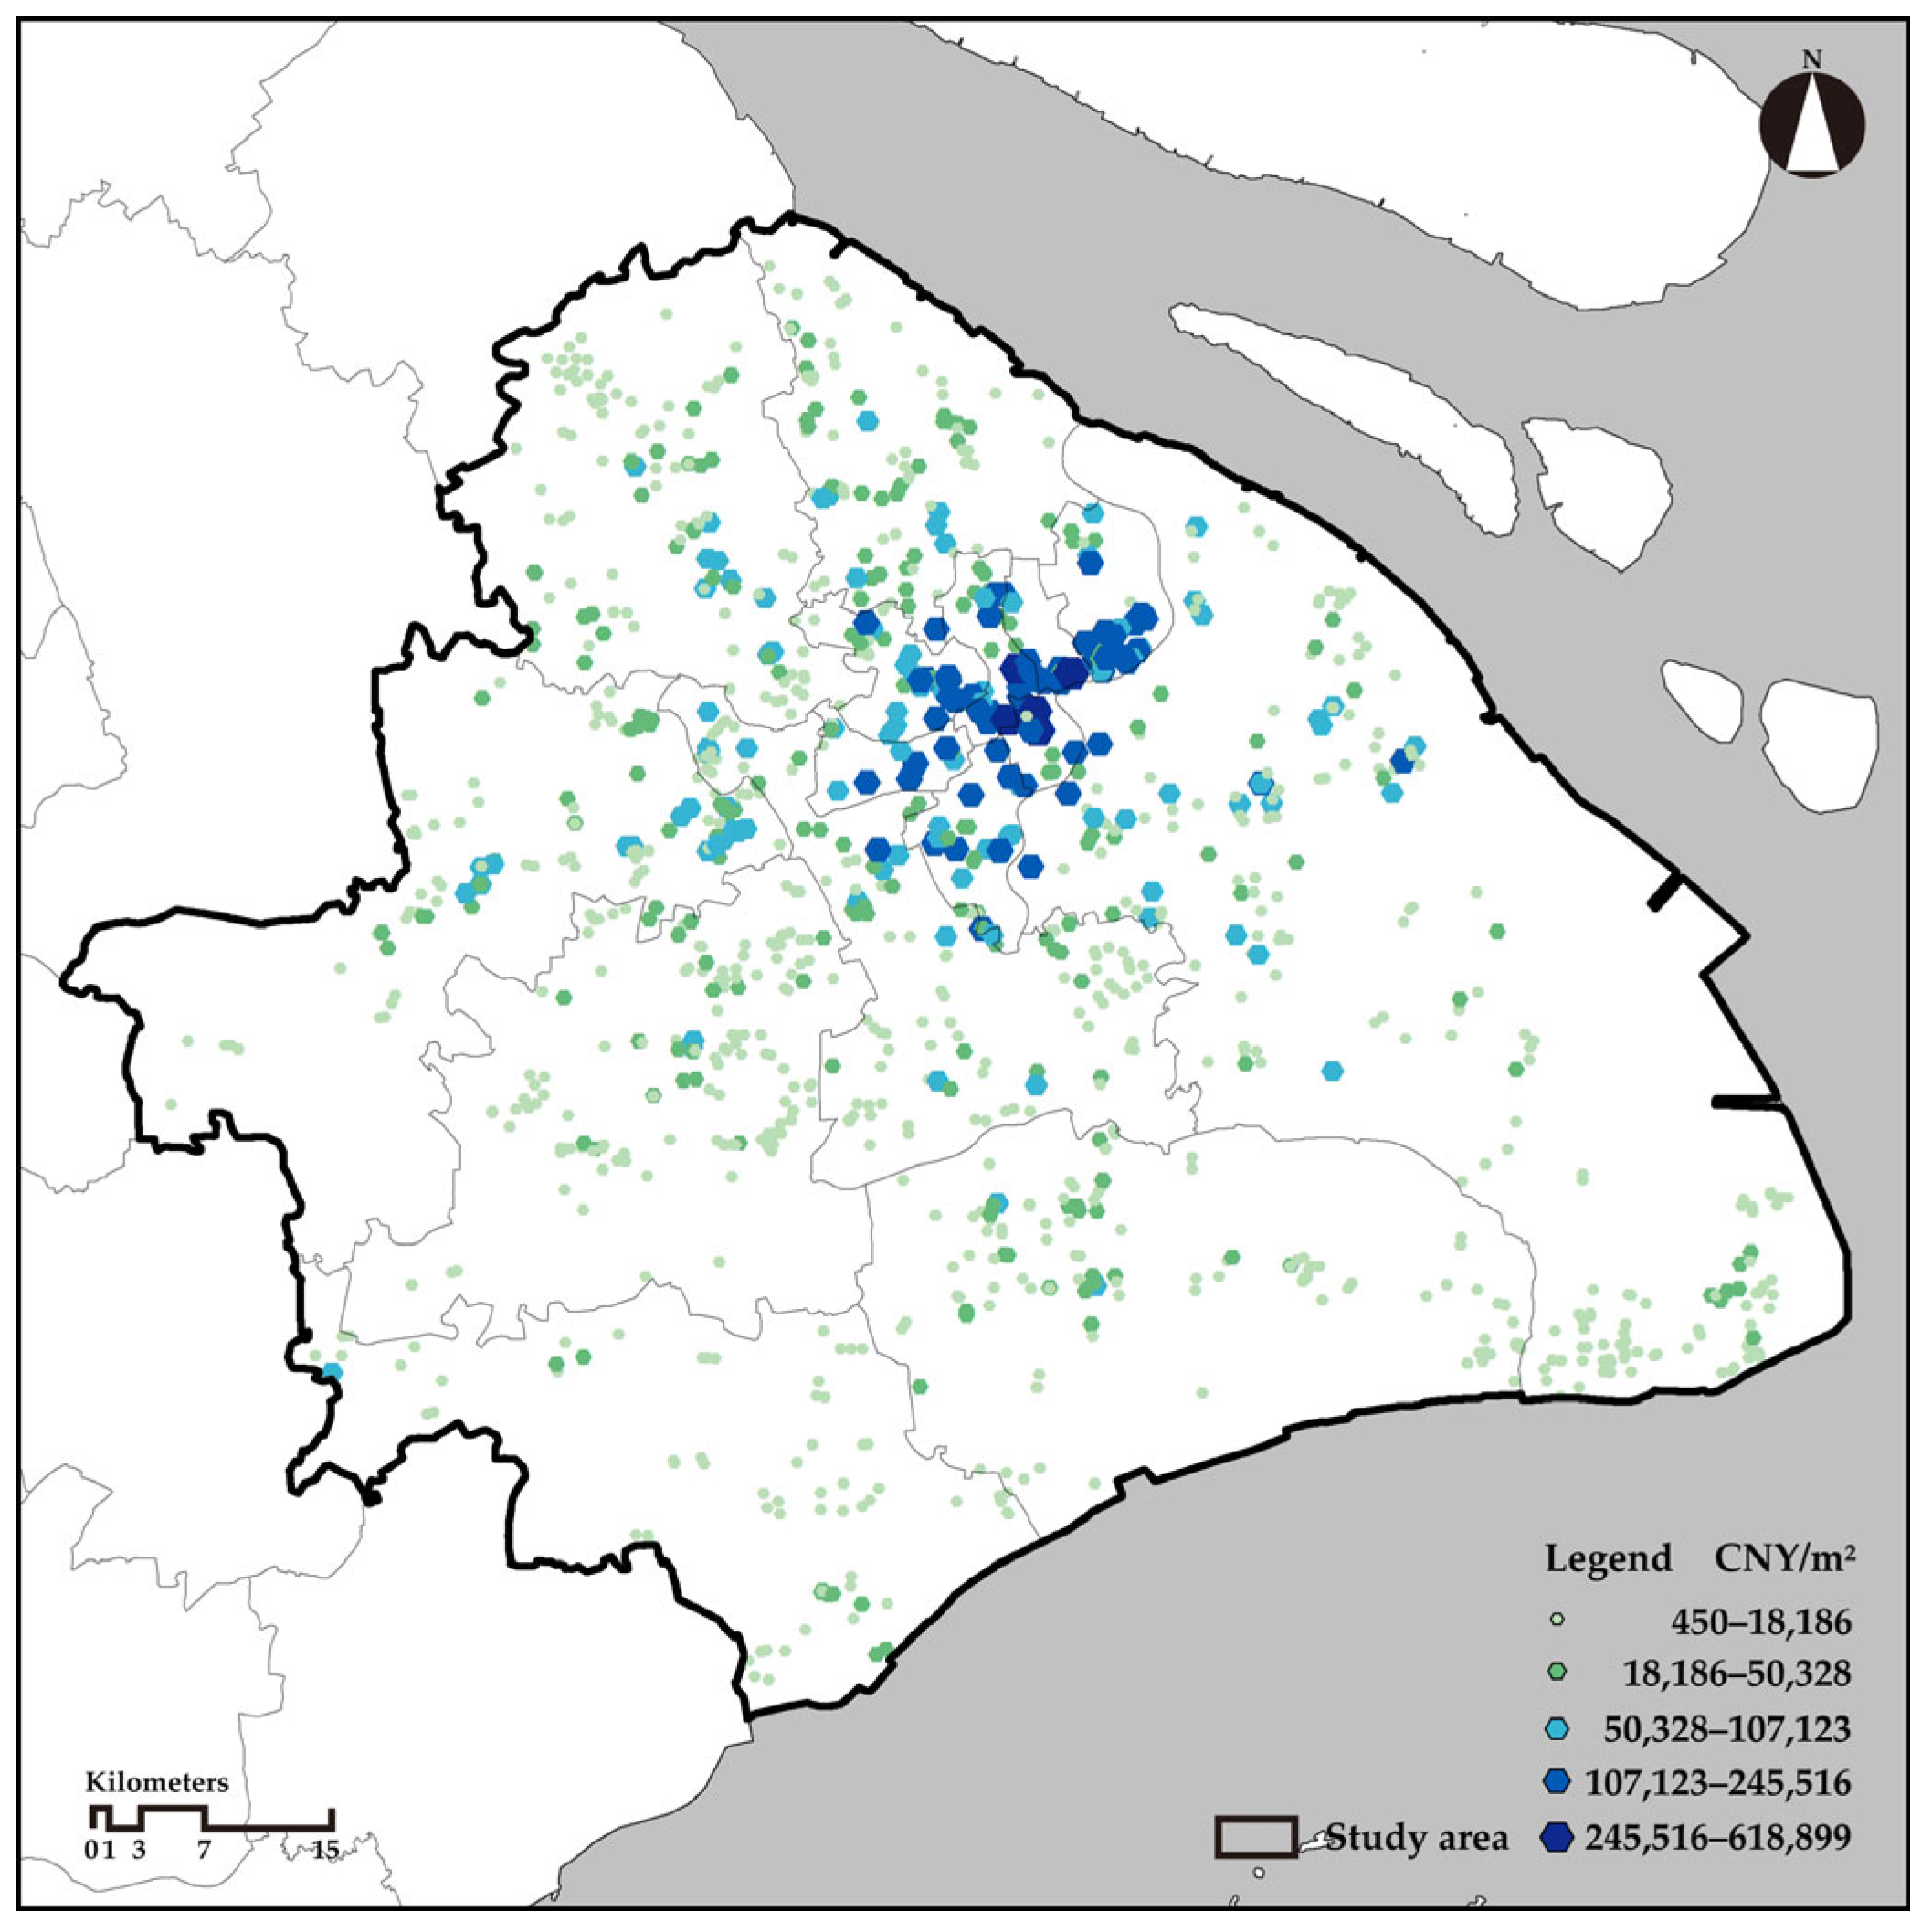
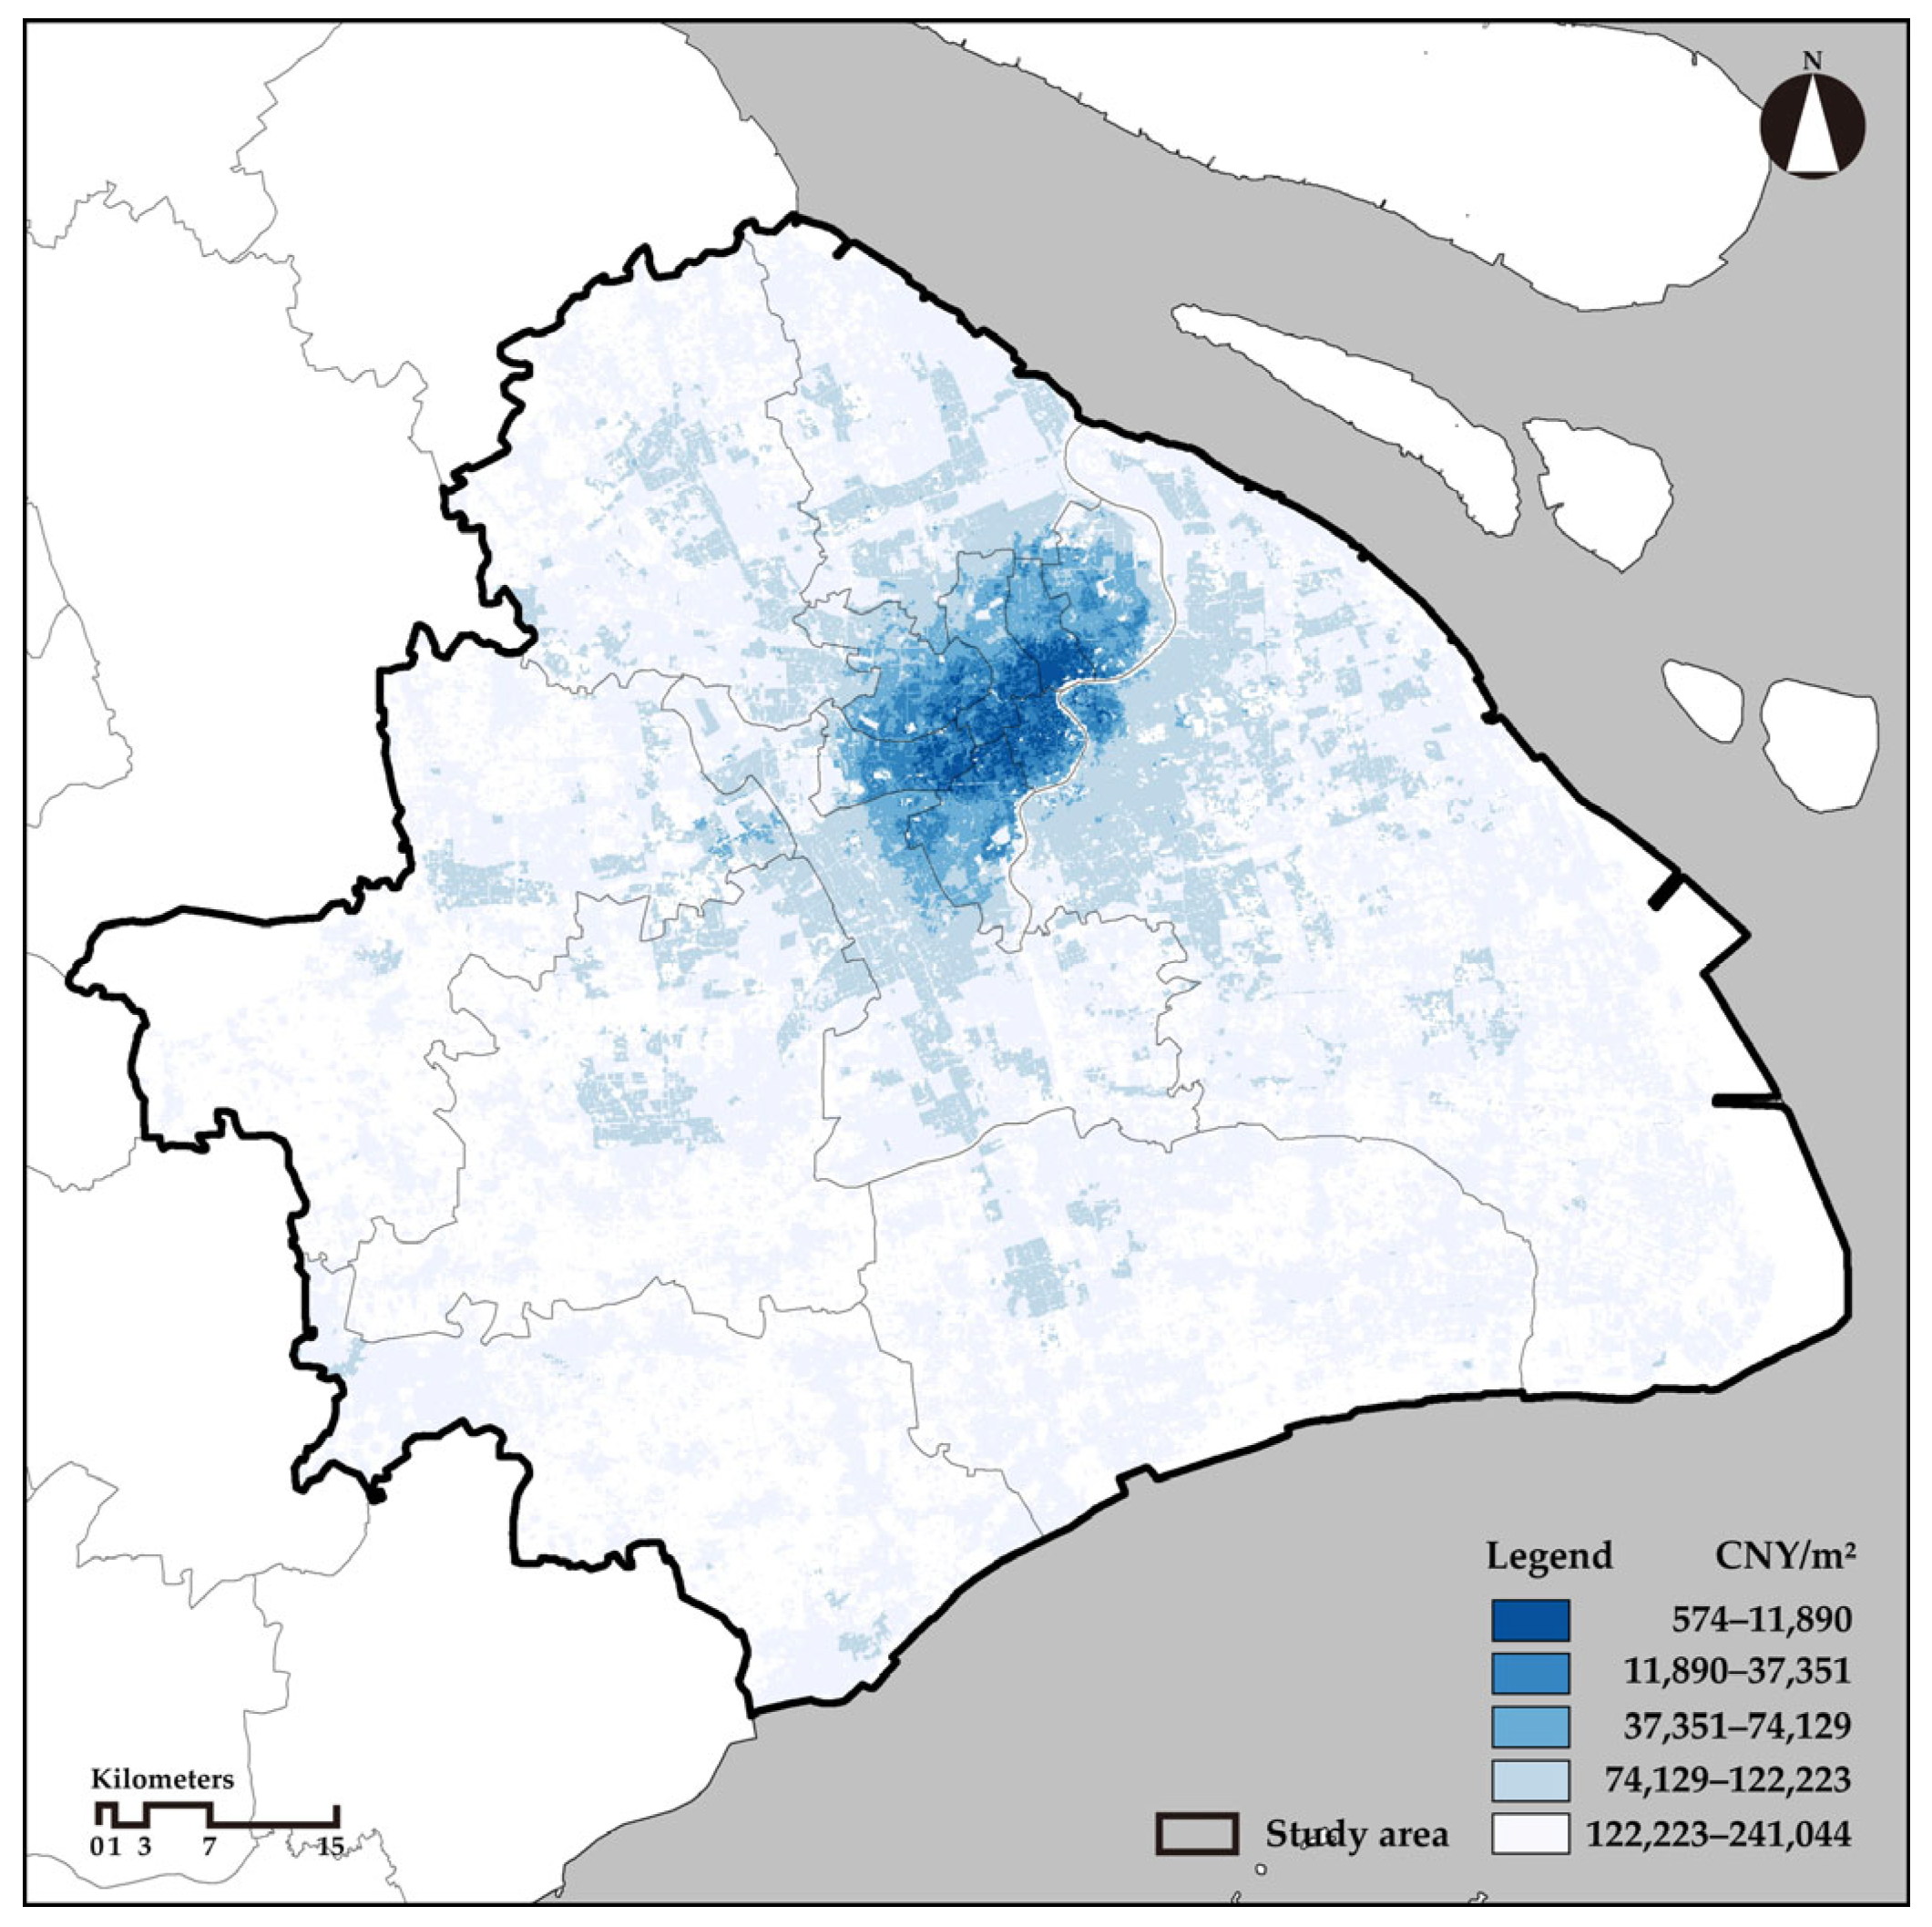
3.2. Land Value Distribution
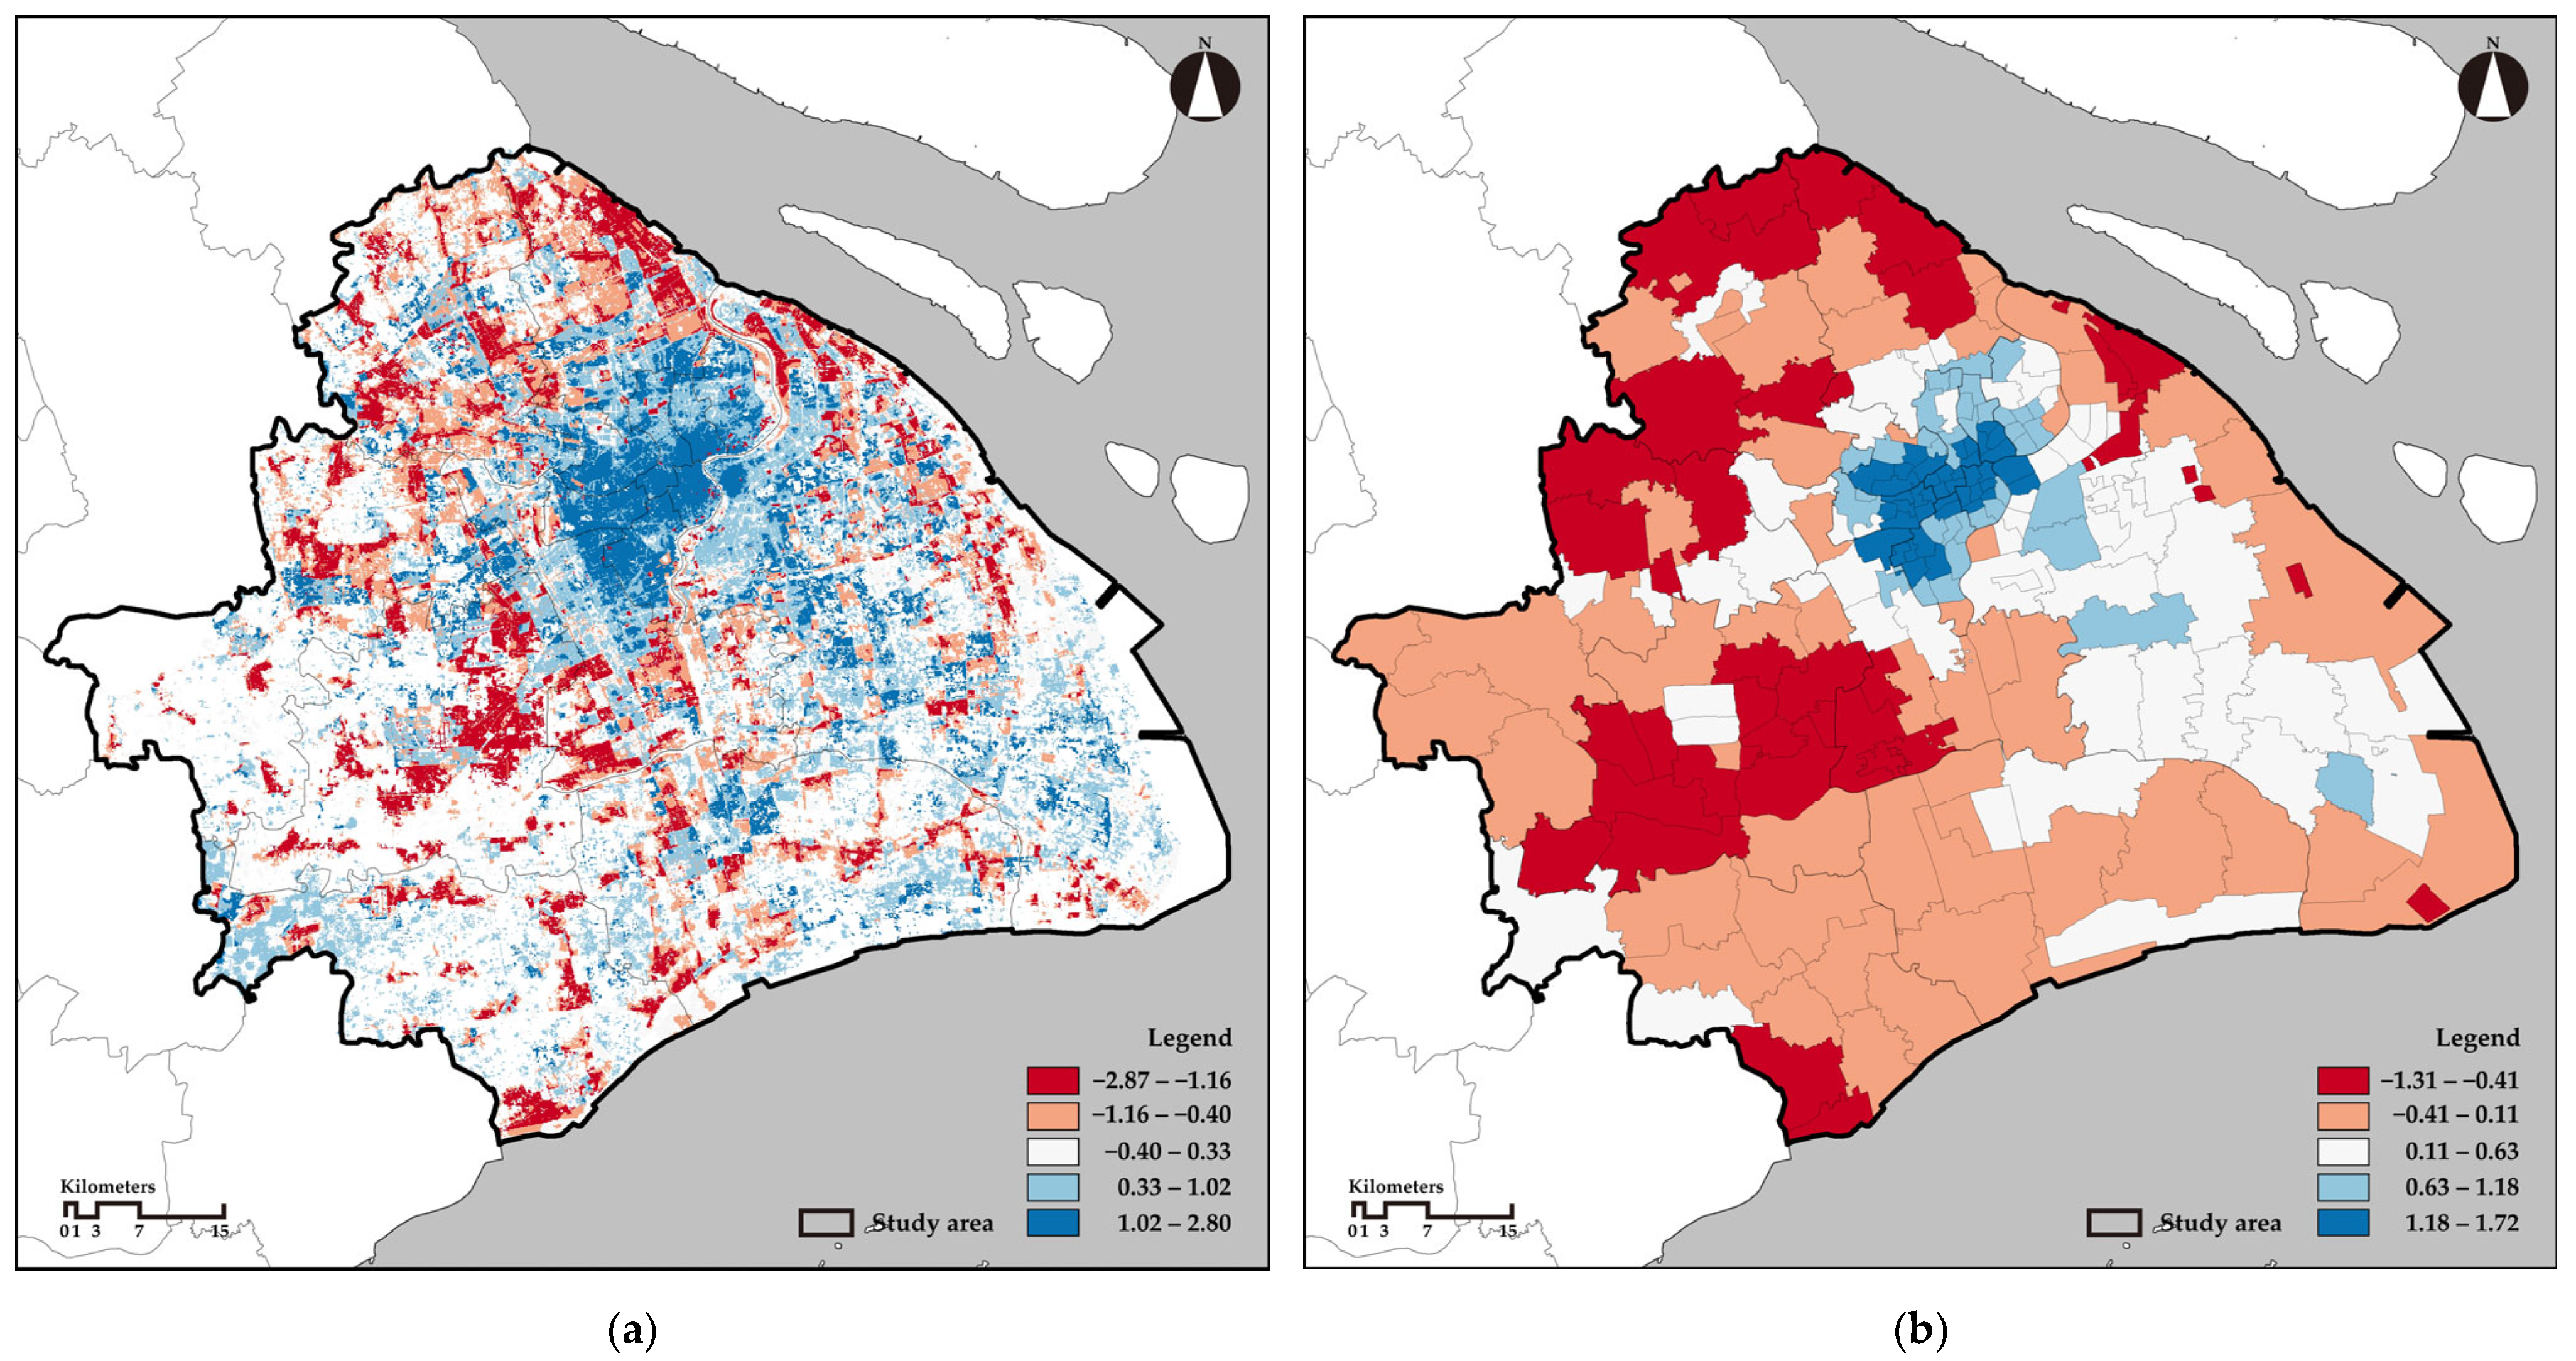
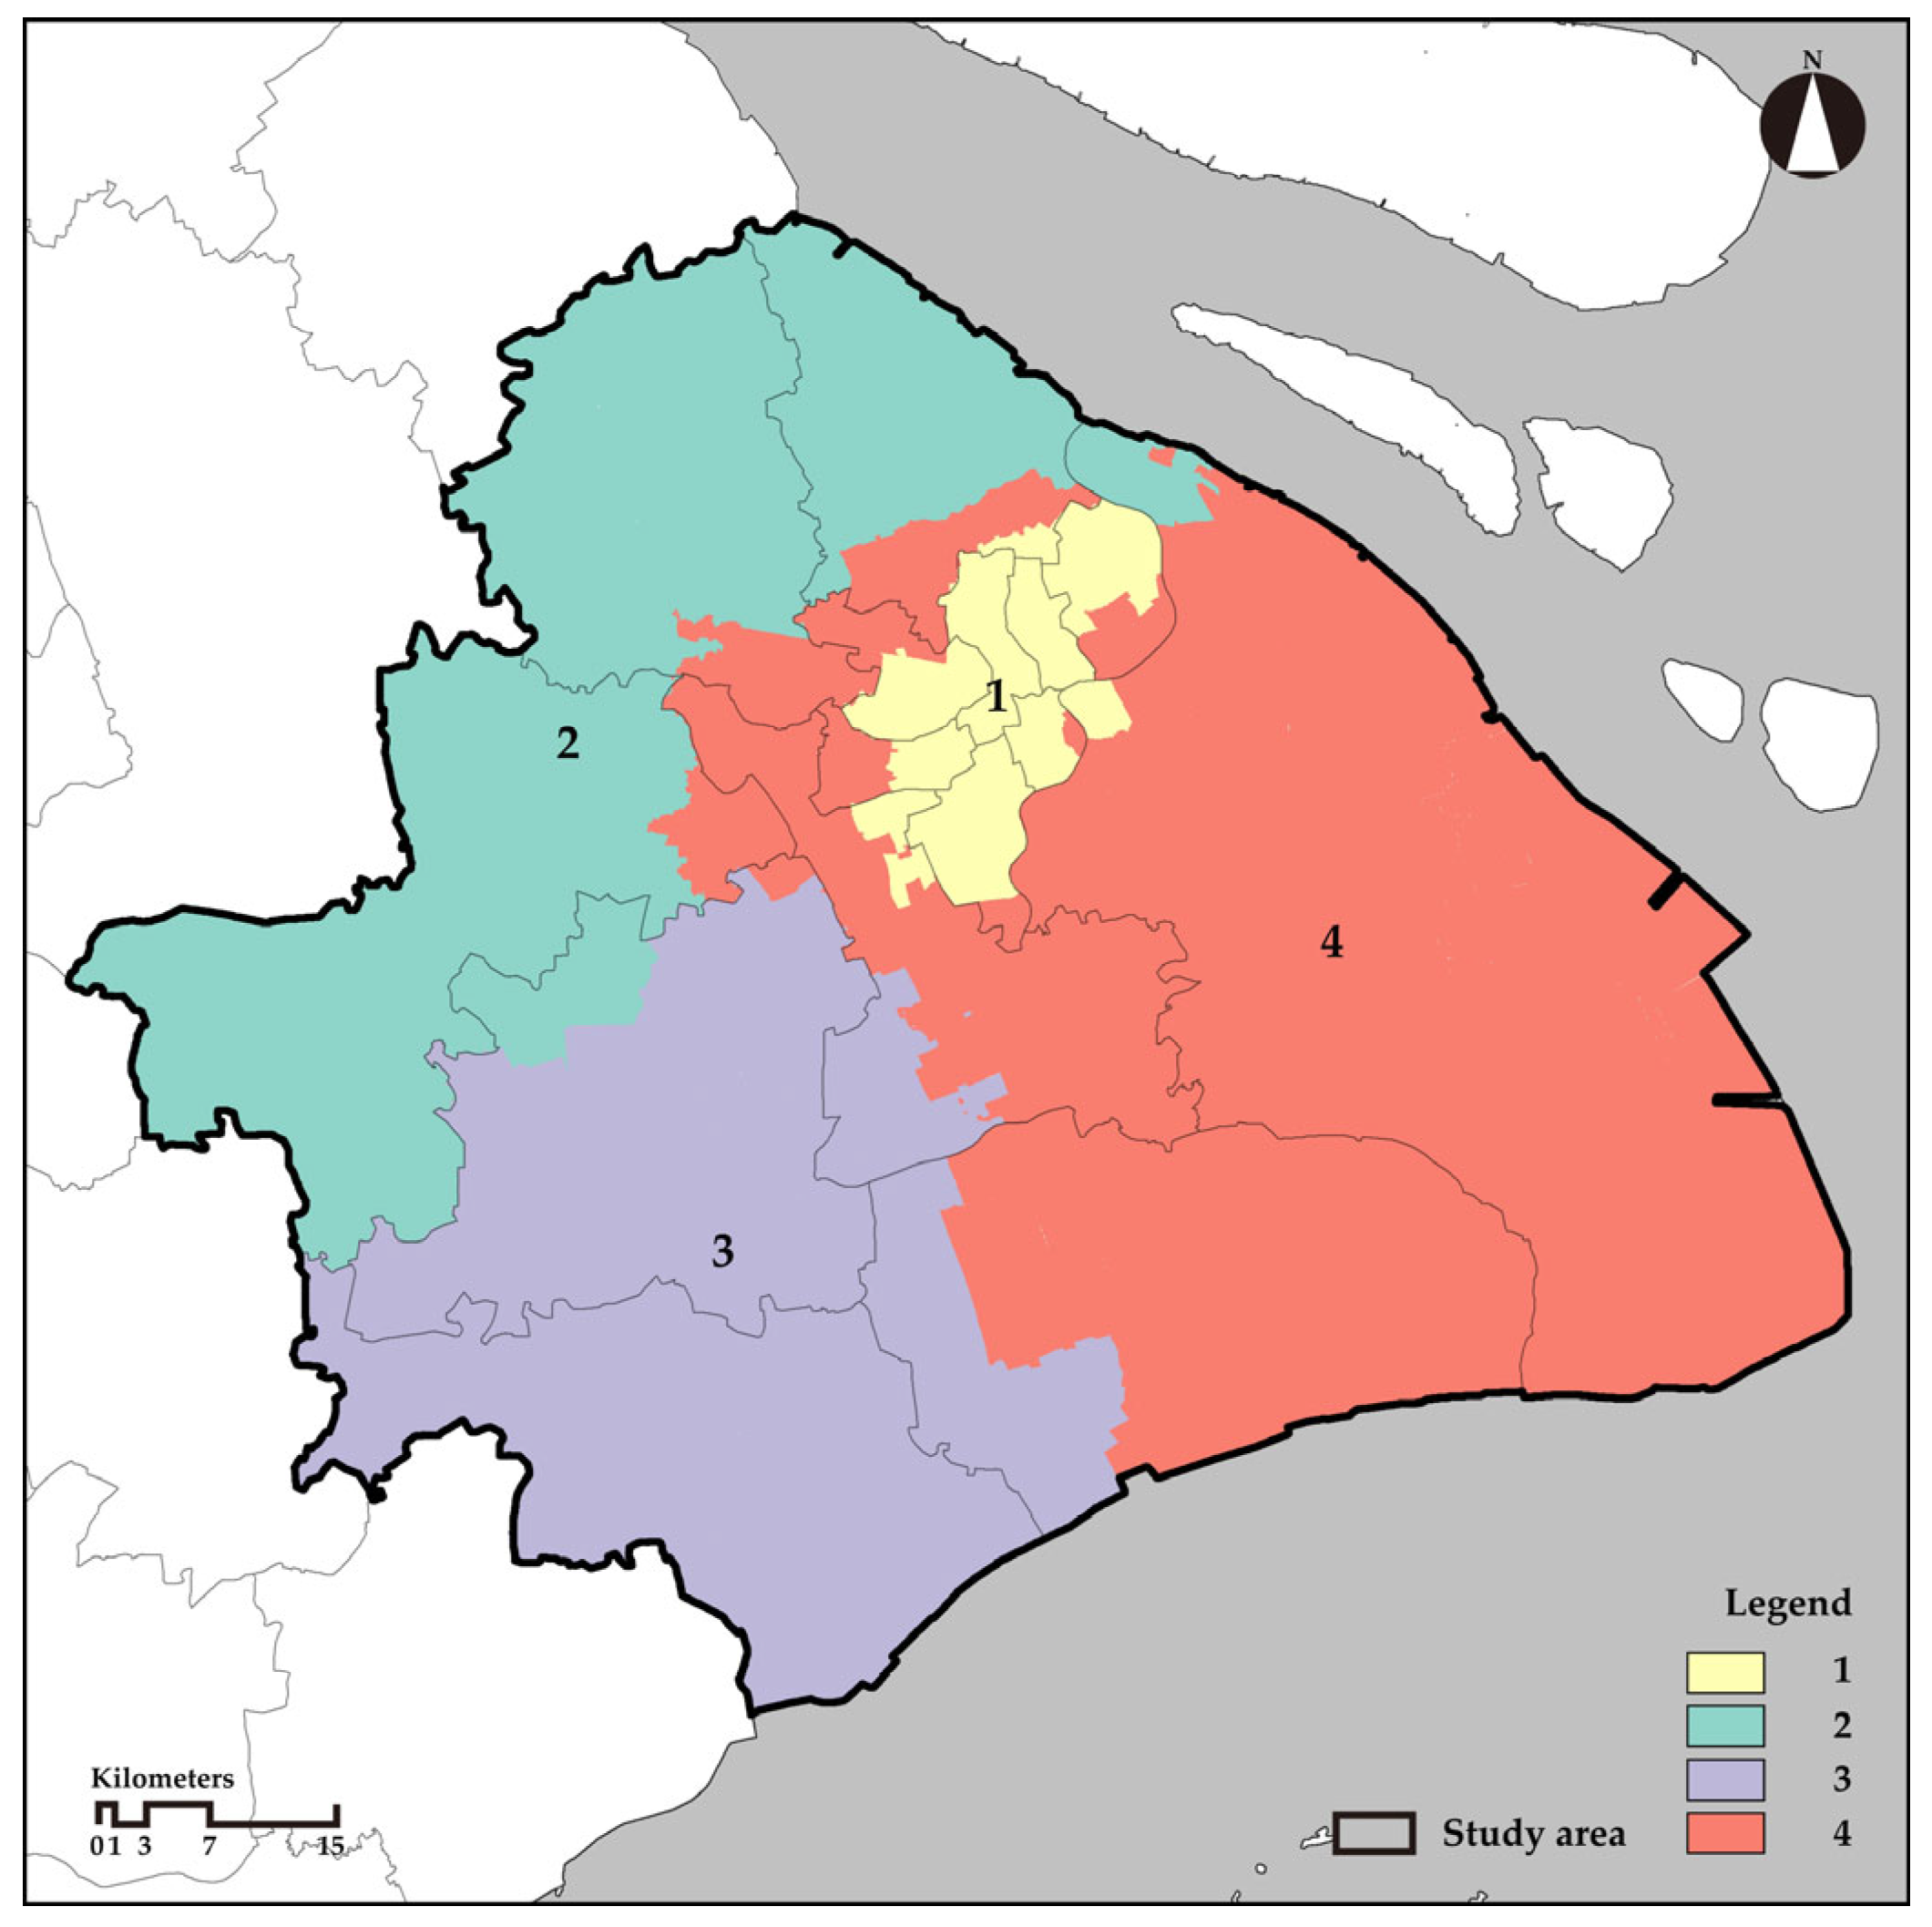
3.3. Spatial Mismatch Index Distribution
4. Discussion
4.1. Interpretation of Results
4.2. Policy Recommendations
4.3. Research Limitations and Future Directions
5. Conclusions
Author Contributions
Funding
Data Availability Statement
Conflicts of Interest
Abbreviations
| GWR | Geographically Weighted Regression |
| sDNA | Spatial Design Network Analysis |
| LASSO | Least Absolute Shrinkage and Selection Operator |
| GDP | Gross Domestic Product |
| GDPpc | Gross Domestic Product Per Capita |
| DEM | Digital Elevation Model |
| MHD | Mean Hybrid Distance |
| BtH | Betweenness Hybrid |
| MAE | Mean Absolute Error |
| MAPE | Mean Absolute Percentage Error |
| RMSE | Root Mean Square Error |
| R2 | Coefficient of Determination |
| Adjusted R2 | Adjusted Coefficient of Determination |
| SKATER | Spatial ‘K’luster Analysis by Tree Edge Removal |
References
- Wang, H.; Qiu, Y. Effect of new urbanization on cities’ innovation in China: Evidence from a quasi-natural experiment of a comprehensive pilot. PLoS ONE 2023, 18, e0284772. [Google Scholar] [CrossRef] [PubMed]
- Xiao, W.; Wei, D.; Li, H. Understanding Jobs-Housing Imbalance in Urban China: A Case Study of Shanghai. J. Transp. Land Use 2021, 14, 389–415. [Google Scholar] [CrossRef]
- Prud’homme, R.; Lee, C.-W. Size, sprawl, speed and the efficiency of Cities. Urban Stud. 1999, 36, 1849–1858. [Google Scholar] [CrossRef]
- Bertaud, A. Order Without Design: How Markets Shape Cities; MIT Press: Cambridge, MA, USA, 2018. [Google Scholar]
- Cheshire, P.; Sheppard, S. The Introduction of Price Signals into Land Use Planning Decision-making: A Proposal. Urban Stud. 2005, 42, 647–663. [Google Scholar] [CrossRef]
- Glaeser, E.L.; Gyourko, J.; Saks, R.E. Why Have Housing Prices Gone Up? Am. Econ. Rev. 2005, 95, 329–333. [Google Scholar] [CrossRef]
- Beswick, J.; Alexandri, G.; Byrne, M.; Vives-Miró, S.; Fields, D.; Hodkinson, S.; Janoschka, M. Speculating on London’s housing future. City 2016, 20, 321–341. [Google Scholar] [CrossRef]
- Hsieh, C.-T.; Moretti, E. Housing Constraints and Spatial Misallocation. Am. Econ. J. Macroecon. 2019, 11, 1–39. [Google Scholar] [CrossRef]
- Chapple, K.; Song, T. Can New Housing Supply Mitigate Displacement and Exclusion? J. Am. Plan. Assoc. 2025, 91, 1–15. [Google Scholar] [CrossRef]
- Serrano-Martínez, J.M.; García-Marín, R.; Lagar-Timón, D. Housing, population and region in Spain: A currently saturated property market with marked regional differences. Geogr. J. 2017, 183, 126–139. [Google Scholar] [CrossRef]
- Li, B.; Guan, M.; Zhan, L.; Liu, C.; Zhang, Z.; Jiang, H.; Zhang, Y.; Dong, G. Urban Comprehensive Carrying Capacity and Development Order: A “Pressure-Capacity-Potential” Logical Framework. Front. Environ. Sci. 2022, 10, 935498. [Google Scholar] [CrossRef]
- Füss, R.; Koller, J.A.; Weigand, A. Determining Land Values from Residential Rents. Land 2021, 10, 336. [Google Scholar] [CrossRef]
- Bertaud, A. The Spatial Distribution of Land Prices and Densities: The Models Developed by Economists. Working Paper #23, Marron Institute, New York University, 19 February 2015. Available online: https://marroninstitute.nyu.edu/uploads/content/Bertaud_-_The_Spatial_Distribution_of_Land_Prices_and_Densities.pdf (accessed on 24 March 2025).
- Clark, C. Urban Population Densities. J. R. Stat. Society. Ser. A (Gen.) 1951, 114, 490. [Google Scholar] [CrossRef]
- Alonso, W. Location and Land Use: Toward a General Theory of Land Rent; Harvard Univeristy Press: Cambridge, MA, USA, 1964. [Google Scholar]
- Mills, E.S. An Aggregative Model of Resource Allocation in a Metropolitan Area. Am. Econ. Rev. 1967, 57, 197–210. [Google Scholar]
- Muth, R.F. Cities and Housing: The Spatial Pattern of Urban Residential Land Use; University of Chicago Press: Chicago, IL, USA, 1969. [Google Scholar]
- Brueckner, J.K. Lectures on Urban Economics; MIT Press: Cambridge, MA, USA, 2011. [Google Scholar]
- Ottensmann, J.R. Urban Sprawl, Land Values and the Density of Development. Land Econ. 1977, 53, 389–400. [Google Scholar] [CrossRef]
- Hansen, J.D.; Kristensen, G. Price Profiles for Land in Danish Urban Areas. Urban Stud. 1991, 28, 277–287. [Google Scholar] [CrossRef]
- Grengs, J. Job Accessibility and the Modal Mismatch in Detroit. J. Transp. Geogr. 2010, 18, 42–54. [Google Scholar] [CrossRef]
- Sun, W.; Jin, H.; Chen, Y.; Hu, X.; Li, Z.; Kidd, A.; Liu, C. Spatial mismatch analyses of school land in China using a spatial statistical approach. Land Use Policy 2021, 108, 105543. [Google Scholar] [CrossRef]
- Xu, G.; Su, J.; Xia, C.; Li, X.; Xiao, R. Spatial mismatches between nighttime light intensity and building morphology in Shanghai, China. Sustain. Cities Soc. 2022, 81, 103851. [Google Scholar] [CrossRef]
- Li, J.; Geneletti, D.; Wang, H. Understanding supply-demand mismatches in ecosystem services and interactive effects of drivers to support spatial planning in Tianjin metropolis, China. Sci. Total Environ. 2023, 895, 165067. [Google Scholar] [CrossRef]
- Shen, L.; Zhang, L.; Bao, H.; Wong, S.; Du, X.; Wei, X. An Empirical Study on the Mismatch Phenomenon in Utilizing Urban Land Resources in China. Land 2023, 12, 1196. [Google Scholar] [CrossRef]
- Liotta, C.; Viguié, V.; Lepetit, Q. Testing the monocentric standard urban model in a global sample of cities. Reg. Sci. Urban Econ. 2022, 97, 103832. [Google Scholar] [CrossRef]
- Combes, P.-P.; Duranton, G.; Gobillon, L. The Costs of Agglomeration: House and Land Prices in French Cities. Rev. Econ. Stud. 2019, 86, 1556–1589. [Google Scholar] [CrossRef]
- Duranton, G.; Puga, D. The Economics of Urban Density. J. Econ. Perspect. 2020, 34, 3–26. [Google Scholar] [CrossRef]
- Wang, X.; Zhang, X. A Regional Comparative Study on the Mismatch between Population Urbanization and Land Urbanization in China. PLoS ONE 2023, 18, e0287366. [Google Scholar] [CrossRef]
- Egidi, G.; Cividino, S.; Quaranta, G.; Alhuseen, A.; Salvati, L. Land mismatches, urban growth and spatial planning: A contribution to metropolitan sustainability. Environ. Impact Assess. Rev. 2020, 84, 106439. [Google Scholar] [CrossRef]
- Ben-Moshe, D.; Genesove, D. Regulation and Frontier Housing Supply. arXiv 2022, arXiv:2208.01969. [Google Scholar] [CrossRef]
- Zhou, X.; Chen, X.; Zhang, T. Impact of Megacity Jobs-Housing Spatial Mismatch on Commuting Behaviors: A Case Study on Central Districts of Shanghai, China. Sustainability 2016, 8, 122. [Google Scholar] [CrossRef]
- Xiao, W.; Wei, Y.D.; Li, H. Spatial Inequality of Job Accessibility in Shanghai: A Geographical Skills Mismatch Perspective. Habitat Int. 2021, 115, 102401. [Google Scholar] [CrossRef]
- Stevens, F.R.; Gaughan, A.E.; Linard, C.; Tatem, A.J. Disaggregating Census Data for Population Mapping Using Random Forests with Remotely-Sensed and Ancillary Data. PLoS ONE 2015, 10, e0107042. [Google Scholar] [CrossRef]
- Reed, F.J.; Gaughan, A.E.; Stevens, F.R.; Yetman, G.; Sorichetta, A.; Tatem, A.J. Gridded Population Maps Informed by Different Built Settlement Products. Data 2018, 3, 33. [Google Scholar] [CrossRef]
- Stevens, F.R.; Gaughan, A.E.; Nieves, J.J.; King, A.; Sorichetta, A.; Linard, C.; Tatem, A.J. Comparisons of Two Global Built Area Land Cover Datasets in Methods to Disaggregate Human Population in Eleven Countries from the Global South. Int. J. Digit. Earth 2019, 13, 78–100. [Google Scholar] [CrossRef]
- Thomson, D.R.; Leasure, D.R.; Bird, T.; Tzavidis, N.; Tatem, A.J. How accurate are WorldPop-Global-Unconstrained gridded population data at the cell-level? A simulation analysis in urban Namibia. PLoS ONE 2022, 17, e0271504. [Google Scholar] [CrossRef] [PubMed]
- Shanghai Public Resource Trading Center. Available online: https://biz.ghzyj.sh.gov.cn/shtdsc/wz/ (accessed on 24 March 2025).
- Liu, Y.; Zheng, B.; Turkstra, J.; Huang, L. A Hedonic Model Comparison for Residential Land Value Analysis. Int. J. Appl. Earth Obs. Geoinf. 2010, 12, S181–S193. [Google Scholar] [CrossRef]
- Morales, J.; Stein, A.; Flacke, J.; Zevenbergen, J. Predictive Land Value Modelling in Guatemala City Using a Geostatistical Approach and Space Syntax. Int. J. Geogr. Inf. Sci. 2020, 34, 1451–1474. [Google Scholar] [CrossRef]
- Giannopoulou, M.; Vavatsikos, A.P.; Lykostratis, K. A Process for Defining Relations between Urban Integration and Residential Market Prices. Procedia—Soc. Behav. Sci. 2016, 223, 153–159. [Google Scholar] [CrossRef]
- Xiao, Y.; Orford, S.; Webster, C.J. Urban Configuration, Accessibility, and Property Prices: A Case Study of Cardiff, Wales. Environ. Plan. B Plan. Des. 2015, 43, 108–129. [Google Scholar] [CrossRef]
- Morales, J.; Flacke, J.; Zevenbergen, J. Modelling Residential Land Values Using Geographic and Geometric Accessibility in Guatemala City. Environ. Plan. B Urban Anal. City Sci. 2017, 46, 751–776. [Google Scholar] [CrossRef]
- Cooper, C.H.V.; Chiaradia, A.J.F. SDNA: 3-D Spatial Network Analysis for GIS, CAD, Command Line & Python. SoftwareX 2020, 12, 100525. [Google Scholar] [CrossRef]
- Hillier, B.; Iida, S. Network and Psychological Effects in Urban Movement. In Proceedings of the Spatial Information Theory, Ellicottville, NY, USA, 14–18 September 2005; pp. 475–490. [Google Scholar] [CrossRef]
- Turner, A. From Axial to Road-Centre Lines: A New Representation for Space Syntax and a New Model of Route Choice for Transport Network Analysis. Environ. Plan. B Plan. Des. 2007, 34, 539–555. [Google Scholar] [CrossRef]
- Zhang, L.; Chiaradia, A.J. Walking in the Cities without Ground, How 3D Complex Network Volumetrics Improve Analysis. Environ. Plan. B Urban Anal. City Sci. 2022, 49, 1857–1874. [Google Scholar] [CrossRef]
- Cooper, C. Spatial Design Network Analysis (sDNA) Version 4.1 Manual; Cardiff University: Cardiff, UK, 2024; Available online: http://sdna.cardiff.ac.uk/sdna/software/documentation (accessed on 24 March 2025).
- Des Rosiers, F.; Thériault, M.; Villeneuve, P. Sorting Out Access and Neighbourhood Factors in Hedonic Price Modelling. J. Prop. Invest. Financ. 2000, 18, 291–315. [Google Scholar] [CrossRef]
- Law, S. Defining Street-Based Local Area and Measuring Its Effect on House Price Using a Hedonic Price Approach: The Case Study of Metropolitan London. Cities 2017, 60, 166–179. [Google Scholar] [CrossRef]
- Hengl, T.; Heuvelink, G.B.M.; Stein, A. A Generic Framework for Spatial Prediction of Soil Variables Based on Regression-Kriging. Geoderma 2004, 120, 75–93. [Google Scholar] [CrossRef]
- Breiman, L. Stacked Regressions. Mach. Learn. 1996, 24, 49–64. [Google Scholar] [CrossRef]
- Sill, J.; Takács, G.; Mackey, L.; Lin, D. Feature-Weighted Linear Stacking. arXiv 2009, arXiv:0911.0460. [Google Scholar]
- Mills, E.S. Urban Economics; Scott, Foresman: Glenview, IL, USA, 1972. [Google Scholar]
- Openshaw, S. The Modifiable Areal Unit Problem; Geo Books: Norwich, UK, 1983. [Google Scholar]
- World Bank. Land is Perspective: Its Role in the Structure of Cities; World Bank: Washington, DC, USA, 1980; Available online: https://documents1.worldbank.org/curated/en/588491468913783287/pdf/Land-is-perspective-its-role-in-the-structure-of-cities.pdf (accessed on 24 March 2025).
- Glaeser, E.L.; Gyourko, J.; Saks, R.E. Why Is Manhattan So Expensive? Regulation and the Rise in Housing Prices. J. Law Econ. 2005, 48, 331–369. [Google Scholar] [CrossRef]
- Bertaud, A.; Renaud, B. Socialist Cities without Land Markets. J. Urban Econ. 1997, 41, 137–151. [Google Scholar] [CrossRef]
- Bertaud, A. Government Intervention and Urban Land Markets: The Case of China. J. Archit. Plan. Res. 2012, 29, 335–346. [Google Scholar]
- Koga, Y.; Nakamura, H.; Matsuura, K. Daylighting Codes, Standards and Policies Mainly in Japan. In Proceedings of the Daylighting ’98, Ottawa, ON, Canada, 13–15 May 1998. [Google Scholar]
- Sunikka-Blank, M.; Kiyono, Y. Why do you need more towers? Four approaches to sustainable urban regeneration in Japan. arq Environ. Des. 2021, 25, 372–383. [Google Scholar] [CrossRef]
- Sorensen, A.; Okata, J.; Fujii, S. Urban Renaissance as Intensification: Building Regulation and the Rescaling of Place Governance in Tokyo’s High-rise Manshon Boom. Urban Stud. 2010, 47, 556–583. [Google Scholar] [CrossRef]
- Council for Promotion of Regulatory Reform, Cabinet Office, Government of Japan. First Report by the Council for Promotion of Regulatory Reform—Opening the Door to Tomorrow 23 May 2017. Available online: https://www8.cao.go.jp/kisei-kaikaku/english/pdf/170523/item1.pdf (accessed on 24 March 2025).


| Group | Variable | Description | Source |
|---|---|---|---|
| Facility density | Parks | Number of various facilities within 5 km | AMAP open platform |
| Clinics | |||
| Schools | |||
| Banks | |||
| Groceries | |||
| Restaurants | |||
| Scenic Spots | |||
| Entertainment Venues | |||
| Facility distance | Malls | The nearest distance to each type of facility | |
| Hospitals | |||
| Universities | |||
| Museums | |||
| Metro Stations | |||
| Train Stations | |||
| CBD | |||
| District Center | |||
| Major Roads | |||
| Street accessibility | MHD1000 | MHD values within radii from 1000 m to 10,000 m and also in global analysis, reflecting the street network’s Closeness centrality | Baidu Map open platform |
| MHD2000 | |||
| MHD3000 | |||
| MHD4000 | |||
| MHD5000 | |||
| MHD6000 | |||
| MHD7000 | |||
| MHD8000 | |||
| MHD9000 | |||
| MHD10000 | |||
| MHDn | |||
| BtH1000 | BtH values within radii from 1000 m to 10,000 m and also in global analysis, reflecting the street network’s Betweenness centrality | ||
| BtH2000 | |||
| BtH3000 | |||
| BtH4000 | |||
| BtH5000 | |||
| BtH6000 | |||
| BtH7000 | |||
| BtH8000 | |||
| BtH9000 | |||
| BtH10000 | |||
| BtHn | |||
| Non-spatial factors | Year | Year of the land parcel transaction | shtdsc.com |
| Type_R | Residential land or not | ||
| Type_B | Commercial land or not | ||
| Type_I | Industrial land or not | ||
| Point_X | Longitude of the land parcel | ||
| Point_Y | Latitude of the land parcel | ||
| House Price | Average surrounding housing price | HomeLink | |
| GDP | GDP of the district | Shanghai Government | |
| GDPpc | Per capita GDP of the district | ||
| DEM | Elevation (DEM) of the location | Geospatial Data Cloud | |
| Slope | Slope of the location |
| District | Raster Population | Census Population | Deviation Ratio |
|---|---|---|---|
| Jiading | 2,195,164 | 1,834,258 | 0.836 |
| Fengxian | 1,517,773 | 1,140,872 | 0.752 |
| Baoshan | 3,023,463 | 2,235,218 | 0.739 |
| Xuhui | 1,418,731 | 1,113,075 | 0.785 |
| Putuo | 1,634,082 | 1,239,800 | 0.759 |
| Yangpu | 1,696,927 | 1,242,548 | 0.732 |
| Songjiang | 2,318,162 | 1,909,713 | 0.824 |
| Pudong | 6,985,321 | 5,681,512 | 0.813 |
| Hongkou | 1,073,232 | 757,498 | 0.706 |
| Jinshan | 1,037,991 | 822,776 | 0.793 |
| Changning | 1,011,985 | 693,051 | 0.685 |
| Minhang | 3,333,866 | 2,653,489 | 0.796 |
| Qingpu | 1,500,528 | 1,271,424 | 0.847 |
| Jing’an | 1,550,025 | 975,707 | 0.629 |
| Huangpu | 953,322.9 | 662,030 | 0.694 |
| Total | 31,250,572 | 24,232,971 | 0.775 |
| Rank | LightGBM | ElasticNet | GWR |
|---|---|---|---|
| 1 | Schools | Type_R | BtH9000 |
| 2 | Hospitals | Type_B | Type_R |
| 3 | Year | Type_I | Type_B |
| 4 | MHD3000 | House Price | BtH10000 |
| 5 | BtHn | Year | Type_I |
| 6 | Metro Stations | Museums | BtH3000 |
| 7 | Museums | Parks | BtH7000 |
| 8 | Universities | GDP | BtH4000 |
| 9 | MHD1000 | Banks | BtH1000 |
| 10 | POINT_Y | District Center | BtH8000 |
| Model | MAE | MAPE | RMSE | R2 | Adjusted R2 |
|---|---|---|---|---|---|
| ElasticNet | 0.605 | 6.604 | 0.739 | 0.763 | 0.753 |
| LightGBM | 0.531 | 5.776 | 0.699 | 0.787 | 0.734 |
| GWR | 0.588 | 18.916 | 0.740 | 0.761 | 0.701 |
| ElasticNet + LightGBM | 0.532 | 5.791 | 0.699 | 0.789 | 0.788 |
| Composite Model | 0.536 | 5.824 | 0.688 | 0.795 | 0.795 |
Disclaimer/Publisher’s Note: The statements, opinions and data contained in all publications are solely those of the individual author(s) and contributor(s) and not of MDPI and/or the editor(s). MDPI and/or the editor(s) disclaim responsibility for any injury to people or property resulting from any ideas, methods, instructions or products referred to in the content. |
© 2025 by the authors. Licensee MDPI, Basel, Switzerland. This article is an open access article distributed under the terms and conditions of the Creative Commons Attribution (CC BY) license (https://creativecommons.org/licenses/by/4.0/).
Share and Cite
Wu, P.; Zhai, M.; Zhang, L. A Study on Imbalances in Urban Internal Spatial Capacity Allocation Based on High-Precision Population and Land Value Distribution Data. Smart Cities 2025, 8, 110. https://doi.org/10.3390/smartcities8040110
Wu P, Zhai M, Zhang L. A Study on Imbalances in Urban Internal Spatial Capacity Allocation Based on High-Precision Population and Land Value Distribution Data. Smart Cities. 2025; 8(4):110. https://doi.org/10.3390/smartcities8040110
Chicago/Turabian StyleWu, Peiru, Maojun Zhai, and Lingzhu Zhang. 2025. "A Study on Imbalances in Urban Internal Spatial Capacity Allocation Based on High-Precision Population and Land Value Distribution Data" Smart Cities 8, no. 4: 110. https://doi.org/10.3390/smartcities8040110
APA StyleWu, P., Zhai, M., & Zhang, L. (2025). A Study on Imbalances in Urban Internal Spatial Capacity Allocation Based on High-Precision Population and Land Value Distribution Data. Smart Cities, 8(4), 110. https://doi.org/10.3390/smartcities8040110